Article

High-Throughput Transcriptomics Identifies Chemoresistance-Associated Gene Expression Signatures in Human Angiosarcoma

1
Cancer Discovery Hub, National Cancer Centre Singapore, 30 Hospital Blvd, Singapore 168583, Singapore
2
Raffles Institution, 1 Raffles Institution Ln, Singapore 575954, Singapore
3
Duke-NUS Medical School, 8 College Rd, Singapore 169857, Singapore
4
Division of Medical Oncology, National Cancer Centre Singapore, 30 Hospital Blvd, Singapore 168583, Singapore
*
Author to whom correspondence should be addressed.
Int. J. Mol. Sci. 2024, 25(19), 10863; https://doi.org/10.3390/ijms251910863
Submission received: 16 September 2024 / Revised: 3 October 2024 / Accepted: 5 October 2024 / Published: 9 October 2024

Abstract

:
Angiosarcomas, clinically aggressive cancers of endothelial origin, are a rare subtype of soft-tissue sarcomas characterized by resistance to chemotherapy and dismal prognosis. In this study, we aim to identify the transcriptomic biomarkers of chemoresistance in angiosarcoma. We examined 72 cases of Asian angiosarcomas, including 35 cases treated with palliative chemotherapy, integrating information from NanoString gene expression profiling, whole transcriptome profiling (RNA-seq), immunohistochemistry, cell line assays, and clinicopathological data. In the chemoresistant cohort (defined as stable disease or progression), we observed the significant overexpression of genes, including SPP1 (log2foldchange 3.49, adj. p = 0.0112), CXCL13, CD48, and CLEC5A, accompanied by the significant enrichment of myeloid compartment and cytokine and chemokine signaling pathways, as well as neutrophils and macrophages. RNA-seq data revealed higher SPP1 expression (p = 0.0008) in tumor tissues over adjacent normal compartments. Immunohistochemistry showed a significant moderate positive correlation between SPP1 protein and gene expression (r = 0.7016; p < 0.00110), while higher SPP1 protein expression correlated with lower chemotherapeutic sensitivity in patient-derived angiosarcoma cell lines MOLAS and ISOHAS. In addition, SPP1 mRNA overexpression positively correlated with epithelioid histology (p = 0.007), higher tumor grade (p = 0.0023), non-head and neck location (p = 0.0576), and poorer overall survival outcomes (HR 1.84, 95% CI 1.07–3.18, p = 0.0288). There was no association with tumor mutational burden, tumor inflammation signature, the presence of human herpesvirus-7, ultraviolet exposure signature, and metastatic state at diagnosis. In conclusion, SPP1 overexpression may be a biomarker of chemoresistance and poor prognosis in angiosarcoma. Further investigation is needed to uncover the precise roles and underlying mechanisms of SPP1.

1. Introduction

Angiosarcoma (AS), a clinically aggressive cancer of endothelial origin, is a rare subtype of soft-tissue sarcoma with dismal prognosis [1,2]. AS tumors exhibit significant clinical and genetic heterogeneity and can originate in various anatomical sites, most commonly in the head and neck, breasts, and extremities [3]. The treatment of AS is notoriously challenging, with low survival rates despite multimodal approaches combining radical surgical resection with radiotherapy and chemotherapy [2,4]. In particular, antineoplastic agents, such as paclitaxel and doxorubicin, are often hindered by primary resistance or produce only transient responses, followed by the rapid emergence of acquired drug resistance [5]. Excluding clinical factors such as patient age, disease stage, and histopathological characteristics [6,7,8], there remains a lack of reliable biomarkers to predict survival outcomes and chemotherapy responsiveness, which would significantly enhance patient selection for targeted treatment.
At the molecular level, gene expression profiling has revealed three distinct AS clusters represented by the lack or enrichment of immune-related signaling and immune cells, as well as varying tumor mutation burden and tumor inflammation signature scores [9]. In addition, spatial transcriptomics has revealed topological profiles of the tumor microenvironment [9], while extensive genomic profiling has uncovered multiple actionable mutations, underscoring the promise of precision medicine in AS treatment [10]. However, while multi-omic analyses and immune profiling studies have revealed the genomic and topological immune landscapes of angiosarcoma, the molecular mechanism of chemoresistance in AS has yet to be elucidated.
Secreted phosphoprotein 1 (SPP1), also known as osteopontin (OPN), is a small integrin-binding ligand, N-linked glycoprotein (SIBLING) located at 4q22.1. This highly acidic secreted phosphoprotein has a diverse range of functions [11], including bone regeneration [12], angiogenesis [13], cell adhesion and migration [14], and inflammation [15]. Emerging evidence has shown that the high SPP1 expression is associated with poor prognosis in multiple cancer types [16]. Many studies have described the overexpression of SPP1 in multiple cancers such as breast carcinoma [17], hepatocellular carcinoma [18], penile cancer [19], ovarian carcinoma [20], and lung adenocarcinoma [21], as well as the key roles of SPP1 in invasion, metastasis, chemoresistance, and immune suppression [22,23]. In lung adenocarcinoma, the upregulation of PD-L1 by SPP1 has been shown to mediate macrophage polarization, facilitate immune escape [24], and act as an immune checkpoint that induces host tumor immune tolerance by suppressing T cell activation [25]. However, the role of SPP1 in AS remains unclear. Hence, transcriptome analysis may elucidate molecular mechanisms underlying chemoresistance, as well as the role of SPP1 in angiosarcoma, aiding in the identification of novel biomarkers for targeted therapies for angiosarcoma.
In this study, we examined SPP1 expression in angiosarcoma and its role in chemoresistance using NanoString gene expression data, immunohistochemistry, and in vitro testing. Additionally, we seek to investigate potential correlations among SPP1 expression, clinicopathological features, immuno-oncologic pathways, and patient survival outcomes.

2. Results

2.1. Patient Cohort

Our study included a total of 72 patients, consisting of 47 men (65.3%) and 25 women (34.7%), with a median age of 65.7 years (range, 27.8–92.9 years). The majority of these patients were of Chinese ethnicity (80.6%). The majority of cases (n = 42, 58.3%) were diagnosed as primary angiosarcoma originating from the head and neck. Additionally, 51 cases (70.8%) exhibited signatures of UV DNA damage, and 25 cases (34.7%) tested positive for human herpesvirus-7. At the time of diagnosis, 22 cases (31.0%) were identified as metastatic. A summary of patient characteristics can be found in Table 1.

2.2. NanoString Gene Expression Profiling

The top four genes that were significantly overexpressed in non-responders to palliative chemotherapy were SPP1 (log2foldchange 3.49, adj. p = 0.0112), CXCL13 (log2foldchange 2.57, adj. p = 0.0112), CD48 (log2foldchange 2.97, adj. p = 0.0166), and CLEC5A (log2foldchange 2.55, adj. p = 0.0247). Conversely, TAF3 was significantly overexpressed (adj. p < 0.05) in chemosensitive tumors (Figure 1A and Supplementary Table S1). To survey the transcriptomic landscape further on a global level, we evaluated available whole transcriptome RNA-seq data of a subset of samples in tumor (n = 12) and matched normal tissue (n = 6) from our previous study [2]. The expression of the top candidate biomarker, SPP1, was significantly higher in tumor tissue compared to matched normal tissue (p = 0.0008) (Figure 1B) in keeping with NanoString gene expression analysis.
A pathway analysis indicated the upregulation of the myeloid compartment (p = 0.007), cytokine and chemokine signaling (p = 0.017), and metastasis/matrix remodeling pathways in chemoresistant tumors. Conversely, Hedgehog, Notch, and Wnt signaling pathways were upregulated in chemosensitive tumors (Figure 1C). A cell-type analysis suggested that myeloid cells, including neutrophils (p = 0.015) and macrophages (p = 0.039), along with NK cells (p = 0.149), were enriched in chemoresistant tumors (Figure 1D), whereas a greater population of mast cells, dendritic cells (DC), and regulatory T cells (Treg) were observed in chemosensitive tumors (Figure 1D). Figure 2 illustrates selected pathways and cell types.
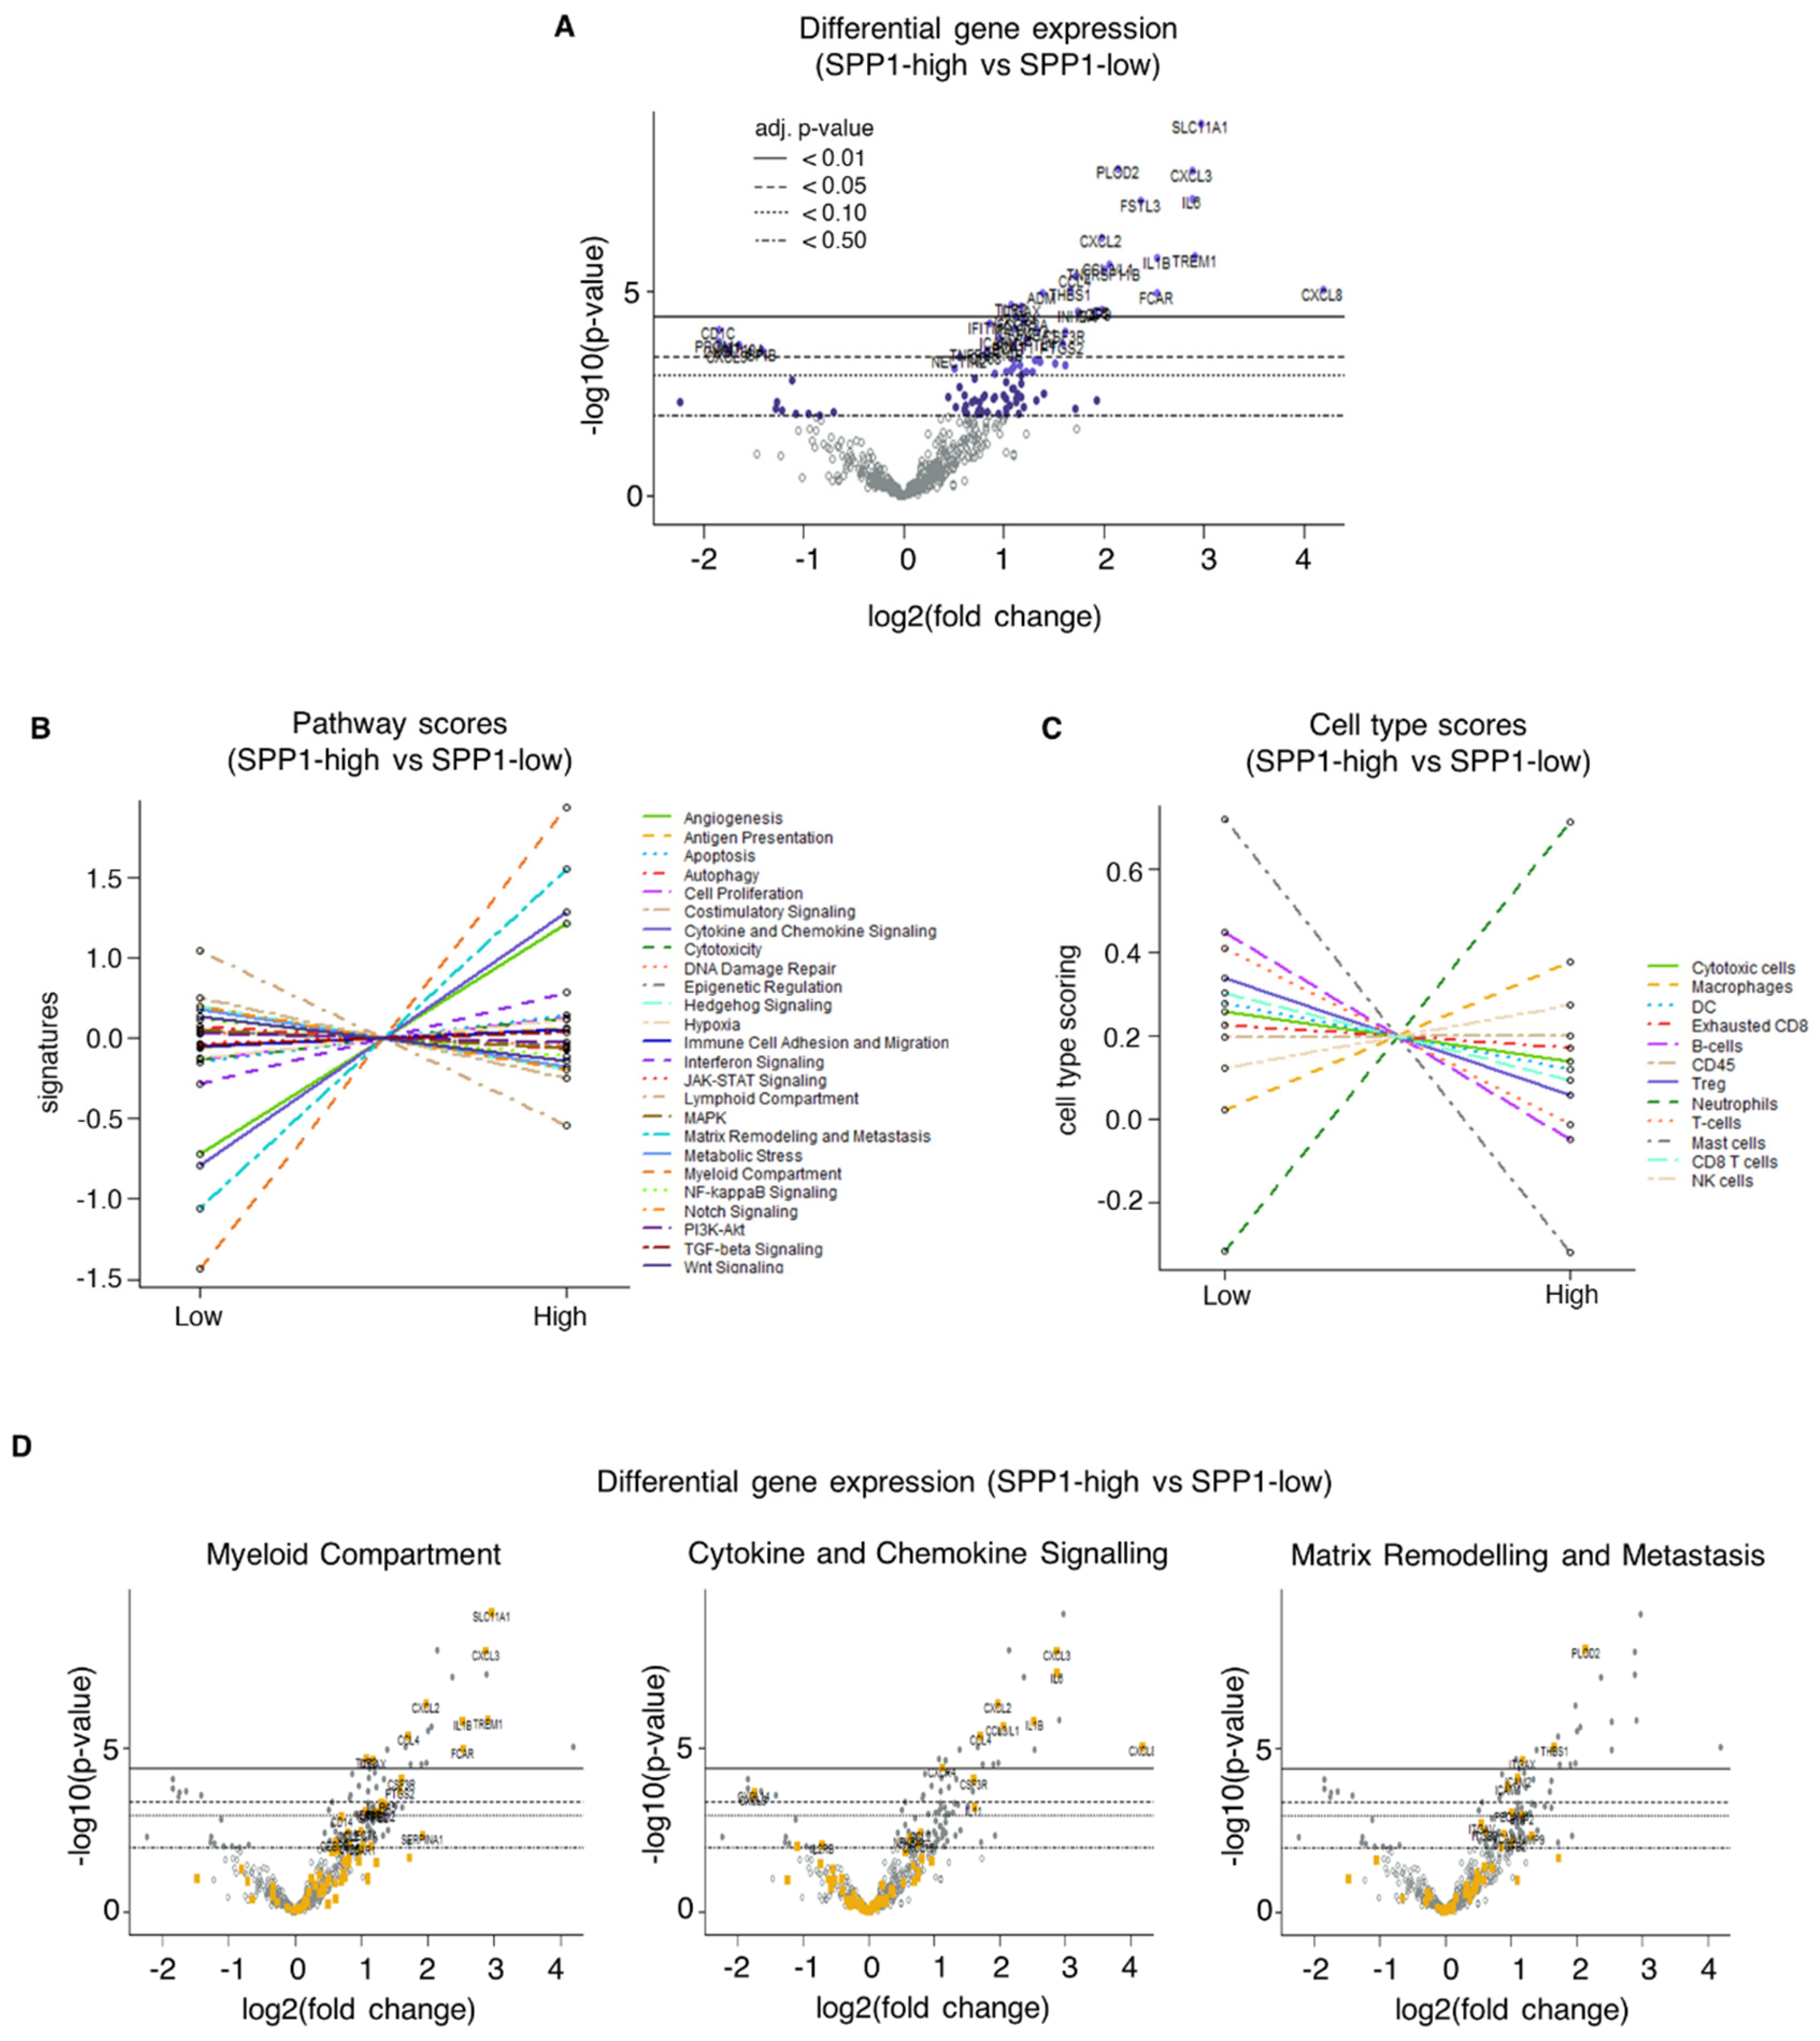
Upon further evaluation of all 72 samples, we observed differentially expressed genes between SPP1-high and SPP1-low tumors (n = 41 for p < 0.05, n = 23 for p < 0.01) (p-values adjusted for false discovery rate following Benjamini–Yekutieli procedure). Genes that were significantly overexpressed (p < 0.001) included SLC11A1, PLOD2, CXCL3, IL6, FSTL3, CXCL2, TREM1, and IL1β (Figure 3A and Supplementary Table S2). A gene-specific analysis (GSA) revealed the significant overexpression (p < 0.001) of myeloid compartment pathway genes (SLC11A1, CXCL3, CXCL2, TREM1, IL1β), cytokine and chemokine signaling pathway genes (CXCL3, IL6, CXCL2, IL1β), and matrix remodeling and metastasis pathway genes (PLOD2). A cell-type analysis of SPP1-high tumors was suggestive of the enrichment of neutrophils, macrophages, and NK cells, similar to that in chemoresistant tumors (Figure 3B–D).

2.2.1. Association of SPP1 mRNA Expression with Clinical Parameters

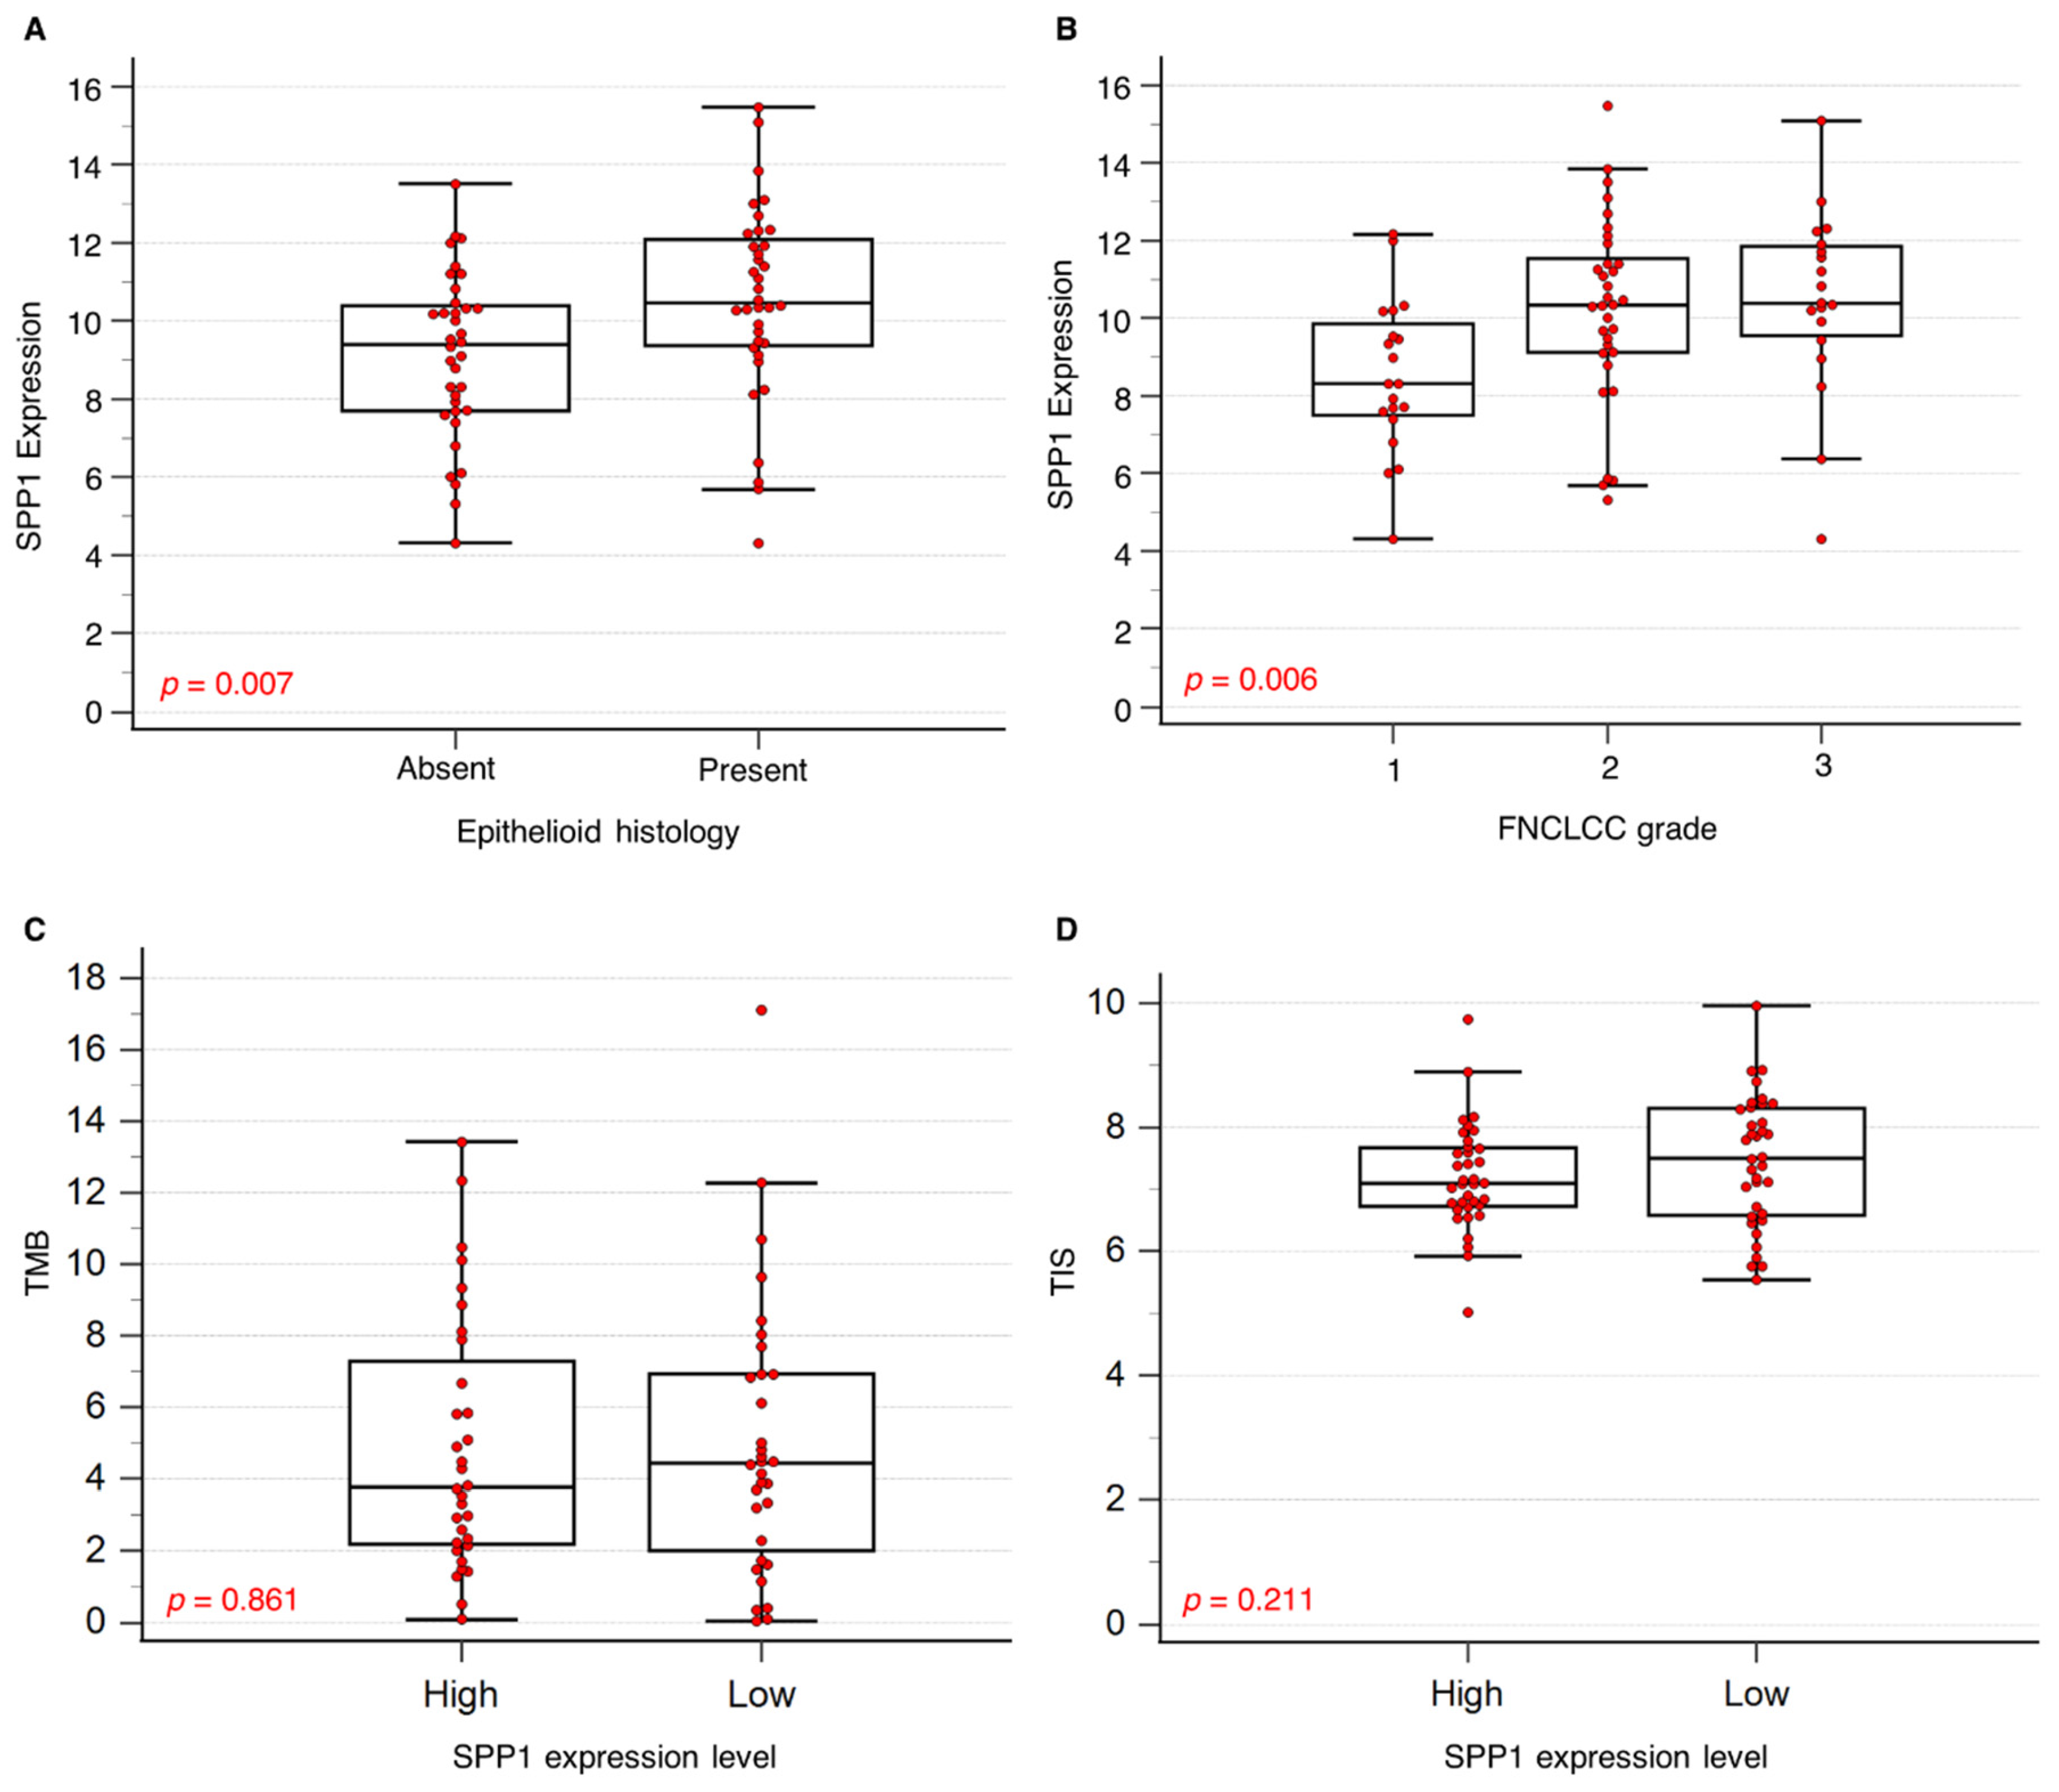
SPP1 mRNA overexpression emerged as a significant candidate biomarker of chemoresistance and was positively correlated to the presence of epithelioid features (p = 0.007) and high FNCLCC histological tumor grade (p = 0.006) (Figure 4A,B). Dichotomizing into high or low scores using the median SPP1 expression value of 10.23, high SPP1 expression was correlated with non-head and neck location (p = 0.0576), but no significant association was found with TMB, TIS scores, the presence of human herpesvirus-7, ultraviolet exposure signature, or metastatic state at diagnosis (Figure 4C,D) (Table 1).

2.2.2. Spatial Analysis of Breast and Scalp Angiosarcoma

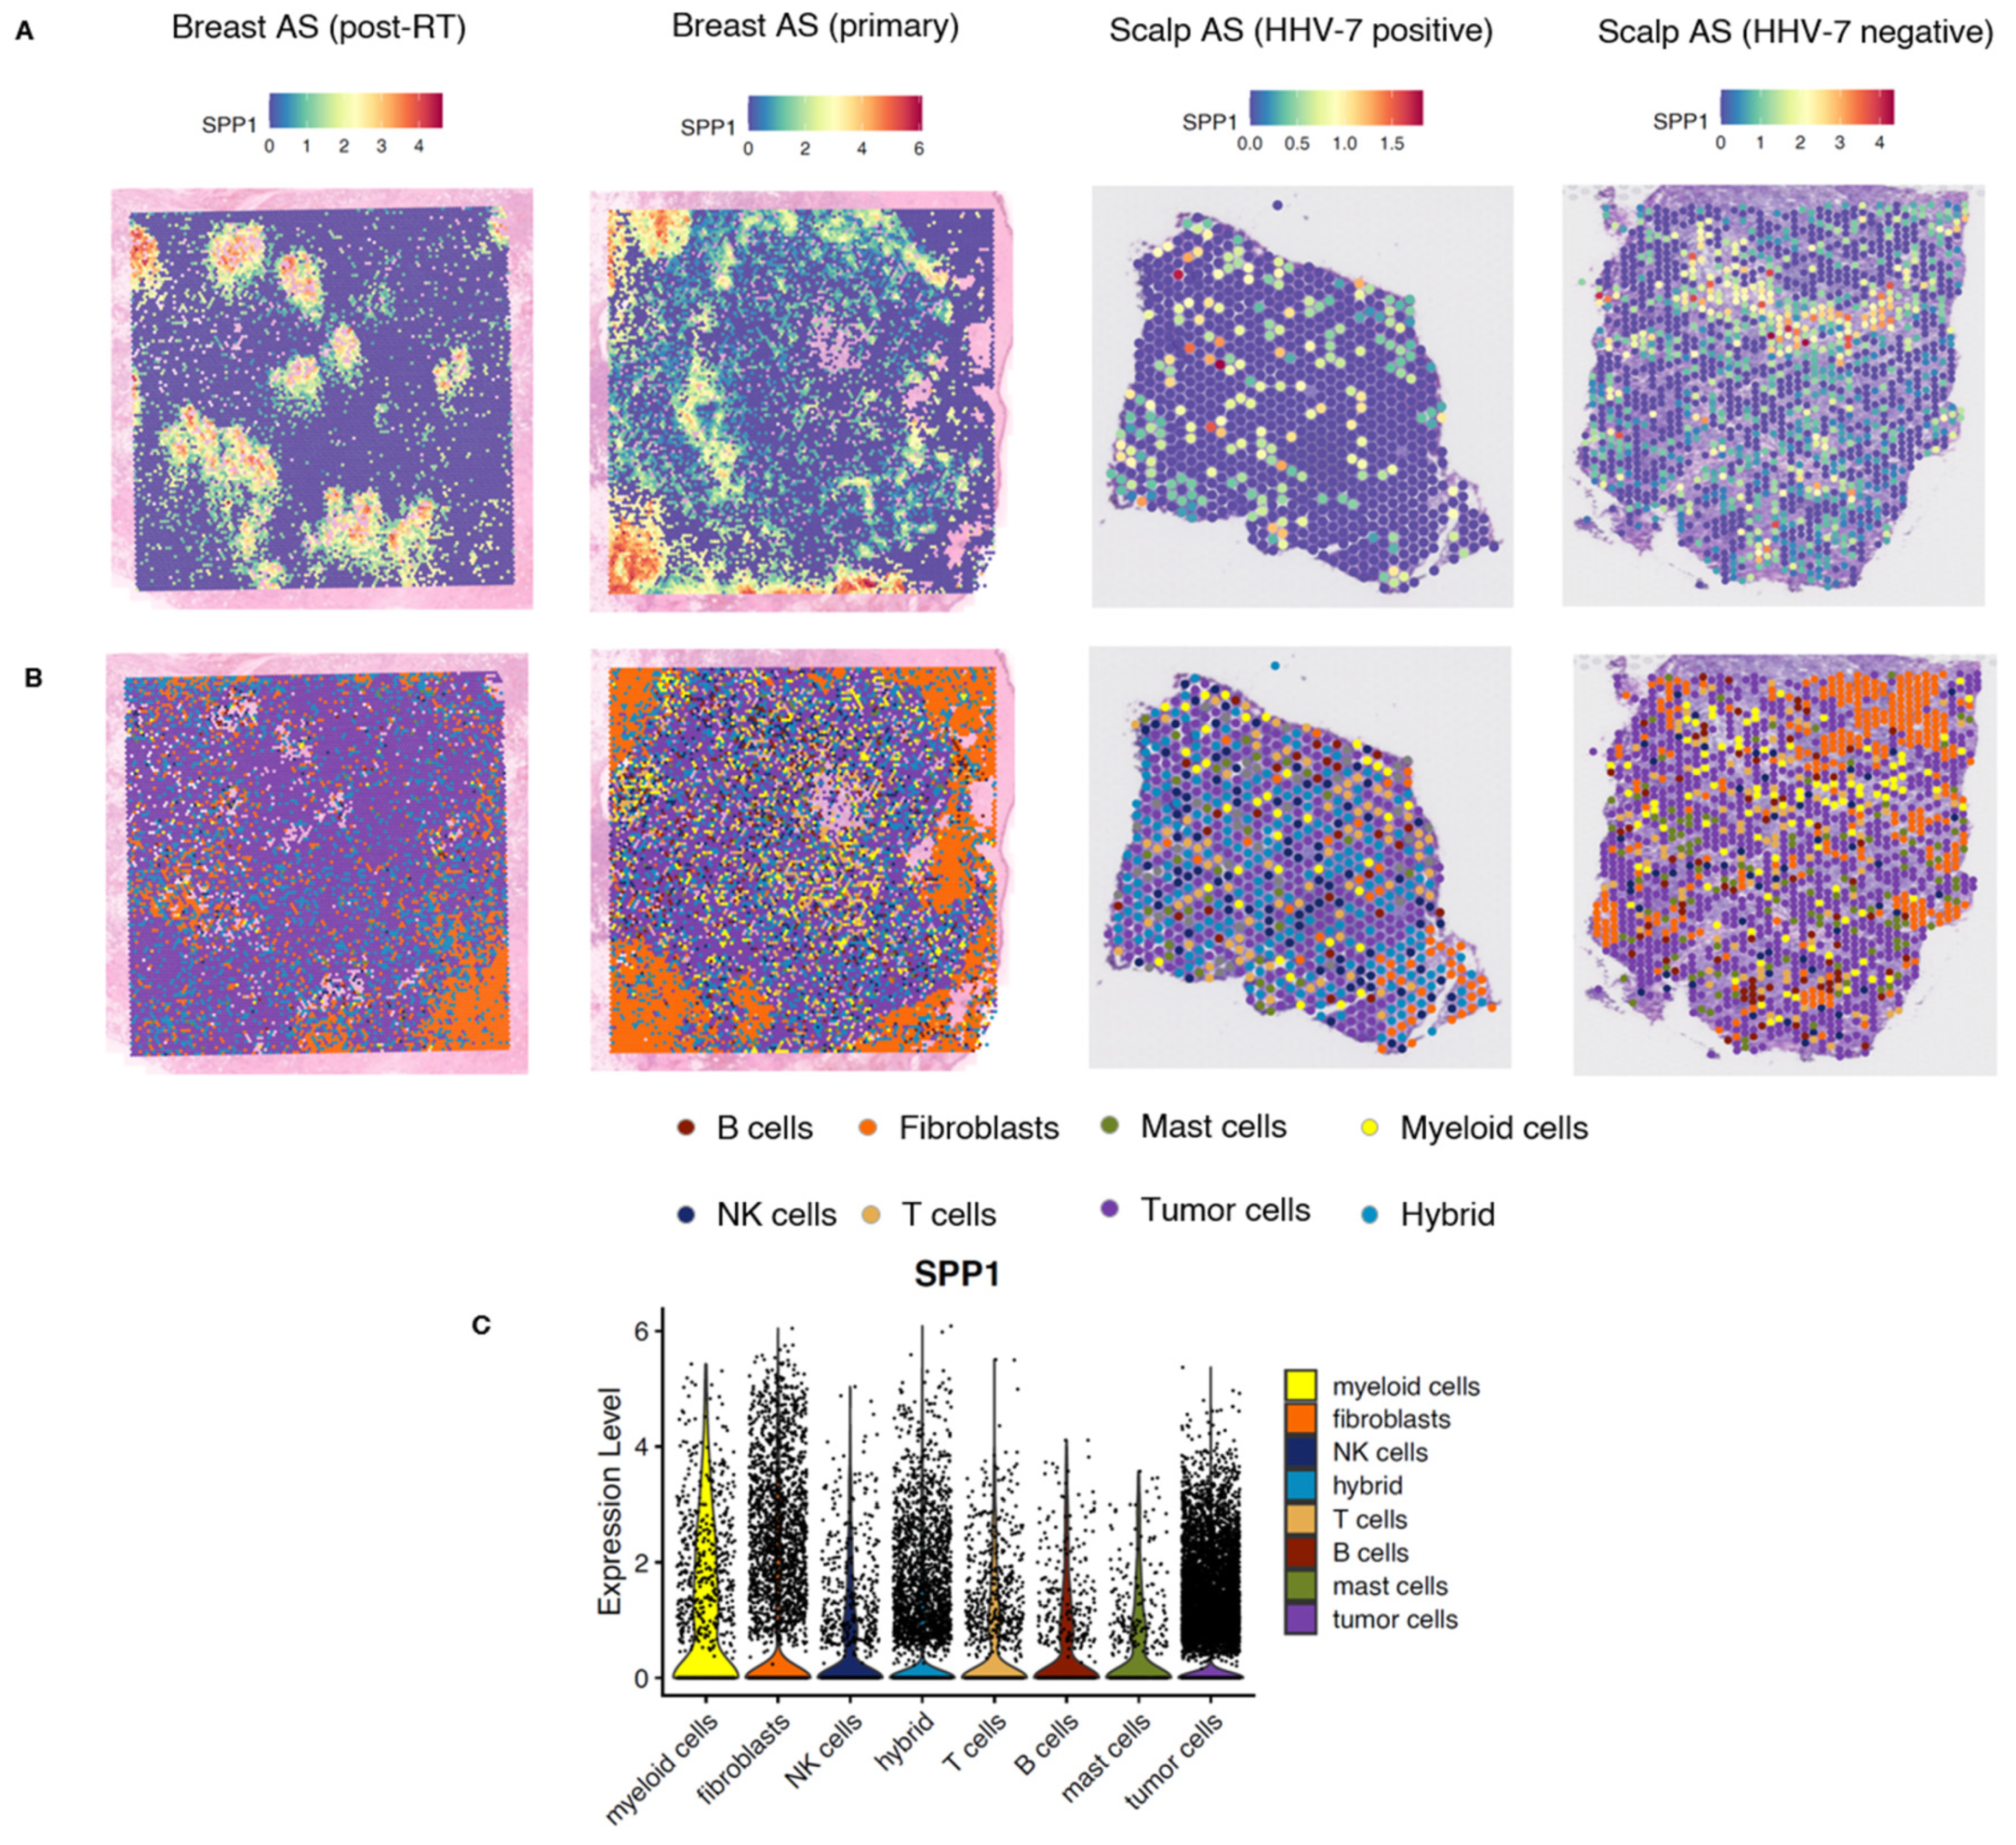
Subsequently, we used 10× Genomics Visium spatial transcriptomics to analyze four samples (two angiosarcomas of the breast and two of the head and neck). A total of 28,988 55-micron spots were analyzed (primary breast AS, 13101; post-RT breast AS, 13600; HHV7-positive scalp AS, 748; HHV7-negative scalp AS, 1539). A spatial transcriptomics analysis showed that SPP1 expression displayed significant heterogeneity in terms of spatial distribution in all samples, with focal clusters of cells expressing higher levels of SPP1 scattered throughout the tumor tissues (Figure 5A). SPP1 expression was present across all cell types in angiosarcoma, including stromal, immune, and tumor cells, and in corroboration with NanoString immune profiling, was most enriched in myeloid cells (Figure 5).

2.2.3. Immunohistochemical Staining for SPP1 Protein Expression

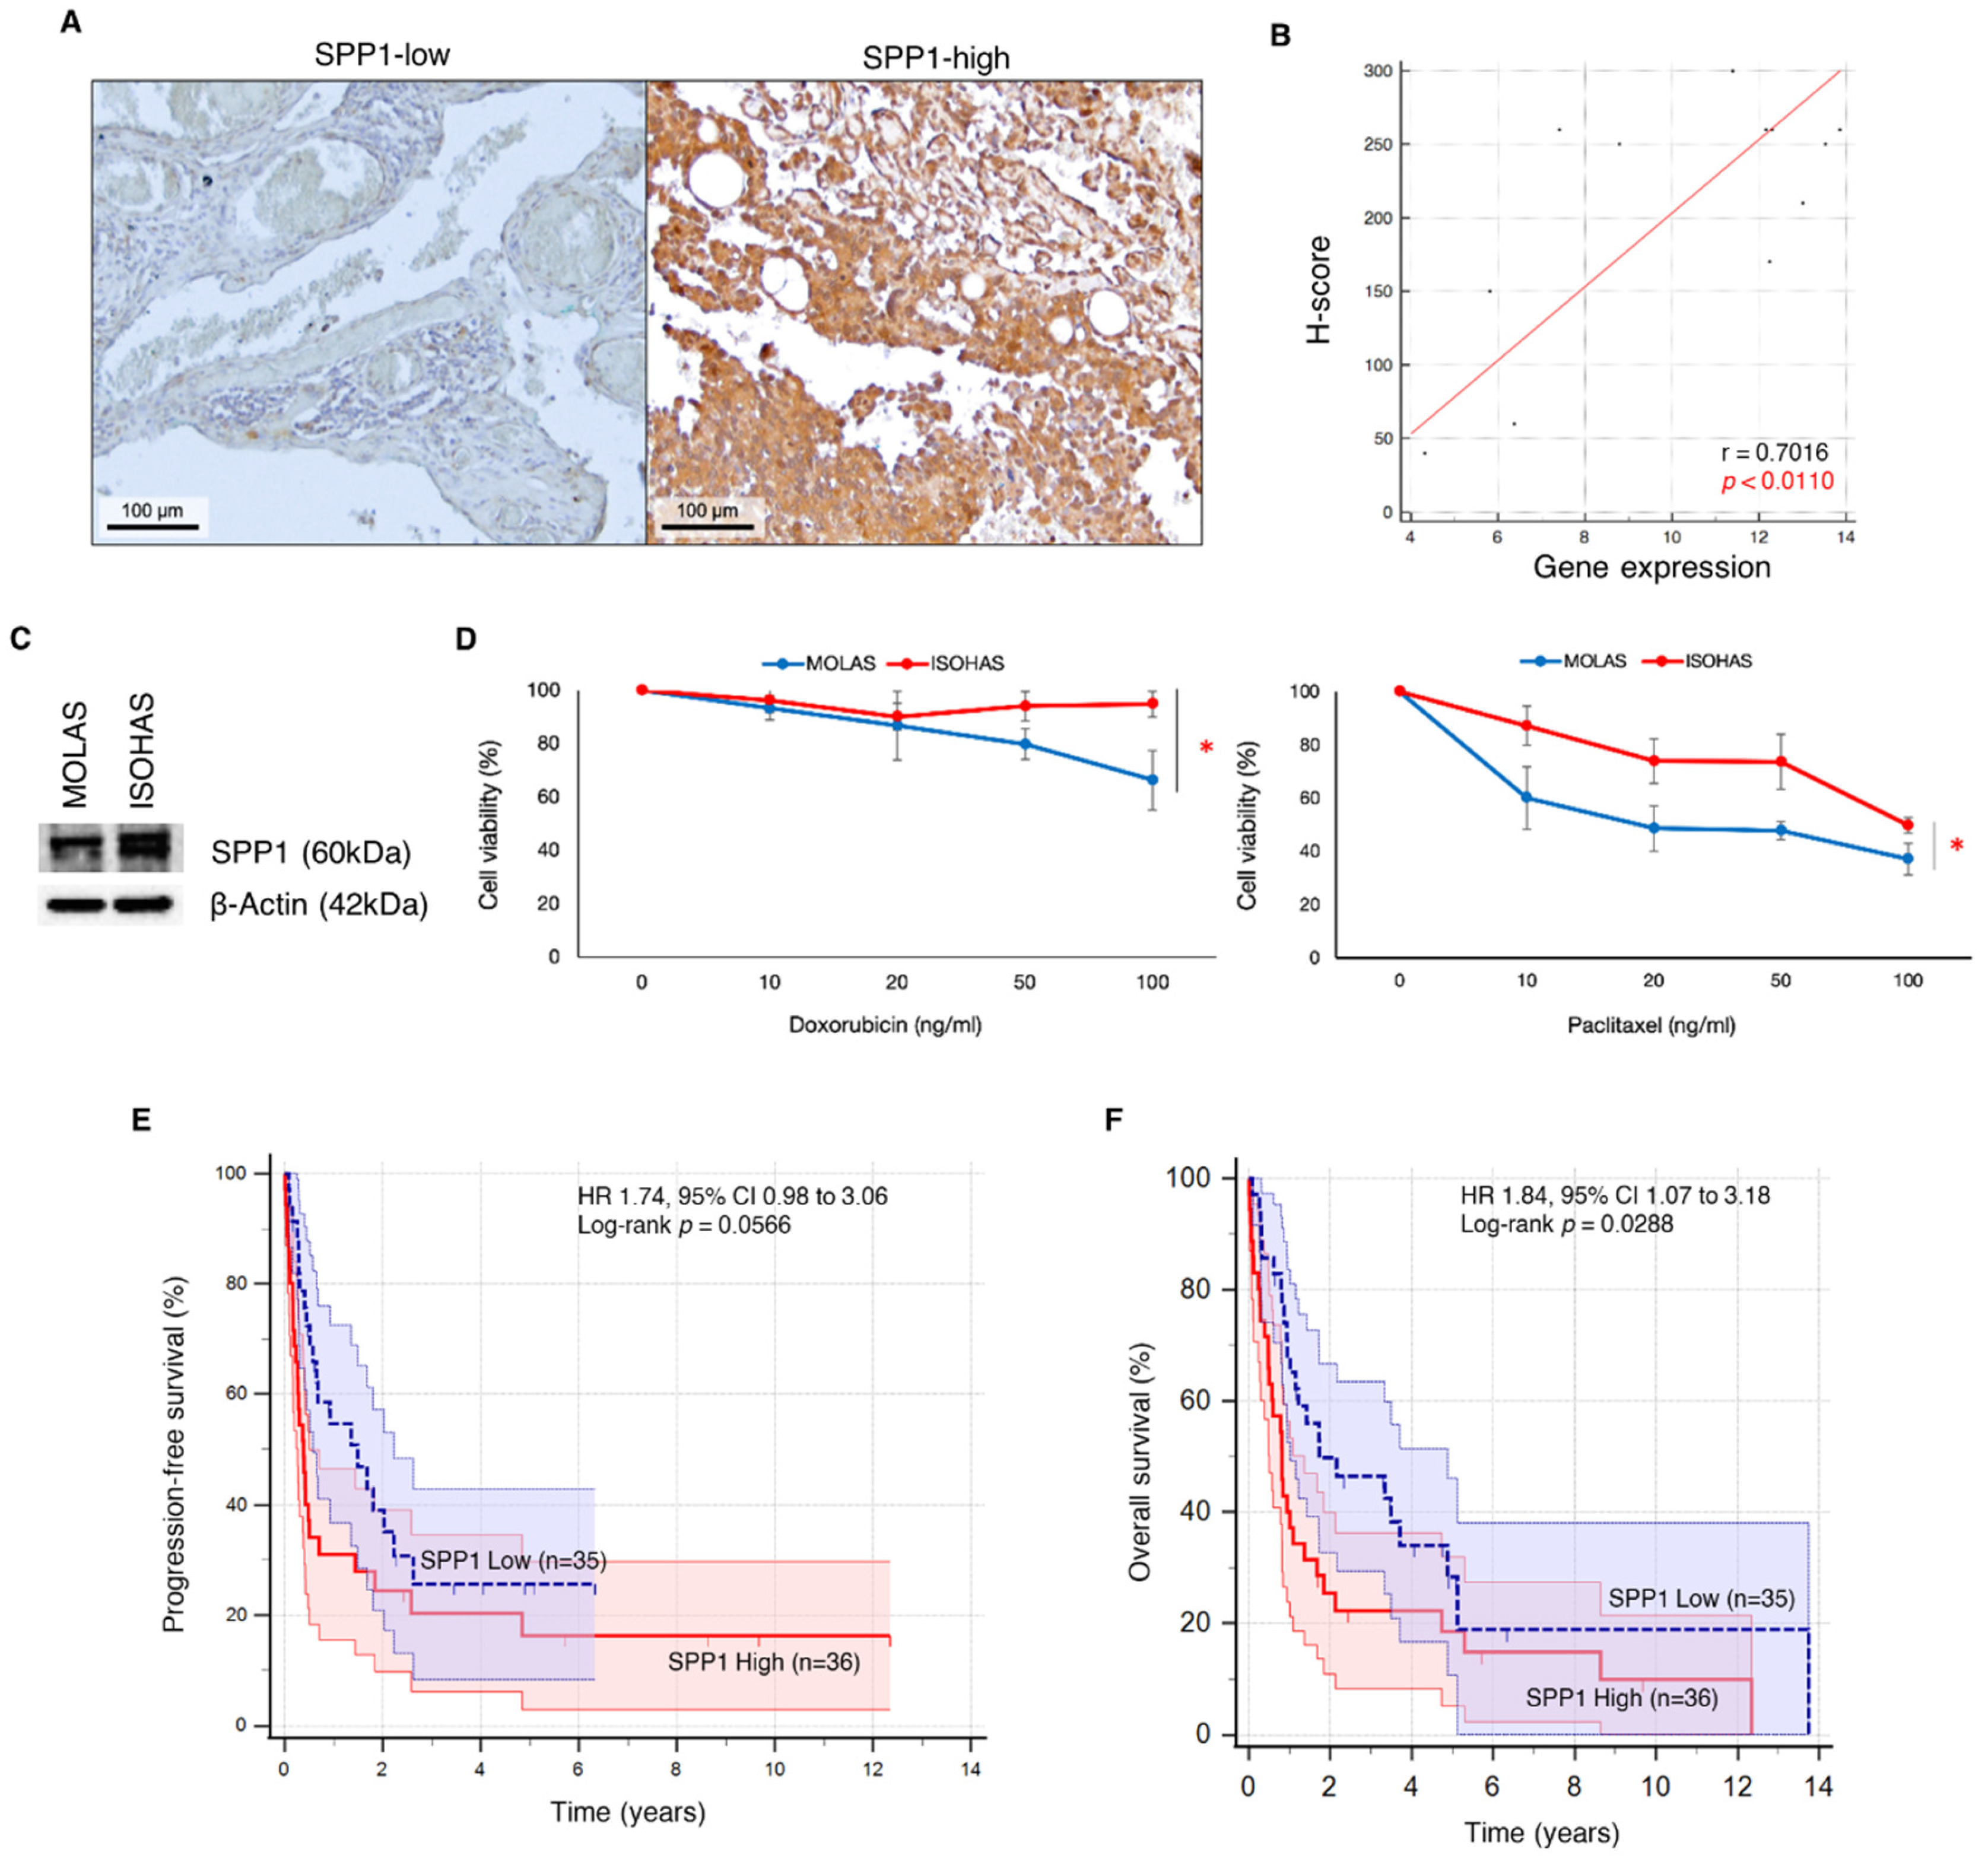
We examined SPP1 expression in the angiosarcoma tumor archival FFPE samples using immunohistochemistry (Figure 6A). A significant moderate positive correlation (r = 0.7016; p < 0.0110) was observed between SPP1 expression levels obtained via immunohistochemistry and NanoString gene profiling (Figure 6B).

2.2.4. In Vitro Response to Chemotherapeutic Drugs

Western blot analyses demonstrated higher protein expression of SPP1 in ISOHAS compared to MOLAS (Figure 6C). MOLAS and ISOHAS cell lines were exposed to increasing concentrations of paclitaxel and doxorubicin (10, 20, 50, and 100 ng/mL for 72 h). Both drugs resulted in a dose-dependent reduction in cell viability in the angiosarcoma cell lines, although ISOHAS displayed greater chemoresistance compared with MOLAS (Figure 6D).
In keeping with the abovementioned data, SPP1 gene expression was correlated with poorer overall survival (HR 1.84, 95% CI 1.07–3.18, p = 0.0288) and poorer progression-free survival (HR 1.74, 95% CI 0.98–3.06, p = 0.0566) (Figure 6E,F).

3. Discussion

This study demonstrated that SPP1 overexpression is significantly associated with chemoresistance and poorer survival outcomes in human angiosarcoma (AS). Next-generation molecular diagnostics have only recently begun to characterize the pathobiology of angiosarcoma, which is an otherwise enigmatic disease with an aggressive clinical phenotype [2]. Moreover, despite recent studies into combination therapies in the management of AS, response to first-line systemic therapy is poor because of the absence of predictive biomarkers and significant intra-tumor heterogeneity [26]. Thus far, apart from one study that has employed a morphological approach to identify a potential marker of chemoresistance in AS, that is CD31low cells, which relies on enhanced YAP signaling to improve redox status and is doxorubicin-resistant in AS [27], to our knowledge, this is the first study to identify the potential biomarkers of chemoresistance in AS via an omics approach.
NanoString gene expression profiling identified a gene expression signature associated with chemoresistance in AS. The most significantly upregulated gene in the gene expression signature was secreted phosphoprotein 1 (SPP1), which is well known to be involved in the regulation of many tumor-associated biological processes, including tumorigenesis, tumor progression, and the tumor immune microenvironment. SPP1 has been suggested as a potential target for evaluating prognosis and immunotherapy in multiple human cancers [28]. In ovarian tumor tissues, SPP1 overexpression was significantly associated with poor survival and indicated higher levels of immune cell infiltration [29]. In head and neck squamous cell carcinoma (HNSCC), SPP1+CCL18+ and SPP1+FOLR2+ tumor-associated macrophages (TAMs) harbored pro-angiogenic and metastatic transcriptional programs and were correlated with poor survival [30].
Moreover, SPP1 overexpression has also been associated with resistance to chemoradiotherapy in multiple cancers [31]. For example, in lung adenocarcinoma, SPP1 expression on TAMs has been found to correlate with poor prognosis and chemoresistance [32]. In ovarian cancer, the SPP1-CD44 axis facilitated cancer cell chemoresistance via PI3K/AKT signaling and ATP-binding cassette (ABC) drug efflux transporter activity [33]. Similarly, fibroblast-derived SPP1 was found to contribute to resistance of hepatocellular carcinoma to sorafenib and lenvatinib treatment [34], and in oral squamous cell carcinoma, the SPP1-integrin αvβ3 axis was found to be crucial for 5-fluorouracil resistance [35]. Most recently, Helicobacter pylori infection-induced SPP1 activation was found to promote chemoresistance and T cell inactivation in gastric cancer cells [36]. The role of SPP1 in cancer thus appears to vary according to cancer subtype, suggesting the need for further research tailored to specific cancer types to explore its clinical implications.
In our study, we showed a correlation between SPP1 overexpression and the upregulation of the myeloid compartment, cytokine and chemokine signaling, and metastasis/matrix remodeling pathways in chemoresistant tumors, which is in line with the cell-type analysis that suggested the enrichment of myeloid cells (neutrophils and macrophages), as well as NK cells. This finding aligns with our earlier study that demonstrated a positive correlation between the intra-tumoral neutrophil-to-lymphocyte ratio in angiosarcoma and oncogenic pathway scores, including angiogenesis, matrix remodeling, metastasis, and cytokine and chemokine signaling, along with myeloid compartment scores. These pathway scores were significantly higher in non-responders compared to responders to first-line chemotherapy [6].
Several genes in our analysis were differentially expressed between SPP1-high and SPP1-low AS tumors. A gene-specific analysis (GSA) characterized the top SPP1-mediated pathways in AS, including the myeloid compartment pathway with the significant overexpression of SLC11A1, CXCL3, CXCL2, TREM1, IL1β, and TLR2 genes, as well as the cytokine and chemokine signaling pathway, with significant overexpression of the CXCL3, IL6, CXCL2, IL1β genes. Notably, IL1β-induced IL6 and sIL6R have been found to trigger IL6 trans-signaling, contributing to the upregulation of SPP1 in THP-1 macrophages [37]. Similarly, in primary lung fibroblasts, the expression of SPP1 is potently upregulated by IL1β [38]. Overall, the overexpression of SPP1 in AS could potentially be mediated by IL1β-induced IL6 trans-signaling.
The limitations of our study include its retrospective approach and relatively small sample size. Additionally, tumor heterogeneity and potential sampling issues could influence the reliability of the findings, since this will affect gene expression signatures and immune profiles. Nevertheless, we have presented preliminary evidence supporting SPP1 as an indicator of chemoresistance in angiosarcoma and investigated its potential clinical significance. The contribution of SPP1 overexpression to chemotherapy resistance will need to be validated in a larger independent prospective study, and the exact mechanisms dissected through functional studies. In conclusion, this study illustrates SPP1 overexpression in AS and its potential role as both a predictive biomarker of chemoresistance and a prognostic biomarker in angiosarcoma.

4. Materials and Methods

4.1. Patient Cohort

Patients with histologically confirmed angiosarcoma treated at Singapore General Hospital (SGH) and National Cancer Centre Singapore (NCCS) between January 2000 and December 2020 were selected for inclusion in our study. Certified pathologists reviewed all cases, with diagnoses corroborated by immunohistochemical staining for vascular markers such as CD31 and/or ERG. Cases of Kaposi sarcoma, epithelioid haemangioendothelioma, and intimal sarcoma were excluded. The median follow-up duration for the entire cohort was 1.0 year. Patient age, sex, and ethnicity were verified against participants’ National Registration Identity Cards. All data were collected at diagnosis or during follow-up. Clinicopathologic characteristics of the patient cohort are provided in Table 1.

4.1.1. NanoString Gene Expression Profiling

The NanoString PanCancer IO360 panel (NanoString Technologies, Seattle, WA, USA) was used to perform gene expression profiling on formalin-fixed, paraffin-embedded (FFPE) tissue on the nCounter platform, following the manufacturer’s protocol. RNA extraction was conducted from five 10-µm sections of all samples containing sufficient tumor tissue, which were subsequently analyzed with the 2100 Bioanalyzer (Agilent Technologies, Palo Alto, CA, USA). From the final cohort, a subset of patients from the final cohort who were treated with palliative chemotherapy (n = 35), including paclitaxel (n = 28), liposomal doxorubicin (n = 2), doxorubicin plus ifosfamide (n = 2), doxorubicin (n = 1), ifosfamide (n = 1), and doxorubicin and cisplatin plus paclitaxel (n = 1), was analyzed on the nSolver 4.0 Advanced Analysis module using the default settings to derive differentially expressed genes, pathway scores, and cell-type scores associated with chemotherapy response to determine candidate biomarkers of chemoresistance (defined as stable disease or progression). The final cohort (n = 72) was subsequently reanalyzed to derive differentially expressed genes, pathway scores, and cell-type scores associated with the expression of the top candidate biomarker identified in the initial analysis.

4.1.2. Immunohistochemistry Staining

FFPE tissue samples were procured from the Department of Pathology, Singapore General Hospital. SPP1 staining was performed using an anti-osteopontin antibody [RM1018] (ab283656, Abcam, Cambridge, UK). The ImmPRESS Universal PLUS Polymer Kit (catalog #MP-7800; Vector Laboratories, Newark, CA, USA) was used to stain the slides according to the manufacturer’s protocol. FFPE sections underwent deparaffinization and rehydration using limonene and ethanol, and high-temperature-induced epitope retrieval was performed using a citrate-based buffer (pH 6.0) through 5 min of pressurized heating at 120 °C in a pressure cooker. The slides were incubated with BLOXALL blocking solution for 10 min to quench endogenous peroxidase and alkaline phosphatase activity, followed by treatment with 2.5% prediluted horse serum for 20 min. The slides were then incubated overnight at 4 °C with the anti-osteopontin antibody diluted to 1:200. Staining with substrate–chromogen mix was performed on the slides for 2 min, followed by counterstaining with Hematoxylin QS Counterstain (Vector Laboratories, CA, USA). SPP1 expression was quantified by two independent readers blinded to each other and the NanoString and clinical data. Histopathologic appearances were located through images taken at 10× objective (magnification of 100×), and a more detailed evaluation was conducted at 40× objective (magnification of 400×). A histochemical score (H-score) was assigned according to the staining intensity observed in representative sections, with scores ranging from 0% to 100%.

4.1.3. Western Blotting

Cells were harvested and washed with PBS. Lysis buffer was added to the cell pellet and stored at −20 °C overnight. Cell lysates were separated based on molecular weight using SDS-PAGE with 4–15% Mini-PROTEANTM TGX Stain-FreeTM Protein Gels (Bio-Rad Laboratories, Hercules, CA, USA). The blot was transferred onto 0.2 μm PVDF membranes (Bio-Rad Laboratories, Hercules, CA, USA) and blocked with 5% non-fat dry milk (Bio-Rad Laboratories, Hercules, CA, USA) in TBST solution (50 mM Tris/HCl pH 7.4, 150 mM NaCl, 0.1% Tween-20) for 1 h. Subsequently, the blot was left to roll at 4 °C overnight in anti-osteopontin antibody [RM1018] (ab283656, Abcam, Cambridge, UK) at 1:1000 dilution and β-Actin antibody (#4970S, Cell Signalling Technology, Danvers, MA, USA). The blot was incubated in secondary antibodies for 1 h and subsequently exposed to chemiluminescence detection using SuperSignal Substrate Western Blotting Kit (Thermo Fisher Scientific, Waltham, MA, USA). Images were taken using ChemiDocTM XRS+ System with image LabTM Software, version 5.0 (Bio-Rad Laboratories, Hercules, CA, USA).

4.1.4. Cell Lines and Cell Viability Assays

Two angiosarcoma cell lines (MOLAS and ISOHAS) were obtained from the Cell Resource Center for Biomedical Research, Institute of Development, Aging and Cancer, Tohoku University, Japan, courtesy of Dr. Mikio Masuzawa. MOLAS was established from a patient with scalp lymphangiosarcoma metastatic to the pleura, while ISOHAS was established from a patient with primary scalp hemangiosarcoma. Both cell lines were maintained in a DMEM medium supplemented with 10% FBS and 1% penicillin/streptomycin. These cells were grown in a humidified chamber with 5% CO2 at 37 °C. To examine the response to chemotherapeutic agents, MOLAS and ISOHAS cultures were exposed to paclitaxel and doxorubicin (Selleck Chemicals, Houston, TX, USA) at concentrations of 10, 20, 50, and 100 ng/mL for 72 h. The Quick Cell Proliferation Assay Kit II (ab65475, Abcam, Cambridge, UK) was used to quantify the overall cell viability after treatment with the respective agents. Cell cultures at approximately 70% confluence were used for all experimental drug treatments unless otherwise stated.

4.1.5. 10× Genomics Visium Platform

Formalin-fixed, paraffin-embedded (FFPE) tissue blocks of two breast angiosarcoma samples and two fresh frozen angiosarcoma samples of head and neck origin were examined for SPP1 expression pattern. The AS breast samples were processed on the Visium CytAssist (10× Genomics, CA, USA), as previously described, and datasets used in our previous analyses from prior publications were reanalyzed in the context of the current study [9,39].

4.1.6. Analysis of Spatial Sequencing Data

The 10× Genomics Visium platform was used for spatial transcriptomic profiling following previously established protocols [9]. Reads were demultiplexed and aligned to the hg38 reference genome using 10× Space Ranger v.1.3.1 (10× Genomics, CA, USA), employing default parameters for automatic alignment. Spatial data were loaded into count matrices using Seurat v4.0, retaining spots with less than 10% of transcripts mapping to mitochondrial genes for scaling and normalization of gene expression measurements via the sctransform method. Selected genes were utilized to annotate immune cells, including PECAM1 and ERG for tumor cells; FBLN1, FAP, and DES for fibroblasts; CD79A and CD79B for B-cells; CD8A and CD8B for CD8 T cells; KLRK1 and KLRD1 for NK cells; CD14 and CD68 for macrophages; CSF3R and FPR1 for neutrophils; CD209 and CCL13 for dendritic cells; and TPSAB1, MS4A2, CPA3, and HDC for mast cells.

4.1.7. Statistics

SPP1 expression levels were dichotomized into high and low categories using the median split method. The expression of SPP1 in primary tumor samples was compared with various clinicopathological data, including epithelioid histology, Fédération Nationale des Centres de Lutte Contre le Cancer (FNCLCC) grading, tumor mutational burden (TMB), tumor inflammatory signature (TIS) scores, and survival outcomes. Progression-free survival was determined to be the period elapsed from diagnosis to either disease progression or death from any cause. Overall survival was calculated from diagnosis to death or censored at the last follow-up date for surviving patients. Using Kaplan–Meier analysis and Cox proportional hazards models, survival analyses were conducted with censoring applied at the last follow-up date. Box-and-whisker plots were used to represent continuous data, and associations with categorical variables were analyzed using the Mann–Whitney U or Kruskal–Wallis tests, as applicable. All statistical analyses were performed using MedCalc (Windows version 19.0.4), with the statistical significance threshold set at two-tailed p < 0.05.

4.1.8. Study Approval

Written informed consent for the use of biospecimens and clinical data was obtained in compliance with the Declaration of Helsinki. Approval for this work was granted by the SingHealth Centralized Institution Review Board (CIRB2018/3182). All methods were carried out per the appropriate guidelines and regulations.

Supplementary Materials

The following supporting information can be downloaded at: https://www.mdpi.com/article/10.3390/ijms251910863/s1.

Author Contributions

G.M.S.K. and J.Y.C. analyzed the data and drafted the manuscript.; G.M.S.K., T.R.E.T., E.C.Y.L., B.Y.L., B.K., J.Y.L., Z.G., S.H., T.K.K. and J.Y.C. provided technical expertise and performed various experiments.; J.Y.C. provided patient samples and clinical data.; G.M.S.K. and J.Y.C. conceived this study, interpreted the results, and revised the manuscript. All authors have read and agreed to the published version of the manuscript.

Funding

This work was supported by the Singapore Ministry of Health’s National Medical Research Council under its Transition Award (TA21jun-0005), RTF Seed Fund (SEEDFD21jun-0002), and TETRAD II Collaborative Centre Grant (CG21APR2002), as well as the SingHealth Duke-NUS AM/ACP-Designated Philanthropic Fund Grant Award (08/FY2023/EX/27-A65).

Institutional Review Board Statement

All samples were obtained following written informed consent in accordance with the Declaration of Helsinki. Participants and/or their legal guardians provided informed consent for their data to be used in this research. This study has been approved by the SingHealth Centralised Institutional Review Board (2010/426/B).

Informed Consent Statement

Informed consent was obtained from all subjects involved in the study.

Data Availability Statement

The NanoString gene expression profiling data used in the current study are available in GEO under accession no. GSE226338 and GSE227469.

Acknowledgments

We would like to thank all subjects who have participated in this study.

Conflicts of Interest

The authors declare no competing interests.

References

  1. Young, R.J.; Brown, N.J.; Reed, M.W.; Hughes, D.; Woll, P.J. Angiosarcoma. Lancet Oncol. 2010, 11, 983–991. [Google Scholar] [CrossRef] [PubMed]
  2. Chan, J.Y.; Lim, J.Q.; Yeong, J.; Ravi, V.; Guan, P.; Boot, A.; Tay, T.K.Y.; Selvarajan, S.; Nasir, N.D.M.; Loh, J.H.; et al. Multiomic analysis and immunoprofiling reveal distinct subtypes of human angiosarcoma. J. Clin. Investig. 2020, 130, 5833–5846. [Google Scholar] [CrossRef] [PubMed]
  3. Lim, R.M.H.; Lee, J.Y.; Kannan, B.; Ko, T.K.; Chan, J.Y. Molecular and immune pathobiology of human angiosarcoma. Biochim. Biophys. Acta Rev. Cancer 2024, 1879, 189159. [Google Scholar] [CrossRef] [PubMed]
  4. Florou, V.; Wilky, B.A. Current and future directions for angiosarcoma therapy. Curr. Treat. Options Oncol. 2018, 19, 14. [Google Scholar] [CrossRef]
  5. Penel, N.; Italiano, A.; Ray-Coquard, I.; Chaigneau, L.; Delcambre, C.; Robin, Y.M.; Bui, B.; Bertucci, F.; Isambert, N.; Cupissol, D.; et al. Metastatic angiosarcomas: Doxorubicin-based regimens, weekly paclitaxel and metastasectomy significantly improve the outcome. Ann. Oncol. 2012, 23, 517–523. [Google Scholar] [CrossRef]
  6. Chan, J.Y.; Tan, G.F.; Yeong, J.; Ong, C.W.; Ng, D.Y.X.; Lee, E.; Koh, J.; Ng, C.C.-Y.; Lee, J.Y.; Liu, W.; et al. Clinical implications of systemic and local immune responses in human angiosarcoma. npj Precis. Oncol. 2021, 5, 11. [Google Scholar] [CrossRef]
  7. Tai, S.B.; Lee, E.C.Y.; Lim, B.Y.; Kannan, B.; Lee, J.Y.; Guo, Z.; Ko, T.K.; Ng, C.C.-Y.; Teh, B.T.; Chan, J.Y. Tumor-infiltrating mast cells in angiosarcoma correlate with immuno-oncology pathways and adverse clinical outcomes. Lab. Investig. 2024, 104, 100323. [Google Scholar] [CrossRef]
  8. Tan, G.F.; Goh, S.; Lim, A.H.; Liu, W.; Lee, J.Y.; Rajasegaran, V.; Sam, X.X.; Tay, T.K.Y.; Selvarajan, S.; Ng, C.C.; et al. Bizarre giant cells in human angiosarcoma exhibit chemoresistance and contribute to poor survival outcomes. Cancer Sci. 2021, 112, 397–409. [Google Scholar] [CrossRef]
  9. Loh, J.W.; Lee, J.Y.; Lim, A.H.; Guang, P.; Lim, B.Y.; Kannan, B.; Lee, E.C.Y.; Gu, N.X.; Ko, T.K.; Ng, C.C.-Y.; et al. Spatial transcriptomics reveal topological immune landscapes of Asian head and neck angiosarcoma. Commun. Biol. 2023, 6, 461. [Google Scholar] [CrossRef]
  10. Painter, C.A.; Jain, E.; Tomson, B.N.; Dunphy, M.; Stoddard, R.E.; Thomas, B.S.; Damon, A.L.; Shah, S.; Kim, D.; Gómez Tejeda Zañudo, J.; et al. The Angiosarcoma Project: Enabling genomic and clinical discoveries in a rare cancer through patient-partnered research. Nat. Med. 2020, 26, 181–187. [Google Scholar] [CrossRef]
  11. Lin, E.Y.H.; Xi, W.; Aggarwal, N.; Shinohara, M.L. Osteopontin (Opn)/SPP1: From its biochemistry to biological functions in the innate immune system and the central nervous system (Cns). Int. Immunol. 2023, 35, 171–180. [Google Scholar] [CrossRef] [PubMed]
  12. Zhu, M.; He, H.; Meng, Q.; Zhu, Y.; Ye, X.; Xu, N.; Yu, J. Osteopontin sequence modified mesoporous calcium silicate scaffolds to promote angiogenesis in bone tissue regeneration. J. Mater. Chem. B 2020, 8, 5849–5861. [Google Scholar] [CrossRef] [PubMed]
  13. Tu, W.; Zheng, H.; Li, L.; Zhou, C.; Feng, M.; Chen, L.; Li, D.; Chen, X.; Hao, B.; Sun, H.; et al. Secreted phosphoprotein 1 promotes angiogenesis of glioblastoma through upregulating PSMA expression via transcription factor HIF1α. Acta Biochim. Biophys. Sin. 2022, 55, 417–425. [Google Scholar] [PubMed]
  14. Liaw, L.; Skinner, M.P.; Raines, E.W.; Ross, R.; Cheresh, A.D.; Schwartz, S.M.; Giachelli, C.M. The adhesive and migratory effects of osteopontin are mediated via distinct cell surface integrins. Role of alpha v beta 3 in smooth muscle cell migration to osteopontin in vitro. J. Clin. Investig. 1995, 95, 713–724. [Google Scholar] [CrossRef] [PubMed]
  15. Castello, L.M.; Raineri, D.; Salmi, L.; Clemente, N.; Vaschetto, R.; Quaglia, M.; Garzaro, M.; Gentilli, S.; Navalesi, P.; Cantaluppi, V.; et al. Osteopontin at the crossroads of inflammation and tumor progression. Mediat. Inflamm. 2017, 2017, 4049098. [Google Scholar] [CrossRef]
  16. Tu, Y.; Chen, C.; Fan, G. Association between the expression of secreted phosphoprotein—Related genes and prognosis of human cancer. BMC Cancer 2019, 19, 1230. [Google Scholar] [CrossRef]
  17. Göthlin Eremo, A.; Lagergren, K.; Othman, L.; Montgomery, S.; Andersson, G.; Tina, E. Evaluation of SPP1/osteopontin expression as predictor of recurrence in tamoxifen treated breast cancer. Sci. Rep. 2020, 10, 1451. [Google Scholar] [CrossRef]
  18. Pan, H.W.; Ou, Y.H.; Peng, S.Y.; Liu, S.; Lai, P.; Lee, P.; Sheu, J.; Chen, C.; Hsu, H. Overexpression of osteopontin is associated with intrahepatic metastasis, early recurrence, and poorer prognosis of surgically resected hepatocellular carcinoma. Cancer 2003, 98, 119–127. [Google Scholar] [CrossRef]
  19. Zou, Y.; Tan, X.; Yuan, G.; Tang, Y.; Wang, Y.; Yang, C.; Luo, S.; Wu, Z.; Yao, K. SPP1 is associated with adverse prognosis and predicts immunotherapy efficacy in penile cancer. Hum. Genom. 2023, 17, 116. [Google Scholar] [CrossRef]
  20. Periyasamy, A.; Gopisetty, G.; Subramanium, M.J.; Velusamy, S.; Rajkumar, T. Identification and validation of differential plasma proteins levels in epithelial ovarian cancer. J. Proteom. 2020, 226, 103893. [Google Scholar] [CrossRef]
  21. Guo, Z.; Huang, J.; Wang, Y.; Liu, X.-P.; Li, W.; Yao, J.; Li, S.; Hu, W. Analysis of expression and its clinical significance of the secreted phosphoprotein 1 in lung adenocarcinoma. Front. Genet. 2020, 11, 547. [Google Scholar] [CrossRef] [PubMed]
  22. Zeng, B.; Zhou, M.; Wu, H.; Xiong, Z. SPP1 promotes ovarian cancer progression via Integrin β1/FAK/AKT signaling pathway. OncoTargets Ther. 2018, 11, 1333–1343. [Google Scholar] [CrossRef] [PubMed]
  23. Liu, G.; Fan, X.; Tang, M.; Chen, R.; Wang, H.; Jia, R.; Zhou, X.; Jing, W.; Wang, H.; Yang, Y.; et al. Osteopontin induces autophagy to promote chemo-resistance in human hepatocellular carcinoma cells. Cancer Lett. 2016, 383, 171–182. [Google Scholar] [CrossRef] [PubMed]
  24. Zhang, Y.; Du, W.; Chen, Z.; Xiang, C. Upregulation of PD-L1 by SPP1 mediates macrophage polarization and facilitates immune escape in lung adenocarcinoma. Exp. Cell Res. 2017, 359, 449–457. [Google Scholar] [CrossRef]
  25. Klement, J.D.; Paschall, A.V.; Redd, P.S.; Ibrahim, M.L.; Lu, C.; Yang, D.; Celis, E.; Abrams, S.I.; Ozato, K.; Liu, K. An osteopontin/CD44 immune checkpoint controls CD8+ T cell activation and tumor immune evasion. J. Clin. Investig. 2018, 128, 5549–5560. [Google Scholar] [CrossRef]
  26. D’Angelo, S.P.; Munhoz, R.R.; Kuk, D.; Landa, J.; Hartley, E.; Bonafede, M.; Dickson, M.A.; Gounder, M.; Keohan, M.L.; Crago, A.M.; et al. Angiosarcoma: Outcomes of systemic therapy for patients with metastatic disease. Oncology 2015, 89, 205–214. [Google Scholar] [CrossRef]
  27. Venkataramani, V.; Küffer, S.; Cheung, K.C.P.; Jiang, X.; Trümper, L.; Wulf, G.G.; Ströbel, P. Cd31 expression determines redox status and chemoresistance in human angiosarcomas. Clin. Cancer Res. 2018, 24, 460–473. [Google Scholar] [CrossRef]
  28. Zeng, P.; Zhang, X.; Xiang, T.; Ling, Z.; Lin, C.; Diao, H. Secreted phosphoprotein 1 as a potential prognostic and immunotherapy biomarker in multiple human cancers. Bioengineered 2022, 13, 3221–3239. [Google Scholar] [CrossRef]
  29. Gao, W.; Liu, D.; Sun, H.; Shao, Z.; Shi, P.; Li, T.; Yin, S.; Zhu, T. SPP1 is a prognostic related biomarker and correlated with tumor-infiltrating immune cells in ovarian cancer. BMC Cancer 2022, 22, 1367. [Google Scholar] [CrossRef]
  30. Wu, J.; Shen, Y.; Zeng, G.; Liang, Y.; Liao, G. SPP1+ TAM subpopulations in tumor microenvironment promote intravasation and metastasis of head and neck squamous cell carcinoma. Cancer Gene Ther. 2024, 31, 311–321. [Google Scholar] [CrossRef]
  31. Wei, R.; Wong, J.P.C.; Kwok, H.F. Osteopontin—A promising biomarker for cancer therapy. J. Cancer 2017, 8, 2173–2183. [Google Scholar] [CrossRef] [PubMed]
  32. Matsubara, E.; Komohara, Y.; Esumi, S.; Shinchi, Y.; Ishizuka, S.; Mito, R.; Pan, C.; Yano, H.; Kobayashi, D.; Fujiwara, Y.; et al. Spp1 derived from macrophages is associated with a worse clinical course and chemo-resistance in lung adenocarcinoma. Cancers 2022, 14, 4374. [Google Scholar] [CrossRef] [PubMed]
  33. Qian, J.; LeSavage, B.L.; Hubka, K.M.; Ma, C.; Natarajan, S.; Eggold, J.T.; Xiao, Y.; Fuh, K.C.; Krishnan, V.; Enejder, A.; et al. Cancer-associated mesothelial cells promote ovarian cancer chemoresistance through paracrine osteopontin signaling. J. Clin. Investig. 2021, 131, e146186. [Google Scholar] [CrossRef] [PubMed]
  34. Eun, J.W.; Yoon, J.H.; Ahn, H.R.; Kim, S.; Kim, Y.B.; Bin Lim, S.; Park, W.; Kang, T.W.; Baek, G.O.; Yoon, M.G.; et al. Cancer-associated fibroblast-derived secreted phosphoprotein 1 contributes to resistance of hepatocellular carcinoma to sorafenib and lenvatinib. Cancer Commun. 2023, 43, 455–479. [Google Scholar] [CrossRef]
  35. Nakamura, T.; Shinriki, S.; Jono, H.; Ueda, M.; Nagata, M.; Guo, J.; Hayashi, M.; Yoshida, R.; Ota, T.; Ota, K.; et al. Osteopontin-integrin α(V)β(3) axis is crucial for 5-fluorouracil resistance in oral squamous cell carcinoma. FEBS Lett. 2015, 589, 231–239. [Google Scholar] [CrossRef]
  36. Song, H.; Yao, X.; Zheng, Y.; Zhou, L. Helicobacter pylori infection induces POU5F1 upregulation and SPP1 activation to promote chemoresistance and T cell inactivation in gastric cancer cells. Biochem. Pharmacol. 2024, 225, 116253. [Google Scholar] [CrossRef]
  37. Uchibori, T.; Matsuda, K.; Shimodaira, T.; Sugano, M.; Uehara, T.; Honda, T. IL-6 trans-signaling is another pathway to upregulate Osteopontin. Cytokine 2017, 90, 88–95. [Google Scholar] [CrossRef]
  38. Serlin, D.M.; Kuang, P.P.; Subramanian, M.; O’Regan, A.; Li, X.; Berman, J.S.; Goldstein, R.H. Interleukin-1beta induces osteopontin expression in pulmonary fibroblasts. J. Cell. Biochem. 2006, 97, 519–529. [Google Scholar] [CrossRef]
  39. Ko, T.K.; Guo, Z.; Kannan, B.; Lim, B.Y.; Lee, J.Y.; Lim, A.H.; Li, Z.; Lee, E.C.Y.; Ng, C.C.-Y.; Teh, B.T.; et al. Abstract 7048: Multiomics characterization of breast angiosarcoma from an Asian cohort reveals enrichment for angiogenesis signaling pathway and tumor-infiltrating macrophages. Cancer Res. 2024, 84 (Suppl. 6), 7048. [Google Scholar] [CrossRef]
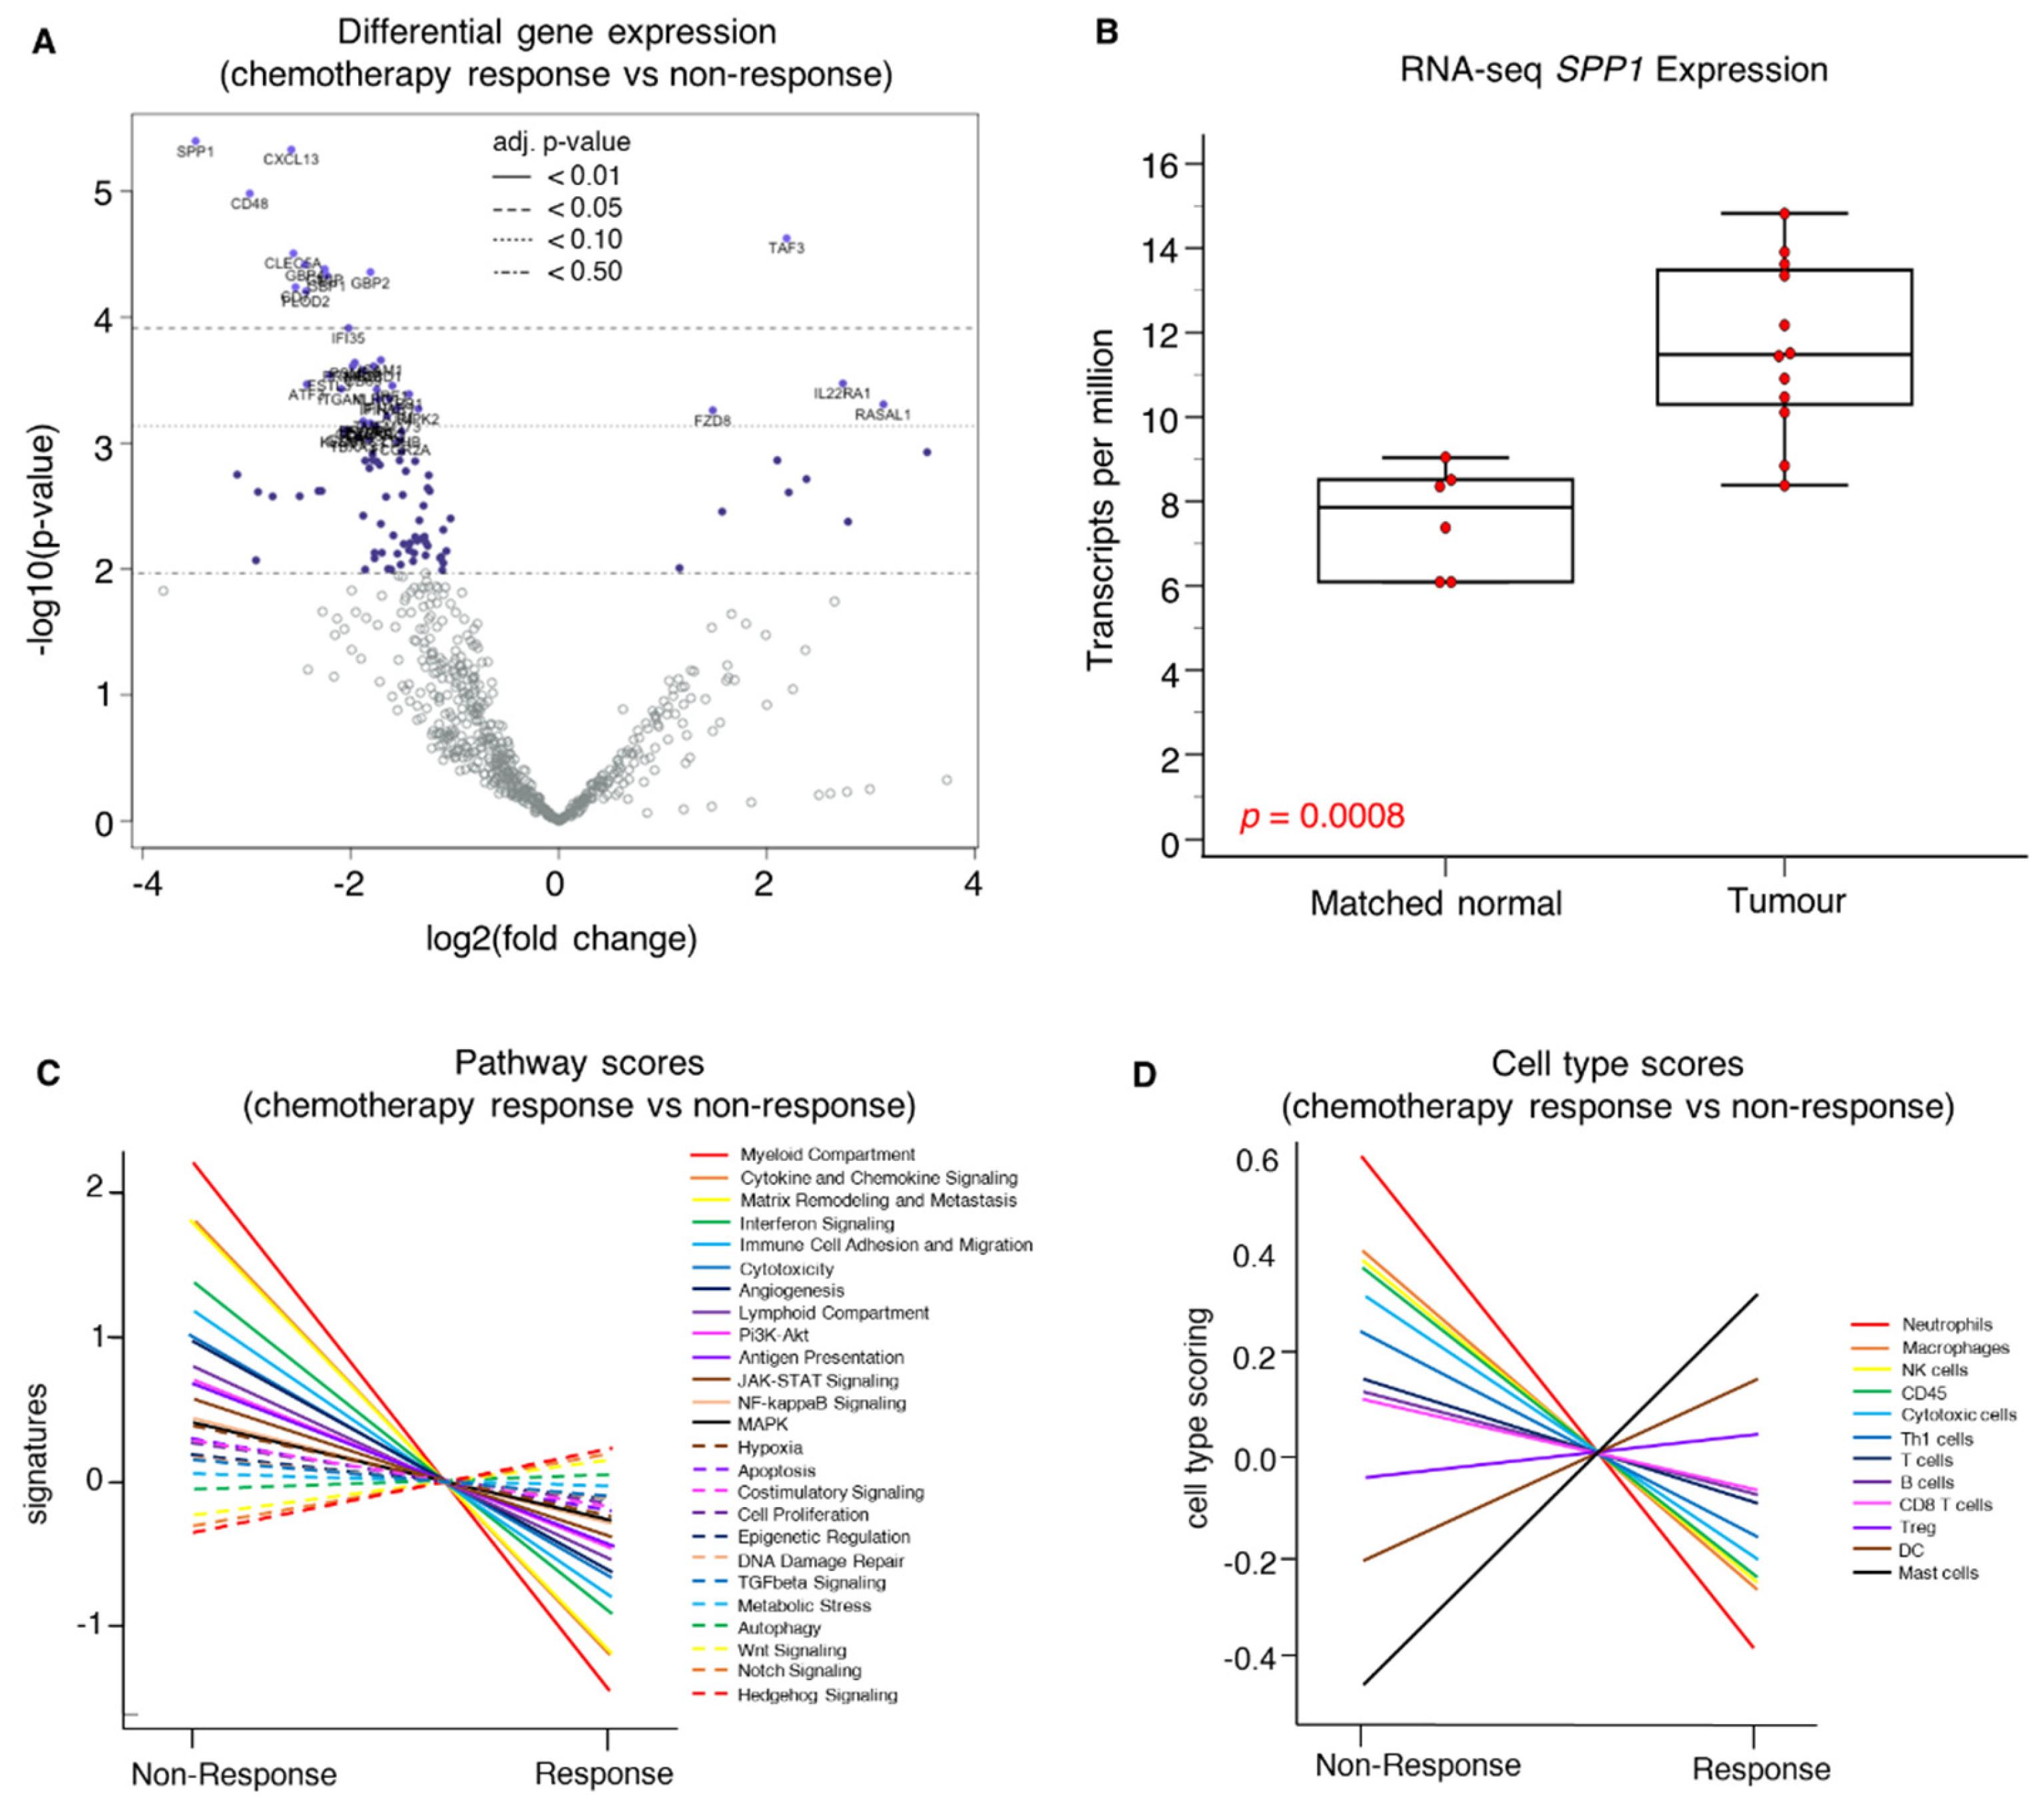
Figure 1. Transcriptomic analysis of chemoresistant versus chemosensitive angiosarcoma. (A) Volcano plot of the differential gene expression in chemoresistant versus chemosensitive angiosarcoma reveals significant SPP1 overexpression in chemoresistant angiosarcoma. (B) Significant upregulation of SPP1 expression in tumor compared to matched normal tissue reflected in whole transcriptome sequencing data. (C) Pathway analysis showed that expression of myeloid compartment, cytokine and chemokine signaling, and matrix remodeling and metastasis pathways were upregulated in chemoresistant tumors. Conversely, Hedgehog, Notch, and Wnt signaling pathways were upregulated in chemosensitive tumors. (D) Cell-type analysis of chemoresistant tumors suggested enrichment of myeloid cells including neutrophils, macrophages, and NK cells, whereas a greater population of mast cells, dendritic cells (DC), and regulatory T cells (Treg) were observed in chemosensitive tumors.
Ijms 25 10863 g001
Figure 2. Chemotherapy response of angiosarcoma correlates with immuno-oncogenic pathways and cell types. (A) Significance of association of top three immuno-oncology pathways with chemotherapy non-response versus response in angiosarcoma. (B) Significance of association of top three cell types with chemotherapy non-response versus response in angiosarcoma.
Ijms 25 10863 g002
Figure 3. Transcriptomic analysis of SPP1-high and SPP1-low angiosarcoma. (A) Volcano plot of differentially expressed genes between SPP1-high and SPP1-low tumors (n = 72) revealed significant overexpression of various genes, including SLC11A1, PLOD2, CXCL3, IL6, FSTL3, CXCL2, TREM1 and IL1β. (BD) NanoString pathway analysis and gene-specific analysis (GSA) revealed significant overexpression of myeloid compartment pathway genes (SLC11A1, CXCL3, CXCL2, TREM1, IL1β), cytokine and chemokine signaling pathway genes (CXCL3, IL6, CXCL2, IL1β), and matrix remodeling and metastasis pathway genes (PLOD2). (C) Cell-type analysis of SPP1-high tumors suggested enrichment of myeloid cells, including neutrophils, macrophages, and NK cells.
Ijms 25 10863 g003
Figure 4. Clinicopathological characteristics associated with SPP1 expression in angiosarcoma. (A) Presence of epithelioid histology was significantly associated with higher SPP1 gene expression levels. (B) Higher FNCLCC grading was significantly associated with higher SPP1 gene expression levels. (C,D) Tumor mutational burden (TMB) and tumor inflammatory signature (TIS) scores were not associated with SPP1 gene expression levels.
Ijms 25 10863 g004
Figure 5. Spatial distribution of SPP1. (A) Spatial transcriptomics analysis showed that SPP1 expression displayed significant heterogeneity in terms of spatial distribution in all samples, with focal clusters of cells expressing higher levels of SPP1 scattered throughout the tumor tissues. (B) Spatial distribution of various cell types in the tumor tissues. (C) Violin plots showing SPP1 expression across all cell types in angiosarcoma, including stromal, immune, and tumor cells, and it was most enriched in myeloid cells.
Ijms 25 10863 g005
Figure 6. Prognostic implications of SPP1. (A) IHC images at 400× magnification (scale bar, 100 µM) of tissue sections stained with anti-osteopontin antibody (SPP1). Representative images for high and low SPP1 H-scores are shown. (B) Scatterplot showing significant moderate correlation between SPP1 expression levels from IHC H-scores and NanoString (Spearman’s r = 0.7016; p < 0.0110). (C) Western blot reflected higher SPP1 protein expression in ISOHAS as compared to MOLAS cell line. (D) In the patient-derived MOLAS and ISOHAS cell lines, treatment with paclitaxel and doxorubicin resulted in reduced viability in a dose-dependent manner, with ISOHAS demonstrating higher cell viability than MOLAS upon treatment with either chemotherapeutic drug. *, p < 0.05. (E,F) Kaplan–Meier curves showing survival probability in patients with SPP1-high versus SPP1-low angiosarcoma. Patients with SPP1-high angiosarcoma showed poorer overall survival (CI 1.07 to 3.18, HR 1.84, p = 0.0288), along with a trend toward poorer progression-free survival (CI 0.98 to 3.06, HR 1.74, p = 0.0566) compared to patients with SPP1-low angiosarcoma.
Ijms 25 10863 g006
Table 1. Angiosarcoma patient characteristics stratified by high and low SPP1 levels.
SPP1 LevelsTotal
HighLowp
n (%) 72 (100%)
Sex
Male21 (58.3%)26 (72.2%)0.21947 (65.3%)
Female15 (41.7%)10 (27.8%)25 (34.7%)
Age at diagnosis (years)
<6521 (58.3%)15 (41.7%)0.1636 (50.0%)
≥6515 (41.7%)21 (58.3%)36 (50.0%)
Ethnicity
Chinese27 (75.0%)31 (86.1%)0.23758 (80.6%)
Other9 (25.0%)5 (13.9%)14 (19.4%)
FNCLCC tumor grade
313 (36.1%)6 (16.7%)0.00519 (26.4%)
219 (52.8%)14 (38.9%)33 (45.8%)
14 (11.1%)16 (44.4%)20 (27.8%)
Site of primary tumor
Head and neck17 (47.2%)25 (69.4%)0.05842 (58.3%)
Others a19 (52.8%)11 (30.6%)30 (41.7%)
Human herpesvirus-7
Positive25 (69.4%)22 (61.1%)0.46125 (34.7%)
Negative11 (30.6%)14 (38.9%)47 (65.3%)
UV signature
Present11 (30.6%)10 (27.8%)0.79751 (70.8%)
Absent25 (69.4%)26 (72.2%)21 (29.2%)
Epithelioid histology
Present23 (63.9%)13 (36.1%)0.01936 (50.0%)
Absent13 (36.1%)23 (63.9%)36 (50.0%)
Disease state at diagnosis b
Metastatic14 (38.9%)8 (22.9%)0.14722 (31.0%)
Non-metastatic22 (61.1%)27 (77.1%)49 (69.0%)
a Others: breast (n = 7), liver (n = 4), abdominal wall (n = 2), arm (n = 2), forearm (n = 2), peritoneum (n = 2), small bowel (n = 2), brachial plexus (n = 1), chest wall (n = 1), lower limb (n = 1), pleura (n = 1), prostate (n = 1), retroperitoneum (n = 1), spleen (n = 1), thigh muscle (n = 1), and vagina (n = 1). b Unknown disease state: n = 1.
Disclaimer/Publisher’s Note: The statements, opinions and data contained in all publications are solely those of the individual author(s) and contributor(s) and not of MDPI and/or the editor(s). MDPI and/or the editor(s) disclaim responsibility for any injury to people or property resulting from any ideas, methods, instructions or products referred to in the content.