Gestational Caloric Restriction Alters Adipose Tissue Methylome and Offspring’s Metabolic Profile in a Swine Model
Abstract
:1. Introduction
2. Results
2.1. Effect of Gestational Caloric Restriction and Metformin Treatment on Offspring Characteristics
2.2. Effect of Gestational Caloric Restriction and Metformin Treatment on Adipose Tissue DNA Methylation
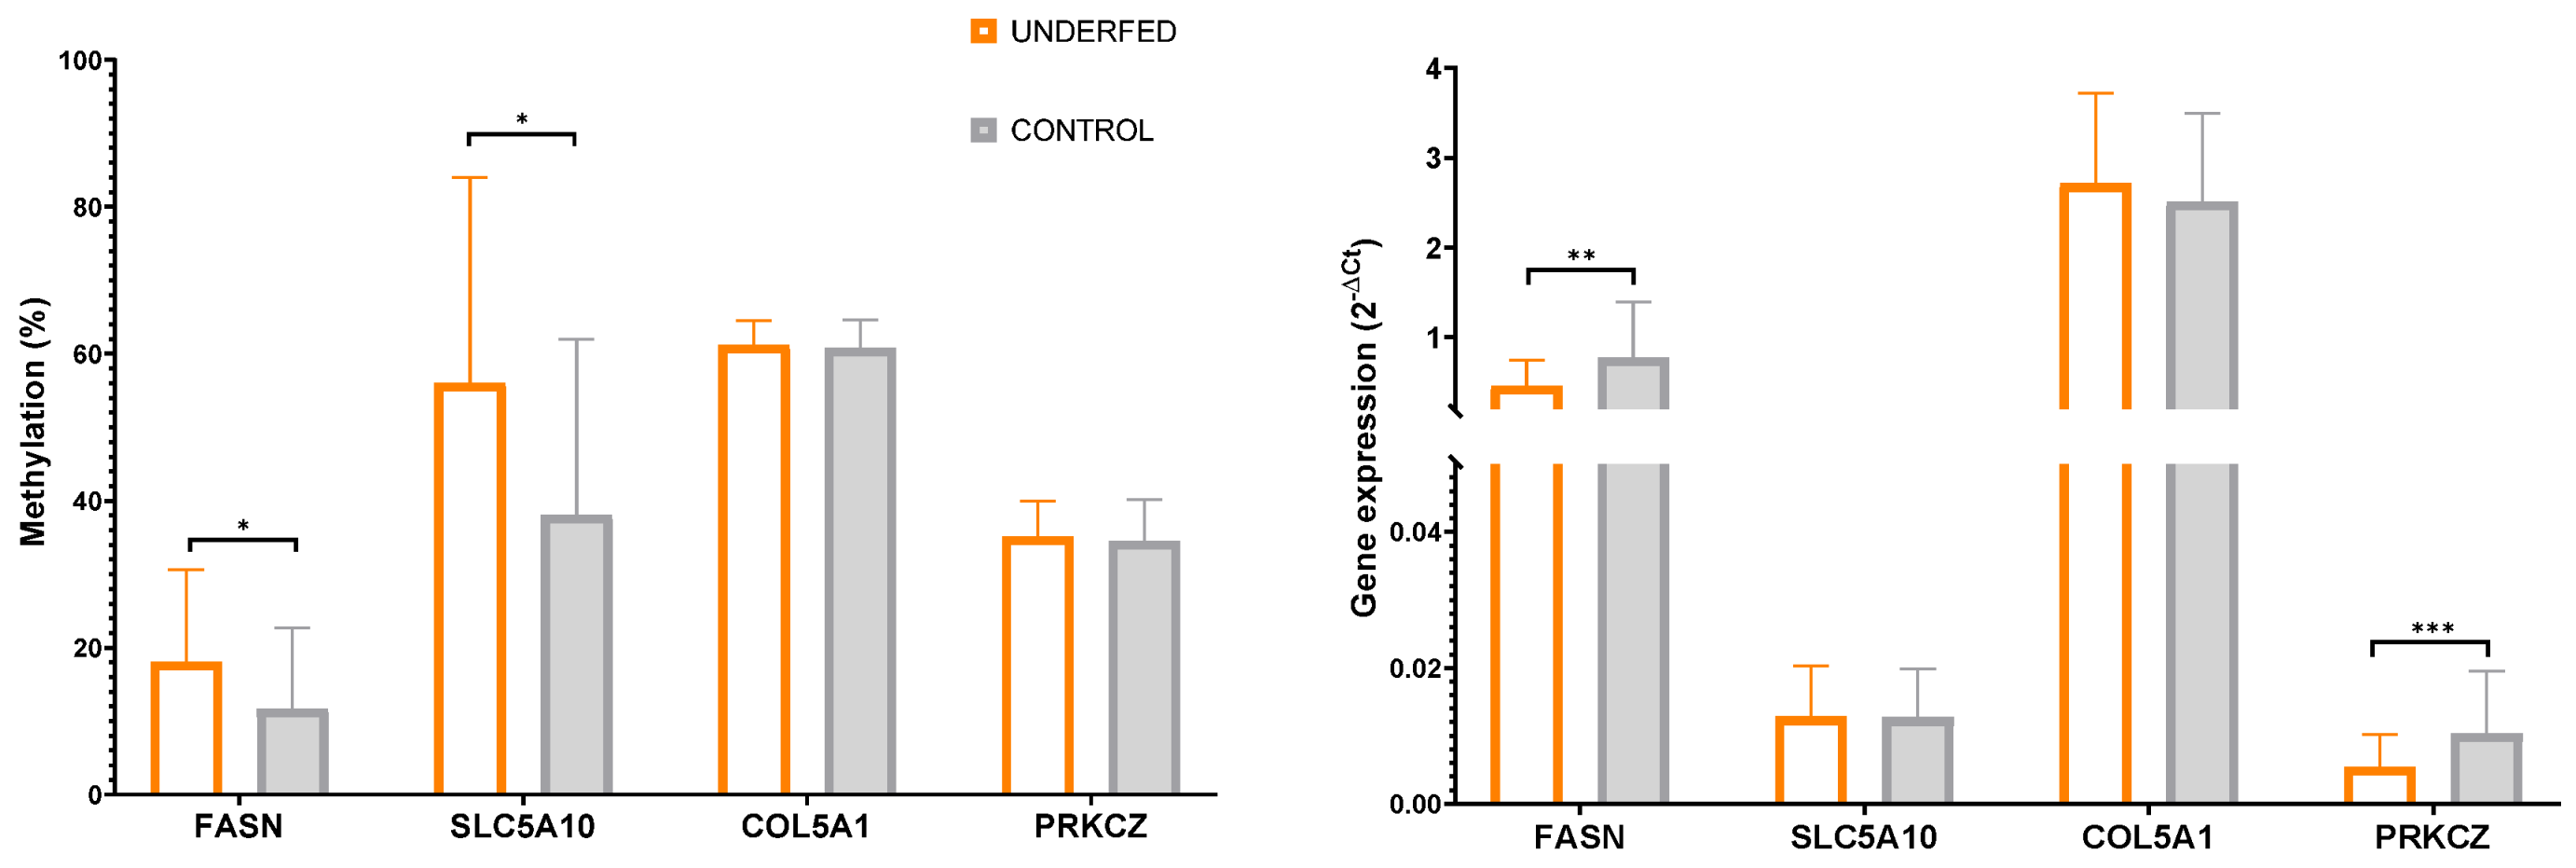
2.3. Gestational Caloric Restriction Regulates DNA Methylation and Gene Expression in Adipose Tissue
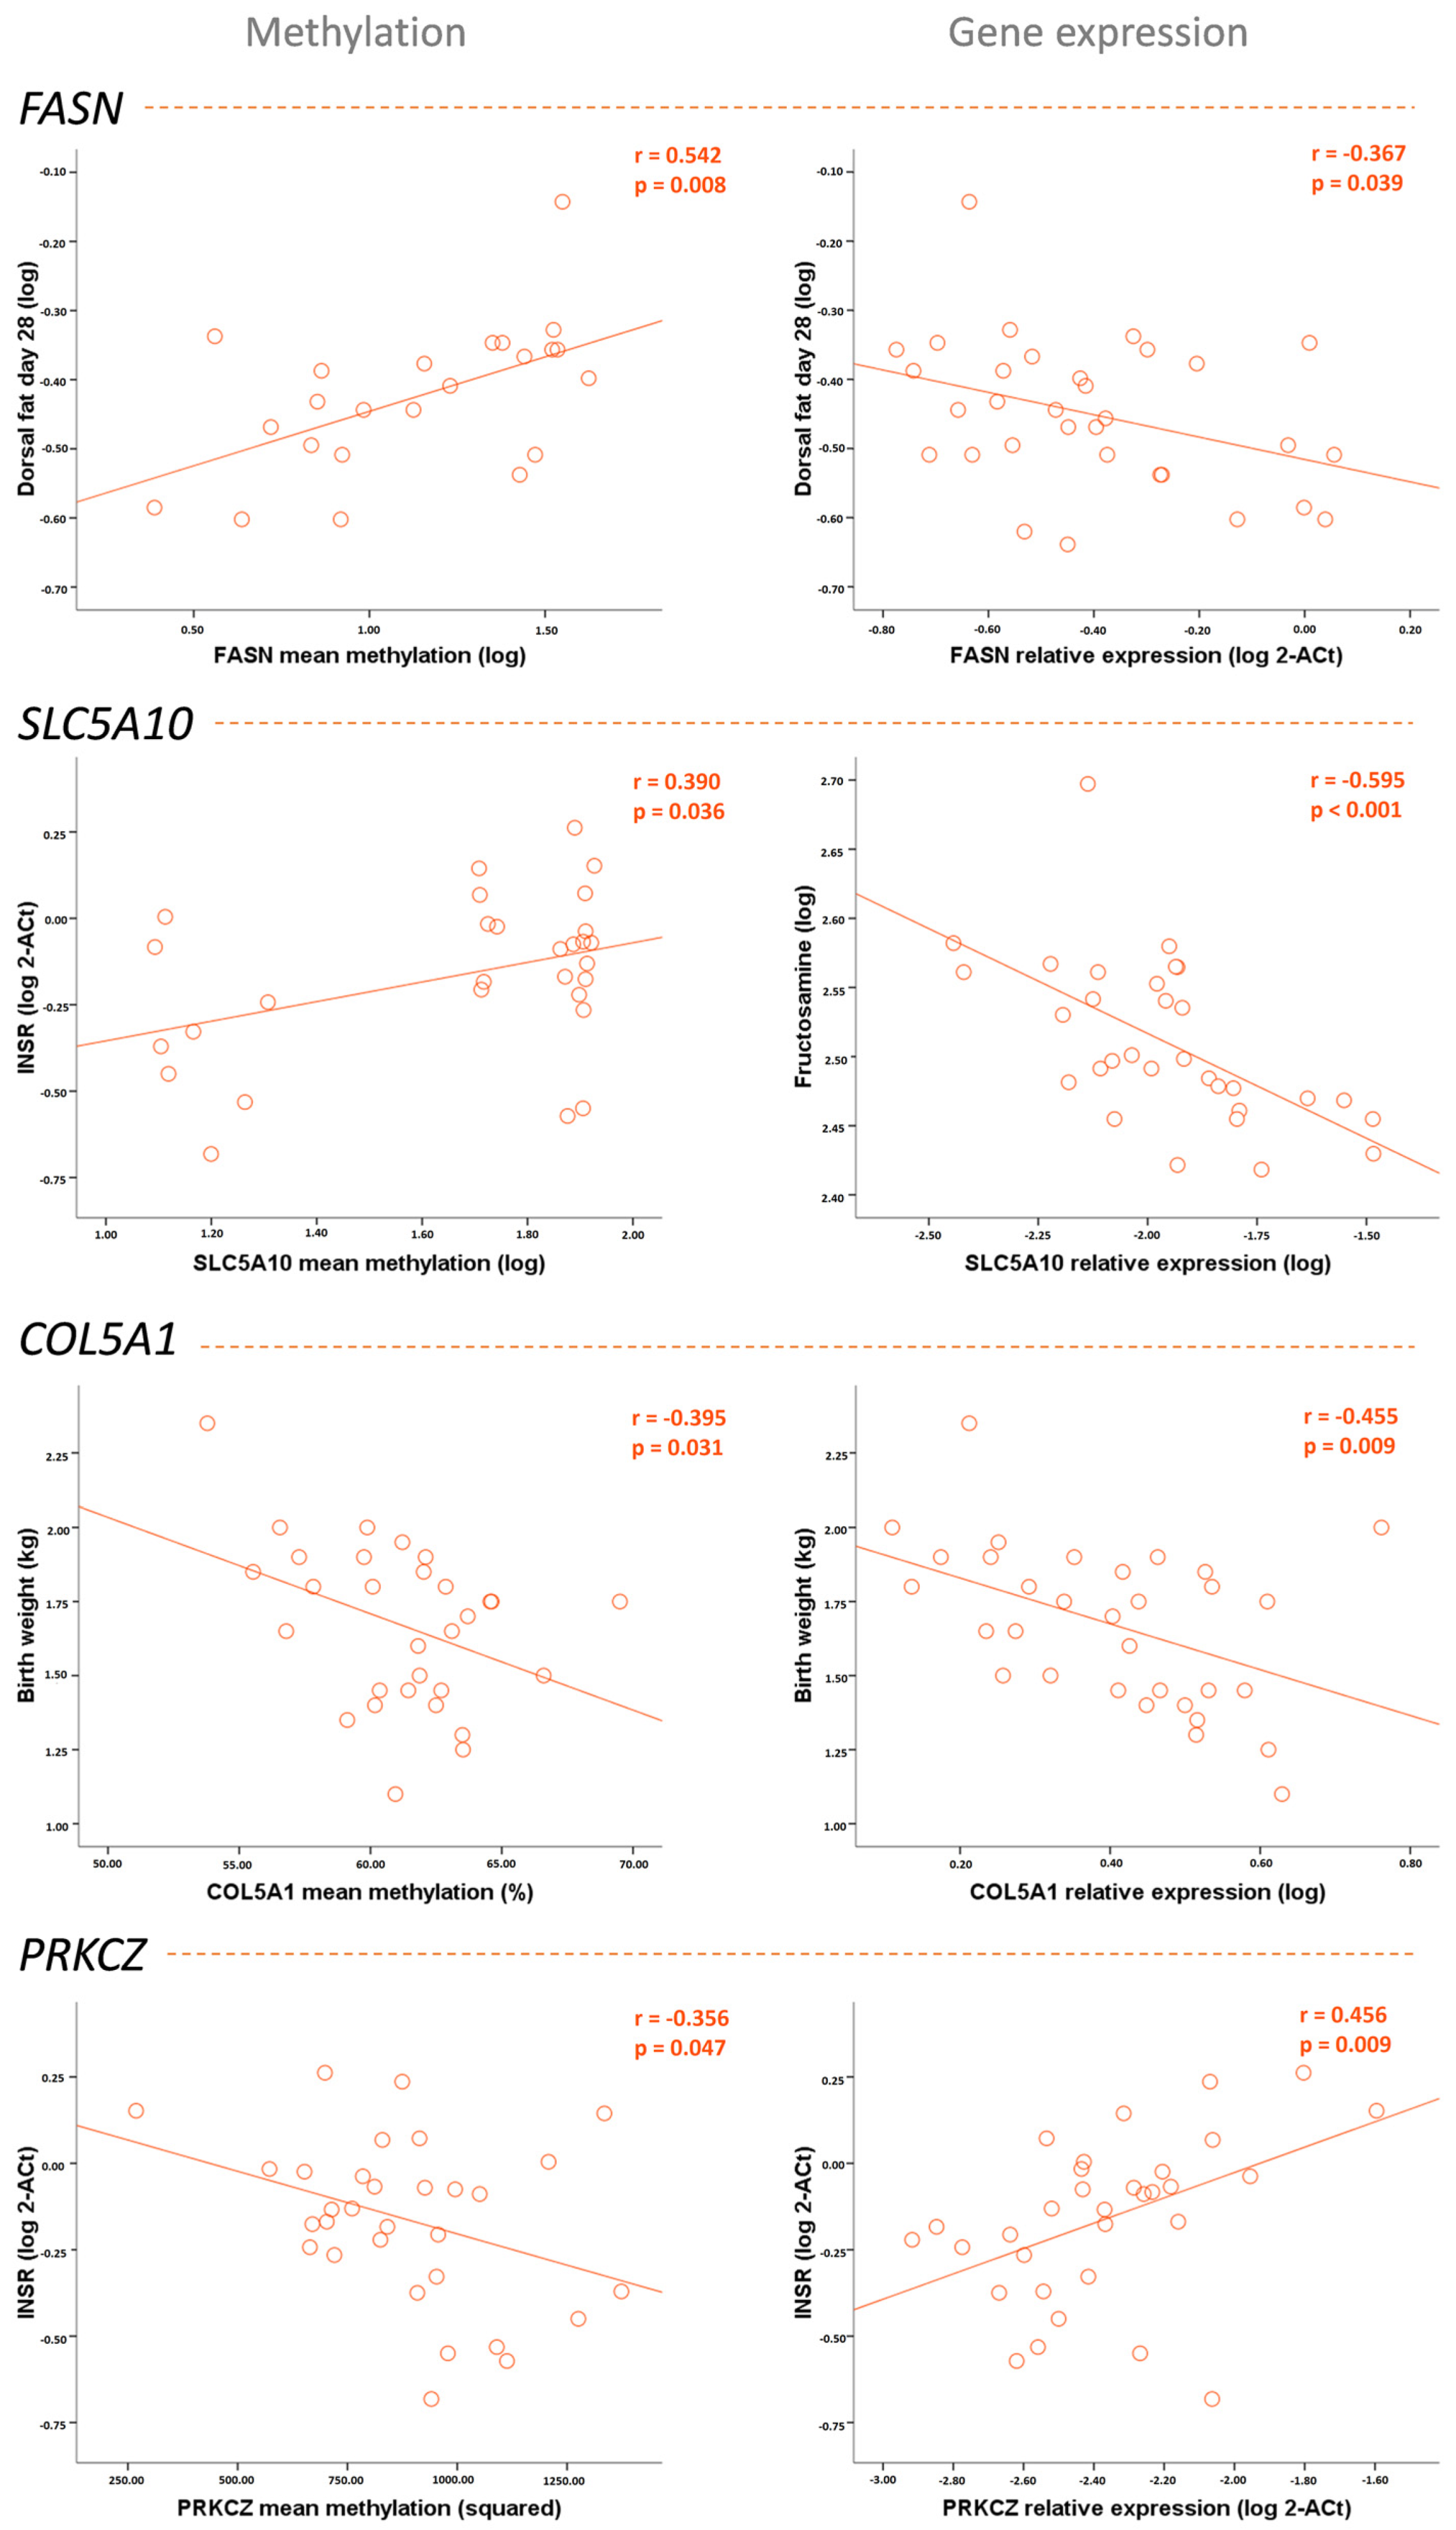
2.4. DNA Methylation and Gene Expression in Adipose Tissue Associated with the Metabolic Profile of the Piglets Born to Underfed Sows
3. Discussion
4. Materials and Methods
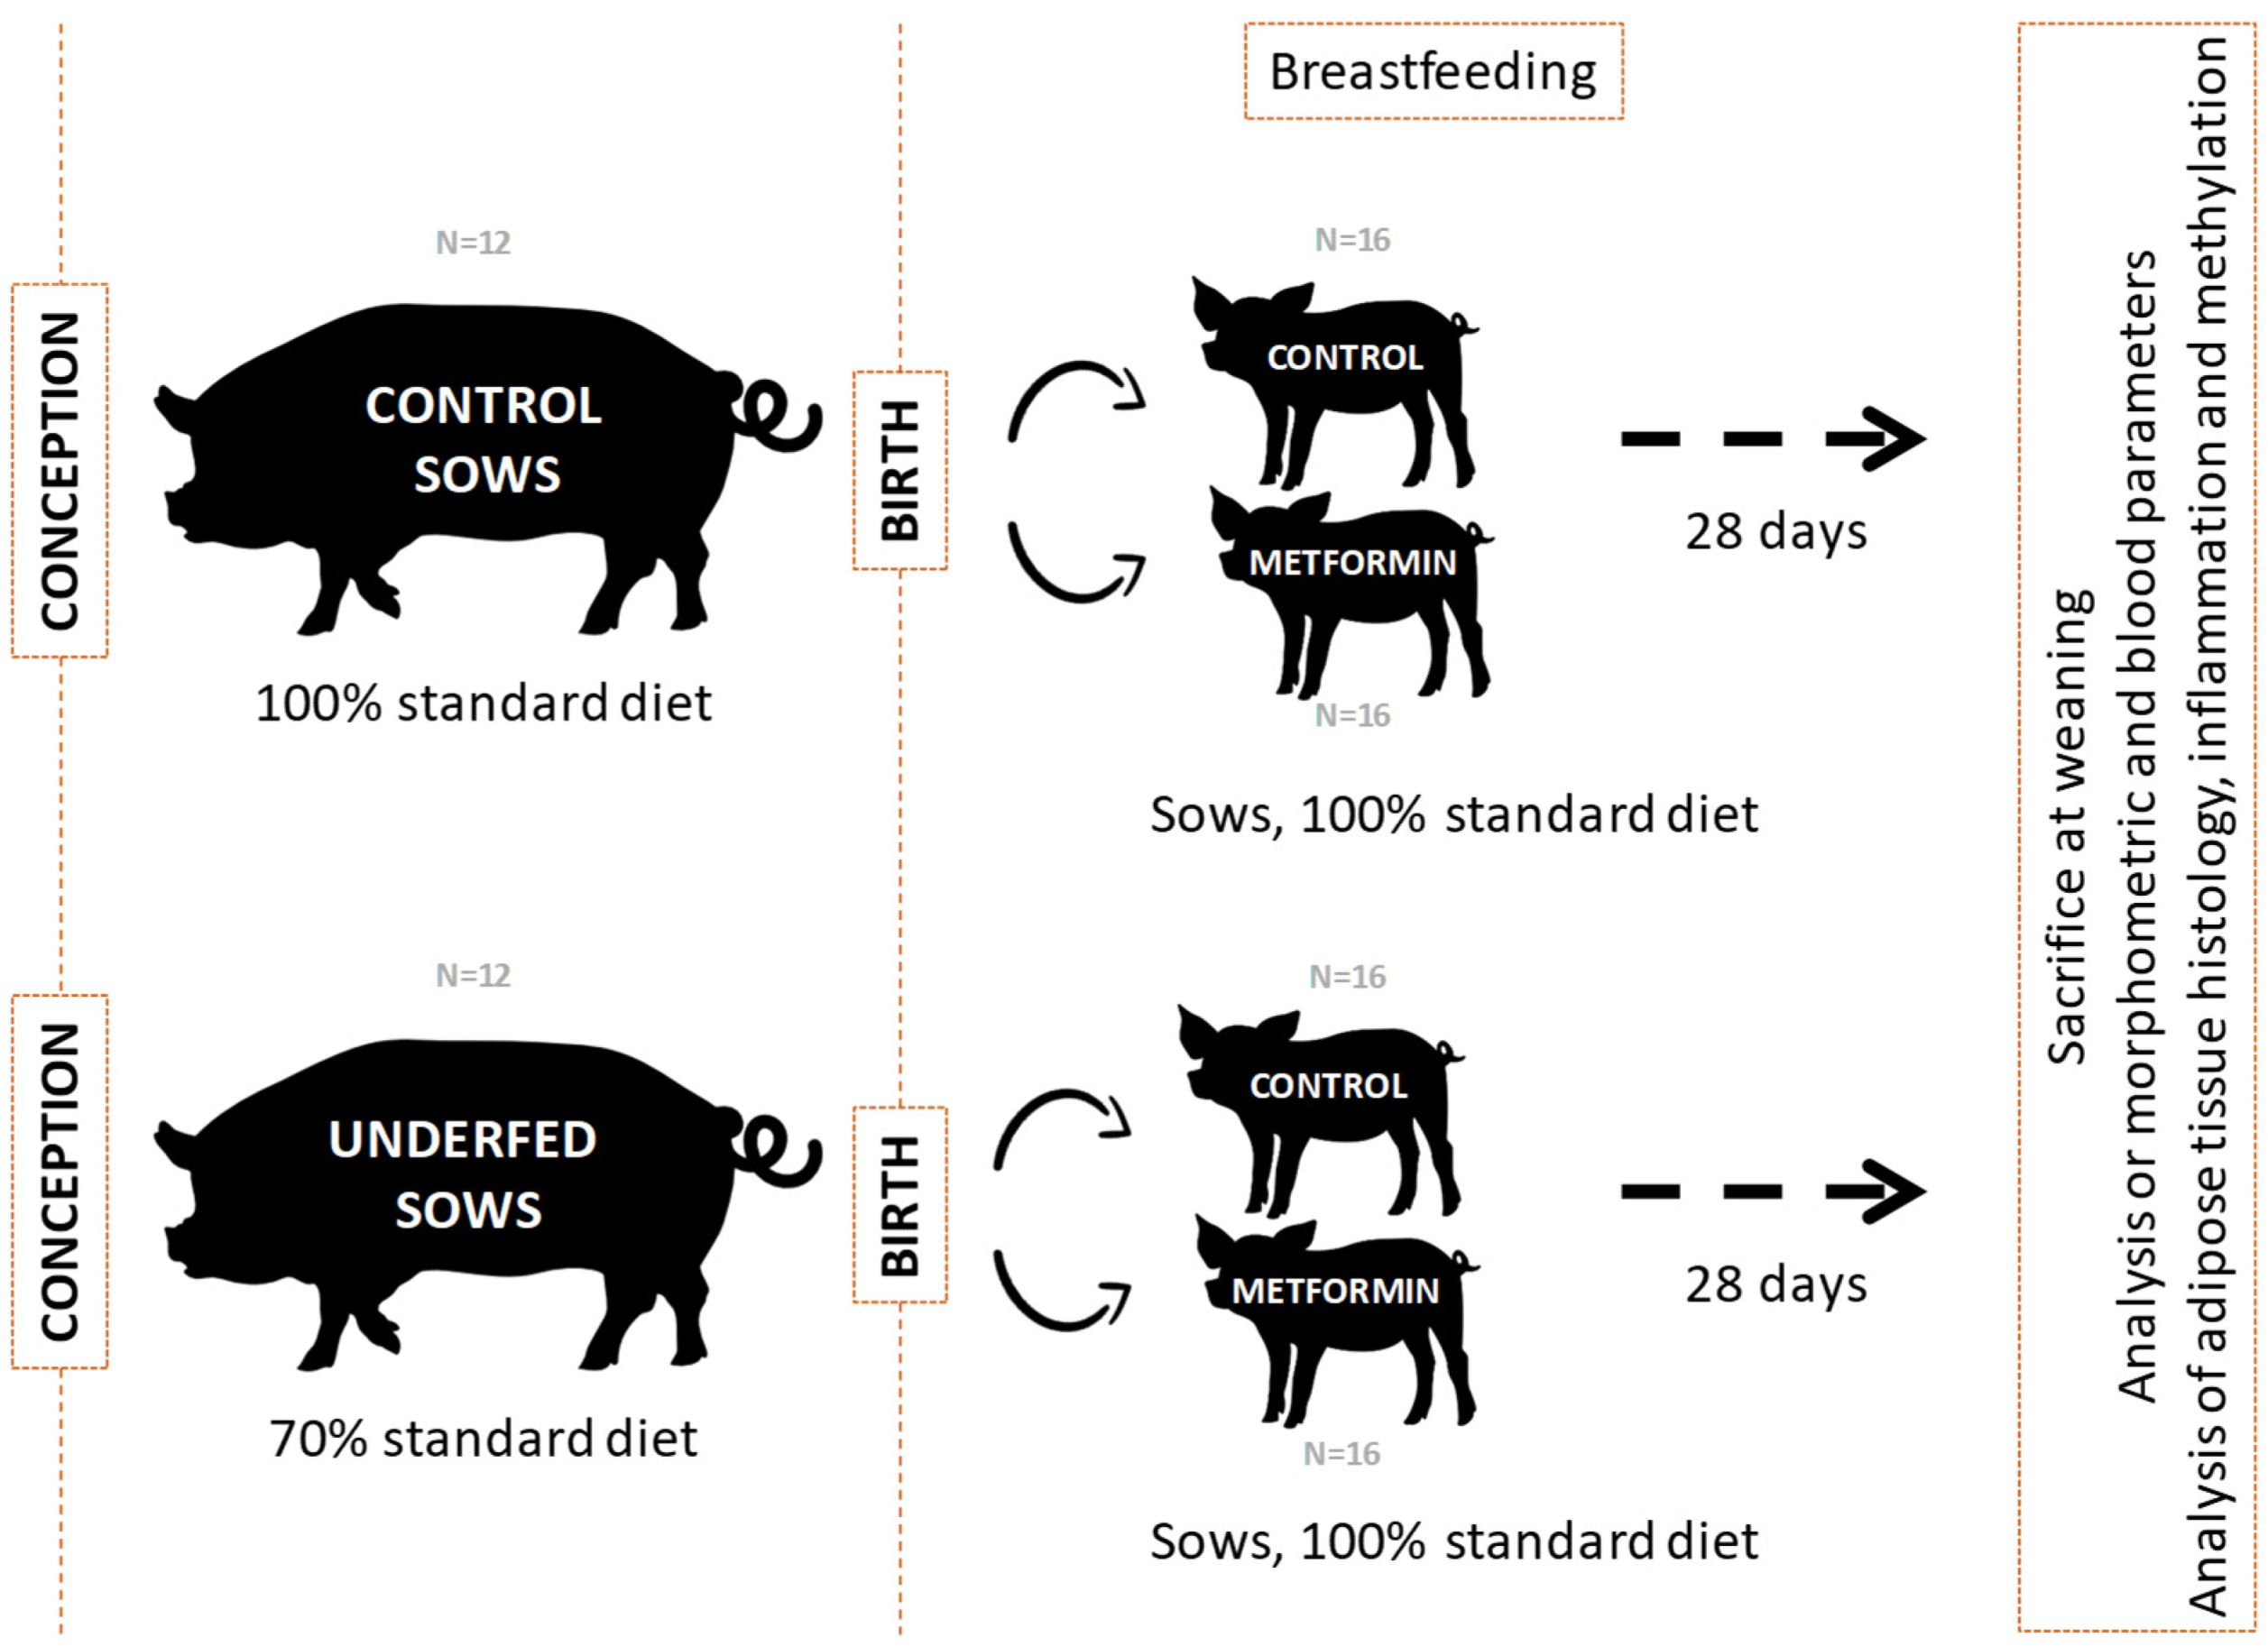
4.1. Animal Model and Samples
4.2. Morphometry
4.3. Metabolic Markers
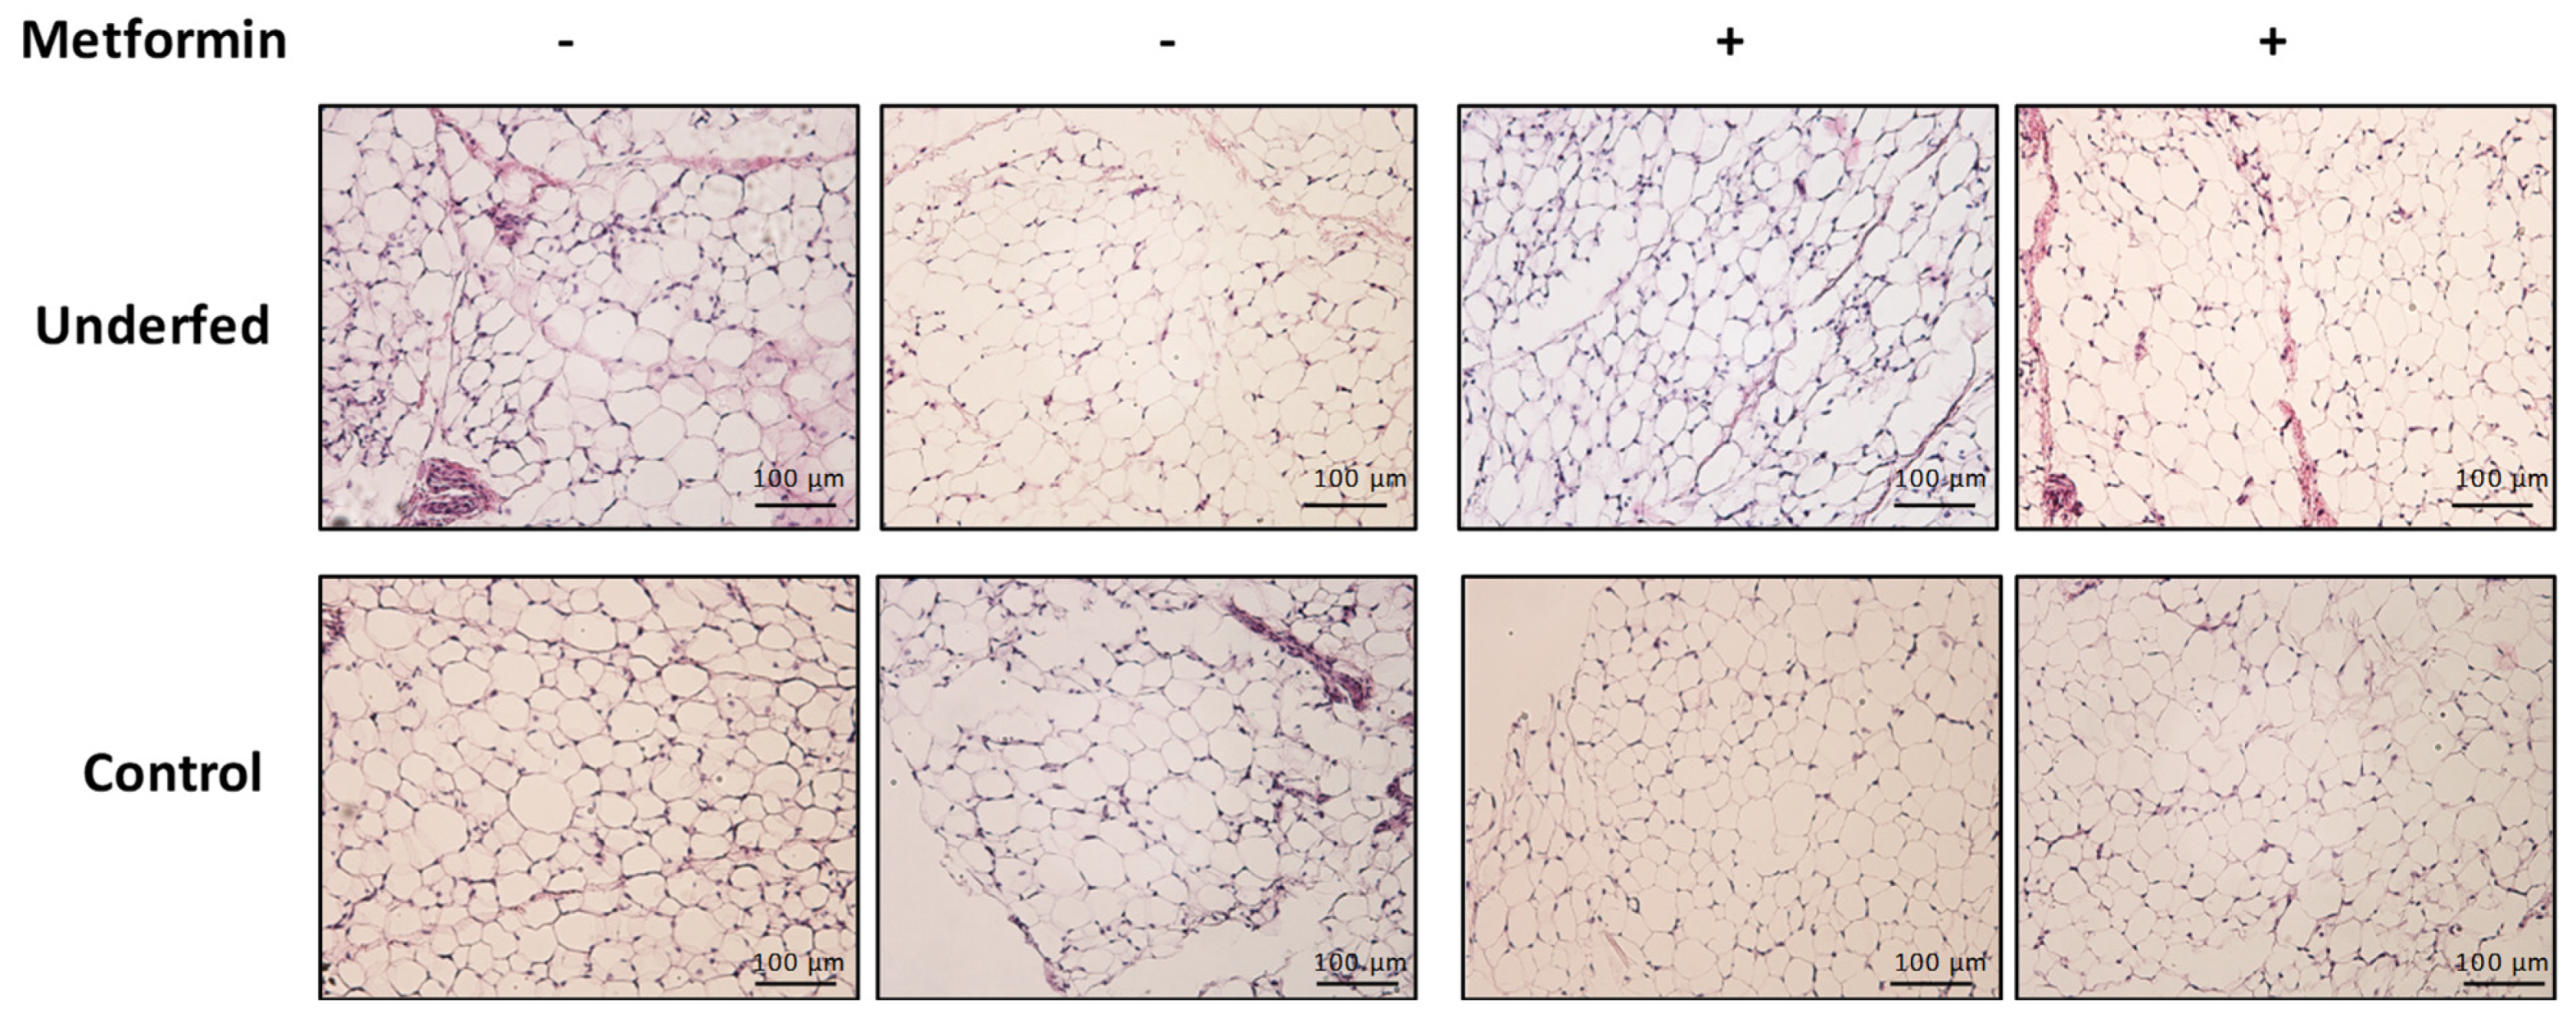
4.4. Adipose Tissue Histology
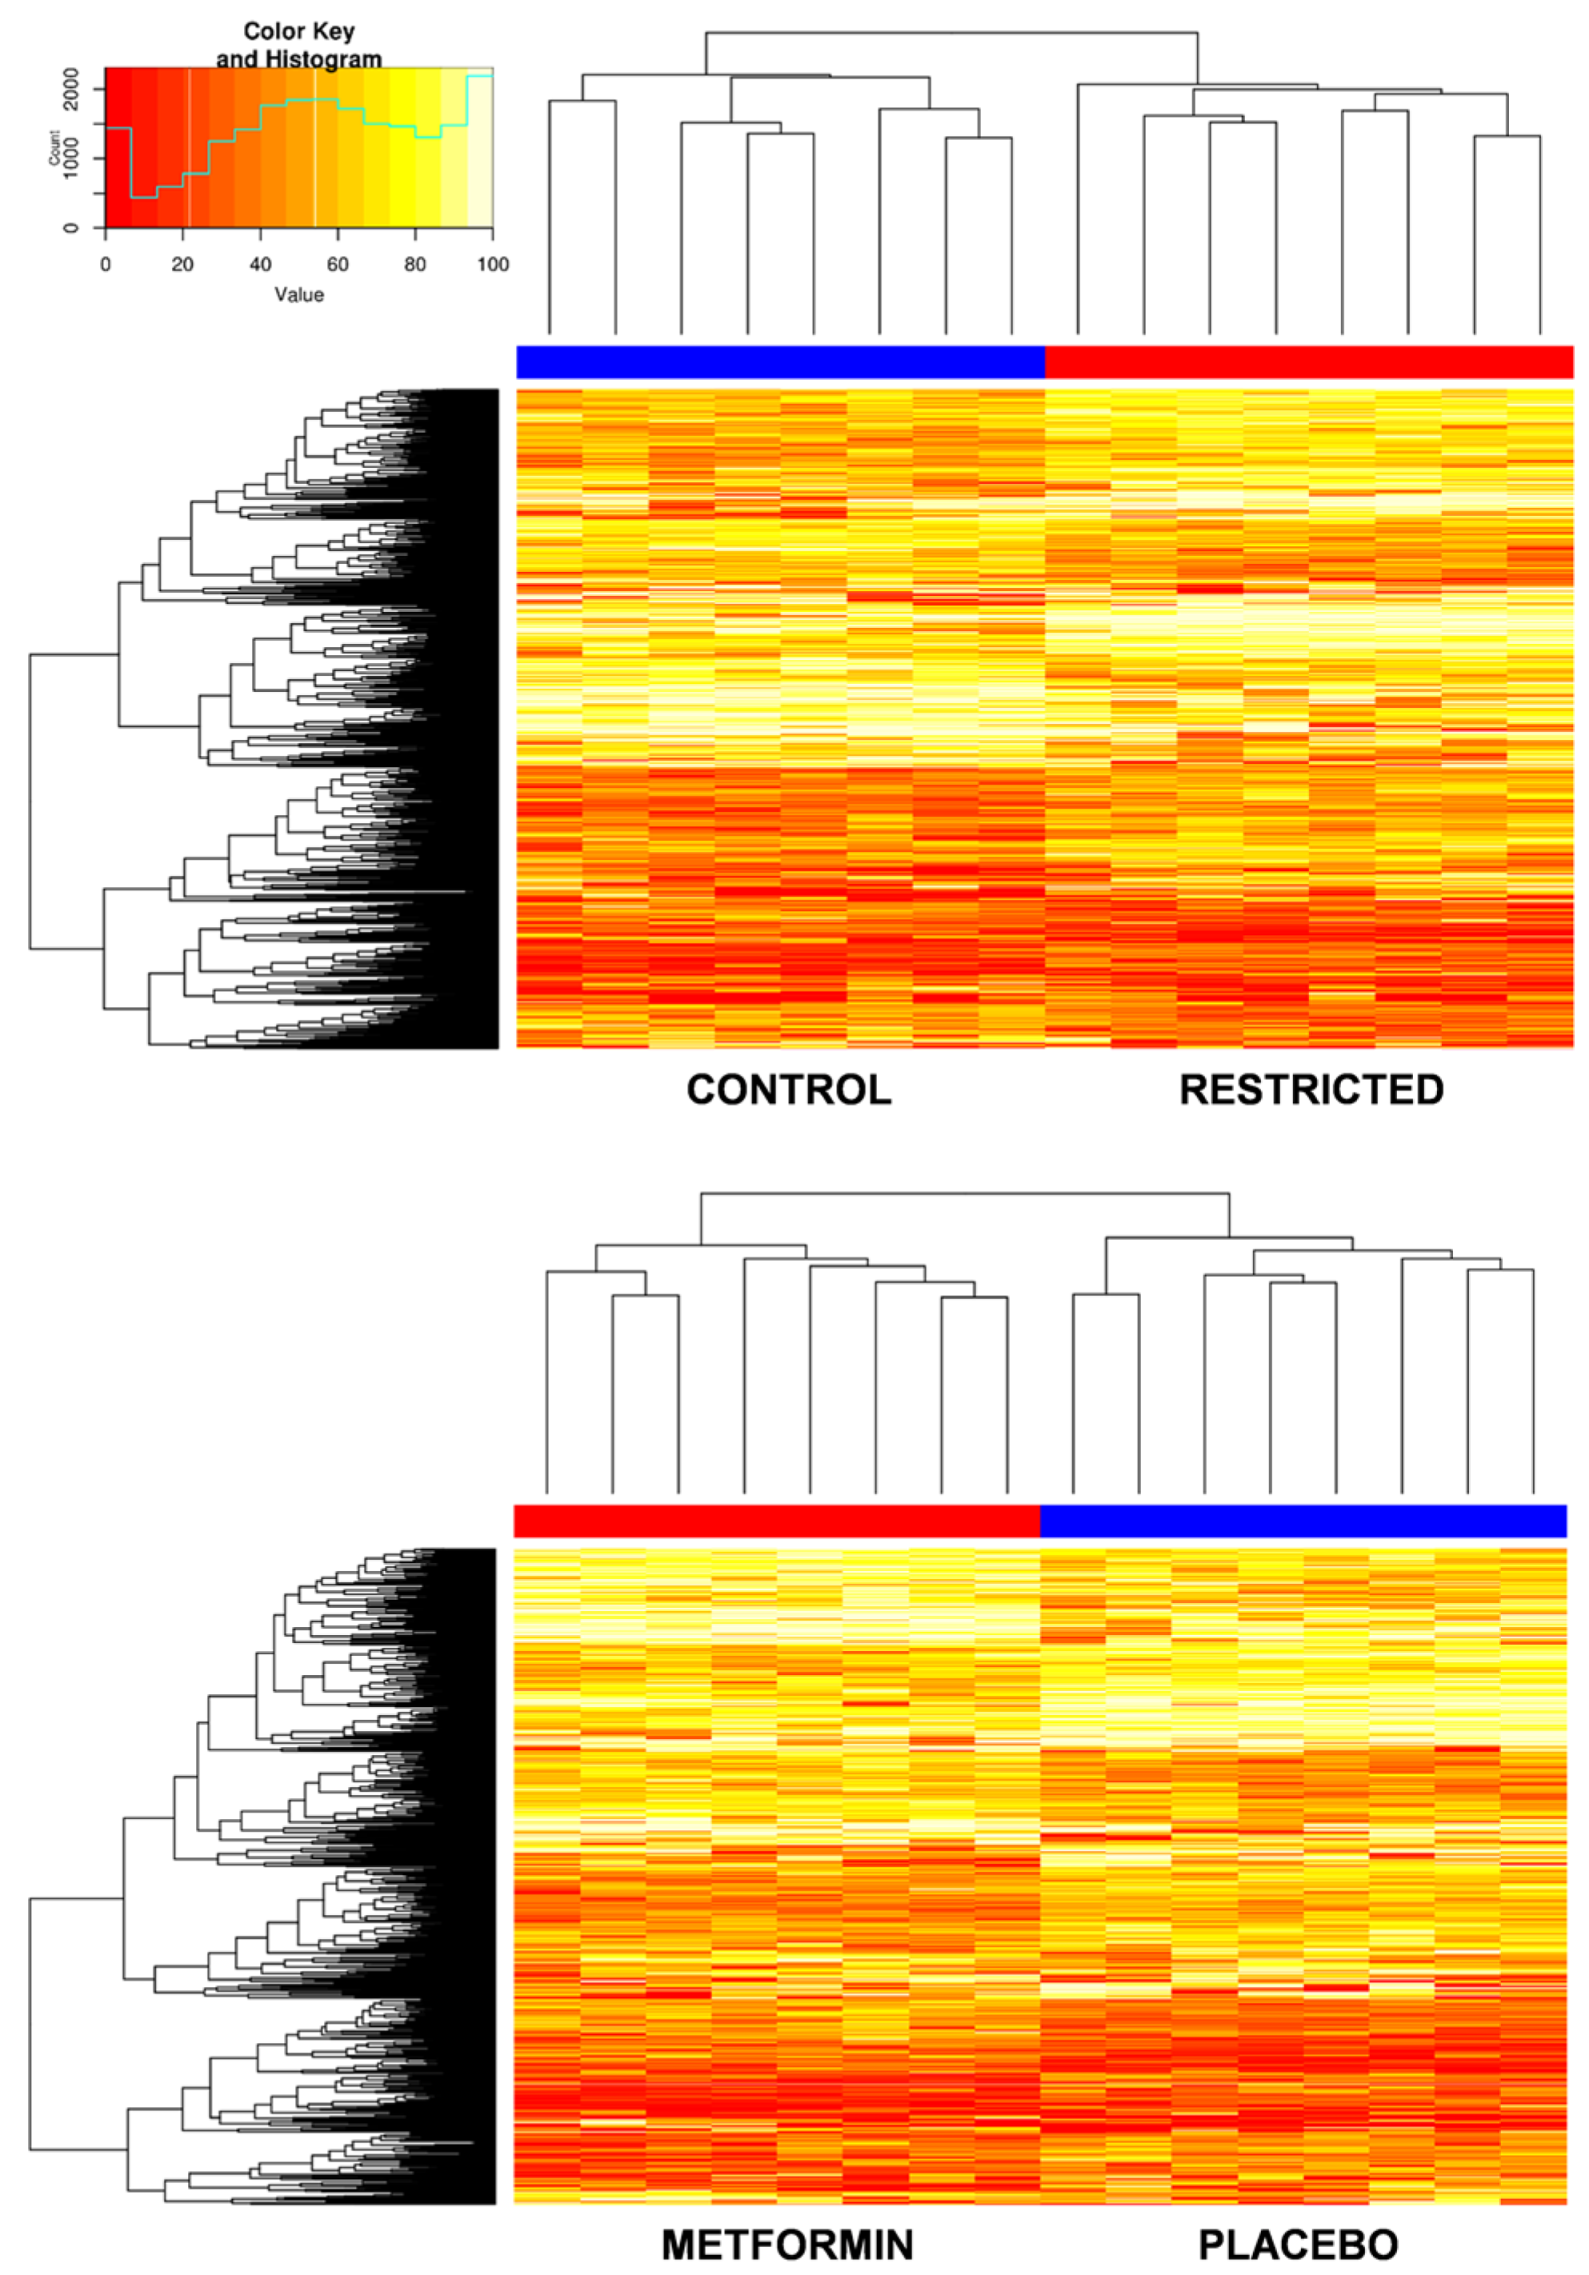
4.5. Whole Methylome Analysis
4.6. Pyrosequencing Analysis
4.7. Gene Expression Analysis
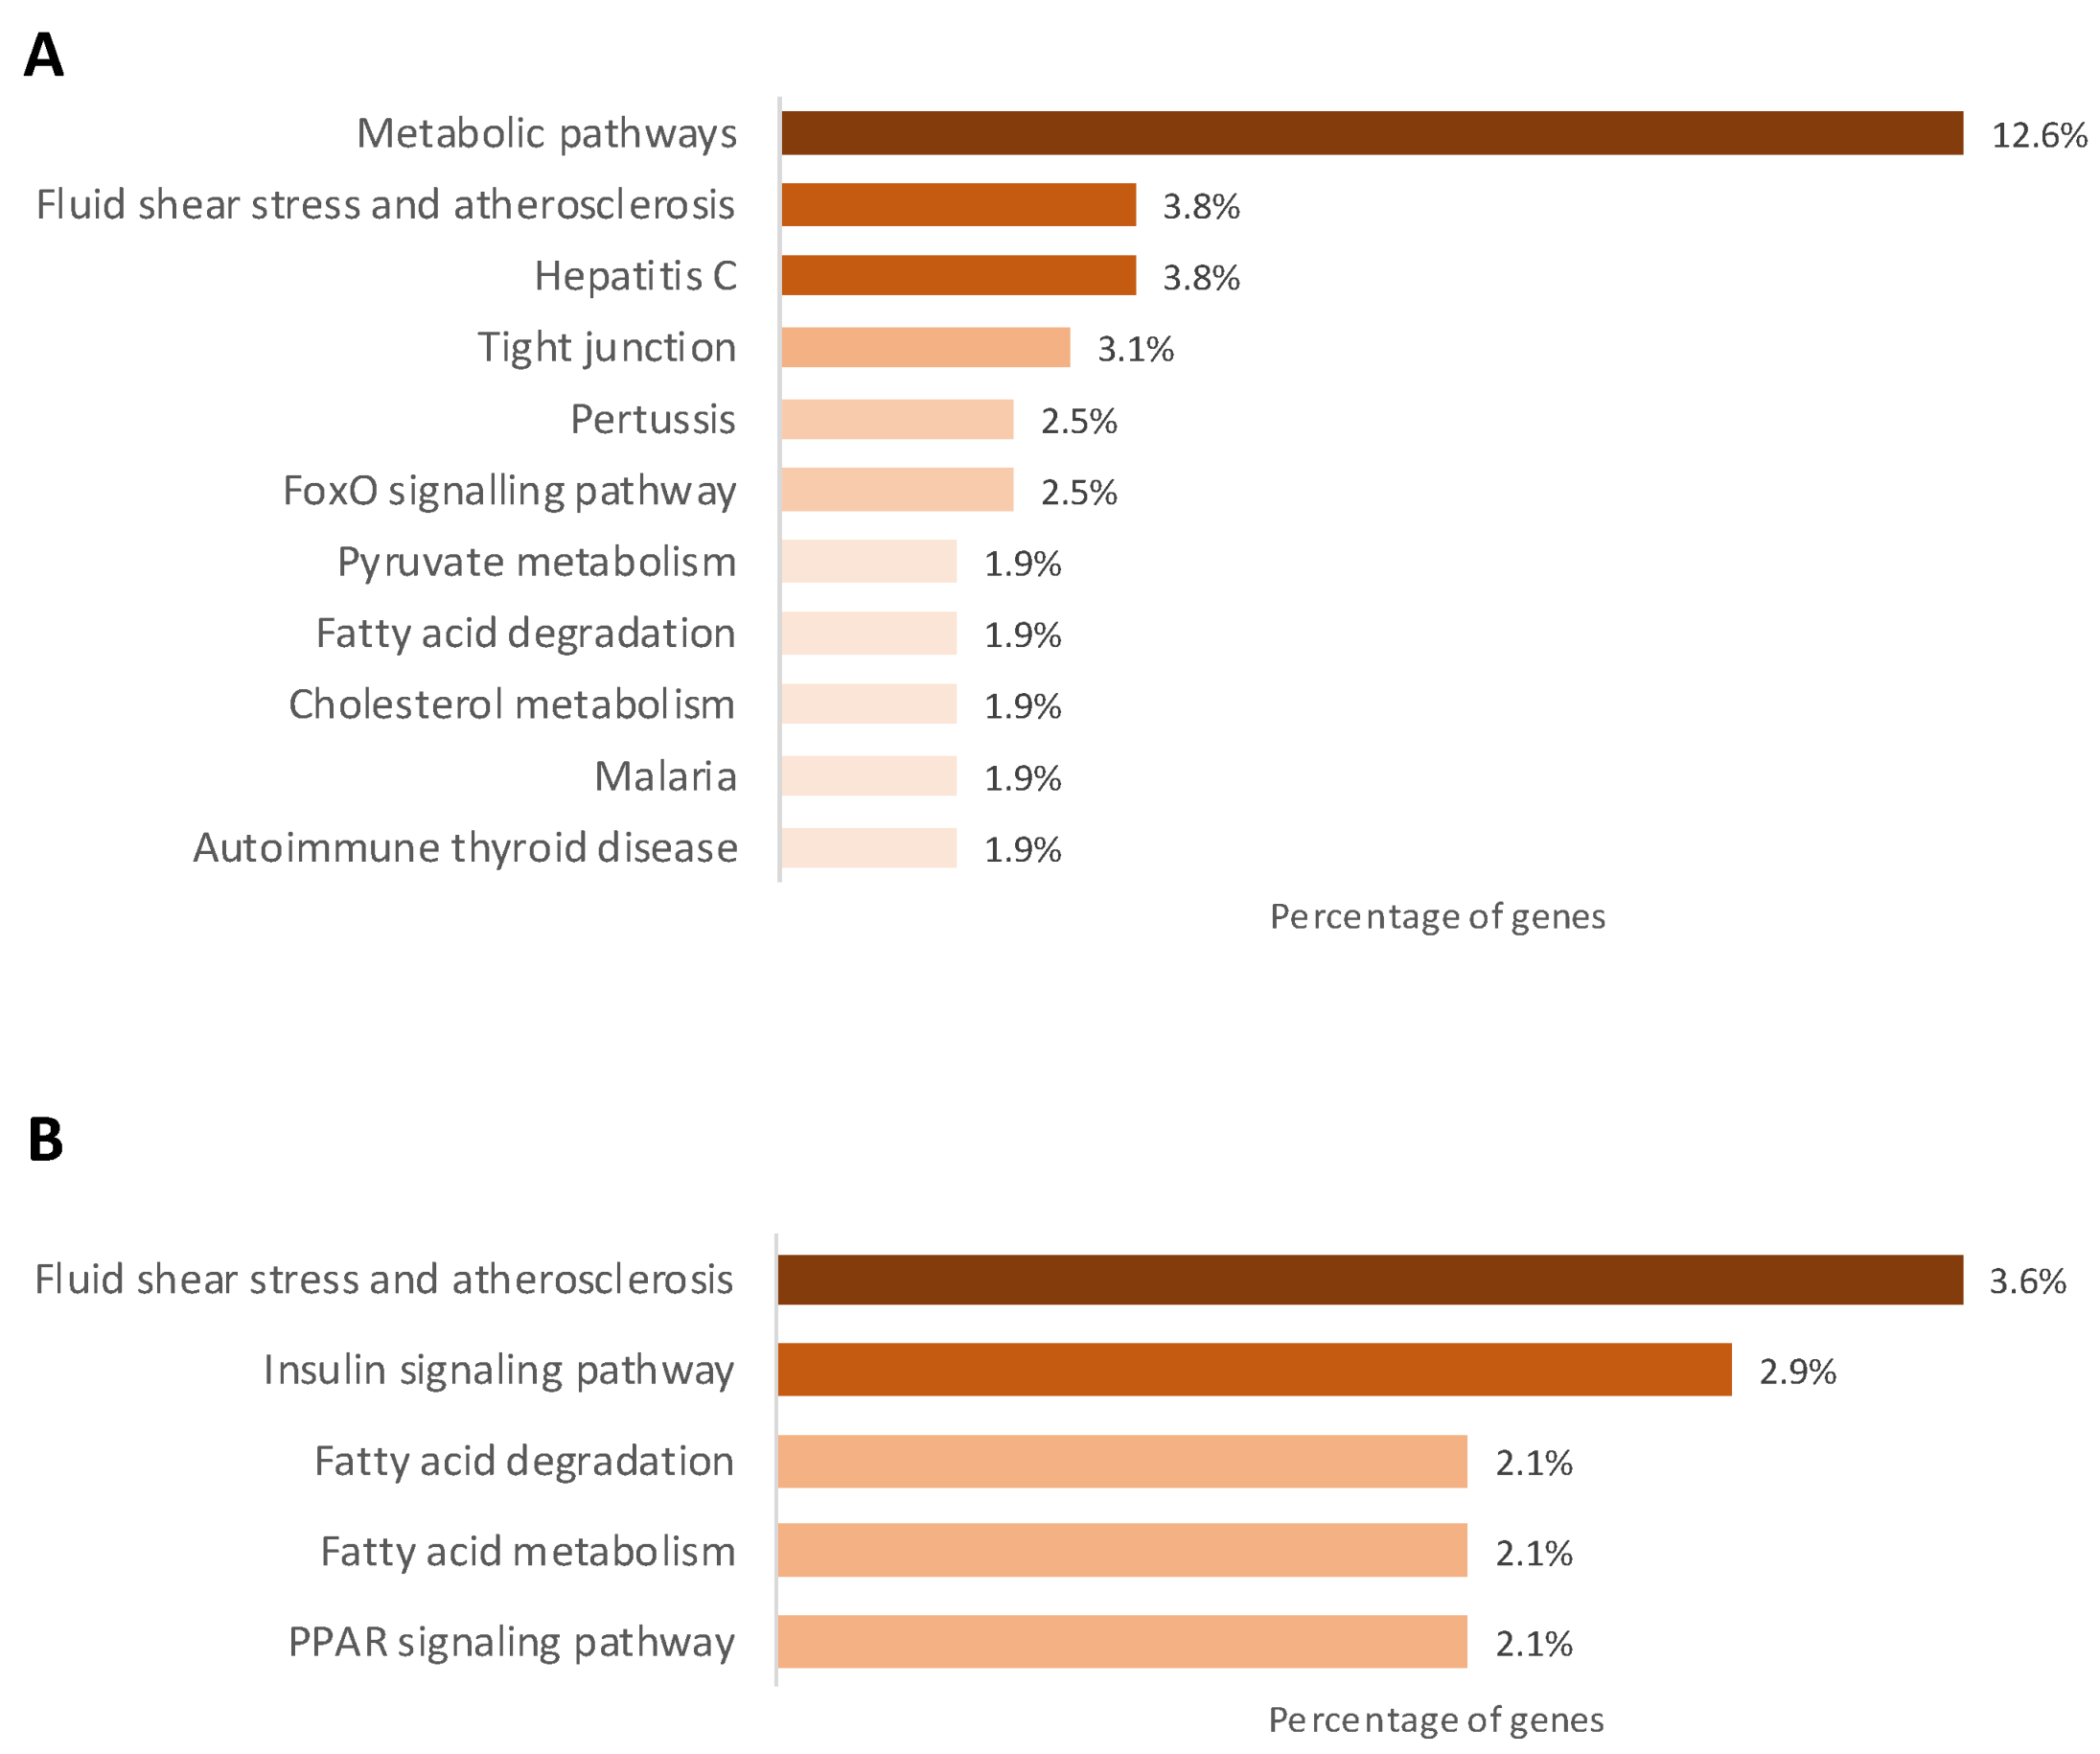
4.8. Statistics and Gene Ontology Analyses
Supplementary Materials
Author Contributions
Funding
Institutional Review Board Statement
Informed Consent Statement
Data Availability Statement
Conflicts of Interest
References
- El Hajj, N.; Schneider, E.; Lehnen, H.; Haaf, T. Epigenetics and life-long consequences of an adverse nutritional and diabetic intrauterine environment. Reproduction 2014, 148, R111–R120. [Google Scholar] [CrossRef] [PubMed]
- Barker, D.J.P.; Hales, C.N.; Fall, C.H.D.; Osmond, C.; Phipps, K.; Clark, P.M.S. Type 2 (non-insulin-dependent) diabetes mellitus, hypertension and hyperlipidaemia (syndrome X): Relation to reduced fetal growth. Diabetologia 1993, 36, 62–67. [Google Scholar] [CrossRef]
- Law, C.; Baird, J. Developmental origins of health and disease: Public-health perspectives. Dev. Orig. Health Dis. 2006, 353, 446–455. [Google Scholar] [CrossRef]
- Lesseur, C.; Chen, J. Adverse Maternal Metabolic Intrauterine Environment and Placental Epigenetics: Implications for Fetal Metabolic Programming. Curr. Environ. Health Rep. 2018, 5, 531–543. [Google Scholar] [CrossRef] [PubMed]
- Harary, D.; Akinyemi, A.; Charron, M.J.; Fuloria, M. Fetal Growth and Intrauterine Epigenetic Programming of Obesity and Cardiometabolic Disease. Neoreviews 2022, 23, e363–e372. [Google Scholar] [CrossRef] [PubMed]
- Poston, L. Maternal obesity, gestational weight gain and diet as determinants of offspring long term health. Best Pract. Res. Clin. Endocrinol. Metab. 2012, 26, 627–639. [Google Scholar] [CrossRef] [PubMed]
- Fall, C.H.D.; Kumaran, K. Metabolic programming in early life in humans. Philos. Trans. R. Soc. B Biol. Sci. 2019, 374, 20180123. [Google Scholar] [CrossRef]
- Lanata, C.M.; Chung, S.A.; Criswell, L.A. DNA methylation 101: What is important to know about DNA methylation and its role in SLE risk and disease heterogeneity. Lupus Sci/ Med. 2018, 25, e000285. [Google Scholar] [CrossRef]
- Ji, Y.; Wu, Z.; Dai, Z.; Wang, X.; Li, J.; Wang, B.; Wu, G. Fetal and neonatal programming of postnatal growth and feed efficiency in swine. J. Anim. Sci. Biotechnol. 2017, 8, 42. [Google Scholar] [CrossRef]
- Agarwal, P.; Morriseau, T.S.; Kereliuk, S.M.; Doucette, C.A.; Wicklow, B.A.; Dolinsky, V.W. Maternal obesity, diabetes during pregnancy and epigenetic mechanisms that influence the developmental origins of cardiometabolic disease in the offspring. Crit. Rev. Clin. Lab. Sci. 2018, 55, 71–101. [Google Scholar] [CrossRef]
- Óvilo, C.; González-Bulnes, A.; Benítez, R.; Ayuso, M.; Barbero, A.; Pérez-Solana, M.L.; Barragán, C.; Astiz, S.; Fernández, A.; López-Bote, C. Prenatal programming in an obese swine model: Sex-related effects of maternal energy restriction on morphology, metabolism and hypothalamic gene expression. Br. J. Nutr. 2014, 111, 735–746. [Google Scholar] [CrossRef] [PubMed]
- Orsso, C.E.; Colin-Ramirez, E.; Field, C.J.; Madsen, K.L.; Prado, C.M.; Haqq, A.M. Adipose tissue development and expansion from the womb to adolescence: An overview. Nutrients 2020, 12, 2735. [Google Scholar] [CrossRef]
- Symonds, M.E.; Mostyn, A.; Pearce, S.; Budge, H.; Stephenson, T. Endocrine and nutritional regulation of fetal adipose tissue development. J. Endocrinol. 2003, 179, 293–299. [Google Scholar] [CrossRef]
- Bispham, J.; Gardner, D.S.; Gnanalingham, M.G.; Stephenson, T.; Symonds, M.E.; Budge, H. Maternal nutritional programming of fetal adipose tissue development: Differential effects on mRNA abundance for uncoupling proteins, peroxisome proliferator activated and prolactin receptors. Endocrinology 2005, 146, 3943–3949. [Google Scholar] [CrossRef] [PubMed]
- McMillen, I.C.; Muhlhausler, B.S.; Duffield, J.A.; Yuen, B.S.J. Prenatal programming of postnatal obesity: Fetal nutrition and the regulation of leptin synthesis and secretion before birth. Proc. Nutr. Soc. 2004, 63, 405–412. [Google Scholar] [CrossRef] [PubMed]
- Nguyen, L.T.; Muhlhausler, B.S.; Botting, K.J.; Morrison, J.L. Maternal undernutrition alters fat cell size distribution, but not lipogenic gene expression, in the visceral fat of the late gestation guinea pig fetus. Placenta 2010, 31, 902–909. [Google Scholar] [CrossRef]
- Soliman, A.; De Sanctis, V.; Alaaraj, N.; Hamed, N. The clinical application of metformin in children and adolescents: A short update. Acta Biomed. 2020, 91, e2020086. [Google Scholar] [CrossRef]
- Rena, G.; Hardie, D.G.; Pearson, E.R. The mechanisms of action of metformin. Diabetologia 2017, 60, 1577–1585. [Google Scholar] [CrossRef]
- Garcia-Contreras, C.; Vazquez-Gomez, M.; Pesantez-Pacheco, J.L.; Torres-Rovira, L.; Heras-Molina, A.; Encinas, T.; Astiz, S.; Gonzalez-Bulnes, A. Maternal metformin treatment improves developmental and metabolic traits of IUGR fetuses. Biomolecules 2019, 9, 166. [Google Scholar] [CrossRef]
- Ibáñez, L.; del Río, L.; Díaz, M.; Sebastiani, G.; Pozo, J.; López-Bermejo, A.; de Zegher, F. Normalizing Ovulation Rate by Preferential Reduction of Hepato-Visceral Fat in Adolescent Girls With Polycystic Ovary Syndrome. J. Adolesc. Health 2017, 61, 446–453. [Google Scholar] [CrossRef]
- Díaz, M.; Bassols, J.; López-Bermejo, A.; de Zegher, F.; Ibáñez, L. Metformin treatment to reduce central adiposity after prenatal growth restraint: A placebo-controlled pilot study in prepubertal children. Pediatr. Diabetes 2015, 16, 538–545. [Google Scholar] [CrossRef] [PubMed]
- Bassols, J.; Martínez-Calcerrada, J.-M.; Osiniri, I.; Díaz-Roldán, F.; Xargay-Torrent, S.; Mas-Parés, B.; Dorado-Ceballos, E.; Prats-Puig, A.; Carreras-Badosa, G.; de Zegher, F.; et al. Effects of metformin administration on endocrine-metabolic parameters, visceral adiposity and cardiovascular risk factors in children with obesity and risk markers for metabolic syndrome: A pilot study. PLoS ONE 2019, 14, e0226303. [Google Scholar] [CrossRef] [PubMed]
- Xargay-Torrent, S.; Mas-Parés, B.; Carreras-Badosa, G.; Lizárraga-Mollinedo, E.; Tibau, J.; Reixach, J.; Platero-Gutierrez, E.; Prats-Puig, A.; De Zegher, F.; Ibáñez, L.; et al. Metabolic programming in the offspring after gestational overfeeding in the mother: Toward neonatal rescuing with metformin in a swine model. Int. J. Obes. 2022, 46, 1018–1026. [Google Scholar] [CrossRef] [PubMed]
- Birsoy, K.; Festuccia, W.T.; Laplante, M. A comparative perspective on lipid storage in animals. J. Cell Sci. 2013, 126, 1541–1552. [Google Scholar] [CrossRef]
- Cheong, J.N.; Wlodek, M.E.; Moritz, K.M.; Cuffe, J.S.M. Programming of maternal and offspring disease: Impact of growth restriction, fetal sex and transmission across generations. J. Physiol. 2016, 594, 4727–4740. [Google Scholar] [CrossRef]
- Neitzke, U.; Harder, T.; Plagemann, A. Intrauterine Growth Restriction and Developmental Programming of the Metabolic Syndrome: A Critical Appraisal. Microcirculation 2011, 18, 304–311. [Google Scholar] [CrossRef]
- Jin, F.; Honma, K.; Mochizuki, K.; Goda, T. Undernutrition in pregnant rats induces glucose intolerance with enhanced expression of inflammation-related genes in peripheral leukocytes of the offspring. J. Nutr. Sci. Vitaminol. 2019, 65, 534–540. [Google Scholar] [CrossRef]
- Williams, L.; Seki, Y.; Delahaye, F.; Cheng, A.; Fuloria, M.; Einstein, F.H.; Charron, M.J. DNA hypermethylation of CD3+ T cells from cord blood of infants exposed to intrauterine growth restriction. Diabetologia 2016, 59, 1714–1723. [Google Scholar] [CrossRef]
- Khanal, P.; Pandey, D.; Ahmad, S.B.; Safayi, S.; Kadarmideen, H.N.; Nielsen, M.O. Differential impacts of late gestational over–and undernutrition on adipose tissue traits and associated visceral obesity risk upon exposure to a postnatal high-fat diet in adolescent sheep. Physiol. Rep. 2020, 8, e14359. [Google Scholar] [CrossRef]
- Nielsen, M.O.; Kongsted, A.H.; Thygesen, M.P.; Strathe, A.B.; Caddy, S.; Quistorff, B.; Jørgensen, W.; Christensen, V.G.; Husted, S.; Chwalibog, A.; et al. Late gestation undernutrition can predispose for visceral adiposity by altering fat distribution patterns and increasing the preference for a high-fat diet in early postnatal life. Br. J. Nutr. 2013, 109, 2098–2110. [Google Scholar] [CrossRef]
- Ou, M.Y.; Zhang, H.; Tan, P.C.; Zhou, S.B.; Li, Q.F. Adipose tissue aging: Mechanisms and therapeutic implications. Cell Death Dis. 2022, 13, 300. [Google Scholar] [CrossRef] [PubMed]
- Szkudelski, T.; Konieczna, K.; Szkudelska, K. Regulatory Effects of Metformin, an Antidiabetic Biguanide Drug, on the Metabolism of Primary Rat Adipocytes. Molecules 2022, 27, 5250. [Google Scholar] [CrossRef]
- Malekpour-Dehkordi, Z.; Teimourian, S.; Nourbakhsh, M.; Naghiaee, Y.; Sharifi, R.; Mohiti-Ardakani, J. Metformin reduces fibrosis factors in insulin resistant and hypertrophied adipocyte via integrin/ERK, collagen VI, apoptosis, and necrosis reduction. Life Sci. 2019, 233, 116682. [Google Scholar] [CrossRef] [PubMed]
- Kulkarni, A.S.; Brutsaert, E.F.; Anghel, V.; Zhang, K.; Bloomgarden, N.; Pollak, M.; Mar, J.C.; Hawkins, M.; Crandall, J.P.; Barzilai, N. Metformin regulates metabolic and nonmetabolic pathways in skeletal muscle and subcutaneous adipose tissues of older adults. Aging Cell 2018, 17, e12723. [Google Scholar] [CrossRef] [PubMed]
- Carlson, Z.; Hafner, H.; Mulcahy, M.; Bullock, K.; Zhu, A.; Bridges, D.; Bernal-Mizrachi, E.; Gregg, B. Lactational metformin exposure programs offspring white adipose tissue glucose homeostasis and resilience to metabolic stress in a sex-dependent manner. Am. J. Physiol. Endocrinol. Metab. 2020, 318, E600–E612. [Google Scholar] [CrossRef] [PubMed]
- Suchacki, K.J.; Thomas, B.J.; Ikushima, Y.M.; Chen, K.-C.; Fyfe, C.; Tavares, A.A.; Sulston, R.J.; Lovdel, A.; Woodward, H.J.; Han, X.; et al. The effects of caloric restriction on adipose tissue and metabolic health are sex-and age-dependent. eLife 2023, 12, e88080. [Google Scholar] [CrossRef] [PubMed]
- Most, J.; Redman, L.M. Impact of calorie restriction on energy metabolism in humans. Exp. Gerontol. 2020, 133, 110875. [Google Scholar] [CrossRef]
- Smith, R.L.; Soeters, M.R.; Wüst, R.C.I.; Houtkooper, R.H. Metabolic flexibility as an adaptation to energy resources and requirements in health and disease. Endocr. Rev. 2018, 39, 489–517. [Google Scholar] [CrossRef]
- Foretz, M.; Guigas, B.; Viollet, B. Metformin: Update on mechanisms of action and repurposing potential. Nat. Rev. Endocrinol. 2023, 19, 460–476. [Google Scholar] [CrossRef]
- Wang, Y.; Ma, C.; Sun, Y.; Li, Y.; Kang, L.; Jiang, Y. Dynamic transcriptome and DNA methylome analyses on longissimus dorsi to identify genes underlying intramuscular fat content in pigs. BMC Genom. 2017, 18, 780. [Google Scholar] [CrossRef]
- Mayas, M.D.; Ortega, F.J.; Macías-González, M.; Bernal, R.; Gómez-Huelgas, R.; Fernández-Real, J.M.; Tinahones, F.J. Inverse relation between FASN expression in human adipose tissue and the insulin resistance level. Nutr. Metab. 2010, 7, 3. [Google Scholar] [CrossRef]
- Grempler, R.; Augustin, R.; Froehner, S.; Hildebrandt, T.; Simon, E.; Mark, M.; Eickelmann, P. Functional characterisation of human SGLT-5 as a novel kidney-specific sodium-dependent sugar transporter. FEBS Lett. 2012, 586, 248–253. [Google Scholar] [CrossRef] [PubMed]
- Fukuzawa, T.; Fukazawa, M.; Ueda, O.; Shimada, H.; Kito, A.; Kakefuda, M.; Kawase, Y.; Wada, N.A.; Goto, C.; Fukushima, N.; et al. SGLT5 Reabsorbs Fructose in the Kidney but Its Deficiency Paradoxically Exacerbates Hepatic Steatosis Induced by Fructose. PLoS ONE 2013, 8, e56681. [Google Scholar] [CrossRef] [PubMed]
- Diederich, J.; Mounkoro, P.; Tirado, H.A.; Chevalier, N.; Van Schaftingen, E.; Veiga-da-Cunha, M. SGLT5 is the renal transporter for 1,5-anhydroglucitol, a major player in two rare forms of neutropenia. Cell. Mol. Life Sci. 2023, 80, 259. [Google Scholar] [CrossRef] [PubMed]
- Minchin, J.E.N.; Dahlman, I.; Harvey, C.J.; Mejhert, N.; Singh, M.K.; Epstein, J.A.; Arner, P.; Torres-Vázquez, J.; Rawls, J.F. Plexin D1 determines body fat distribution by regulating the type V collagen microenvironment in visceral adipose tissue. Proc. Natl. Acad. Sci. USA 2015, 112, 4363–4368. [Google Scholar] [CrossRef]
- Dankel, S.N.; Fadnes, D.J.; Stavrum, A.-K.; Stansberg, C.; Holdhus, R.; Hoang, T.; Veum, V.L.; Christensen, B.J.; Våge, V.; Sagen, J.V.; et al. Switch from stress response to homeobox transcription factors in adipose tissue after profound fat loss. PLoS ONE 2010, 5, e11033. [Google Scholar] [CrossRef]
- Moeschel, K.; Beck, A.; Weigert, C.; Lammers, R.; Kalbacher, H.; Voelter, W.; Schleicher, E.D.; Häring, H.-U.; Lehmann, R. Protein kinase C-ζ-induced phosphorylation of Ser 318 in insulin receptor substrate-1 (IRS-1) attenuates the interaction with the insulin receptor and the tyrosine phosphorylation of IRS-1. J. Biol. Chem. 2004, 279, 25157–25163. [Google Scholar] [CrossRef]
- Zou, L.; Yan, S.; Guan, X.; Pan, Y.; Qu, X. Hypermethylation of the PRKCZ gene in type 2 diabetes mellitus. J. Diabetes Res. 2013, 2013, 721493. [Google Scholar] [CrossRef]
- Poore, K.R.; Hollis, L.J.; Murray, R.J.S.; Warlow, A.; Brewin, A.; Fulford, L.; Cleal, J.K.; Lillycrop, K.A.; Burdge, G.C.; Hanson, M.A.; et al. Differential pathways to adult metabolic dysfunction following poor nutrition at two critical developmental periods in sheep. PLoS ONE 2014, 9, e90994. [Google Scholar] [CrossRef]
- Sreekantha, S.; Wang, Y.; Sakurai, R.; Liu, J.; Rehan, V.K. Maternal food restriction-induced intrauterine growth restriction in a rat model leads to sex-specific adipogenic programming. FASEB J. 2020, 34, 16073–16085. [Google Scholar] [CrossRef]
- Carreras-Badosa, G.; Remesar, X.; Prats-Puig, A.; Xargay-Torrent, S.; Lizarraga-Mollinedo, E.; de Zegher, F.; Ibáñez, L.; Bassols, J.; López-Bermejo, A. Dlk1 expression relates to visceral fat expansion and insulin resistance in male and female rats with postnatal catch-up growth. Pediatr. Res. 2019, 86, 195–201. [Google Scholar] [CrossRef] [PubMed]
- Garcia-Contreras, C.; Vazquez-Gomez, M.; Pesantez-Pacheco, J.L.; Heras-Molina, A.; Encinas, T.; Astiz, S.; Gonzalez-Bulnes, A. The effects of maternal metformin treatment on late prenatal and early postnatal development of the offspring are modulated by sex. Pharmaceuticals 2020, 13, 363. [Google Scholar] [CrossRef]
- Roseboom, T.; de Rooij, S.; Painter, R. The Dutch famine and its long-term consequences for adult health. Early Hum. Dev. 2006, 82, 485–491. [Google Scholar] [CrossRef] [PubMed]
- Joe, A.W.B.; Lin, Y.; Even, Y.; Vogl, A.W.; Rossi, F.M.V. Depot-specific differences in adipogenic progenitor abundance and proliferative response to high-fat diet. Stem Cells 2009, 27, 2563–2570. [Google Scholar] [CrossRef]
- Hu, L.; Liu, Y.; Yan, C.; Peng, X.; Xu, Q.; Xuan, Y.; Han, F.; Tian, G.; Fang, Z.; Lin, Y.; et al. Postnatal nutritional restriction affects growth and immune function of piglets with intra-uterine growth restriction. Br. J. Nutr. 2015, 114, 53–62. [Google Scholar] [CrossRef]
- Koopmans, S.J.; Schuurman, T. Considerations on pig models for appetite, metabolic syndrome and obese type 2 diabetes: From food intake to metabolic disease. Eur. J. Pharmacol. 2015, 759, 231–239. [Google Scholar] [CrossRef] [PubMed]
- Gonzalez-Bulnes, A.; Astiz, S.; Ovilo, C.; Lopez-Bote, C.J.; Sanchez-Sanchez, R.; Perez-Solana, M.L.; Torres-Rovira, L.; Ayuso, M.; Gonzalez, J. Early-postnatal changes in adiposity and lipids profile by transgenerational developmental programming in swine with obesity/leptin resistance. J. Endocrinol. 2014, 223, M17–M29. [Google Scholar] [CrossRef] [PubMed]
- Eusebi, P.G.; González-Prendes, R.; Quintanilla, R.; Tibau, J.; Cardoso, T.F.; Clop, A.; Amills, M. A genome-wide association analysis for carcass traits in a commercial Duroc pig population. Anim. Genet. 2017, 48, 466–469. [Google Scholar] [CrossRef]
- Barbero, A.; Astiz, S.; Lopez-Bote, C.J.; Perez-Solana, M.L.; Ayuso, M.; Garcia-Real, I.; Gonzalez-Bulnes, A. Maternal Malnutrition and Offspring Sex Determine Juvenile Obesity and Metabolic Disorders in a Swine Model of Leptin Resistance. PLoS ONE 2013, 8, e78424. [Google Scholar] [CrossRef]
- Huang, D.W.; Sherman, B.T.; Lempicki, R.A. Systematic and integrative analysis of large gene lists using DAVID bioinformatics resources. Nat. Protoc. 2009, 4, 44–57. [Google Scholar] [CrossRef]

| Control | Underfed | Two-Way ANOVA for Interaction | Gestational Caloric Restriction | Metformin Treatment | |||
|---|---|---|---|---|---|---|---|
| Vehicle N = 16 | Metformin N = 16 | Vehicle N = 16 | Metformin N = 16 | ||||
| Morphometry | p-value | p-value | p-value | ||||
| Birth weight (Kg) | 1.67 ± 0.3 | 1.68 ± 0.2 | - | 0.890 | - | ||
| Weight (kg) | 7.91 ± 1.3 | 7.06± 1.3 | 7.12± 1.4 | 7.46 ± 1.6 | 0.093 | 0.572 | 0.477 |
| Weight gain since birth (kg) | 6.24 ± 1.3 | 5.39± 1.3 | 5.49± 1.3 | 5.81 ± 1.4 | 0.082 | 0.636 | 0.440 |
| Abdominal circumference (cm) | 34.59 ± 2.7 | 32.93 ± 3.2 | 33.06± 2.3 | 33.94 ± 2.6 | 0.064 | 0.610 | 0.636 |
| Dorsal fat thickness (cm) | 0.38 ± 0.12 | 0.37 ± 0.10 | 0.36± 0.07 | 0.37 ± 0.12 | 0.781 | 0.887 | 0.732 |
| Metabolic | |||||||
| Glucose (mg/dL) | 301.06 ± 123.1 | 332.56± 147.8 | 314.19± 86.3 | 282.13 ± 88.9 | 0.271 | 0.518 | 0.992 |
| Insulin (mU/L) | 0.87 ± 0.1 | 0.85 ± 0.1 | 0.89 ± 0.1 | 0.84 ± 0.1 | 0.550 | 0.904 | 0.195 |
| HOMA-IR | 0.64 ± 0.3 | 0.70 ± 0.3 | 0.70 ± 0.3 | 0.59 ± 0.2 | 0.266 | 0.994 | 0.562 |
| Fructosamine (µM) | 296.81 ± 25.0 | 271.50 ± 19.9 | 329.47 ± 60.0 | 324.14 ± 34.8 | 0.163 | <0.001 | 0.094 |
| Total cholesterol (mg/dL) | 189.00 ± 44.8 | 167.75 ± 46.6 | 211.31 ± 92.5 | 227.50 ± 70.8 | 0.152 | 0.030 | 0.869 |
| HDL-cholesterol (mg/dL) | 63.81 ± 10.8 | 58.63 ± 7.0 | 60.00 ± 13.8 | 64.69 ± 14.3 | 0.101 | 0.709 | 0.934 |
| Triglycerides (mg/dL) | 100.63 ± 40.4 | 116.25 ± 35.7 | 97.81 ± 31.4 | 108.69 ± 49.8 | 0.561 | 0.670 | 0.169 |
| C-reactive protein (mg/L) | 0.007 ± 0.002 | 0.007 ± 0.002 | 0.011 ± 0.003 | 0.012 ± 0.004 | 0.753 | <0.001 | 0.731 |
| HMW adiponectin (mg/L) | 1.07 ± 0.2 | 1.06 ± 0.2 | 0.88 ± 0.3 | 0.85 ± 0.1 | 0.921 | <0.001 | 0.691 |
| Adipose Tissue | |||||||
| Adipocyte area (µm) | 1316.56 ± 267.1 | 1109.00 ± 365.1 | 1273.63 ± 258.8 | 1074.94 ± 282.4 | 0.952 | 0.602 | 0.008 |
| Adipocyte perimeter (µm) | 135.88 ± 14.9 | 123.81 ± 22.3 | 134.69 ± 13.2 | 123.69 ± 17.3 | 0.903 | 0.870 | 0.009 |
| Adipocyte diameter (µm) | 37.69 ± 5.1 | 33.69 ± 5.3 | 37.50 ± 4.1 | 34.44 ± 5.3 | 0.707 | 0.820 | 0.006 |
| TNF-α expression | 0.006 ± 0.004 | 0.005 ± 0.003 | 0.007 ± 0.005 | 0.016 ± 0.024 | 0.132 | 0.017 | 0.277 |
| IL6 expression | 0.010 ± 0.010 | 0.009 ± 0.007 | 0.011 ± 0.009 | 0.010 ± 0.006 | 0.523 | 0.434 | 0.777 |
| CCL2 expression | 0.23 ± 0.1 | 0.29 ± 0.2 | 0.42 ± 0.3 | 0.45 ± 0.3 | 0.792 | 0.002 | 0.424 |
| INSR expression | 0.62 ± 0.3 | 0.66 ± 0.3 | 0.71 ± 0.4 | 0.87 ± 0.4 | 0.503 | 0.198 | 0.259 |
| IRS1 expression | 0.37 ± 0.2 | 0.34 ± 0.2 | 0.41 ± 0.2 | 0.44 ± 0.2 | 0.573 | 0.108 | 0.947 |
| Control | Underfed | Two-Way ANOVA for Interaction | Gestational Caloric Restriction | Metformin | |||
|---|---|---|---|---|---|---|---|
| Vehicle N = 16 | Metformin N = 16 | Vehicle N = 16 | Metformin N = 16 | p-Value | p-Value | ||
| Methylation | |||||||
| FASN | 11.95± 10.9 | 11.50 ± 11.5 | 20.57 ± 13.8 | 15.43 ± 10.8 | 0.712 | 0.043 | 0.586 |
| SLC5A10 | 37.51 ± 17.8 | 38.67 ± 29.9 | 55.73 ± 27.9 | 56.35 ± 29.1 | 0.652 | 0.032 | 0.575 |
| COL5A1 | 61.16 ± 4.2 | 60.44 ± 3.4 | 60.97 ± 2.8 | 61.41 ± 3.9 | 0.536 | 0.685 | 0.892 |
| PRKCZ | 28.02 ± 5.9 | 30.04 ± 2.9 | 29.07 ± 3.2 | 29.87 ± 4.9 | 0.795 | 0.727 | 0.209 |
| Gene Expression | |||||||
| FASN | 0.69 ± 0.7 | 0.87 ± 0.6 | 0.47 ± 0.3 | 0.45 ± 0.3 | 0.319 | 0.018 | 0.396 |
| SLC5A10 | 0.012 ± 0.007 | 0.013 ± 0.007 | 0.013 ± 0.007 | 0.013 ± 0.007 | 0.663 | 0.861 | 0.821 |
| COL5A1 | 2.46 ± 1.1 | 2.57 ± 0.9 | 2.90 ± 1.2 | 2.53 ± 0.8 | 0.323 | 0.401 | 0.861 |
| PRKCZ | 0.010 ± 0.009 | 0.011 ± 0.009 | 0.005 ± 0.003 | 0.006 ± 0.006 | 0.864 | 0.003 | 0.439 |
| Underfed | ||||||||
|---|---|---|---|---|---|---|---|---|
| FASN Methylation | FASN Gene Expression | SLC5A10 Methylation | SLC5A10 Gene Expression | COL5A1 Methylation | COL5A1 Gene Expression | PRKCZ Methylation | PRKCZ Gene Expression | |
| Morphometry | ||||||||
| Birth weight | −0.034 | −0.150 | −0.563 ** | −0.153 | −0.395 * | −0.455 ** | 0.266 | −0.029 |
| Weight | 0.528 * | −0.260 | −0.320 | −0.423 * | −0.203 | −0.435 * | 0.036 | 0.005 |
| Weight gain since birth | 0.588 ** | −0.267 | −0.217 | −0.459 ** | −0.147 | −0.388 * | 0.001 | 0.012 |
| Abdominal circumference | 0.447 * | −0.254 | −0.026 | −0.257 | −0.192 | −0.167 | −0.075 | 0.055 |
| Dorsal fat thickness | 0.542 ** | −0.367 * | −0.001 | −0.558 *** | −0.208 | −0.337 | −0.090 | −0.201 |
| Metabolic Markers | ||||||||
| Glucose | 0.250 | −0.220 | 0.052 | −0.309 | −0.002 | 0.104 | 0.024 | 0.016 |
| Insulin | −0.227 | 0.006 | −0.213 | −0.115 | −0.135 | −0.026 | −0.055 | −0.012 |
| HOMA-IR | 0.124 | −0.201 | −0.052 | −0.304 | −0.067 | 0.036 | 0.043 | −0.036 |
| Fructosamine | 0.215 | −0.218 | −0.037 | −0.595 *** | −0.274 | −0.374 * | −0.007 | −0.315 |
| Total cholesterol | 0.199 | 0.154 | 0.289 | −0.192 | 0.414* | 0.103 | −0.223 | 0.337 |
| HDL-cholesterol | 0.141 | 0.242 | 0.384 * | 0.222 | 0.388* | 0.634 *** | −0.432 * | 0.420 * |
| Triglycerides | −0.208 | −0.149 | 0.204 | 0.184 | −0.173 | −0.347 | −0.134 | 0.065 |
| C-reactive protein | 0.017 | 0.055 | −0.270 | −0.276 | −0.341 | −0.337 | 0.424 * | −0.335 |
| HMW adiponectin | −0.123 | 0.267 | −0.149 | 0.463 ** | 0.080 | 0.170 | −0.147 | 0.264 |
| Gene Expression in the Adipose Tissue | ||||||||
| TNFA expression | −0.028 | −0.014 | 0.061 | −0.088 | 0.329 | 0.122 | −0.063 | 0.288 |
| IL6 expression | −0.147 | −0.015 | 0.073 | −0.209 | 0.102 | 0.075 | −0.201 | 0.052 |
| CCL2 expression | −0.149 | 0.177 | −0.028 | 0.109 | 0.036 | 0.240 | −0.335 | 0.267 |
| INSR expression | −0.261 | 0.043 | 0.390 * | 0.077 | 0.454 * | 0.291 | −0.356 * | 0.456 ** |
| IRS1 expression | −0.249 | 0.002 | 0.213 | 0.097 | 0.333 | 0.355 * | −0.378 * | 0.264 |
Disclaimer/Publisher’s Note: The statements, opinions and data contained in all publications are solely those of the individual author(s) and contributor(s) and not of MDPI and/or the editor(s). MDPI and/or the editor(s) disclaim responsibility for any injury to people or property resulting from any ideas, methods, instructions or products referred to in the content. |
© 2024 by the authors. Licensee MDPI, Basel, Switzerland. This article is an open access article distributed under the terms and conditions of the Creative Commons Attribution (CC BY) license (https://creativecommons.org/licenses/by/4.0/).
Share and Cite
Mas-Parés, B.; Xargay-Torrent, S.; Carreras-Badosa, G.; Gómez-Vilarrubla, A.; Niubó-Pallàs, M.; Tibau, J.; Reixach, J.; Prats-Puig, A.; de Zegher, F.; Ibañez, L.; et al. Gestational Caloric Restriction Alters Adipose Tissue Methylome and Offspring’s Metabolic Profile in a Swine Model. Int. J. Mol. Sci. 2024, 25, 1128. https://doi.org/10.3390/ijms25021128
Mas-Parés B, Xargay-Torrent S, Carreras-Badosa G, Gómez-Vilarrubla A, Niubó-Pallàs M, Tibau J, Reixach J, Prats-Puig A, de Zegher F, Ibañez L, et al. Gestational Caloric Restriction Alters Adipose Tissue Methylome and Offspring’s Metabolic Profile in a Swine Model. International Journal of Molecular Sciences. 2024; 25(2):1128. https://doi.org/10.3390/ijms25021128
Chicago/Turabian StyleMas-Parés, Berta, Sílvia Xargay-Torrent, Gemma Carreras-Badosa, Ariadna Gómez-Vilarrubla, Maria Niubó-Pallàs, Joan Tibau, Josep Reixach, Anna Prats-Puig, Francis de Zegher, Lourdes Ibañez, and et al. 2024. "Gestational Caloric Restriction Alters Adipose Tissue Methylome and Offspring’s Metabolic Profile in a Swine Model" International Journal of Molecular Sciences 25, no. 2: 1128. https://doi.org/10.3390/ijms25021128
APA StyleMas-Parés, B., Xargay-Torrent, S., Carreras-Badosa, G., Gómez-Vilarrubla, A., Niubó-Pallàs, M., Tibau, J., Reixach, J., Prats-Puig, A., de Zegher, F., Ibañez, L., Bassols, J., & López-Bermejo, A. (2024). Gestational Caloric Restriction Alters Adipose Tissue Methylome and Offspring’s Metabolic Profile in a Swine Model. International Journal of Molecular Sciences, 25(2), 1128. https://doi.org/10.3390/ijms25021128


