Article

Inert Gas Mild Pressure Action on Healthy Humans: The “IPA” Study

1
Environmental, Occupational, Aging (Integrative) Physiology Laboratory, Haute Ecole Bruxelles-Brabant (HE2B), 1160 Brussels, Belgium
2
Anatomical Research and Clinical Studies, Vrije Universiteit Brussels (VUB), 1090 Brussels, Belgium
3
DAN Europe Research Division (Roseto-Brussels), 1160 Brussels, Belgium
4
Physical Activity Teaching Unit, Motor Sciences Department, Université Libre de Bruxelles (ULB), 1050 Brussels, Belgium
5
Institute of Clinical Physiology-National Research Council (CNR-IFC), 20142 Milano, Italy
6
Department of Biomedical Sciences, University of Padova, 35131 Padova, Italy
7
Department of Emergency Medicine, School of Medicine, University of Maryland, Baltimore, MD 21250, USA
*
Author to whom correspondence should be addressed.
Int. J. Mol. Sci. 2024, 25(22), 12067; https://doi.org/10.3390/ijms252212067
Submission received: 8 October 2024 / Revised: 5 November 2024 / Accepted: 8 November 2024 / Published: 10 November 2024
(This article belongs to the Section Molecular Biology)

Abstract

:
The goal of this study was to evaluate inflammatory and oxidative stress responses in human subjects (9 females and 15 males) (age [29.6 ± 11.5 years old (mean ± SD)], height [172.0 ± 10.05 cm], and weight [67.8 ± 12.4 kg]) exposed to 1.45 ATA of helium (He) or nitrogen (N2) without concurrent hyperoxia. We hypothesized that elevated gas pressures would elicit an inflammatory response concurrent with oxidative stress. Consistent with ex vivo studies, both gasses elicited neutrophil activation, small elevations in microparticles (MPs) and increases in intra-MP interleukin (IL)-1β and inflammatory nitric oxide synthase, and an increase in urinary IL-6 concurrent with a marked reduction in plasma gelsolin. Mixed responses indictive of oxidative stress, with some biomarker elevations but little change in others and a decrease in some, were observed. Overall, these results demonstrate that exposure to typical diving gasses at a mildly elevated partial pressure will initiate inflammatory responses, which may play a significant role in decompression sickness (DCS). The complex pattern of oxidative stress responses may be indicative of competing systemic reactions and sampling different body fluids.

1. Introduction

Scuba diving is a common and relatively safe activity performed all around the world. Decompression sickness (DCS) is one of the related dangers that takes place after a rapid decrease in ambient pressure [1,2]. Decompression sickness symptoms are experienced upon ascending from underwater dives but also in other environmental changes, such as high-altitude flying and spacecraft extravehicular activity [3,4]. While rarely fatal, symptoms include central nervous system involvement and vestibular, pulmonary, tegmental [5], and muscoloskeletal disorders [6,7,8].
The occurrence of DCS is traditionally attributed to the accumulation of inert gas in the tissues while breathing at depth (higher partial pressure) and its inadequate release within safe decompression limits to form gas bubbles [9,10,11].
Vascular gas emboli (VGE) are commonly encountered after diving without eliciting symptoms. These originate from supersaturated tissue and pre-existing micronuclei that permit bubbles to be developed and whose population can change, thus altering the propensity for bubble formation [12,13,14,15].
VGE detected by ultrasound are inconsistently present in humans suffering from DCS. This has led to investigations that have added an inflammatory component to DCS pathophysiology and to the nucleation of VGE. The development of “second-generation micronuclei” has been proposed to be responsible for VGE [16,17,18]. A body of work implicates a subset of extracellular vesicles (EVs) with 0.1 to 1 µm microparticles (MPs) that are elevated in humans and rodent models exposed to high gas pressure that rises further after decompression, and some contain a gas phase that could serve as gas cavitation nuclei for gas diffusing from supersaturated tissues [19,20,21,22,23,24,25,26,27,28]. MPs initiate a systemic inflammatory response related to neutrophil activation [26,29,30,31]. Inflammatory MP production is an oxidative stress response triggered by gasses associated with diving, and it is higher with nitrogen compared to helium [32,33,34], the two inert gasses most commonly breathed [35].
While both in vitro and in vivo models have been used to assess cellular responses to pressure changes and bubble nucleation, they fail to account for the role of dissolved gasses in a physiologically relevant manner, and they have never been used at “mild” or nominal pressures where inflammatory events have been documented [36,37]. In our previous work, we analyzed oxidative stress responses while breathing oxygen and during deep diving [16,17,38]. In the current study, we wanted to further investigate the pressure and inert gas effects on oxidative stress and MP production at a mild pressure exposure of 1.45 ATA and under normoxic conditions following a profile previously investigated by our group [39,40,41].
This study couples assessments of MPs and neutrophil activation with evaluations of other biomarkers since it is well accepted that breathing oxygen at a hyperbaric pressure can lead to an increase in reactive oxygen species (ROS) [39,42]. This can result in the conditions of oxidative stress and “oxyinflammation” [43,44,45]. An excess of free radical generation that exceeds antioxidant defenses may damage biological macromolecules, including lipids, proteins, and nucleic acids. The accumulation of oxidative damage can alter health status [46], compromising immune system efficacy and inducing an inflammatory response [47].
For example, the release of 8-isoprostanes detected in scuba divers [48] is derived from the ROS-catalyzed peroxidation of unsaturated fatty acids and is used as an index of lipid peroxidation [49,50]. ROS-mediated damage to DNA is measurable as 8-oxo-7,8-dihydro-deoxyguanosine (8-OH-dG) and was detected to be increased after short hyperbaric oxygen exposure in divers that performed dives in both warm [48] and cold water [51]. In addition to ROS, an increase in nitric oxide (NO), a signaling molecule involved in the response to a hyperbaric environment [52], can occur during diving, as reported by some authors that observed remarkable increases in the plasma NO derivatives nitrate and nitrite (NOx) during a dive at a 40 m depth [53].
It is well known that scuba divers can activate endogenous antioxidant defenses [43,53,54,55] that can protect biological macromolecules from excessive antioxidant depletion and oxidative stress during a dive. However, a consequence of oxidative dysbaric stress is increased circulating inflammatory cytokines, including interleukins (IL-1β and IL-6), which activate the inflammation cascade [37,38,56]. ROS can also stimulate the expression of several inflammation-related genes of IL-6 [57]. For this reason, changes in pro-inflammatory factors, including tumor necrosis factor-alpha (TNF-α) [58], IL-1β [38], and IL-6, are expected to occur during the progression of dysbaric stress to overt decompression sickness (DCS) [59]. One additional biomarker of oxidative stress is neopterin, [60,61,62] which reflects an increase in purine metabolism that can activate cell-mediated immunity [63].
The goal of this work was to improve our understanding of cellular responses to the hyperbaric environment by separating the increased partial pressure of oxygen from the partial pressure of the so-called “inert gas”. Although many studies on oxygen levels and oxidative stress have been published from several authors, little is known to appreciate to what extend inert gasses may be part of this process, especially at moderate pressure levels [64]. Given that we know that elevated pressures of nitrogen and gasses such as helium and argon activate leukocytes via an oxidative stress process that triggers MP production [35,65], we investigated inflammatory and oxidative stress responses of mild-pressure exposure to 1.45 ATA nitrogen or helium while controlling oxygen partial pressure to just 0.21 ATA in healthy volunteers.

2. Results

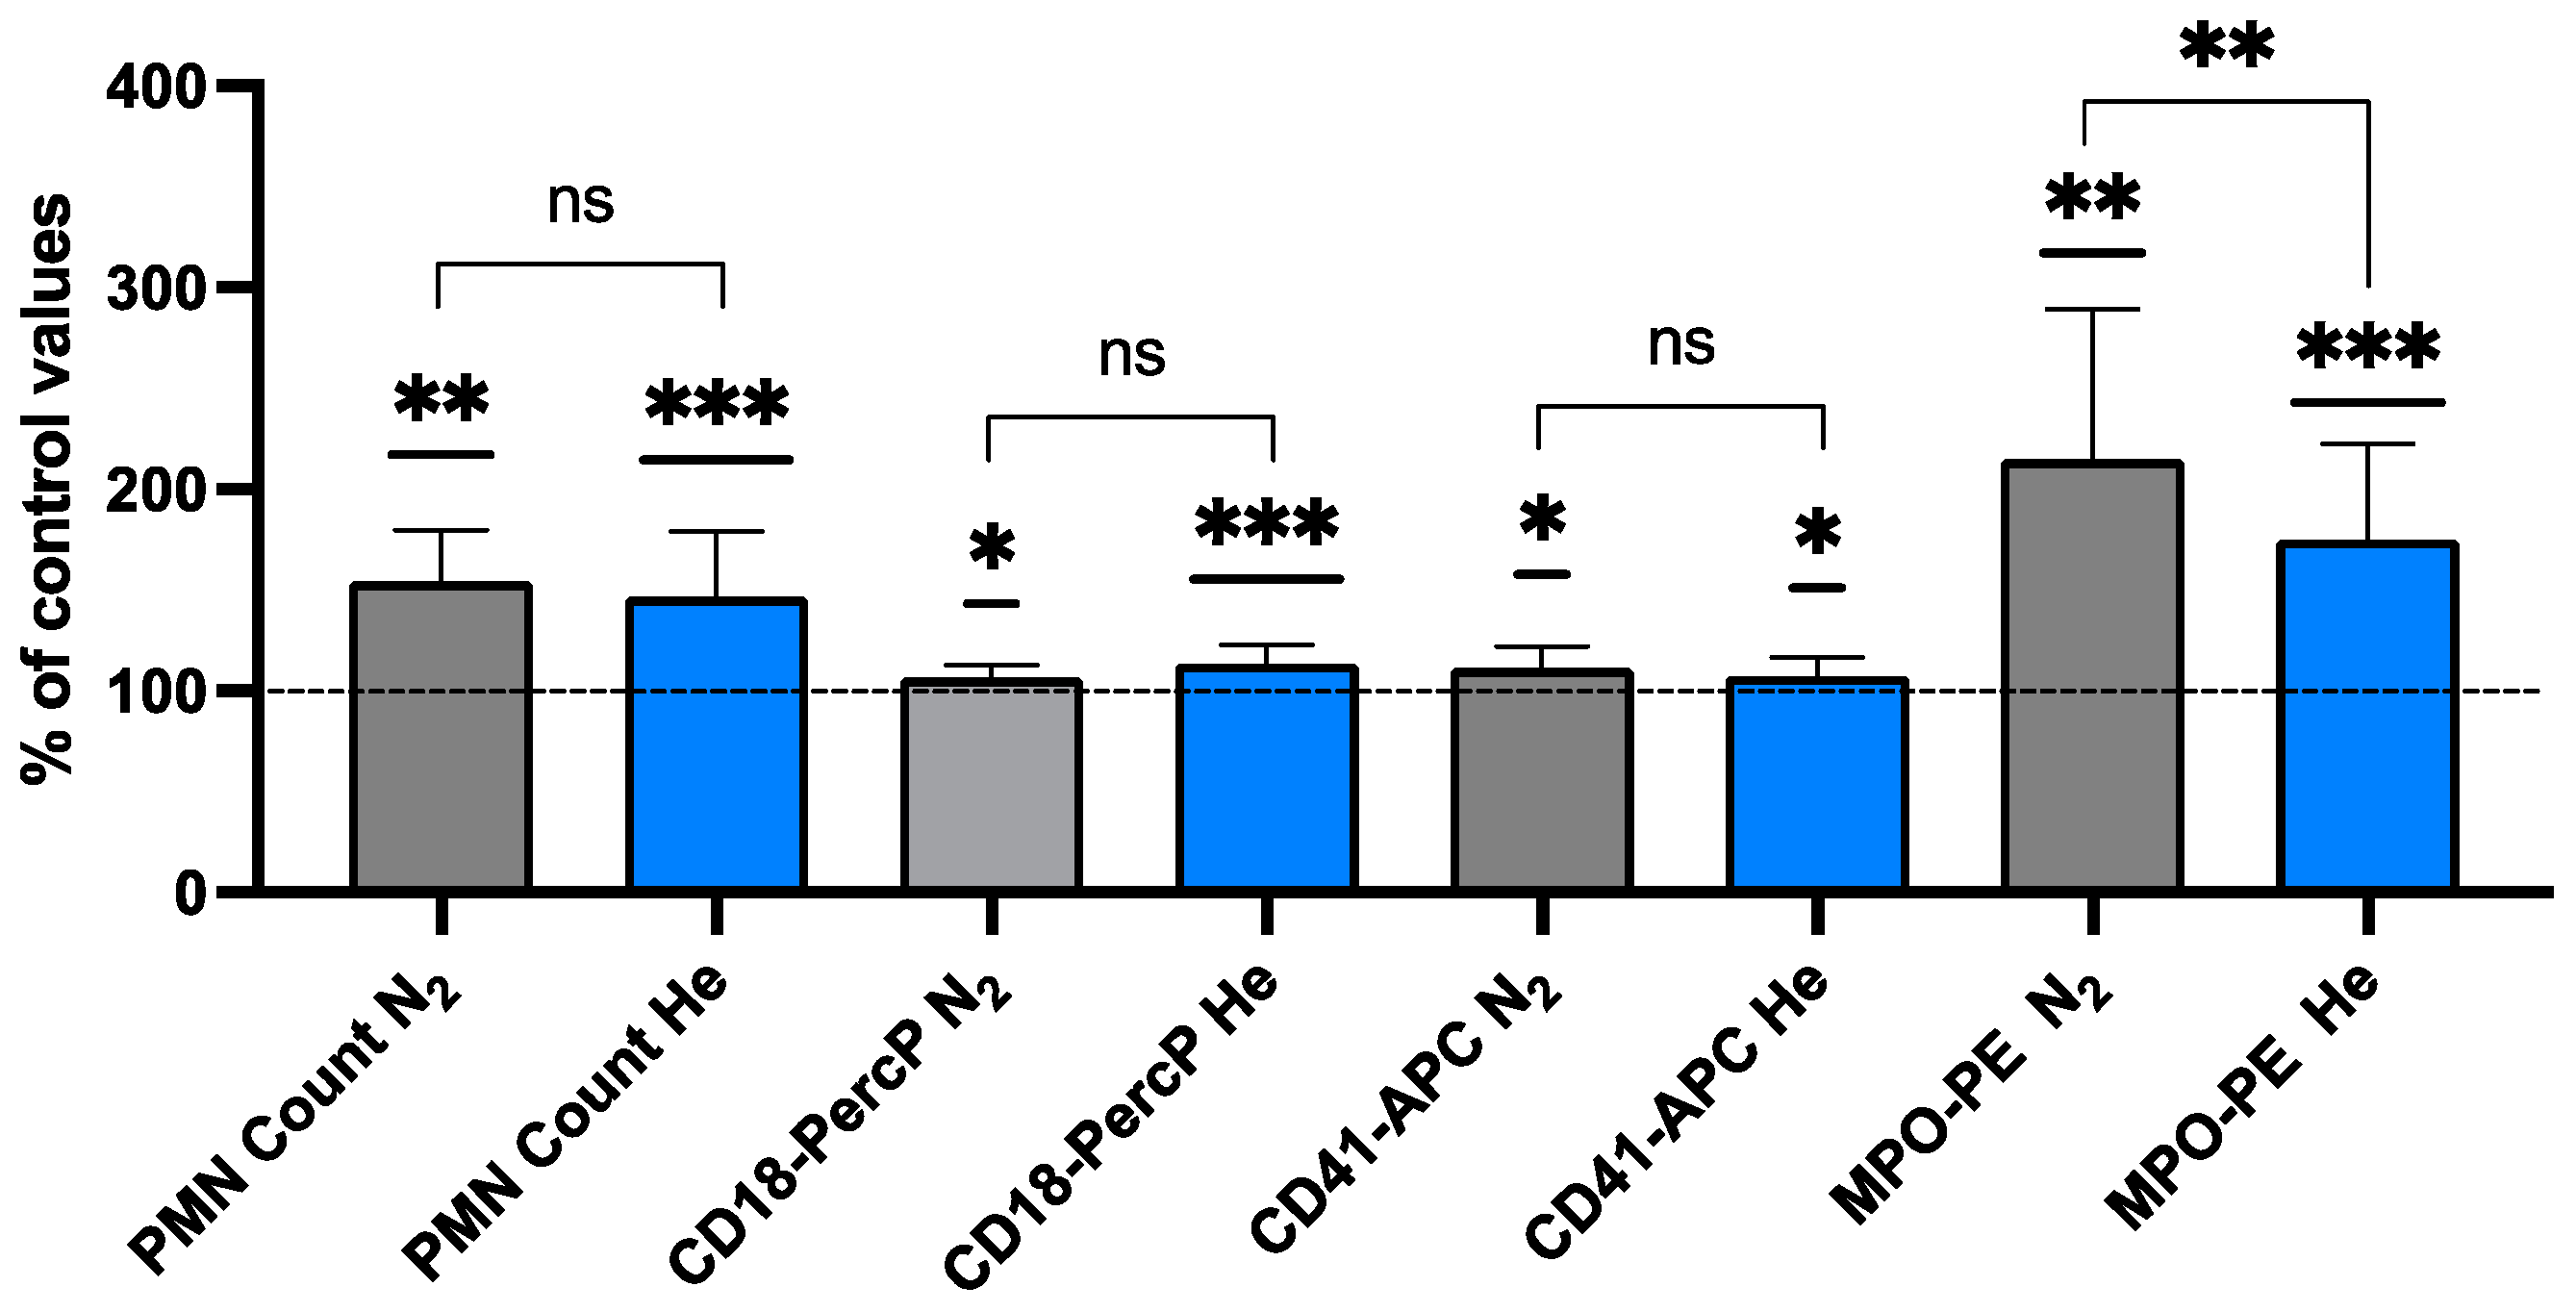
2.1. Neutrophil Activation Elicited by Inert Gas

The activation of neutrophils, which express the CD66b protein, was assessed by flow cytometry as a surface expression of the CD18 protein component of the β2 integrin and myeloperoxidase (MPO, a manifestation of degranulation) against the background of CD66b-positive cells (Table 1 and Figure 1).
We also assessed the presence of CD41, a platelet-specific protein, on the neutrophil surface. Studies have shown that platelets shed MPs upon activation and that platelets and their MPs can adhere to neutrophils [26,66,67]. An assessment for the presence of pGSN on the neutrophil surface was motivated by recent published observations showing a decrease in pGSN in blood and on neutrophils associated with high-pressure exposure. We found that every measured parameter of neutrophil activation shows a significant change, but the only statistically significant difference between helium and nitrogen exposure was found in myeloperoxidase expression. Nitrogen was more stimulating at 214.7 + 74.8% compared to 175.0 + 47.6% for helium.

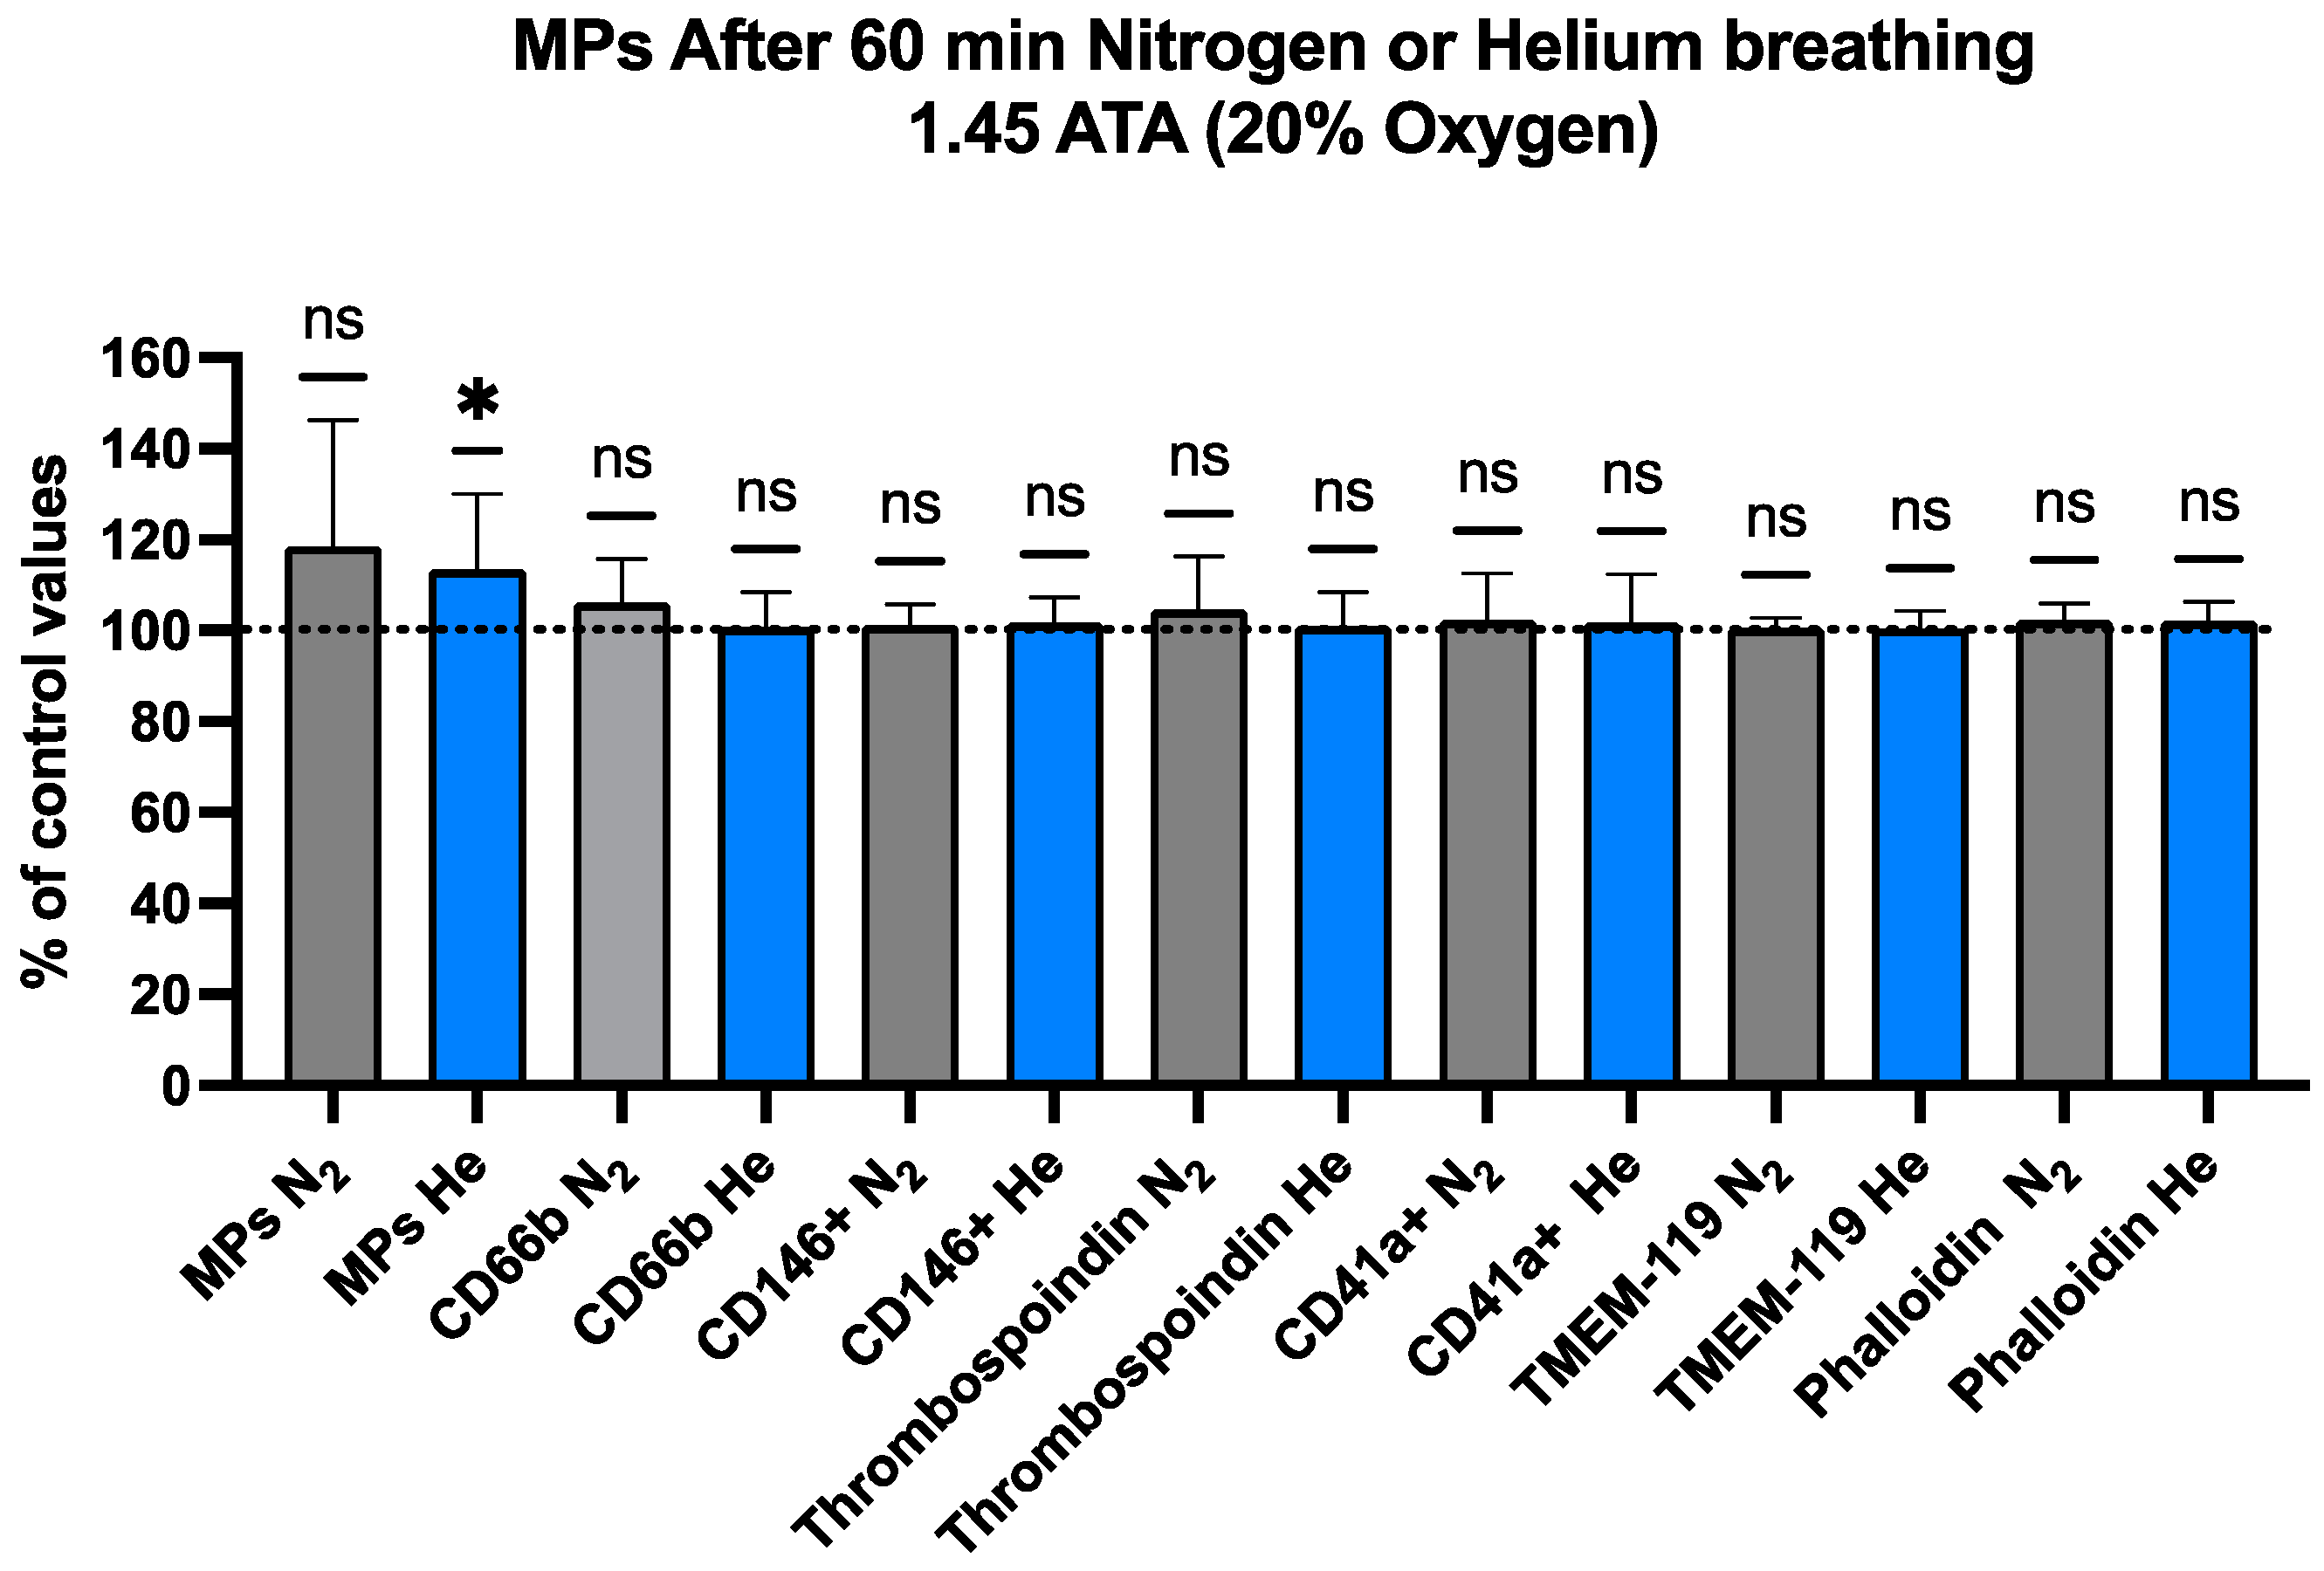
2.2. Blood-Borne EVs Elicited by Pressurized Inert Gas Exposure

Blood counts are shown for MPs in Figure 2 and Table 2. MPs were identified based on the size (0.1–1 µm) and surface expression of annexin V (which binds to phosphatidylserine). In addition to the total number of particles, the expression of surface proteins on MPs originated from neutrophils (CD66b), platelets (CD41), endothelial cells (CD146), and microglia (TMEM119) was analyzed. To gain further insights into MPs, the surface expressions of thrombospondin-1 (TSP) and filamentous (F-) actin (staining with phalloidin) were also assessed. Recent work in the murine model has indicated that F-actin and TSP-expressing MPs have an inflammatory role [65]. Both helium and nitrogen exposure showed increases, but the only one that reached statistical significance was the total MP count for helium exposure (113.3 ± 16.7%).

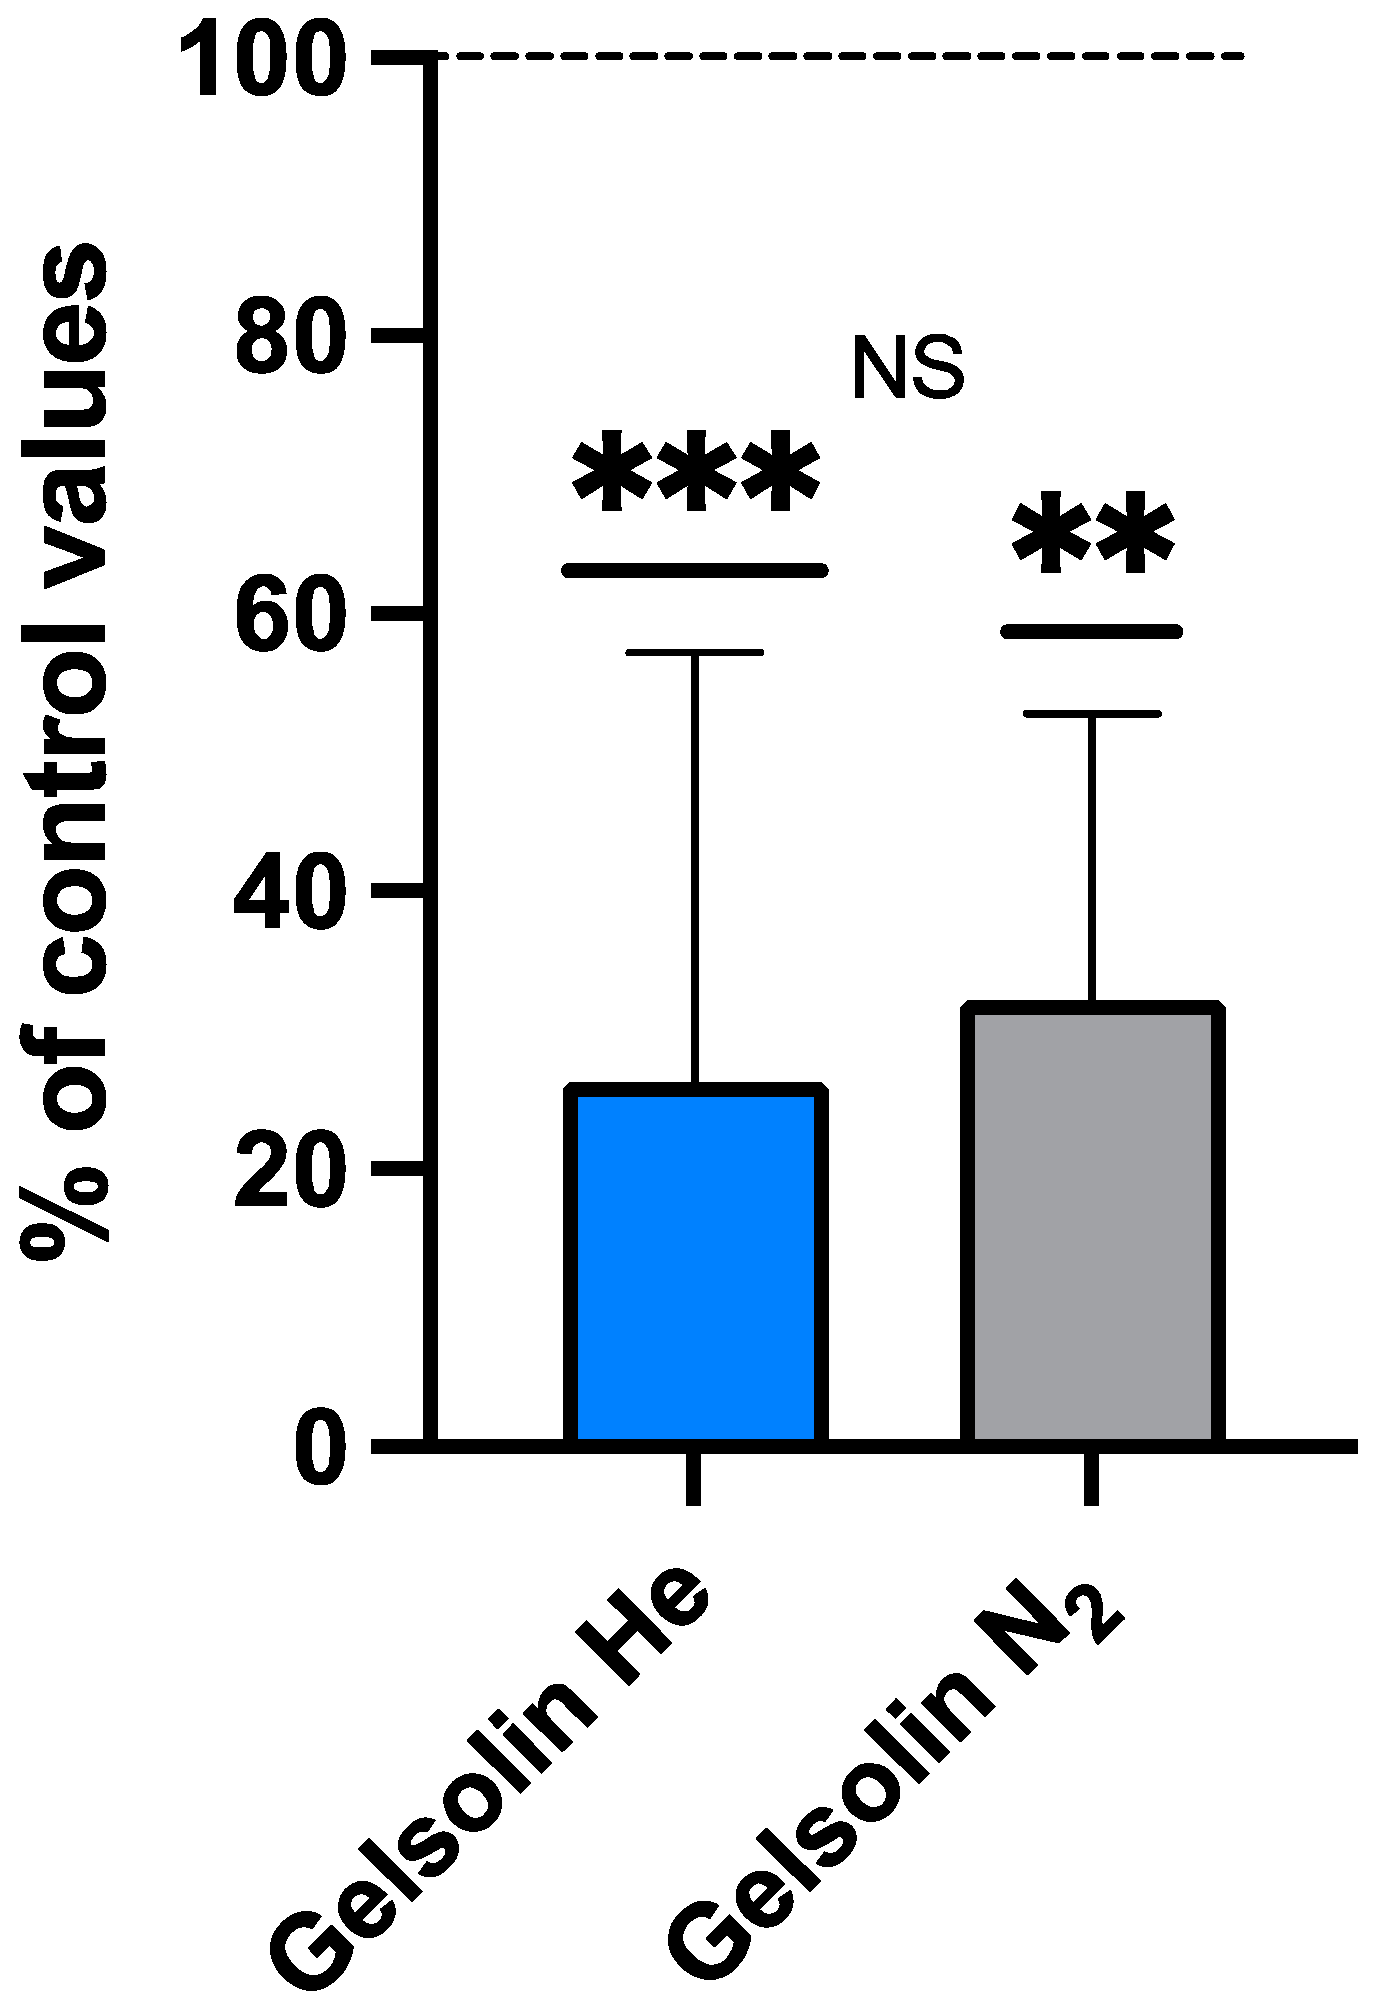
2.3. IL-1β, iNOS, and Gelsolin Changes

IL-1β secretion requires unconventional pathways involving packaging into either MPs or exosomes to be liberated to the extracellular milieu [68]. With high-pressure exposure, virtually all IL-1β are found within MPs [38]. The intra-MP IL-1β values post-pressure exposure are shown in the first two columns of Figure 3 and expressed as the % change from baseline. Due to a technical error, pre-exposure values were only obtained for the group exposed to nitrogen (n = 9) and found to be 11.6 + 6.1 pg/million MPs. The post-helium group IL-1β value was 33.7 + 47.2, whereas that for the nitrogen group was 38.1 + 32.9 pg/million MPs. As shown in Figure 3, the post-exposure values for both groups were statistically significantly different from the baseline, but the values were not significantly different between the gas exposures.
Animal, human, and cells studies suggest that there is a role for iNOS in immunoregulatory function and inflammatory responses [69]. Animal studies suggest that there is a role for iNOS in generating a gas phase within MPs, and iNOS elevations have also been shown to have a role in a study of open-water scuba divers [29,38]. The values for intra-MPs iNOS are shown in Table 3. The baseline iNOS values between the helium and nitrogen groups are significantly different (p < 0.001). The value shown for the nitrogen group is virtually the same as reported for other groups of divers as a baseline [38] (Arya, 2023). There is no explanation for the markedly high value seen in the baseline helium group. Despite the baseline variability, the post-exposure iNOS values were significantly different in both the helium and nitrogen groups (Table 3; Figure 3).

Plasma Gelsolin (pGSN) After Inert Gas Exposure

Plasma gelsolin is a highly conserved actin-binding protein that has been reported to decrease in post-exposure samples in a murine DCS model and human subjects exposed to pressure in a hyperbaric chamber [38]. The comparison between the same exposure to different breathed inert gasses shows a significant reduction in pGSN after either helium or nitrogen exposure and no significant difference between the gas responses (Table 3; Figure 4).

2.4. Oxyinflammation After Inert Gas Exposure

The term “oxyinflammation” has been coined for the combination of systemic oxidative stress associated with an inflammatory condition, and it can be seen in association with conditions of hyperoxia and in high-pressure activities. To assess oxidative stress, we measured the ROS production rate and Total Antioxidant Capacity in saliva samples, and urine was probed for 8-iso-PGF2α (a biomarker of lipid peroxidation), neopterin, NO metabolites, and IL-6 in subjects pre- and post-inert gas exposure (N2 vs. He). The data are displayed in Figure 5 and Table 4. Several changes with statistically significant differences in the ROS production level (μmol⋅min−1) and interleukin 6 (pg·mL−1) were found between pre- and post-exposure in the N2 groups. Furthermore, a significant difference was observed in the ROS production level (μmol⋅min−1), neopterin (mM⋅mol−1creatinine), and NOx (µM) after He exposure (Table 4).
We did not find any statistically significant differences in the TAC (mM) in either group (Figure 5). Interleukin 6 in urine showed a significant increase after N2 exposure and a mild decrease after He exposure, resulting in a highly significant difference for interleukin 6 production between N2 and He after exposure (p < 0.0001) (Figure 6).

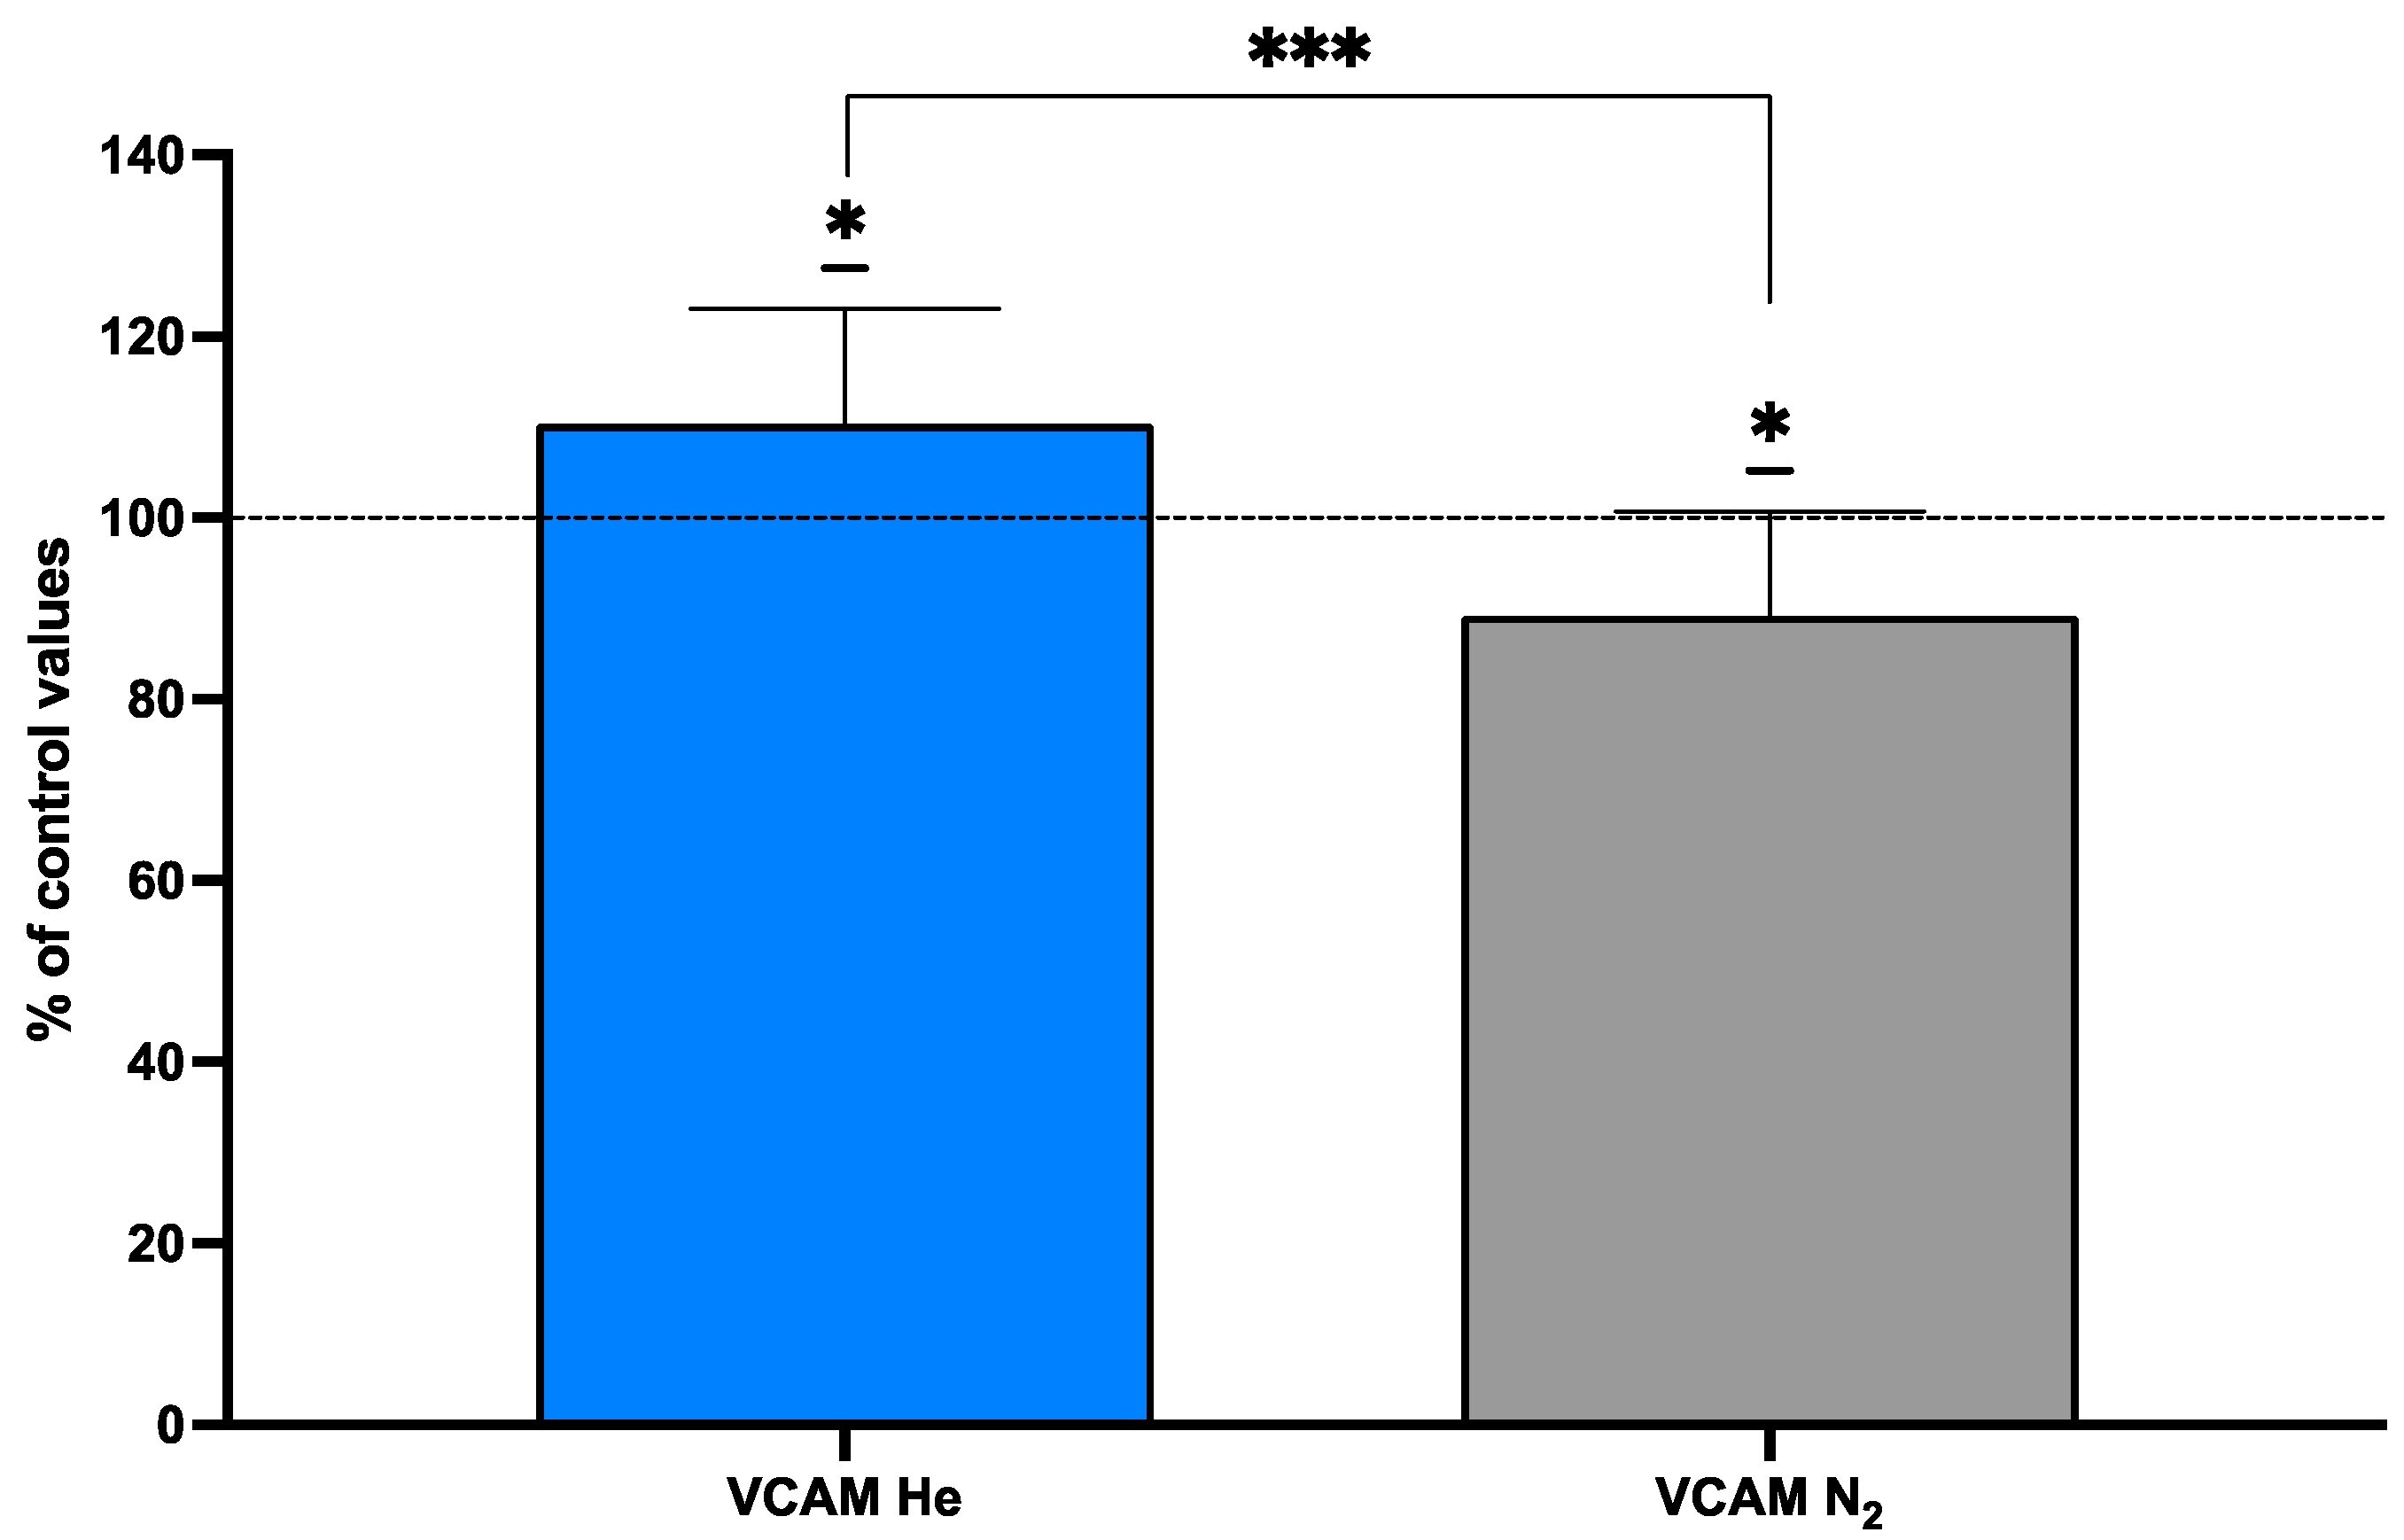
2.5. Endothelial Markers After Inert Gas Exposure

Vascular cell adhesion protein 1 (VCAM-1) functions as a cell adhesion molecule. VCAM-1 was assessed in subjects pre- and post-inert gas exposure (N2 vs. He) (Table 5), and the results are displayed in Figure 6. Following gas exposure, the blood-borne VCAM-1 value was increased to 110.4 ± 12.6% for helium but decreased to 89.25 ± 11.5% for nitrogen, although absolute values were not significantly different.

3. Discussion

This study was conducted to advance our understanding of oxyinflammation as a diving response by focusing on the effects of He and N2 without concurrent hyperoxia. Ex vivo studies with neutrophils have demonstrated that gasses associated with diving, namely He, N2, and Ar, can initiate an oxidative stress response by triggering the production of singlet oxygen with the subsequent activation of iNOS and NADPH oxidase [35]. Elevations in oxygen tension associated with breathing air at elevated pressures as high as 790 kPa were shown to have no significant impact on MP production and the associated responses in a murine model, but no similar studies have been conducted with human subjects [70]. The pressure threshold for gasses triggering the singlet oxygen-mediated responses in neutrophils ex vivo was found to be ~186 kPa [35]. We chose to carry out the current trial at a slightly lower pressure of 145 kPa.
Neutrophil activation occurred with both He and N2 exposure. The production of MPs was nominal, which we attribute to the use of gas partial pressures slightly below the threshold found for neutrophils ex vivo. Elevations in IL-1β and IL-6 following high gas pressure exposure has been described in a murine model, in cells, and in humans after simulated diving [28,71]. Urinary levels of IL-6 can mirror plasmatic levels as already reported [72,73,74]. Oxidative stress triggered by He and N2 activate the NLRP3 inflammasome concurrent with MP production [35]. This element of gas-mediated neutrophil activation was observed in the current study as the elevation of intra-MP IL-1β. The increase in iNOS within MPs is consistent with the same series of events and has been observed in other recent studies [38]. There is a difference in potency between He and N2 in ex vivo neutrophil activation studies. We found a significant difference between He and N2 for MP iNOS cargo and plasma IL-6, but no significant difference was found in elevations in intra-MP IL-1β in our current investigation.
Plasma gelsolin (pGSN) blood levels fall in numerous acute and chronic inflammatory states. Among studies, the magnitude of pGSN reduction parallels the extent of tissue damage, and depletion precedes and predicts adverse clinical outcomes [75,76,77,78,79,80,81]. In the present study, we observed significantly lower pGSN concentrations in post-dive plasma. We view pGSN as a physiological antagonist to MP-mediated inflammation. Prior work suggests that the decrease occurs due to pGSN consumption from the binding and lysis of pro-inflammatory F-actin-expressing MPs [36,82]. We have observed pGSN reduction post-diving in human and murine studies [36,37,38]. In a murine DCS model and numerous animal studies of infection, injury, and inflammation, pGSN supplementation can abrogate organ damage [83].
With regard to oxidative stress responses, we observed a complex pattern of responses between He and N2. This may be due to competing reactions with this systemic exposure (versus more simple studies with ex vivo neutrophils) and responses of multiple organs and tissues, as well as sampling from multiple body fluids. Our data show an increase in ROS production levels in saliva without an increased oxygen partial pressure (N2: +28%; He: +25%) and, consequently, lipid peroxidation (8-iso-PGF2) in urine samples (N2: +13%; He: +15%) with both breathed gasses. However, no significant changes were observed for salivary TAC, urinary Nox, or neopterin.
VCAM-1 is expressed by the vascular system and can be induced by ROS, IL-1β, or TNFα, which are produced by many cell types. Endothelial activation with elevations in plasma VCAM-1 were reported following high-pressure exposure in several studies [84,85,86]. In our study, the levels of VCAM-1 followed different trajectories with an increase after helium exposure and a decrease after nitrogen exposure. This seeming contradiction may reflect subtle differences in oxidative stress and compensatory responses. That is, He exposure triggered a significant increase in plasma MPs, including those carrying IL-1β. These MPs cause vascular damage in the murine model. Nitrogen-induced MPs with their significantly higher iNOS content may have altered the balance of responses given the potent vasodilatory effects of NO.
There is no precedence [64,87,88,89,90] for cell activation or immune responses related to hydrostatic pressure elevations as used in this study [91]. However, elevated partial pressures of inert gasses (in this case, He and N2) can cause oxidative stress, leading to immune responses including microparticle formation that result from oxygen–inert gas collision complexes to yield reactive singlet oxygen [35,92].
In conclusion, inert gas exposure at 1.45 ATA resulted in biomarker concentration changes. Based on these findings, new studies must focus on exposure times, depth, and biological sample collection times and investigate physiological stress responses. There are also limitations to our study that need to be recognized. As is typical of these human subject projects, the relatively small sample size poses limits on generalizations. There are also variable effects observed in the baseline values for iNOS between the He and N2 groups that are unexplained. Diurnal variations may also count, but to limit this interference, our experiments were conducted between 8 and 12:00 h during weekends.

4. Materials and Methods

4.1. Experimental Protocol

A total of 24 healthy subjects (9 females and 15 males) volunteered for this study after approval from the Bio-Ethical Committee for Research and Higher Education, Brussels (N° B200-2020-088), and written informed consent was obtained. All experimental procedures were conducted in accordance with the Declaration of Helsinki [93]. Analyses of deidentified blood samples were approved by the University of Maryland Institutional Review Board (No HP-00059996).
After medical screening to exclude any comorbidity, participants were prospectively randomized into 2 groups to receive either a breathing mix with helium or nitrogen under pressure at 1.45 ATA with oxygen at 14.5% to reach roughly 0.21 of the inspired fraction of oxygen to mimic the atmospheric air oxygen content. (Figure 7). As far as age [29.6 ± 11.5 years old (mean ± SD)], height [172.0 ± 10.05 cm], weight [67.8 ± 12.4 kg], gender ratio, and health status are considered, the groups were comparable.
Inert gas exposure was carried out for 1 h by means of an orofacial “full-face” mask (Ocean Reef, Genoa, Italy) attached to the mixture tank, with care being taken to fit and tighten the mask on the subject’s face. Participants were pressurized in one Revitalair technology (1.45 ATA) (Biobarica Revitalair 430, Buenos Aires, Argentina) hyperbaric monoplace chamber.
Blood, saliva, and urine samples were obtained before exposure (T0) and 2 h after the end of inert gas administration.

4.2. Experimental Protocol for Microparticle Analysis

The blood (~5 mL) was drawn into Cyto-Chex BCT test tubes that contained a proprietary preservative (Streck, Inc., Omaha, NE, USA). The blood was centrifuged for 5 min at 1500× g, and the supernatant was 12.5 mmol/L EDTA to impede MP aggregation and then centrifuged at 15,000× g for 30 min. Aliquots of the 15,000× g supernatant were stained with antibodies for MP analysis by flow cytometry, and a portion was used for exosome analysis. Samples were sent by express mail to the University of Maryland (Dr. Thom) and to the IFC-CNR Milano, Italy (Dr. Mrakic-Sposta) laboratory, where all analyses were performed following published techniques described in previous publications [25,43]. In brief, total MPs and subtypes were assayed in an 8-color, triple-laser MACSQuant (Version 2.13.3, Miltenyi Biotec Corp., Auburn, CA, USA) flow cytometer with the manufacturers’ acquisition software using standard methods, including a “fluorescence minus one control test”. This analysis provides a way to define the boundary between positive and negative particles in an unbiased manner by defining the maximum fluorescence expected for a given subset after outlining the area in a two-dimensional scatter diagram when a fluorophore-tagged antibody is omitted from the stain set. The analysis allows for a simple decision as to where to place the upper boundary for non-staining particles in a fluorescence channel. All supplies, reagents, and manufacturer sources have been described in previous publications [94,95,96]. The blood was centrifuged for 5 min at 1500× g, and the supernatant was 12.5 mmol/L EDTA to impede MP aggregation and then centrifuged at 15,000× g for 30 min. Aliquots of the 15,000× g supernatant were stained with antibodies for MP analysis by flow cytometry, and a portion was used for exosome analysis. Plasma stored at −80 °C after a 15,000× g centrifugation step preceding an MP analysis was used for IL-1, NOS2, and pGSN assays.

4.3. Reagents (Microparticle Analysis)

Chemicals were purchased from Sigma-Aldrich (St. Louis, MO, USA) unless otherwise noted. Annexin binding buffer and the following agents were purchased from BD Pharmingen (San Jose, CA, USA): fluorescein isothiocyanate (FITC)-conjugated Annexin V (cat# 556419), R-PE-conjugated anti-human CD18 (cat#555924), and PerCP/Cy5.5-conjugated anti-human CD41a (cat #340931). APC-conjugated anti-human CD146 (cat #340931) was purchased from BioScience (San Diego, CA, USA), AlexaFluor488-conjugated anti-human TMEM119 (cat #FAB103131G) was from R & D Systems (Minneapolis, MN, USA), anti-thrombospondin (TSP)-1 (cat #sc-393504) was from Santa Cruz Biotechnology (Dallas, TX, USA), and FITC-conjugated anti-human myeloperoxidase (MPO, cat# HM1051PE-100) was from Hycult Biotech (Plymouth Meeting, PA, USA). Antibodies purchased from Biolegend (San Diego, CA, USA) included AlexaFluor647-conjugated anti-human CD63 (cat #353016), PercpCy5.5-conjugated anti-human CD81 (cat #349520), and BV421-conjugated anti-human CD66b (cat#347201).

4.4. Neutrophil Activation Analysis

Whole fixed blood from the Cyto-Chex tubes (100 µL) was stained for 30 min at room temperature in the dark with optimized concentrations of antibodies as listed above. After staining, 2 mL of phosphate-buffered saline (PBS) was added to dilute each sample tube prior to analysis, with the cytometer acquisition set to use anti-human CD66b as the fluorescence trigger to recognize neutrophils.

4.5. IL-1β and NOS2 Measurements

Human-specific ELISA Kits (eBioscience, San Diego, CA, USA) that detect pro- and mature forms of IL-1β or NOS2 were used following the manufacturer’s instructions. Measurements were performed using plasma supernatant after blood was centrifuged at 15,000× g, as described for flow cytometry studies, and also in supernatant and pellet fractions separated by a second centrifugation at 21,000× g for 30 min. The MPs in pellets were placed in 0.3 mL lysis buffer, the protein content of the sample was measured and diluted to 5 mg/mL, and 20 µg of protein was used for analysis.

4.6. Gelsolin Assay

A human-specific commercial pGSN ELISA kit (LSBio, Inc., Seattle, WA, USA) was used following the manufacturer’s instructions. Serial dilutions in PBS were prepared using the supernatant after 15,000× g centrifugation of plasma as described above and analyzed concurrently with a range of known pGSN standards.

4.7. Exosome/Lipophilic Particles Assay

Using 15,000× g supernatants from plasma, as described above, 5 µL of samples was diluted in 100 µL of PBS and incubated with dyes [2.5 µmol PKH67 (Sigma Cat#SIG-MINI67), 2.5 µmol Laurdan (1-[6-(Dimethylamino)-2-naphthalenyl]-1-dodecanone, Tocris Biotech Cat#7275)], and antibodies for 30 min prior to analysis using an ImageStream®X Mk II: Imaging Flow cytometer. FluoSphere™ carboxylate-modified microspheres (Thermofisher, 20 and 100 nm in diameter) were used to provide size bracketing, and initial standardization of methods was conducted with 120 nm (range 80–140 nm) synthetic lipid vesicles from Cellarcus Biosciences (San Diego, CA, USA) that were made with a lipid composition comparable to mammalian cells. For initialization, the bright field instrument and lasers were set to maximum power, side scatter (SSC) was set to 70 mW, and the 60X imager magnification was set to high gain. Channel 1 was used for bright field, and Ch.6 for SSC. After setting the compensation matrix with the bright field off and all channels enabled, single-color compensations were set for each color, with gates set to detect particles between 20 and 100 nm in diameter.

4.8. Blood Collection for Other Biomarkers

Each blood sample for other plasmatic measures consisted of approximately 15 mL of venous human blood collected in lithium heparin and EDTA tubes (Vacutainer, BD Diagnostic, Becton Dickinson, Italia S.p.A., Milan, Italy). Plasma and red blood cells (RBCs) were separated by centrifugation (Eppendorf Centrifuge 5702R, Darmstadt, Germany) at 1000× g at 4 °C for 10 min.
All samples collected were sent by express mail to the IFC-CNR Milano, Italy (Dr. Mrakic-Sposta) laboratory, where all analyses were performed. Samples were then stored in multiple aliquots at −80 °C until assayed and thawed; an analysis was performed within one month from collection.

Vascular Cell Adhesion Protein (VCAM-1)

Vascular cell adhesion protein 1 (VCAM-1) concentrations were obtained in plasma using the ELISA kit (Cat. No. EH0326, Fine Test, Wuhan, China) according to the manufacturer’s instructions. Samples were read at a wavelength of 450 nm. The concentration of VCAM-1 was calculated by drawing a standard curve. Coefficient of variation (CV) assay indicated by the manufacturer: inter-assay CV, 5.92%; intra-assay CV, 4.68%.

4.9. Saliva Collection and Biomarker Assessment

Approximately 1 mL of saliva was obtained using Salivette devices (Sarstedt, Nümbrecht, Germany). The subjects were instructed on the correct use (i.e., no eating, drinking, or oral intake of drugs 1 h before sample collection). Salivettes were centrifuged at 1500× g 20 min at 4 °C, and retrieved saliva was transferred, aliquoted, and then stored at −80 °C until assayed and thawed only once before analysis.

4.9.1. Reactive Oxygen Species (ROS)

An X-band electron paramagnetic resonance spectroscopy (EPR, 9.3 GHz) (E-Scan, Bruker Co., Billerica, MA, USA) detected ROS production in saliva samples (analysis software version 2.11, Win EPR System). Methods were previously described [17]. Briefly, spin probe CMH (1-hydroxy-3-methoxy-carbonyl-2,2,5,5-tetramethylpyrrolidine) was used for ROS determination, and a stable radical CP (3-carboxy2,2,5,5-tetramethyl-1-pyrrolidi-nyloxy) was used as an external reference to convert ROS determinations into absolute quantitative values (µmol.min−1).

4.9.2. Total Antioxidant Capacity (TAC)

The 6-hydroxy-2,5,7,8-tetramethylchroman-2-carboxylic acid (Trolox-) equivalent antioxidant capacity assay, a widely used kit-based commercial method (Cayman Chemical, Ann Arbor, MI, USA; Item No. 709001), was used as previously described [17]. Briefly, 10 µL of saliva was added in duplicate to 10 μL of metmyoglobin and 150 μL of the chromogen solution.
Then, reactions were initiated through the addition of 40 μL of H2O2, as indicated by the instructions. Reaction mixtures were incubated at room temperature for 3 min. Samples were read at a wavelength of 750 nm (Infinite M200, Tecan, Austria, operating in Window system). Coefficient of variation (CV) assay indicated by the manufacturer: inter-assay CV, 3%; intra-assay CV, 3.4%.

4.10. Urine Collection

Urine samples were collected by the participants through voluntary voiding in a sterile container. Biofluids were stored at 4 °C in a cooler and then stored in multiple aliquots at −20 °C until assayed.

4.10.1. Lipid Peroxidation (8-iso-PGF2α)

Lipid peroxidation was assessed in urine using a competitive immunoassay of 8-isoprostane concentration (8-iso-PGF2α; Item No. 516360, Cayman Chemical, Ann Arbor, MI, USA). 8-iso-PGF2α concentrations were determined using a standard curve. Samples and standards were read at a wavelength of 412 nm (Infinite M200, Tecan, Austria, operating in Window system). This method has been previously described [97,98]. Coefficient of variation (CV) assay indicated by the manufacturer: inter-assay CV, 11.5%; intra-assay CV, 8.9%.

4.10.2. Interleukin-6 (IL-6)

According to the manufacturer’s instructions, IL-6 urinary levels were determined using an ELISA kit (Cayman Chemical, Ann Arbor, MI, USA, Item No. 501030). This method has been previously described [17]. Coefficient of variation (CV) assay indicated by the manufacturer: inter-assay CV, 13.32%; intra-assay CV, 7.64%.

4.10.3. NO Metabolites (NOx)

NO derivatives, nitrate, and nitrite (NO2 + NO3 = NOx) were measured in urine samples using a colorimetric method based on the Griess reaction (Cayman Chemical, Ann Arbor, MI, USA; Item No. 780001) as previously described [99]. Samples were read at 545 nm (Infinite M200, Tecan, Austria, operating in Window system), and a standard curve assessed the concentration. Coefficient of variation (CV) assay indicated by the manufacturer: inter-assay CV, 3.4%; intra-assay CV, 2.7%.

4.10.4. Neopterin

Urinary neopterin concentrations were measured in urine using the high-performance liquid chromatography (HPLC) method [100,101]. The calibration curves were linear over the range of 0.125–1 μmol/L for neopterin levels (Varian Star chromatography workstation version 6.41). Inter-assay and intra-assay coefficients of variation were <5%.

4.11. Statistical Analysis

Data are presented as mean ± SD. Normality of the data was verified by means of the Shapiro–Wilk test, which allowed us to assume a Gaussian distribution. Compared to the baseline (T0—pre-exposure), data were analyzed with a paired t-test for intragroup comparison if Gaussian distribution was not warranted, and a Wilcoxon test was preferred. When appropriate, unpaired t-test or Mann–Whitney test was used for intergroup comparison. Taking the baseline measures as 100% (T0), percentage or fold changes were also calculated for each exposure protocol, allowing for an appreciation of the magnitude of change rather than the absolute values; statistical significance was then assessed by means of a one-sample t-test. In the figures, data are presented as percentage changes, taking each individual pre-exposure value as baseline (100%). All data are presented as mean ± standard deviation (SD); Cohen’s d with 95% CI was used to calculate the size effect. A threshold of p < 0.05 was considered statistically significant.

Author Contributions

All authors listed have made a substantial, direct, and intellectual contribution to the work and approved it for publication. Conceptualization: C.B. and S.R.T.; Investigation: C.B., C.L., S.M.-S., M.C., R.T., A.V., Z.I. and S.R.T.; Data Analysis: Z.I., R.T., M.C., S.M.-S., A.V. and C.B.; Writing: C.B., C.L., S.M.-S. and S.R.T.; Funding: G.B., S.R.T., C.B., C.L. and S.M.-S. All authors have read and agreed to the published version of the manuscript.

Funding

This work was supported in part by grants from the US Office of Naval Research N00014-20-1-2641 (Thom), the National Institutes for Health (NINDS) R01-NS122855 (Thom), and DAN funding from the Environmental, Occupational, Ageing (Integrative) Physiology Laboratory, Haute Ecole Bruxelles-Brabant (HE2B), Belgium—Inert gas research “IPA study” Inert Gas Pressure Action (Grant DAN-HE2B-2023-LevC) (Bosco). The sponsors had no role in the design or performance of the study; in the collection, management, analysis, or interpretation of the data; in the preparation, review, or approval of the manuscript; or in the decision to submit the manuscript for publication.

Institutional Review Board Statement

All experimental procedures were conducted in accordance with the Declaration of Helsinki [93]. Ethics Committee approval was provided by the Bio-Ethical Committee for Research and Higher Education, Brussels (N° B 200-2020-088), and the University of Maryland Institutional Review Board (No HP-00059996).

Informed Consent Statement

Informed consent was obtained from all subjects involved in this study.

Data Availability Statement

The data are available upon request from the authors.

Acknowledgments

The authors are grateful to all volunteer participants.

Conflicts of Interest

The authors declare no conflicts of interest.

Abbreviations

DCSDecompression sickness
EVsExtracellular vesicles
IL-1βInterleukin-1β
Il-6Interleukin-6
MPOMyeloperoxidase
MPsBlood-borne microparticles
NOxNitric oxide metabolites
pGSNPlasma gelsolin
PO2Oxygen partial pressure
RAGEReceptor for advanced glycation end products
ROSReactive oxygen species
TACTotal antioxidant capacity
TMEM-119Transmembrane protein 119
TLR4Toll-like receptor 4
TSPThrombospondin 1
VCAM-1Vascular cell adhesion protein 1
8-iso-PGF2α8-isoprostane

References

  1. Tuominen, L.J.; Tuohinen, S.; Lundell, R.V.; Raisanen-Sokolowski, A.K.; Wuorimaa, T. The effect of a single closed-circuit rebreather decompression dive in extremely cold water to cardiac function. Eur. J. Appl. Physiol. 2024, 124, 1693–1702. [Google Scholar] [CrossRef] [PubMed]
  2. Imbert, J.P.; Matity, L.; Massimelli, J.Y.; Bryson, P. Review of saturation decompression procedures used in commercial diving. Diving Hyperb. Med. 2024, 54, 23–38. [Google Scholar] [CrossRef] [PubMed]
  3. Mitchell, S.J. Decompression illness: A comprehensive overview. Diving Hyperb. Med. 2024, 54, 1–53. [Google Scholar] [CrossRef] [PubMed]
  4. Yoder, T.L.; Taber, K.A.; Howle, L.E.; Moon, R.E. Pushing Scuba to New Heights: Approach, Decompression, and Logistical Considerations for High-Altitude Diving. High. Alt. Med. Biol. 2024. [Google Scholar] [CrossRef] [PubMed]
  5. Breen, I.D.; Stepanek, J.; Marks, L.; Yale, K.; Mesinkovska, N.; Swanson, D. Clinical Significance of Mottling Rashes in Diving Decompression Sickness. Aerosp. Med. Hum. Perform. 2024, 95, 695–702. [Google Scholar] [CrossRef]
  6. Germonpré, P.; Lafère, P.; Portier, W.; Germonpré, F.L.; Marroni, A.; Balestra, C. Increased Risk of Decompression Sickness When Diving With a Right-to-Left Shunt: Results of a Prospective Single-Blinded Observational Study (The “Carotid Doppler” Study). Front. Physiol. 2021, 12, 763408. [Google Scholar] [CrossRef]
  7. Arieli, R. Distal arterial bubble: An alternative mechanism underlying vestibular decompression illness. J. Appl. Physiol. 2023, 134, 593–594. [Google Scholar] [CrossRef]
  8. Arieli, R. Do skin rash and cutis marmorata stem from lamellar bodies within the skin? Diving Hyperb. Med. 2018, 48, 114. [Google Scholar] [CrossRef]
  9. Lautridou, J.; Buzzacott, P.; Belhomme, M.; Dugrenot, E.; Lafère, P.; Balestra, C.; Guerrero, F. Evidence of Heritable Determinants of Decompression Sickness in Rats. Med. Sci. Sports Exerc. 2017, 49, 2433–2438. [Google Scholar] [CrossRef]
  10. Buzzacott, P.; Lambrechts, K.; Mazur, A.; Wang, Q.; Papadopoulou, V.; Theron, M.; Balestra, C.; Guerrero, F. A ternary model of decompression sickness in rats. Comput. Biol. Med. 2014, 55, 74–78. [Google Scholar] [CrossRef]
  11. Druelle, A.; Castagna, O.; Roffi, R.; Louge, P.; Faivre, A.; Blatteau, J.E. Taravana syndrome and posterior reversible encephalopathy syndrome: A microbubble hypothesis for neurological accidents in breath-hold divers. Front. Physiol. 2024, 15, 1478650. [Google Scholar] [CrossRef] [PubMed]
  12. Lambrechts, K.; Germonpre, P.; Vandenheede, J.; Delorme, M.; Lafere, P.; Balestra, C. Mini Trampoline, a New and Promising Way of SCUBA Diving Preconditioning to Reduce Vascular Gas Emboli? Int. J. Environ. Res. Public. Health 2022, 19, 5410. [Google Scholar] [CrossRef] [PubMed]
  13. Germonpre, P.; Balestra, C. Preconditioning to Reduce Decompression Stress in Scuba Divers. Aerosp. Med. Hum. Perform. 2017, 88, 114–120. [Google Scholar] [CrossRef] [PubMed]
  14. Arieli, R. Gas micronuclei underlying decompression bubbles may explain the influence of oxygen enriched gases during decompression on bubble formation and endothelial function in self-contained underwater breathing apparatus diving. Croat. Med. J. 2019, 60, 388. [Google Scholar] [CrossRef]
  15. Blatteau, J.E.; Souraud, J.B.; Gempp, E.; Boussuges, A. Gas nuclei, their origin, and their role in bubble formation. Aviat. Space Environ. Med. 2006, 77, 1068–1076. [Google Scholar]
  16. Vezzoli, A.; Mrakic-Sposta, S.; Brizzolari, A.; Balestra, C.; Camporesi, E.M.; Bosco, G. Oxy-Inflammation in Humans during Underwater Activities. Int. J. Mol. Sci. 2024, 25, 3060. [Google Scholar] [CrossRef]
  17. Balestra, C.; Leveque, C.; Mrakic-Sposta, S.; Vezzoli, A.; Wauthy, P.; Germonpre, P.; Tillmans, F.; Guerrero, F.; Lafere, P. Physiology of deep closed circuit rebreather mixed gas diving: Vascular gas emboli and biological changes during a week-long liveaboard safari. Front. Physiol. 2024, 15, 1395846. [Google Scholar] [CrossRef]
  18. Arieli, R. Taravana, vestibular decompression illness, and autochthonous distal arterial bubbles. Respir. Physiol. Neurobiol. 2019, 259, 119–121. [Google Scholar] [CrossRef]
  19. Barak, O.F.; Janjic, N.; Drvis, I.; Mijacika, T.; Mudnic, I.; Coombs, G.B.; Thom, S.R.; Madic, D.; Dujic, Z. Vascular dysfunction following breath-hold diving. Can. J. Physiol. Pharmacol. 2020, 98, 124–130. [Google Scholar] [CrossRef]
  20. Vince, R.V.; McNaughton, L.R.; Taylor, L.; Midgley, A.W.; Laden, G.; Madden, L.A. Release of VCAM-1 associated endothelial microparticles following simulated SCUBA dives. Eur. J. Appl. Physiol. 2009, 105, 507–513. [Google Scholar] [CrossRef]
  21. Madden, L.A.; Chrismas, B.C.; Mellor, D.; Vince, R.V.; Midgley, A.W.; McNaughton, L.R.; Atkins, S.L.; Laden, G. Endothelial function and stress response after simulated dives to 18 msw breathing air or oxygen. Aviat. Space Environ. Med. 2010, 81, 41–51. [Google Scholar] [CrossRef] [PubMed]
  22. Thom, S.R.; Milovanova, T.N.; Bogush, M.; Bhopale, V.M.; Yang, M.; Bushmann, K.; Pollock, N.W.; Ljubkovic, M.; Denoble, P.; Dujic, Z. Microparticle production, neutrophil activation and intravascular bubbles following open-water SCUBA diving. J. Appl. Physiol. 2012, 112, 1268–1278. [Google Scholar] [CrossRef] [PubMed]
  23. Thom, S.R.; Milovanova, T.N.; Bogush, M.; Yang, M.; Bhopale, V.M.; Pollock, N.W.; Ljubkovic, M.; Denoble, P.; Madden, D.; Lozo, M.; et al. Bubbles, microparticles and neutrophil activation: Changes with exercise level and breathing gas during open-water SCUBA diving. J. Appl. Physiol. 2013, 114, 1396–1405. [Google Scholar] [CrossRef]
  24. Pontier, J.M.; Gempp, E.; Ignatescu, M. Blood platelet-derived microparticles release and bubble formation after an open-sea dive. Appl. Physiol. Nutr. Metab. 2012, 37, 888–892. [Google Scholar] [CrossRef] [PubMed]
  25. Madden, D.; Thom, S.R.; Yang, M.; Bhopale, V.M.; Milovanova, T.N.; Ljubkovic, M.; Dujic, Z. High intensity cycling before SCUBA diving reduces post-decompression microparticle production and neutrophil activation. Eur. J. Appl. Physiol. 2014, 114, 1955–1961. [Google Scholar] [CrossRef]
  26. Thom, S.R.; Yang, M.; Bhopale, V.M.; Huang, S.; Milovanova, T.N. Microparticles initiate decompression-induced neutrophil activation and subsequent vascular injuries. J. Appl. Physiol. 2011, 110, 340–351. [Google Scholar] [CrossRef] [PubMed]
  27. Thom, S.R.; Bennett, M.; Banham, N.D.; Chin, W.; Blake, D.F.; Rosen, A.; Pollock, N.W.; Madden, D.; Barak, O.; Marroni, A.; et al. Association of microparticles and neutrophil activation with decompression sickness. J. Appl. Physiol. 2015, 119, 427–434. [Google Scholar] [CrossRef]
  28. Thom, S.R.; Bhopale, V.M.; Yu, K.; Yang, M. Provocative decompression causes diffuse vascular injury in mice mediated by microparticles containing interleukin-1beta. J. Appl. Physiol. 2018, 125, 1339–1348. [Google Scholar] [CrossRef]
  29. Thom, S.R.; Yang, M.; Bhopale, V.M.; Milovanova, T.N.; Bogush, M.; Buerk, D.G. Intra-microparticle nitrogen dioxide is a bubble nucleation site leading to decompression-induced neutrophil activation and vascular injury. J. Appl. Physiol. 2013, 114, 550–558. [Google Scholar] [CrossRef]
  30. Yang, M.; Milovanova, T.N.; Bogush, M.; Uzan, G.; Bhopale, V.M.; Thom, S.R. Microparticle enlargement and altered surface proteins after air decompression are associated with inflammatory vascular injuries. J. Appl. Physiol. 2012, 112, 204–211. [Google Scholar] [CrossRef]
  31. Yang, M.; Kosterin, P.; Salzberg, B.M.; Milovanova, T.N.; Bhopale, V.M.; Thom, S.R. Microparticles generated by decompression stress cause central nervous system injury manifested as neurohypophiseal terminal action potential broadening. J. Appl. Physiol. 2013, 115, 1481–1486. [Google Scholar] [CrossRef] [PubMed]
  32. Van Hoy, S.E. Integrating Alternative Ultrasound Technology into Saturation Facility Operations. Int. J. Appl. Technol. Leadersh. 2024, 3, 1–10. [Google Scholar]
  33. OJ, O.N.; Haftel, A.; Murphy-Lavoie, H.M. Hyperbaric Treatment of Compressed Air Workers, Caissons, Tunneling, Bounce Diving, and Saturation Diving; StatPearls Publishing: Treasure Island, FL, USA, 2024. [Google Scholar]
  34. Kageyama, N.; Sawamura, T. Effect of hyperbaric exposure on cognitive performance: An investigation conducting numerical Stroop tasks during a simulated 440 m sea water saturation diving. J. Physiol. Anthropol. 2024, 43, 24. [Google Scholar] [CrossRef] [PubMed]
  35. Thom, S.R.; Bhopale, V.M.; Yang, M. Neutrophils generate microparticles during exposure to inert gases due to cytoskeletal oxidative stress. J. Biol. Chem. 2014, 289, 18831–18845. [Google Scholar] [CrossRef]
  36. Bhopale, V.M.; Ruhela, D.; Brett, K.D.; Nugent, N.Z.; Fraser, N.K.; Levinson, S.L.; DiNubile, M.J.; Thom, S.R. Plasma gelsolin modulates the production and fate of IL-1β-containing microparticles following high-pressure exposure and decompression. J. Appl. Physiol. 2021, 130, 1604–1613. [Google Scholar] [CrossRef]
  37. Brett, K.D.; Nugent, N.Z.; Fraser, N.K.; Bhopale, V.M.; Yang, M.; Thom, S.R. Microparticle and interleukin-1β production with human simulated compressed air diving. Sci. Rep. 2019, 9, 13320. [Google Scholar] [CrossRef]
  38. Arya, A.K.; Balestra, C.; Bhopale, V.M.; Tuominen, L.J.; Räisänen-Sokolowski, A.; Dugrenot, E.; L’Her, E.; Bhat, A.R.; Thom, S.R. Elevations of Extracellular Vesicles and Inflammatory Biomarkers in Closed Circuit SCUBA Divers. Int. J. Mol. Sci. 2023, 24, 5969. [Google Scholar] [CrossRef]
  39. Leveque, C.; Mrakic Sposta, S.; Theunissen, S.; Germonpré, P.; Lambrechts, K.; Vezzoli, A.; Bosco, G.; Lévénez, M.; Lafère, P.; Guerrero, F.; et al. Oxidative Stress Response Kinetics after 60 Minutes at Different (1.4 ATA and 2.5 ATA) Hyperbaric Hyperoxia Exposures. Int. J. Mol. Sci. 2023, 24, 12361. [Google Scholar] [CrossRef]
  40. Balestra, C.; Mrakic-Sposta, S.; Virgili, F. Oxygen Variations-Insights into Hypoxia, Hyperoxia and Hyperbaric Hyperoxia—Is the Dose the Clue? Int. J. Mol. Sci. 2023, 24, 13472. [Google Scholar] [CrossRef]
  41. Balestra, C.; Arya, A.K.; Leveque, C.; Virgili, F.; Germonpre, P.; Lambrechts, K.; Lafere, P.; Thom, S.R. Varying Oxygen Partial Pressure Elicits Blood-Borne Microparticles Expressing Different Cell-Specific Proteins-Toward a Targeted Use of Oxygen? Int. J. Mol. Sci. 2022, 23, 7888. [Google Scholar] [CrossRef]
  42. Doubt, T.J. Cardiovascular and thermal responses to SCUBA diving. Med. Sci. Sports Exerc. 1996, 28, 581–586. [Google Scholar] [CrossRef] [PubMed]
  43. Ferrer, M.D.; Sureda, A.; Batle, J.M.; Tauler, P.; Tur, J.A.; Pons, A. Scuba diving enhances endogenous antioxidant defenses in lymphocytes and neutrophils. Free Radic. Res. 2007, 41, 274–281. [Google Scholar] [CrossRef] [PubMed]
  44. Valacchi, G.; Virgili, F.; Cervellati, C.; Pecorelli, A. OxInflammation: From Subclinical Condition to Pathological Biomarker. Front. Physiol. 2018, 9, 858. [Google Scholar] [CrossRef] [PubMed]
  45. Silveira, L.L.; Sarandy, M.M.; Novaes, R.D.; Morais-Santos, M.; Gonçalves, R.V. OxInflammation Affects Transdifferentiation to Myofibroblasts, Prolonging Wound Healing in Diabetes: A Systematic Review. Int. J. Mol. Sci. 2024, 25, 8992. [Google Scholar] [CrossRef]
  46. Rahal, A.; Kumar, A.; Singh, V.; Yadav, B.; Tiwari, R.; Chakraborty, S.; Dhama, K. Oxidative stress, prooxidants, and antioxidants: The interplay. BioMed Res. Int. 2014, 2014, 761264. [Google Scholar] [CrossRef]
  47. Done, A.J.; Traustadottir, T. Nrf2 mediates redox adaptations to exercise. Redox Biology 2016, 10, 191–199. [Google Scholar] [CrossRef]
  48. Bosco, G.; Rizzato, A.; Quartesan, S.; Camporesi, E.; Mrakic-Sposta, S.; Moretti, S.; Balestra, C.; Rubini, A. Spirometry and oxidative stress after rebreather diving in warm water. Undersea Hyperb. Med. 2018, 45, 191–198. [Google Scholar] [CrossRef]
  49. Morrow, J.D.; Chen, Y.; Brame, C.J.; Yang, J.; Sanchez, S.C.; Xu, J.; Zackert, W.E.; Awad, J.A.; Roberts, L.J. The isoprostanes: Unique prostaglandin-like products of free-radical-initiated lipid peroxidation. Drug Metab. Rev. 1999, 31, 117–139. [Google Scholar] [CrossRef]
  50. Liu, T.; Stern, A.; Roberts, L.J.; Morrow, J.D. The isoprostanes: Novel prostaglandin-like products of the free radical-catalyzed peroxidation of arachidonic acid. J. Biomed. Sci. 1999, 6, 226–235. [Google Scholar] [CrossRef]
  51. Tranfo, G.; Marchetti, E.; Pigini, D.; Miccheli, A.; Spagnoli, M.; Sciubba, F.; Conta, G.; Tomassini, A.; Fattorini, L. Targeted and untargeted metabolomics applied to occupational exposure to hyperbaric atmosphere. Toxicol. Lett. 2020, 328, 28–34. [Google Scholar] [CrossRef]
  52. Theunissen, S.; Guerrero, F.; Sponsiello, N.; Cialoni, D.; Pieri, M.; Germonpre, P.; Obeid, G.; Tillmans, F.; Papadopoulou, V.; Hemelryck, W.; et al. Nitric oxide-related endothelial changes in breath-hold and scuba divers. Undersea Hyperb. Med. 2013, 40, 135–144. [Google Scholar] [PubMed]
  53. Cialoni, D.; Brizzolari, A.; Samaja, M.; Pieri, M.; Marroni, A. Altered Venous Blood Nitric Oxide Levels at Depth and Related Bubble Formation During Scuba Diving. Front. Physiol. 2019, 10, 57. [Google Scholar] [CrossRef] [PubMed]
  54. Sureda, A.; Ferrer, M.D.; Batle, J.M.; Tauler, P.; Tur, J.A.; Pons, A. Scuba diving increases erythrocyte and plasma antioxidant defenses and spares NO without oxidative damage. Med. Sci. Sports Exerc. 2009, 41, 1271–1276. [Google Scholar] [CrossRef] [PubMed]
  55. Sureda, A.; Batle, J.M.; Ferrer, M.D.; Mestre-Alfaro, A.; Tur, J.A.; Pons, A. Scuba diving activates vascular antioxidant system. Int. J. Sports Med. 2012, 33, 531–536. [Google Scholar] [CrossRef] [PubMed]
  56. Bigley, N.J.; Perymon, H.; Bowman, G.C.; Hull, B.E.; Stills, H.F.; Henderson, R.A. Inflammatory cytokines and cell adhesion molecules in a rat model of decompression sickness. J. Interf. Cytokine Res. 2008, 28, 55–63. [Google Scholar] [CrossRef]
  57. Sen, C.K.; Packer, L. Antioxidant and redox regulation of gene transcription. FASEB J. 1996, 10, 709–720. [Google Scholar] [CrossRef]
  58. Fratantonio, D.; Virgili, F.; Zucchi, A.; Lambrechts, K.; Latronico, T.; Lafere, P.; Germonpre, P.; Balestra, C. Increasing Oxygen Partial Pressures Induce a Distinct Transcriptional Response in Human PBMC: A Pilot Study on the “Normobaric Oxygen Paradox”. Int. J. Mol. Sci. 2021, 22, 458. [Google Scholar] [CrossRef]
  59. Wang, H.T.; Fang, Y.Q.; Bao, X.C.; Yuan, H.R.; Ma, J.; Wang, F.F.; Zhang, S.; Li, K.C. Expression changes of TNF-alpha, IL-1beta and IL-6 in the rat lung of decompression sickness induced by fast buoyancy ascent escape. Undersea Hyperb. Med. 2015, 42, 23–31. [Google Scholar]
  60. Brizzolari, A.; Bosco, G.; Vezzoli, A.; Dellanoce, C.; Barassi, A.; Paganini, M.; Cialoni, D.; Mrakic-Sposta, S. Seasonal Oxy-Inflammation and Hydration Status in Non-Elite Freeskiing Racer: A Pilot Study by Non-Invasive Analytic Method. Int. J. Environ. Res. Public. Health 2023, 20, 3157. [Google Scholar] [CrossRef]
  61. Mrakic-Sposta, S.; Vezzoli, A.; Rizzato, A.; Della Noce, C.; Malacrida, S.; Montorsi, M.; Paganini, M.; Cancellara, P.; Bosco, G. Oxidative stress assessment in breath-hold diving. Eur. J. Appl. Physiol. 2019, 119, 2449–2456. [Google Scholar] [CrossRef]
  62. Leveque, C.; Mrakic-Sposta, S.; Lafere, P.; Vezzoli, A.; Germonpre, P.; Beer, A.; Mievis, S.; Virgili, F.; Lambrechts, K.; Theunissen, S.; et al. Oxidative Stress Response’s Kinetics after 60 Minutes at Different (30% or 100%) Normobaric Hyperoxia Exposures. Int. J. Mol. Sci. 2022, 24, 664. [Google Scholar] [CrossRef]
  63. Schneider-Crease, I.A.; Feder, J.A.; Baniel, A.; McCann, C.; Haile, A.A.; Abebe, B.; Fitzgerald, L.; Gomery, M.A.; Simberloff, R.A.; Petrie, Z.L.; et al. Urinary neopterin reflects immunological variation associated with age, helminth parasitism, and the microbiome in a wild primate. Sci. Rep. 2022, 12, 21307. [Google Scholar] [CrossRef] [PubMed]
  64. Wang, Q.; Belhomme, M.; Guerrero, F.; Mazur, A.; Lambrechts, K.; Theron, M. Diving under a microscope--a new simple and versatile in vitro diving device for fluorescence and confocal microscopy allowing the controls of hydrostatic pressure, gas pressures, and kinetics of gas saturation. Microsc. Microanal. 2013, 19, 608–616. [Google Scholar] [CrossRef] [PubMed]
  65. Thom, S.R.; Bhopale, V.M.; Bhat, A.R.; Arya, A.K.; Ruhela, D.; Qiao, G.; Li, X.; Tang, S.; Xu, S. Neuroinflammation with increased glymphatic flow in a murine model of decompression sickness. J. Neurophysiol. 2023, 129, 662–671. [Google Scholar] [CrossRef] [PubMed]
  66. Jy, W.; Mao, W.W.; Horstman, L.; Tao, J.; Ahn, Y.S. Platelet microparticles bind, activate and aggregate neutrophils in vitro. Blood Cells Mol. Dis. 1995, 21, 217–231. [Google Scholar] [CrossRef]
  67. Valadez-Cosmes, P.; Maitz, K.; Kindler, O.; Raftopoulou, S.; Kienzl, M.; Santiso, A.; Mihalic, Z.N.; Brcic, L.; Lindenmann, J.; Fediuk, M.; et al. Identification of Novel Low-Density Neutrophil Markers Through Unbiased High-Dimensional Flow Cytometry Screening in Non-Small Cell Lung Cancer Patients. Front. Immunol. 2021, 12, 703846. [Google Scholar] [CrossRef]
  68. Cypryk, W.; Nyman, T.A.; Matikainen, S. From inflammasome to exosome-does extracellular vesicle secretion constitute an inflammasome-dependent immune response? Front. Immunol. 2018, 9, 2188. [Google Scholar] [CrossRef]
  69. Zamora, R.; Vodovotz, Y.; Billiar, T.R. Inducible Nitric Oxide Synthase and Inflammatory Diseases. Mol. Med. 2000, 6, 347–373. [Google Scholar] [CrossRef]
  70. Yang, M.; Barak, O.F.; Dujic, Z.; Madden, D.; Bhopale, V.M.; Bhullar, J.; Thom, S.R. Ascorbic acid supplementation diminishes microparticle elevations and neutrophil activation following SCUBA diving. Am. J. Physiol. Regul. Integr. Comp. Physiol. 2015, 309, R338–R344. [Google Scholar] [CrossRef]
  71. Thom, S.R.; Bhopale, V.M.; Yang, M. Microparticle-induced vascular injury in mice following decompression is inhibited by hyperbaric oxygen: Effects on microparticles and interleukin-1beta. J. Appl. Physiol. 2019, 126, 1006–1014. [Google Scholar] [CrossRef]
  72. Ostrowski, K.; Hermann, C.; Bangash, A.; Schjerling, P.; Nielsen, J.N.; Pedersen, B.K. A trauma-like elevation of plasma cytokines in humans in response to treadmill running. J. Physiol. 1998, 513 Pt 3, 889–894. [Google Scholar] [CrossRef]
  73. Sugama, K.; Suzuki, K.; Yoshitani, K.; Shiraishi, K.; Kometani, T. Urinary excretion of cytokines versus their plasma levels after endurance exercise. Exerc. Immunol. Rev. 2013, 19, 29–48. [Google Scholar] [PubMed]
  74. Schubert, C.; Seizer, L.; Chamson, E.; König, P.; Sepp, N.; Ocaña-Peinado, F.M.; Schnapka-Köpf, M.; Fuchs, D. Real-Life Cause-Effect Relations Between Urinary IL-6 Levels and Specific and Nonspecific Symptoms in a Patient With Mild SLE Disease Activity. Front. Immunol. 2021, 12, 718838. [Google Scholar] [CrossRef] [PubMed]
  75. Khatri, N.; Sagar, A.; Peddada, N.; Choudhary, V.; Singh Chopra, B.; Garg, V.; Ashish. Plasma gelsolin levels decrease in diabetic state and increase upon treatment with F-actin depolymerizing versions of gelsolin. J. Diab Res. 2014, 2014, 152075. [Google Scholar] [CrossRef]
  76. Lu, C.-H.; Lin, S.-T.; Chou, H.-C.; Lee, Y.-R.; Chan, H.-L. Proteomic analysis of retinopathy-related plasma biomarkers in diabetic patients. Arch. Biochem. Biophys. 2013, 529, 146–156. [Google Scholar] [CrossRef]
  77. Lee, P.S.; Patel, S.R.; Christiani, D.C.; Bajwa, E.; Stossel, T.P.; Waxman, A.B. Plasma gelsolin depletion and circulating actin in sepsis: A pilot study. PLoS ONE 2008, 3, e3712. [Google Scholar] [CrossRef]
  78. Lee, P.S.; Sampath, K.; Karumanchi, S.A.; Tamez, H.; Bhan, I.; Isakova, T.; Gutierrez, O.M.; Wolf, M.; Chang, Y.; Stossel, T.P.; et al. Plasma gelsolin and circulating actin correlate with hemodialysis mortality. Am. Soc. Nephrol. 2009, 20, 1140–1148. [Google Scholar] [CrossRef]
  79. Osborn, T.M.; Verdrengh, M.; Stossel, T.P.; Tarkowski, A.; Bokarewa, M. Decreased levels of the gelsolin plasma isoform in patients with rheumatoid arthritis. Arthritis Res. Ther. 2008, 10, R117. [Google Scholar] [CrossRef] [PubMed]
  80. Peddada, N.; Sagar, A.; Ashish; Garg, R. Plasma gelsolin: A general prognostic marker of health. Med. Hypotheses 2012, 778, 203–210. [Google Scholar] [CrossRef]
  81. Overmyer, K.A.; Shishkova, E.; Miller, I.J.; Balnis, J.; Bernstein, M.N.; Peters-Clarke, T.M.; Meyer, J.G.; Quan, Q.; Muehlbauer, L.K.; Trujillo, E.A.; et al. Large-scale multi-omic analysis of COVID-19 severity. medRxiv 2020. [Google Scholar] [CrossRef]
  82. Thom, S.R.; Bhopale, V.M.; Arya, A.K.; Ruhela, D.; Bhat, A.R.; Mitra, N.; Hoffstad, O.; Malay, D.S.; Mirza, Z.K.; Lantis, J.C.; et al. Blood-Borne Microparticles Are an Inflammatory Stimulus in Type 2 Diabetes Mellitus. Immunohorizons 2023, 7, 71–80. [Google Scholar] [CrossRef] [PubMed]
  83. Piktel, E.; Levental, I.; Durnás, B.; Janmey, P.; Bucki, R. Plasma gelsolin: Indicator of inflammation and its potential as a diagnostic tool and therapeutic target. Int. J. Mol. Sci. 2018, 19, 2516. [Google Scholar] [CrossRef] [PubMed]
  84. Van Damme-Ostapowicz, K.; Cybulski, M.; Kozakiewicz, M.; Krajewska-Kułak, E.; Siermontowski, P.; Sobolewski, M.; Kaczerska, D. Analysis of the Increase of Vascular Cell Adhesion Molecule-1 (VCAM-1) Expression and the Effect of Exposure in a Hyperbaric Chamber on VCAM-1 in Human Blood Serum: A Cross-Sectional Study. Medicina 2022, 58, 95. [Google Scholar] [CrossRef]
  85. Bao, X.C.; Shen, Q.; Fang, Y.Q.; Wu, J.G. Human Physiological Responses to a Single Deep Helium-Oxygen Diving. Front. Physiol. 2021, 12, 735986. [Google Scholar] [CrossRef]
  86. Wang, S.; Chen, H.; Li, Z.; Xu, G.; Bao, X. Hyperbaric oxygen-induced acute lung injury: A mouse model study on pathogenic characteristics and recovery dynamics. Front. Physiol. 2024, 15, 1474933. [Google Scholar] [CrossRef]
  87. MacLaughlin, K.J.; Barton, G.P.; Braun, R.K.; MacLaughlin, J.E.; Lamers, J.J.; Marcou, M.D.; Eldridge, M.W. Hyperbaric air mobilizes stem cells in humans; a new perspective on the hormetic dose curve. Front. Neurol. 2023, 14, 1192793. [Google Scholar] [CrossRef]
  88. MacLaughlin, K.J.; Barton, G.P.; Braun, R.K.; Eldridge, M.W. Effect of intermittent hyperoxia on stem cell mobilization and cytokine expression. Med. Gas. Res. 2019, 9, 139–144. [Google Scholar] [CrossRef] [PubMed]
  89. Wang, Q.; Guerrero, F.; Lambrechts, K.; Mazur, A.; Buzzacott, P.; Belhomme, M.; Theron, M. Simulated air dives induce superoxide, nitric oxide, peroxynitrite, and Ca(2+) alterations in endothelial cells. J. Physiol. Biochem. 2020, 76, 61–72. [Google Scholar] [CrossRef]
  90. Wang, Q.; Guerrero, F.; Mazur, A.; Lambrechts, K.; Buzzacott, P.; Belhomme, M.; Theron, M. Reactive Oxygen Species, Mitochondria, and Endothelial Cell Death during In Vitro Simulated Dives. Med. Sci. Sports Exerc. 2015, 47, 1362–1371. [Google Scholar] [CrossRef]
  91. Oei, G.T.M.L.; Smit, K.F.; vd Vondervoort, D.; Brevoord, D.; Hoogendijk, A.; Wieland, C.W.; Hollmann, M.W.; Preckel, B.; Weber, N.C. Effects of helium and air inhalation on the innate and early adaptive immune system in healthy volunteers ex vivo. J. Transl. Med. 2012, 10, 201. [Google Scholar] [CrossRef]
  92. Hild, M.; Schmidt, R. The mechanism of the collision-induced enhancement of the radiative transitions of oxygen. J. Phys. Chem. 1999, 103, 6091–6096. [Google Scholar] [CrossRef]
  93. World Medical, A. World Medical Association Declaration of Helsinki: Ethical principles for medical research involving human subjects. JAMA 2013, 310, 2191–2194. [Google Scholar] [CrossRef] [PubMed]
  94. Thom, S.R.; Hampton, M.; Troiano, M.A.; Mirza, Z.; Malay, D.S.; Shannon, S.; Jennato, N.B.; Donohue, C.M.; Hoffstad, O.; Woltereck, D.; et al. Measurements of CD34+/CD45-dim Stem Cells Predict Healing of Diabetic Neuropathic Wounds. Diabetes 2016, 65, 486–497. [Google Scholar] [CrossRef]
  95. Chen, J.K.; Zhan, Y.J.; Yang, C.S.; Tzeng, S.F. Oxidative stress-induced attenuation of thrombospondin-1 expression in primary rat astrocytes. J. Cell Biochem. 2011, 112, 59–70. [Google Scholar] [CrossRef]
  96. Tung, J.W.; Parks, D.R.; Moore, W.A.; Herzenberg, L.A.; Herzenberg, L.A. New approaches to fluorescence compensation and visualization of FACS data. Clin. Immunol. 2004, 110, 277–283. [Google Scholar] [CrossRef] [PubMed]
  97. Vezzoli, A.; Dellanoce, C.; Mrakic-Sposta, S.; Montorsi, M.; Moretti, S.; Tonini, A.; Pratali, L.; Accinni, R. Oxidative Stress Assessment in Response to Ultraendurance Exercise: Thiols Redox Status and ROS Production according to Duration of a Competitive Race. Oxid. Med. Cell Longev. 2016, 2016, 6439037. [Google Scholar] [CrossRef] [PubMed]
  98. Mrakic-Sposta, S.; Biagini, D.; Bondi, D.; Pietrangelo, T.; Vezzoli, A.; Lomonaco, T.; Di Francesco, F.; Verratti, V. OxInflammation at High Altitudes: A Proof of Concept from the Himalayas. Antioxidants 2022, 11, 368. [Google Scholar] [CrossRef]
  99. Green, L.C.; Wagner, D.A.; Glogowski, J.; Skipper, P.L.; Wishnok, J.S.; Tannenbaum, S.R. Analysis of nitrate, nitrite, and [15N]nitrate in biological fluids. Anal. Biochem. 1982, 126, 131–138. [Google Scholar] [CrossRef]
  100. Green, H.J.; Fraser, I.G. Differential effects of exercise intensity on serum uric acid concentration. Med. Sci. Sports Exerc. 1988, 20, 55–59. [Google Scholar] [CrossRef]
  101. Glantzounis, G.K.; Tsimoyiannis, E.C.; Kappas, A.M.; Galaris, D.A. Uric acid and oxidative stress. Curr. Pharm. Des. 2005, 11, 4145–4151. [Google Scholar] [CrossRef]
Figure 1. Activation of neutrophils after inert gas exposure (N2 grey, He Blue). Data are shown as mean ± SD expressed in % of pre-exposure values of neutrophils (identified in flow cytometer based on CD66b expression) expressing myeloperoxidase (MPO) and CD18 above threshold value as index of cell activation (one-sample t-test and unpaired t-test). (* p < 0.05; ** p < 0.01; *** p < 0.001; ns = Non-Significant.)
Ijms 25 12067 g001
Figure 2. Microparticles in blood after helium or nitrogen exposure (N2 grey, He Blue). Flow cytometry was used to evaluate MPs. Relative variations expressed in % of pre-exposure value of each that expressed proteins specific to different cells, including neutrophils (CD66b), endothelial cells (CD146), platelets (CD41a), and microglia (transmembrane protein 119, TMEM). As discussed in text, proteins expressing TSP-1 and F-actin, evaluated as those binding phalloidin, were also assessed. Data are shown as mean ± SD (* = p < 0.05; ns = non-significant; t-test vs. control, with everyone acting as its own control (one-sample t-test)).
Ijms 25 12067 g002
Figure 3. IL-1B and iNOS (% of control values) (N2 grey, He Blue). Data are shown as mean ± SD (** p < 0.01; **** p < 0.0001; ns = not significant; Wilcoxon and Mann–Whitney tests).
Ijms 25 12067 g003
Figure 4. Plasma gelsolin (% of control values) (N2 grey, He Blue). Data are shown as mean ± SD (** p < 0.01; *** p < 0.001; Wilcoxon and Mann–Whitney tests; NS = not significant).
Ijms 25 12067 g004
Figure 5. Oxyinflammation % of control values (N2 grey, He Blue). Data are shown as mean ± SD. ** p < 0.01; *** p < 0.001; ns = not significant; t-test and one-sample t-test.
Ijms 25 12067 g005
Figure 6. Endothelial markers (N2 grey, He Blue). VCAM-1. Data are shown as mean ± SD. * p < 0.05; *** p < 0.001; t-test and one-sample t-test.
Ijms 25 12067 g006
Figure 7. Experimental flowchart.
Ijms 25 12067 g007
Table 1. Activation of neutrophils from all participants in exposure to both inert gasses. Data are shown as mean ± SD (n = sample number) % of neutrophils and median fluorescence (identified in flow cytometer based on CD66b expression) expressing myeloperoxidase (MPO), CD41, plasma gelsolin, and CD18 above threshold value as index of cell activation. Pre- and post-exposure results are shown as mean ± SD. (Paired t-test: * p < 0.05, ** p < 0.01, and *** p < 0.001.) (Two post-exposure blood samples were unusable in N2 group.)
ExpositionBaselineAfter 120 minp ValueSize Effectn
He 1.45 ATA
(20 kPa oxygen)
MPs/μLMPs/μLPaired t-testCohen’s d
% CD181.31 ± 0.4333.66± 1.579<0.001 ***−1.58114
Median CD1818.44 ± 5.82620.72 ± 6.117<0.001 ***−1.61314
% CD413.91 ± 1.9336.11 ± 1.8600.002 **−1.02014
Median CD4157.52 ± 8.56861.09 ± 1.8690.012 *−0.77914
% Gelsolin5.57 ± 1.2233.38 ± 1.321<0.001 ***1.46014
Median—gelsolin25.86 ± 2.01223.91 ± 1.652<0.001 ***1.50814
% MPO1.40 ± 0.5473.49 ± 1.149<0.001 ***−1.79014
Median MPO5.13 ± 1.1785.13 ± 1.178<0.001 ***−1.62314
N2 1.45 ATA
(20 kPa oxygen)
% CD18-1.43 ± 0.6693.80 ± 1.4460.003 **−1.7687
Median17.83 ± 4.24718.92 ± 4.3090.020 *−1.1867
% CD414.13 ± 1.1507.69 ± 3.0370.009 **−1.4537
Median57.87 ± 6.19964.08 ± 7.9680.043 *−0.9647
% Gelsolin4.81 ± 1.3212.22 ± 1.0640.001 **2.2327
Median22.20 ± 4.12817.13 ± 3.7480.012 *1.3317
% MPO1.18 ± 0.5363.41± 1.206<0.001 ***−2.2817
Median 2.32 ± 0.7524.82 ± 1.6590.002 **−1.9707
Table 2. Absolute values for microparticle-derived responses in MPs/μL. Results are given as mean ± SD. (Paired t-test: * p < 0.05.)
Exposure (60 min)Baseline120 min Postp ValueSize Effectn
He 1.45 ATA
(20 kPa oxygen)
MPs/μLMPs/μLPaired t-testCohen’s d
Total MPs791.91 ± 120.230889.24 ± 148.1060.026 *−0.670714
CD66b+9.43 ± 1.0509.48 ± 1.1580.775−0.077914
CD146+20.02 ± 0.68920.35 ± 1.2190.290−0.295014
Thrombospoindin19.59 ± 0.8329.68 ± 1.1370.642−0.127214
CD41a+7.08 ± 1.5527.16 ± 1.5990.703−0.104214
TMEM-11929.67 ± 0.71229.78 ± 1.0320.705−0.103514
Phalloidin17.51 ± 0.56717.85 ± 0.8150.104−0.467314
N2 1.45 ATA
(20 kPa oxygen)
Total MPs742.13 ± 188.954844.04± 141.3850.115−0.5899
CD66b+9.63± 0.73610.15 ± 0.4310.111−0.5979
CD146+21.40 ± 1.53321.57 ± 0.9480.611−0.1769
Thrombospoindin18.81 ± 0.6029.16 ± 0.5300.295−0.3749
CD41a+5.70 ± 0.6535.78 ± 0.4110.685−0.1409
TMEM-11930.07 ± 0.69730.22 ± 0.3170.535−0.2169
Phalloidin17.85 ± 0.93218.21 ± 0.6180.148−0.5349
Table 3. Intra-MPs, iNOS (pg/million MPs), and plasma gelsolin μg/mL. Data are shown as mean ± SD (n = sample number) pre- and post-exposure for both inert gasses. Results are shown as mean ± SD. (Wilcoxon test: ** p < 0.01, and *** p < 0.001.)
Exposure (60 min)BaselinePost-120 min of Exposurep ValueSize Effectn
He 1.45 ATA
(20 kPa oxygen)
PrePostWilcoxonCohen’s d
IL-1β (pg/million MPs)-33.7 ± 47.2--13
iNOS (pg/million MPs)0.174 ± 0.09520.510 ± 0.258<0.001 ***−1.0014
Gelsolin (μg/mL)190 ± 226.526.0 ± 22.30.931−0.024514
N2 1.45 ATA
(20 kPa oxygen)
IL-1β (pg/million MPs)11.6 ± 6.1438.1 ± 32.90.004 **−1.009
iNOS (pg/million MPs)0.0503 ± 0.0330.347 ± 0.1260.001 **−1.009
Gelsolin (μg/mL)147.7 ± 56.942.7 ± 26.90.004 **1.369
Table 4. ROS production rate (mmol·min−1) and TAC (mM) in saliva, lipid peroxidation (pg⋅mol−1creatinine), neopterin, IL 6 (pg·min−1), and NOx (mM) in urine. Data are shown as mean ± SD (n = sample number) pre- and post-exposure for both inert gasses (paired t-test: * p < 0.05; ** p < 0.01; *** p < 0.001).
Exposure (60 min)BaselinePost-120 min of Exposure p ValueSize Effectn
He 1.45 ATA (20 kPa oxygen)ValueValuePaired-t testCohen’s d
ROS—He (μmol⋅min−1)0.240 ± 0.0110.308 ± 0.009<0.001 **−4.77814
TAC—He (mM)0.244 ± 0.0610.238 ± 0.0450.1310.64014
8-iso-PGF2 α -He (pg⋅mg−1 creatinine)224.3 ± 74.90258.4 ± 61.630.190−0.55214
Neopterin—He (mM⋅mol−1 creatinine)7.07 ± 2.155.97 ± 1.900.046 *−0.86114
IL-6—He (pg·mL−1) 4.18 ± 1.503.43 ± 1.110.126−0.98214
NOx—He (µM)803 ± 428449 ± 2400.020 *1.02214
N2 1.45 ATA (20 kPa oxygen)
ROS—N (μmol⋅min−1)0.238 ± 0.0080.307 ± 0.018<0.001 ***−6.0859
TAC—N (mM)0.255 ± 0.0250.225 ± 0.0600.1890.1219
8-iso-PGF2 ⍺ -N (pg·mg−1 creatinine)364.3 ± 80.56413.1 ± 95.480.281−0.4979
Neopterin -N (mM⋅mol−1creatinine)7.87 ± 1.935.76 ± 1.680.071−0.8579
IL-6—N (pg·mL−1) 3.82 ± 1.515.54 ± 1.980.012 *0.5679
NOx—N (µM)671 ± 293493 ± 1890.1240.7219
Table 5. VCAM-1 (μg·L−1). Data are shown as mean ± SD (n = sample number) for pre- and post-exposure to both inert gasses. Results are given in mean ± SD. (Paired t-test: p < 0.05.)
Exposure (60 min)BaselinePost-120 min of Exposure p ValueSize Effectn
He 1.45 ATA (20 kPa oxygen)ValueValuePaired t-testCohen’s d
VCAM-1—He (mg·L−1)580 ± 122624 ± 1260.402−0.34914
N2 1.45 ATA ((20 kPa oxygen)
VCAM-1—N (mg·L−1)611 ± 116561 ± 1180.3510.4289
Disclaimer/Publisher’s Note: The statements, opinions and data contained in all publications are solely those of the individual author(s) and contributor(s) and not of MDPI and/or the editor(s). MDPI and/or the editor(s) disclaim responsibility for any injury to people or property resulting from any ideas, methods, instructions or products referred to in the content.

