Article

Molecular Characterization of Subdomain Specification of Cochlear Duct Based on Foxg1 and Gata3

1
Department of Biochemistry, Chungbuk National University, Cheongju 28644, Republic of Korea
2
Department of Biochemistry and Molecular Biology, Brain Korea 21 Project, Asan Medical Center, University of Ulsan College of Medicine, Seoul 138-736, Republic of Korea
3
Laboratory Animal Resource and Research Center, Korea Research Institute of Bioscience and Biotechnology, Cheongju 28116, Republic of Korea
*
Authors to whom correspondence should be addressed.
These authors contributed equally to this work.
Int. J. Mol. Sci. 2024, 25(23), 12700; https://doi.org/10.3390/ijms252312700
Submission received: 26 September 2024 / Revised: 20 November 2024 / Accepted: 22 November 2024 / Published: 26 November 2024
(This article belongs to the Special Issue Hearing Loss: Molecular Biological Insights)

Abstract

:
The inner ear is one of the sensory organs of vertebrates and is largely composed of the vestibule, which controls balance, and the cochlea, which is responsible for hearing. In particular, a problem in cochlear development can lead to hearing loss. Although numerous studies have been conducted on genes involved in the development of the cochlea, many areas still need to be discovered regarding factors that control the patterning of the early cochlear duct. Herein, based on the dynamic expression pattern of FOXG1 in the apical and basal regions of the E13.5 cochlear duct, we identified detailed expression regions through an open-source analysis of single-cell RNA analysis data and demonstrated a clinical correlation with hearing loss. The distinct expression patterns of FOXG1 and GATA3 during the patterning process of the cochlear duct provide important clues to understanding how the fates of the apical and basal regions are divided. These results are expected to be extremely important not only for understanding the molecular mechanisms involved in the early development of the cochlear duct, but also for identifying potential genes that cause hearing loss.

1. Introduction

Hearing loss is one of the most common sensory deficits in humans. It can occur at various ages, and its severity is classified according to the degree of symptoms. Sensorineural hearing loss (SNHL), which is caused by damage to the auditory nerve (cranial nerve VIII) and the central nervous system, is the most common type of hearing loss and is usually permanent [1,2,3]. SNHL is caused by environmental factors (e.g., aging, infectious diseases, noise exposure, and drug abuse) and genetic factors (e.g., genetic mutations); the majority of cases of congenital hearing loss are caused by genetic mutations [4]. Approximately 200 deafness-related loci and causative genes have been reported [5], and a pathological analysis is being conducted using animal models that can reproduce the human phenotype [6].
The inner ear is one of the representative sensory organs of vertebrates and is composed of the vestibule, which controls balance, and the cochlea, which recognizes sound [7]. The vertebrate inner ear is differentiated from the otic vesicle that occurs through the invagination of the ectoderm near the hindbrain. The otic vesicle is influenced by various factors from adjacent tissues to have an identity in each region along the three-dimensional axis [8]. The representative factors that determine this specification include WNT; sonic hedgehog (SHH), which determines the dorsal–ventral axis; retinoic acid, which forms the anterior–posterior axis; and Fgf3, which affects the medial–lateral axis [9,10,11]. Afterward, it undergoes sophisticated morphogenesis to differentiate into the inner ear, with the dorsal region extending to the vestibule and the ventral region developing into the cochlea [12]. The epithelium of the developing cochlear duct can be largely divided into the roof and the floor and is categorized into the following five detailed regions in the early stage of development: Reissner’s membrane and stria vascularis that differentiate from the roof; the prosensory domain (PSD) that differentiates from the floor and becomes the organ of corti (OC); a cellularly dense medial domain, the greater epithelial ridge (GER); and a less dense lateral domain, the lesser epithelial ridge (LER). This region specification is already completed during the early stage of cochlea duct outgrowth [13].
Numerous studies have reported on factors important for the formation of these regions. For example, Otx2 is expressed in the ventral portion of the otic vesicle and then in the roof of the cochlea duct [14]. Otx2 loss in the cochlear duct leads to the loss of the roof fate and the induction of the ectopic PSD [15]. Jag1 is expressed in the GER, including the PSD, early in development [16] and has an extremely important function in the differentiation of sensory progenitor cells into hair and supporting cells [17,18,19]. Sox2 is also expressed in the PSD and is essential for sensory cell differentiation [20,21,22]. Gata3, known as a mutant gene for HDR syndrome, is expressed in the floor part of the cochlear duct, particularly in the lateral region [23], and Gata3 loss during development results in the loss of neurosensory cells and the failed formation of normal sensory organs [24,25]. Bmp4 is expressed in the LER [26,27], and a decrease in it in the LER results in the underdevelopment of the PSD and the ectopic expression of GER marker genes [28]. Bmp4+/− mice have been reported to have partial hearing loss due to structural problems in the inner ear and a decrease in neurites in the OC [29].
Foxg1, a member of the forkhead family, is known to be an extremely important transcription factor in nervous system development and is expressed in the early otic vesicle [30]. The early expression of Foxg1 in the otic vesicle can be regulated by the SoxE family [31]; Foxg1 is also regulated by several inner-ear development factors, such as Six1, Gata3, and Sox2 [32]. During the inner-ear development of Foxg1 knockout mice, vestibular defects, shortened cochlear ducts, and an abnormal increase in the number of hair cells and impaired polarities were observed [33,34]. A functional study of Foxg1 in relation to hair cell differentiation at the postnatal stage reported that Foxg1 is important for hair cell maintenance as it regulates apoptosis [35]; in hair cell-specific Foxg1 cKO mice, the number of hair cells was greatly reduced and hearing was impaired due to increased apoptosis [36]. In supporting cell-specific Foxg1 cKO mice, the phenomenon of supporting cells trans-differentiating into hair cells has been reported, which appeared to be deeply related to the possibility of hair cell regeneration treatment [37]. Compared with such studies on normal differentiation and hair cell maintenance, studies on the detailed expression patterns and functions of Foxg1 in the early developmental stages are lacking. This is because these studies are difficult to conduct due to the severe morphological defects and the high lethality of the inner ear of Foxg1 KO mice [30,36]. In the present study, we discovered a unique expression pattern of FOXG1 in E13.5, the early developmental stage of the cochlear duct. We aimed to organize this in detail and identify the detailed cell types in which Foxg1 is actually expressed using open-source single-cell analysis data.

2. Results

2.1. Dynamics of FOXG1 Expression Patterns in the Developing Cochlear Duct

To investigate the expression pattern of Foxg1 in the developing cochlear duct, immunohistochemistry was employed so as to observe the detailed expression pattern according to the developmental stage. Gata3 is a well-known gene that is extremely important in inner-ear development and is expressed in the otic vesicle, hair cells of the OC, supporting cells, and surrounding spiral ganglion neurons (SGNs) [25]; thus, it was co-stained with FOXG1 (Figure 1). FOXG1 and GATA3 were strongly expressed throughout the otic vesicle at E9.5 (Figure 1A). Furthermore, they were expressed throughout the otic vesicle at E10.5, but FOXG1 was expressed more strongly in the ventral part and GATA3 in the mid-ventral part (Figure 1B). The cochlear duct began to extend from the ventral region of the otic vesicle at E11.5 [38]. At E11.5, GATA3 expressed bias toward the medial–dorsal part, whereas FOXG1 was expressed throughout (Figure 1C). At E12.5, GATA3 was expressed in the floor region of the dorsal part of the cochlear duct, whereas FOXG1 was still expressed in the roof and floor (Figure 1D). At E13.5, the cochlear duct was extended to about one turn, and one duct section near the apex and two duct sections toward the base could be seen in the section. GATA3 exhibited a consistent pattern of expression in the floor part, whereas FOXG1 was differently expressed depending on the location, i.e., it was expressed throughout the apical duct and exclusively together with GATA3 in the basal duct (Figure 1E). In particular, in the floor region of the cochlear duct, the expression area of FOXG1 was restricted and reduced at the base compared to the apex (Figure 1F). As the FOXG1 expression began to be restricted to more detailed regions in the cochlear duct at E13.5, the FOXG1 expression in the serial sections of the E13.5 cochlear duct was confirmed to determine the precise expression pattern (Supplementary Figure S1). Both FOXG1 and GATA3 were expressed in SGNs, and in most sections of the cochlear duct epithelium, FOXG1 and GATA3 exhibited an exclusive expression pattern. However, in the apex duct, FOXG1 was expressed throughout the duct, including the GATA3 expression area (Supplementary Figure S1C,D). This indicates that the cochlear duct at E13.5 has different developmental states from base to apex, which is similar to the pattern of hair cell differentiation. The cochlear duct is already a complex structure with detailed regions for differentiation, and FOXG1 is expressed throughout the apical duct even at E13.5; thus, it is thought that it does not affect region determination. However, the FOXG1 expression appears to be sensitively regulated according to a specific developmental period. Therefore, it is important to confirm in which detailed region of the cochlear duct FOXG1 is expressed.

2.2. Identification of Inner-Ear Cell Types Using Public Data

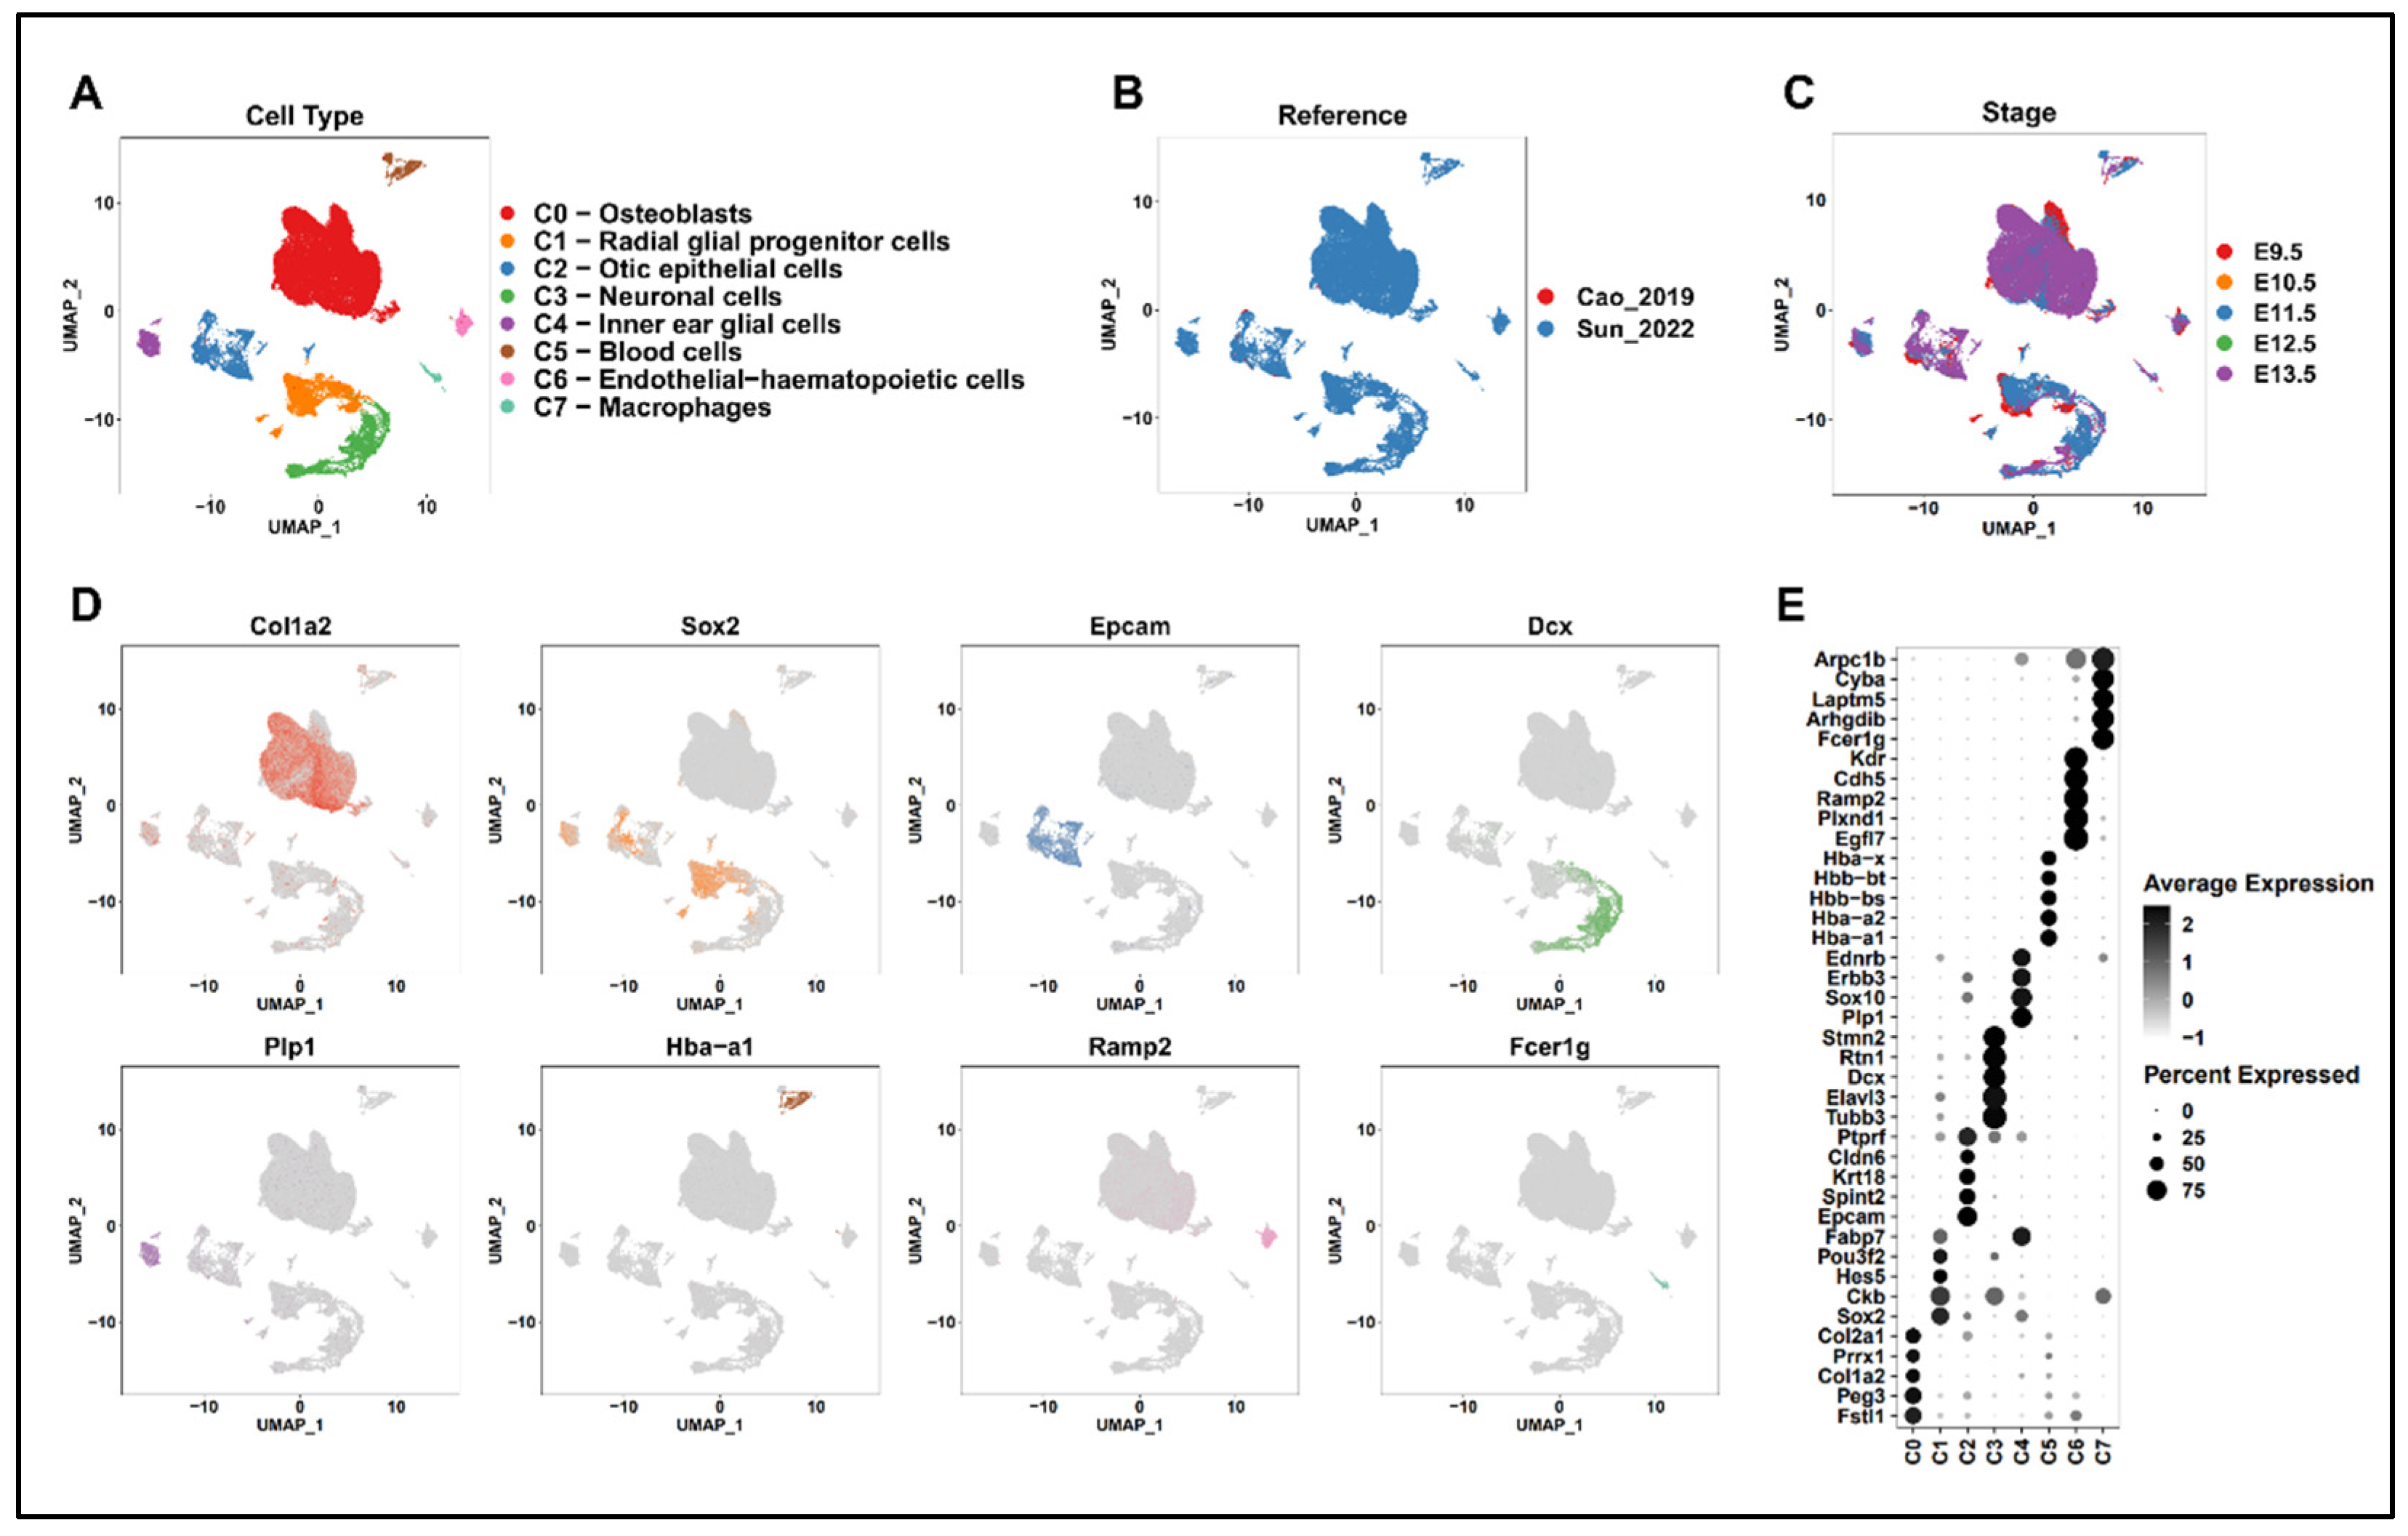
Numerous cell subtypes have been identified in previous single-cell RNA sequencing on the inner ear [39]. Among them, we isolated cells related to the cochlear duct and aimed to identify genes related to patterning involved in normal cochlear duct development, including Foxg1 and Gata3. To this end, single-cell RNA sequencing data defined by the auditory epithelial trajectory of E9.5–E13.5 mice and single-cell RNA sequencing data extracted from the inner ear of Foxg1Cre-Ai9 embryos were integrated using the harmony method (Figure 2B,C) [39,40,41]. A total of 81,102 inner-ear cells underwent a rigorous quality control process (Supplementary Figure S2A,B). Eight cell subtypes were defined via unsupervised clustering and marker gene expression and visualized via UMAP projection (Figure 2A,D,E). Specifically, they were clustered into osteoblast subtypes (C0) expressing Col1a2, Col2a1, and Fstl1 [42]; radial glial progenitor cell subtypes (C1) expressing Sox2 and Hes5 [43]; cochlear epithelial cell subtypes (C2) expressing Epcam [44]; neuronal cell subtypes (C3) expressing Tubb3 and Dcx [45,46]; inner-ear glial cell subtypes (C4) expressing Plp1 [47]; blood cell subtypes (C5) expressing Hba- and Hbb-families [48]; endothelial–hematopoietic cell subtypes (C6) expressing Kdr, Cdh5, and Ramp2 [49]; and macrophage subtypes (C7) expressing Fcer1g [50]. This clustering closely reflected the cell types previously reported to exist within the inner ear.

2.3. Subclustering of Cochlear Epithelial Cell Subtypes

To elucidate the exclusive expression patterns of FOXG1 and GATA3, E13.5 cochlear epithelial cell subtypes (C2) were subsetted, and then harmony integration was performed (Supplementary Figure S3A,B) [41]. A total of 2095 cells were subsetted, and subclustering was performed at various resolutions to distinguish specific areas exhibiting patterning. At a resolution of 0.03, 2 clusters were identified: at 0.1, 6 clusters; and at 0.5, 9 clusters (Supplementary Figure S3C–E). When the resolution was set to 0.5, marker genes, such as Tecta (C0), a cochlear medial side marker; Oc90 (C1), an otic marker; Clu, Fst, and Gata3 (C2), vestibular lateral side markers; and Hey2, Sox2 (C3), and Bmp4 (C8), LER markers, were identified (Supplementary Figure S3F) [51]. However, these marker genes overlapped in multiple clusters and actually exhibited a broader expression pattern (Supplementary Figure S3G). This is probably because differentiating cells exhibit transcriptome dynamics [52].

2.4. hdWGCNA of Cochlear Epithelial Cell Subtypes

Because Foxg1 and Gata3 showed extremely broad expression patterns on UMAP, it was difficult to clearly distinguish the exact Foxg1 and Gata3 expression areas. To address this problem, we employed a method to classify genes with similar expression patterns that are thought to be involved in specific biological functions. For this, high-dimensional weighted gene co-expression network analysis (hdWGCNA) was conducted on E13.5 cochlear epithelial cell subtypes [53]. To set the soft-thresholding power to secure the scale-free topology of the network, the scale-free topology model fit was evaluated for various power values. The optimal soft power threshold for the model fit value exceeding 0.8 was 14 (Supplementary Figure S4A). Based on this, network analysis was conducted, and 10 modules were identified from the dendrogram (Supplementary Figure S4B, Figure 3A). By confirming the eigengene-based connectivity (kME) of each gene, we found hub genes representing the modules and divided these modules according to specific areas. As many marker genes whose expression domains are well known were included as hub genes in the modules, the modules could be classified according to the region of the cochlear duct. Specifically, CD−M1 containing Oc90, Otx2, and Otx1, which are roof/epithelial markers; CD−M2 containing Clu, Fst, and Gata3, which are LER markers; CD−M3 containing Sox2 and Hey2, which are PSD markers; Tecta, Tectb, Fgf10, and Jag1, which are GER markers; CD−M9 containing ribosome-related genes; and CD−M10 containing mitochondria-related genes were classified (Figure 3A, Supplementary Figure S5A) [51].
The marker genes representing these modules exhibited high connectivity within the modules (Figure 3B). Gene Ontology (GO) enrichment analysis was conducted to confirm and classify the biological functions of the remaining modules. For CD−M4, ontology terms related to cell cycle and genes such as Ube2c, Top2a, and Mki67 were included. For CD−M5, ontology terms such as “pattern specification process”, “regionalization”, and “epithelial tube morphogenesis” as well as genes such as Irx1, Pax2, Tbx3, and Lrp2 were included, and the expression was shown in roof. For CD−M6, ontology terms related to “epithelial tube morphogenesis” as well as cytoskeleton and genes such as Rgcc, Gsn, Epha7, Six2, and Foxg1 were included, and the expression was shown in GER and roof. For CD−M7, ontology terms related to Catilage, Prrx1, and multiple collagen genes were included, whereas for CD−M8, ontology terms related to protein and RNA metabolism as well as genes such as Hspa8, Npm1, Rbmxl1, and Rbm8a were included. Analysis based on these modules enabled the classification of gene groups according to specific biological functions as well as the patterning of the developing cochlear duct.

2.5. Network Analysis of FOXG1 and GATA3

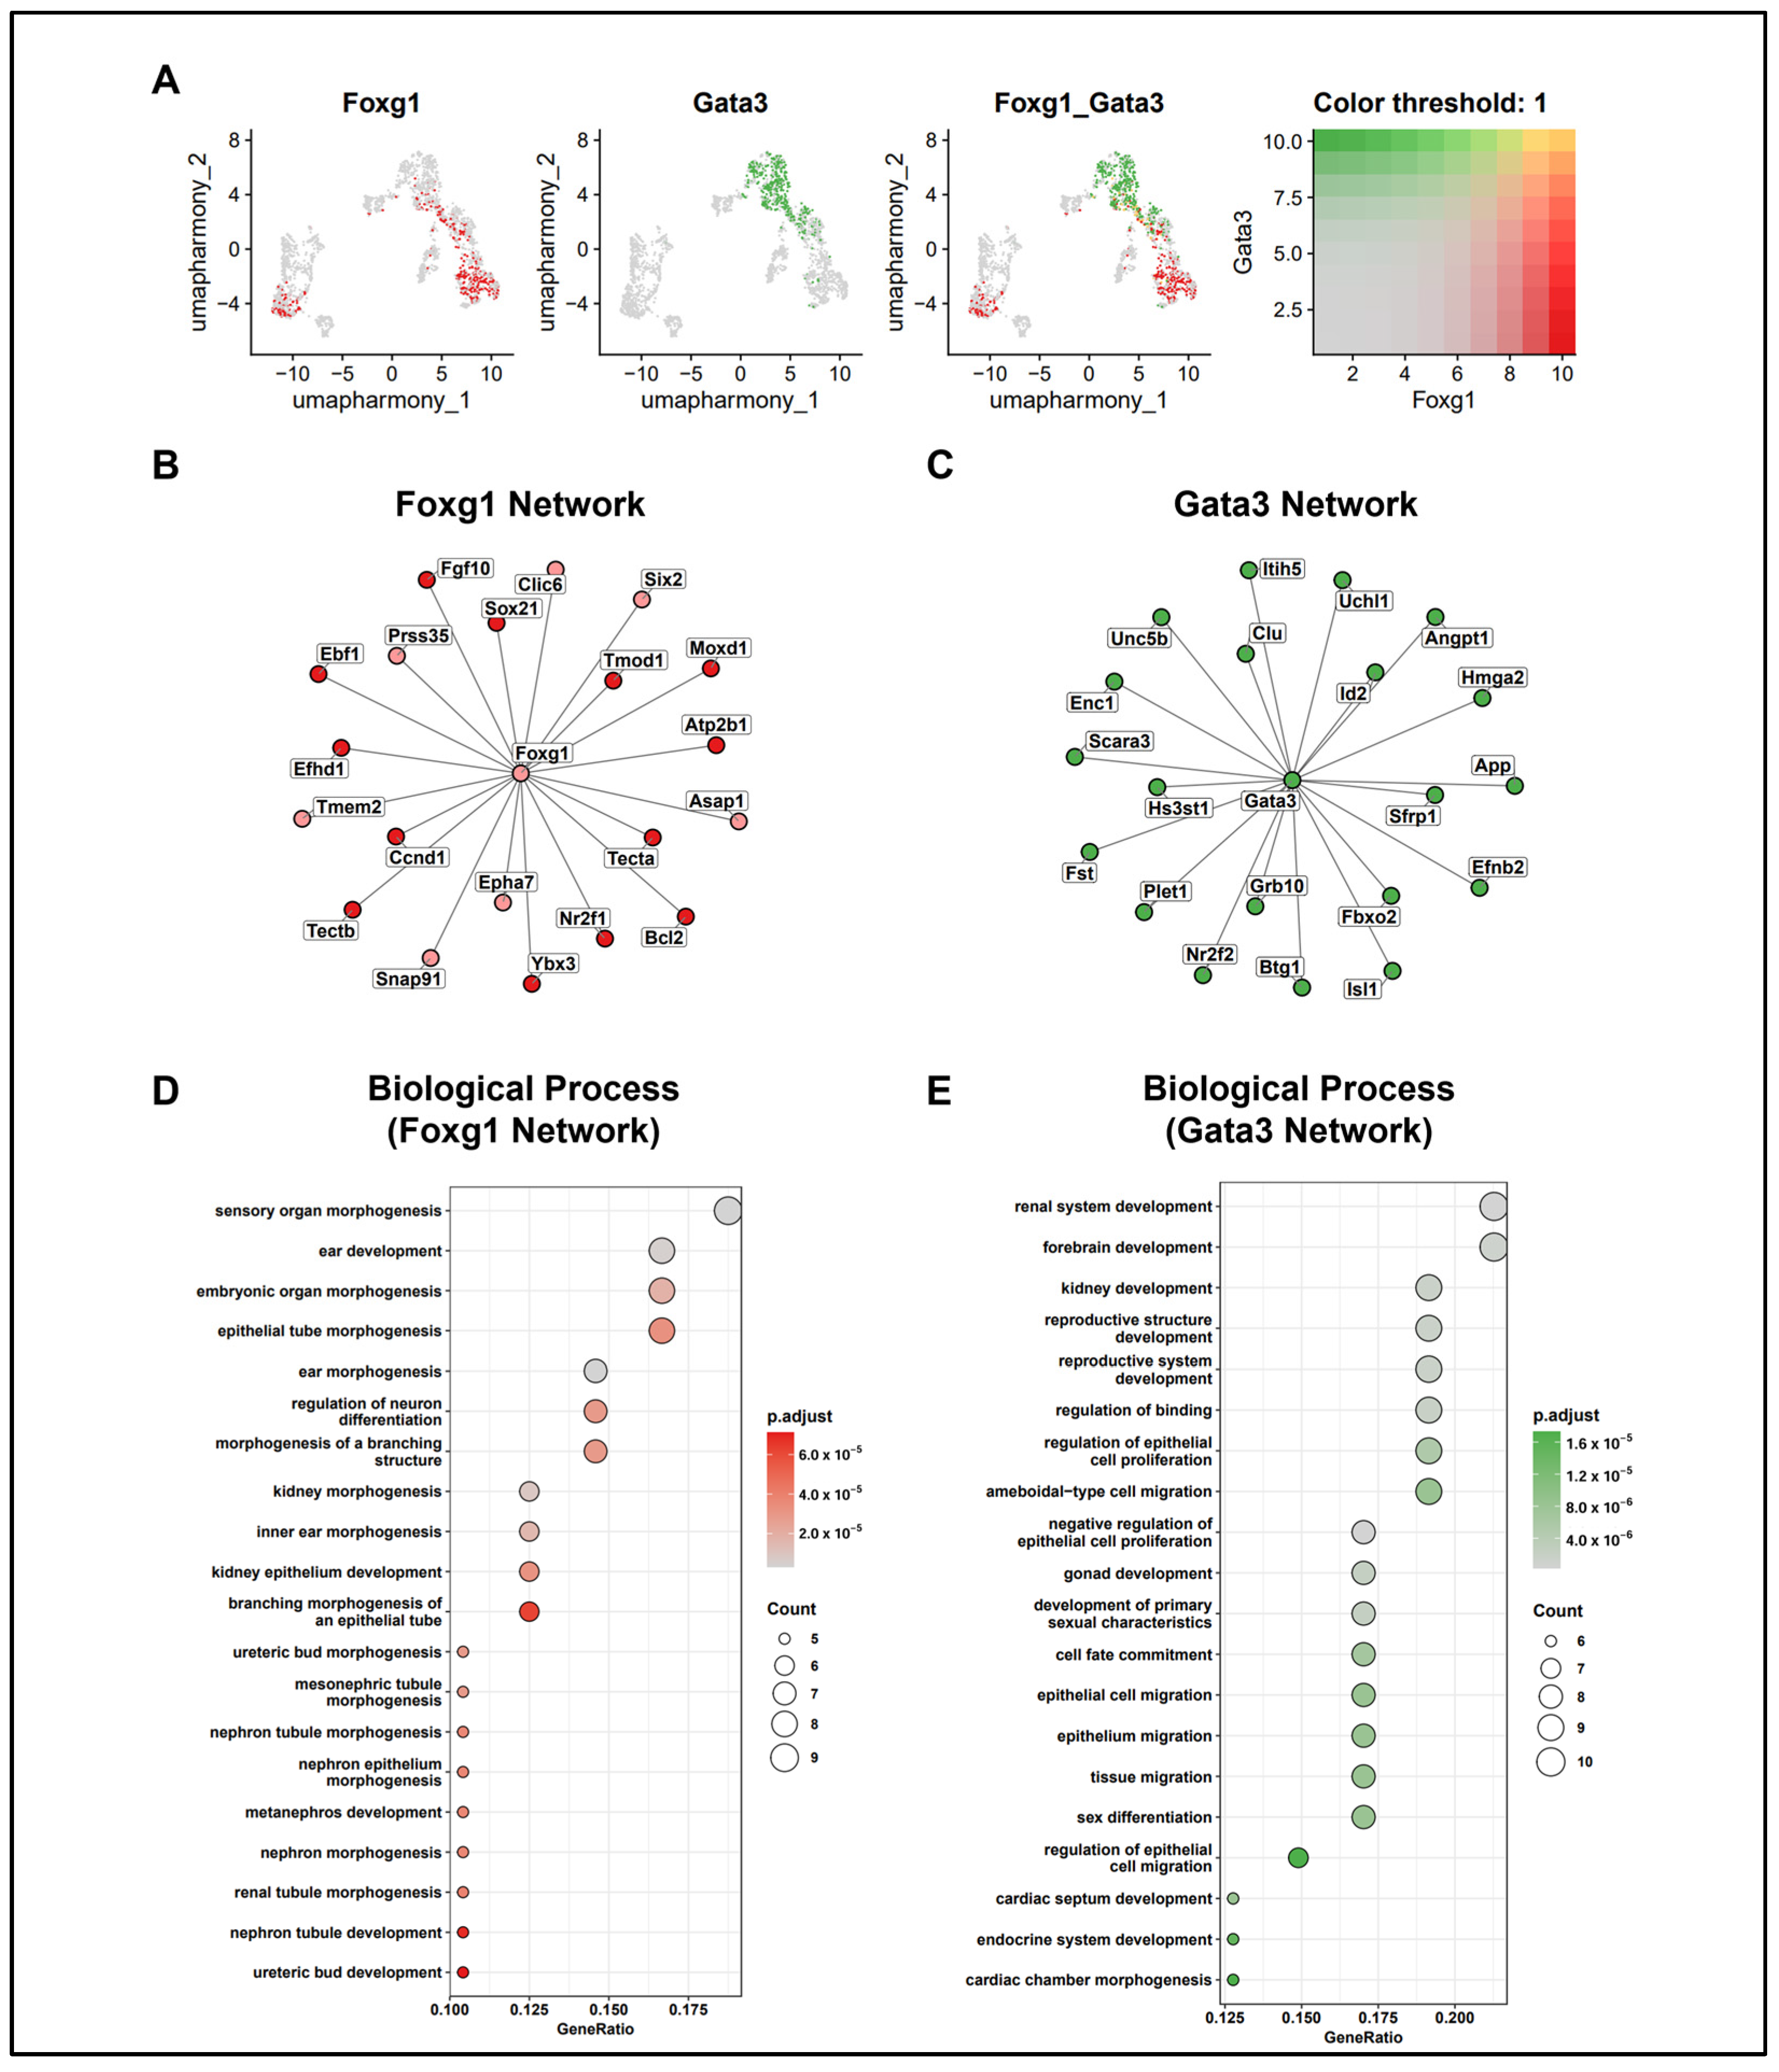
We attempted to confirm the expression regions of Foxg1 and Gata3 using modules defined according to distinct regions and functions. Similarly to the IHC results, on UMAP, Foxg1 exhibited an exclusive expression pattern in roof and GER corresponding to CD−M6 and CD−M3, whereas Gata3 showed high connectivity in the corresponding modules (Figure 3B and Figure 4A). Next, by analyzing genes co-expressed with Foxg1 and Gata3, we conducted correlation analysis to identify the genes involved in similar biological processes and constructed a network. Genes corresponding to the Foxg1 network were included in CD−M6 and CD−M3, whereas those corresponding to the Gata3 network were included in CD−M2 (Figure 4B). GO analysis was conducted to confirm the biological processes associated with the genes included in each network (Figure 4D,E). In the Foxg1 network, which includes genes such as Tecta, Fgf10, Bcl2, and Six2, ontology terms related to ear development and epithelial formation were identified [54,55,56,57]. In the Gata3 network, which includes genes such as Isl1, Sfrp1, Nr2f2, and Efnb2, ontology terms related to epithelial cell proliferation and migration were identified [58,59,60,61], which were similar to the GO results of CD−M2 (Supplementary Figure S6).

2.6. Expression of Various Marker Genes in the E13.5 Cochlear Duct

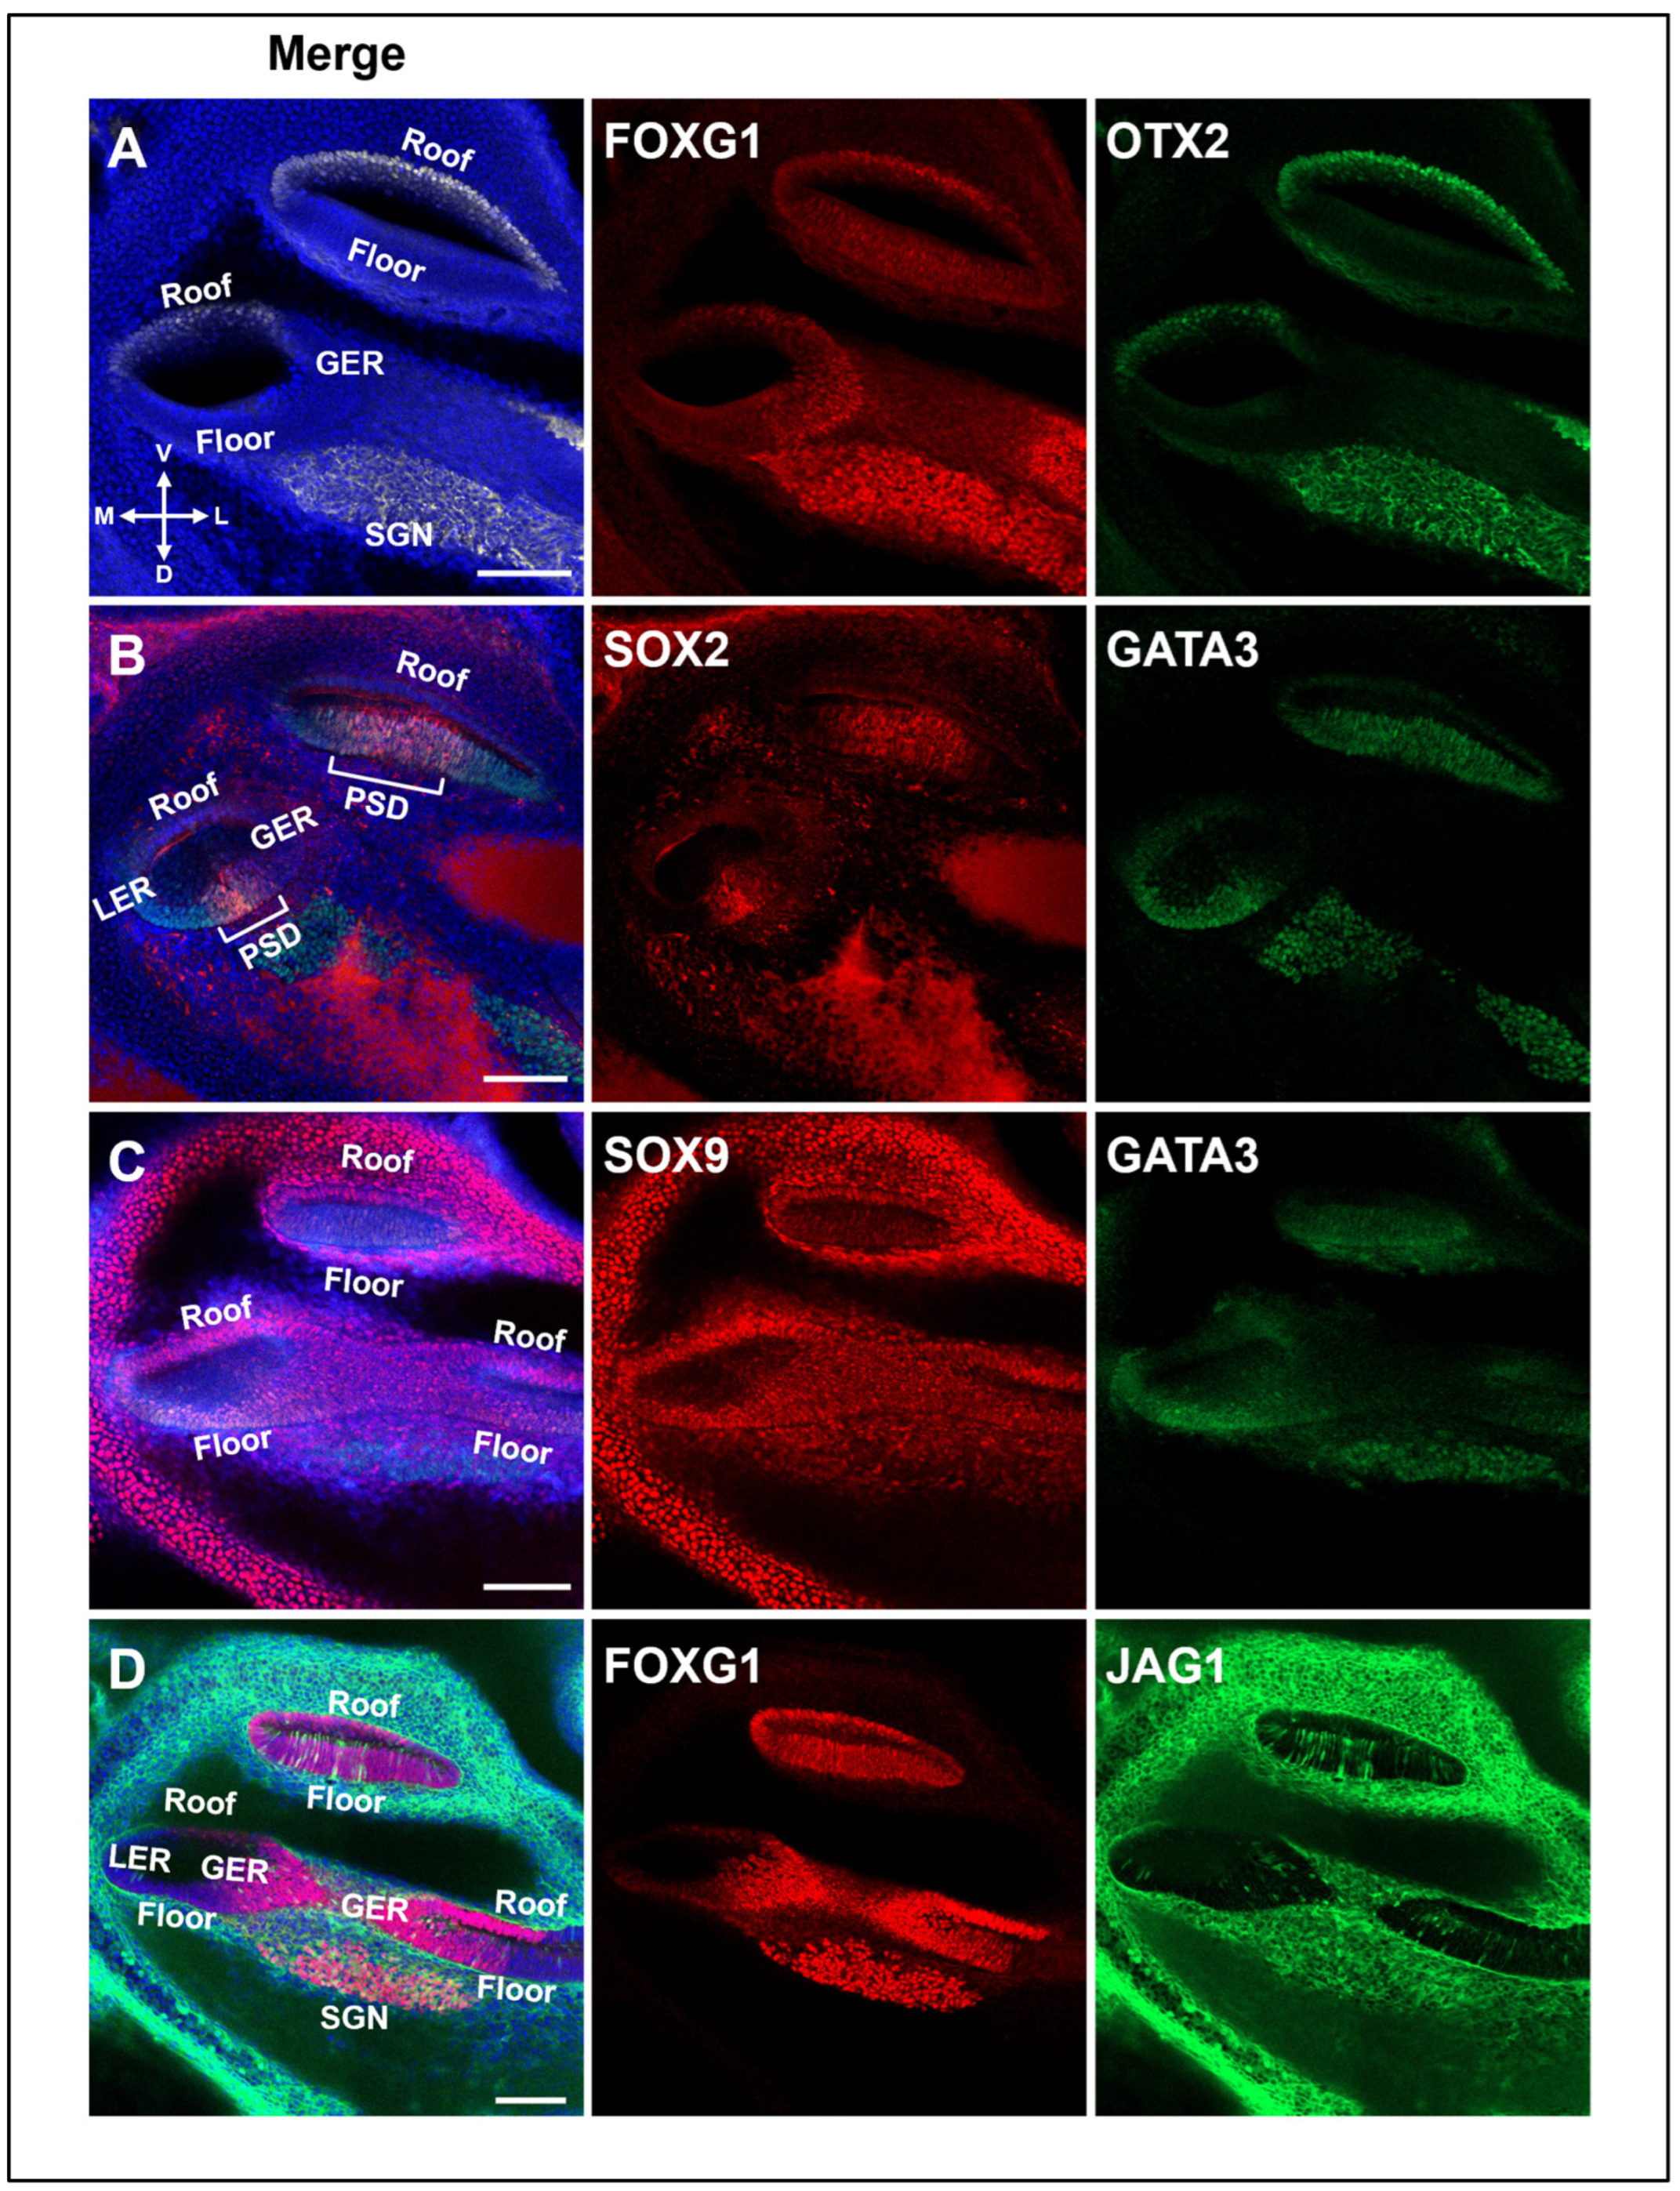
The detailed expression area of FOXG1 in the developing cochlear duct was identified through module analysis. The reliability of the analysis was examined by confirming the expression of well-known marker genes among the hub genes in other modules in the E13.5 cochlear duct. The cochlear duct roof marker OTX2, which is included in Module 1, shows that the expression location of FOXG1 is gradually narrowed to the GER, including part of the roof (Figure 5A). GATA3, which is exclusively located there, is expressed in the LER of the floor part, and the PSD located between the LER and the GER was confirmed through the expression of the corresponding marker, namely SOX2 (Figure 5B) [62]. JAG1, which corresponds to Module 3, containing the GER marker genes, was also expressed in the GER where PSD and FOXG1 are expressed, as previously described (Figure 5D) [63]. Although Sox9 was not classified as a module-delimiting gene, it was confirmed to have been expressed throughout the cochlear duct epithelium, as in a previous study (Figure 5C and Supplementary Figure S3D) [64].

2.7. The Relationship Between Hearing Loss-Associated Disease and Modules

To confirm the clinical relevance of actual hearing loss with modules classified according to the patterning and specific biological functions of the developing inner ear, we classified genes related to hearing loss in ClinGen according to the genes included in each module. In roof/epithelial (CD−M1), Myo6 and Actg1 were associated with nonsyndromic hearing loss (NSHL), Hsd17b4 with Perrault syndrome, Ednrb and Edn3 with Waardenburg syndrome, and Actg1 with Baraitser–Winter syndrome. In LER (CD−M2), Ush1c, Otogl, Gjb2, and Eps8 were associated with NSHL; Ush1c and Clrn1 with Usher syndrome, Six1 with branchiootorenal syndrome; Gjb2 with skin phenotype and HL; Gata3 with hypoparathyroidism, sensorineural hearing loss, and renal dysplasia; and Col9a2 with Stickler syndrome. In GER (CD−M3), Tecta, Pcdh15, and Cdc14a were associated with NSHL, Slitrk6 with deafness and myopia, Pcdh15 with Usher syndrome, Eya1 with branchiootorenal syndrome, Chd7 with CHARGE syndrome, and Cdc14a with hearing impairment and infertile male syndrome. In cell cycle (CD−M4), Tubb4b was associated with Leber congenital amaurosis, Dnmt1 with DNMT1 methylopathy, and Diaph3 with auditory neuropathy spectrum disorder. In epithelial patterning (CD−M5), Tmtc2, Hgf, and Ccdc50 were associated with NSHL and Ror1 with hearing loss and auditory neuropathy. In GER and roof (CD−M6), Otoa, Gsdme, and Espn were associated with NSHL. In the catalog (CD−M7), Pou3f4, Homer2, and Col11a2 were associated with NSHL, Snai2 with Waardenburg syndrome, Lars2 with Perrault syndrome, and Col11a2 with otospondylomegaepiphyseal dysplasia. In the ribosome (CD−M9), Crym was associated with NSHL. Protein and RNA metabolism (CD−M8) and mitochondria (CD−M10) did not contain any genes related to hearing loss (Figure 6A,C, Supplementary Table S1). The genes included in the modules related to hearing loss exhibited high connectivity in the modules (Figure 6B).

3. Discussion

The vertebrate inner ear is formed into a complex structure through the expression regulation of numerous factors from the early developmental stage to the completion of differentiation. Foxg1 is expressed in the telencephalon and otic vesicle from the early developmental stage and plays a pivotal role in the development of the central nervous system [30]. Its expression is continuously maintained in the adult inner-ear cochlea [33]. Foxg1-Cre mice have been widely used in functional studies of genes in the inner ear owing to the otic epithelium-specific expression pattern in the early developmental stage [65]. However, detailed descriptions of the expression pattern of FOXG1 in the developing cochlear duct have not yet been reported.
This study demonstrates that FOXG1 is expressed throughout the cochlear duct during early development and then becomes increasingly restricted to the GER, which becomes the inner sulcus, at E13.5. Furthermore, unlike the basal and middle ducts, it maintained overall expression in the apical duct and exhibited a dynamic pattern. Through this FOXG1 expression pattern, it can be predicted that the developmental speed within the cochlear duct is different and that differentiation sequentially occurs along the base–apex axis. The hair cell differentiation process is also affected by the ATOH1 and SHH gradients and occurs along the base–apex axis [3,66,67]. As the patterning along the medial–lateral axis of the cochlear duct is completed at an earlier stage than E13.5, FOXG1 is unlikely to function as a cell fate determinant. As FOXG1 has different functions in neural progenitor cells and postmitotic neurons in cerebral neurogenesis [68,69,70,71], it is thought to have different functions when expressed overall in the duct and when expressed restrictedly to the GER. In fact, as Foxg1 expression continues from the early otic placode, Foxg1 null mice demonstrate a wide range of morphological defects, such as vestibular dysfunction, shortened cochlea, and hair cells with abnormal number and impaired polarity [33,34]; however, the detailed mechanisms have been difficult to elucidate. Furthermore, hair cell-specific Foxg1-cKO mice exhibited a phenomenon opposite to that of null mice, in which hair cell apoptosis increased [36]. This indicates that Foxg1 performs different functions at different times. Thus, studies on how Foxg1 expression is regulated in a stage- and cell type-specific manner are warranted to elucidate its various functions. In particular, the mutually exclusive expression patterns of Gata3 and Foxg1 at E13.5 identified in this study may provide a new direction for studies on hair cell maturation and regeneration in addition to hair cell differentiation [72].
E13.5 cochlear epithelial cells were classified into gene groups with similar expression patterns via hdWGCNA (Figure 3A). This enabled us to identify a specific region expressing Foxg1. Foxg1 was classified into CD−M6, and genes expressed in the GER and roof were included in the module. In the classified modules, we constructed a co-expression gene network centered on Foxg1 and Gata3, respectively. Ebf1, one of the genes included in the Foxg1 network, is mainly expressed in the same GER region as Foxg1; although it has not been reported in humans, an increase in the number of hair cells and supporting cells in the cochlea of Ebf1 KO mice as well as hearing loss has been reported [73,74]. As similar defects, such as an abnormal increase in hair cells, have been reported in Foxg1 KO mice [33], genes classified into the same network are likely to share similar expressions and functions. Furthermore, Isl1, one of the genes included in the Gata3 network, has been reported to have the potential to act as a transcriptional upstream regulator of Gata3 as it downregulated Gata3 in the developing inner ear of cKO mice [58]. This network model makes it easier to predict the molecular architecture at the genome-wide level among genes with similar expression patterns. Among the hearing loss-associated genes reported in the patient, 35 genes included in the module were extracted and classified, but there was no specific syndrome or characteristic associated with the module. Moreover, the pairwise correlation analysis of the 35 hearing loss-associated genes was conducted (Supplementary Figure S7), and many genes with high mutual correlation were included in CD−M2 and CD−M3. As the genes of CD−M2 and CD−M3 are expressed in LER, GER, and PSD, it is highly likely that they co-express and act as key factors in the direct hair cell differentiation process. Through this module analysis method, it is expected that the expression area of the hearing loss genes discovered later can be mapped during the developmental process, and it will be helpful in understanding the disease occurrence mechanism through the related gene network.

4. Materials and Methods

4.1. Animals

All animal experiments were conducted in accordance with the protocols approved by the Institutional Animal Care and Use Committee of the Asan Institute for Life Sciences (No. 2018-12-256). ICR (CD1) mice were used in the analysis.

4.2. Immunohistochemistry and Fluorescent Quantification Analysis

Whole embryo (E9.5–E13.5) was fixed in 4% paraformaldehyde in 1 × phosphate-buffered saline (PBS) at 4 °C overnight. The samples were embedded in 2% agarose/PBS gel and sectioned at 70 μm thickness using a vibratome (VT1000S, Leica Biosystems, Germany). After washing with PBS, the sections were incubated with blocking buffer (5% normal donkey serum, Jackson ImmunoResearch Labs, West Grove, PA, USA), 0.3% TritionX-100 (Sigma-Aldrich, Burlington, MA, USA), 0.2% lysine (Sigma-Aldrich), 0.2% glycine (Sigma-Aldrich), and 1% bovine serum albumin for 60 min at RT. Then, the slices were incubated with a primary antibody recognizing FOXG1 (rabbit, 1:200, ab196868, Abcam, Cambridge, UK), GATA3 (goat, 1:150, AF2605, R&D systems, Minneapolis, MN, USA), Jagged-1 (mouse, 1:100, sc-390177, Santa Cruz Biotechnology, Dallas, TX, USA), SOX2 (rabbit, 1:200, AB5603, Merck Millipore, Burlington, MA, USA), SOX9 (rabbit, 1:1000, AB5535, Merck Millipore), and OTX2 (goat, 1:500, AF1979, BD biosciences, Franklin Lakes, NJ, USA) in blocking buffer and with the appropriate secondary antibody (Jackson ImmunoResearch Labs). Images were captured using a C2 confocal microscope (Nikon, Tokyo, Japan).
To quantitatively compare the changes in the expression areas of Foxg1 and Gata3 in E13.5 cochlear ducts, five sections containing both apical and basal ducts were utilized. Using ImageJ (v.1.53), the areas corresponding to the roof and floor of each section were designated as ROI, and the threshold for each channel was set to calculate the %Area value. The quantitative analysis of these values was conducted using Student’s t-test and rstatix (v.0.7.2), followed by Bonferroni correction; visualization was performed using ggpubr (v.0.6.0) [75,76].

4.3. Dataset of Inner-Ear Samples

The inner ears were extracted from previously reported Foxg1Cre-Ai9 embryos, and single-cell RNA sequencing was performed, including one E9.5 day, three E11.5 day, and four E13.5 day independent biological replicates. All raw filtered counts matrices were deposited in the Gene Expression Omnibus (GEO) with the accession number GEO: GSE178931 [39]. To confirm organogenesis, single-cell RNA sequencing was performed from 61 embryos between E9.5 and E13.5 days, containing approximately 2 million cells. Among the 56 subtrajectories, 5000 cells were classified as auditory epithelial trajectories through marker genes, such as Epcam, Otol1, Oc90, and Nox3. The CDS object of monocle3 that passed the filtering process was deposited in the Mouse Organogenesis Cell Atlas (https://oncoscape.v3.sttrcancer.org/atlas.gs.washington.edu.mouse.rna/downloads, accessed on 26 September 2024) [40]. The overall data analysis sequence is diagrammed in Supplementary Figure S8.

4.4. Preprocessing, Clustering, and Cell Type Identification

Quality control and preprocessing of single-cell RNA sequencing data were performed using Seurat (v.5.1.0) [77]. Raw count matrix and CDS objects were converted to Seurat objects and then merged. Subsequently, the data quality was evaluated using the total RNA molecule count per cell, number of unique genes detected per cell, and percentage of RNA counts from mitochondrial genes. The total RNA molecule count per cell ranged from 366 to 141,411, with a median of 9078. The number of unique genes detected per cell ranged from 35 to 9885, with a median of 3036, and the percentage of RNA counts from mitochondrial genes ranged from 0 to 97.14, with a median of 4.63. Because low-quality cells were included, they were filtered according to the following criteria: (1) total RNA molecule count per cell less than 800, (2) number of unique genes detected per cell less than 200, and (3) percentage of RNA counts from mitochondrial genes greater than 10%. Consequently, 89,399 cells were filtered into 81,102 cells. The filtered UMI counts were normalized using Seurat’s SCTransform function as default parameters to remove the technical variability caused by sequencing and clearly separate cell types [78]. Then, the harmony method, which effectively preserves inter-cell heterogeneity for integration between replicates and batch correction, was employed [41]. Before integration, the RunPCA function was used to reduce the dimension by setting the number of principal components to 30. Integration was performed using the IntegrateLayers function after selecting 3000 integration features using the SelectIntegrationFeature function. Otic epithelial cells were identified by more clearly separating cell heterogeneity using the SCTransform and harmony methods [79]. After performing harmony integration, Seurat’s clustering functions were used. Specifically, the FindNeighbors function was used with dims = 1:30 as a parameter. Then, the FindClusters function was used with a resolution of 0.03 as a parameter to identify 8 clusters. Finally, the RunUMAP function was used with reduction = “harmony”, dims = 1:30 as a parameter to visualize the integrated data in a low-dimensional space. To identify the marker gene of each cluster in the SCT assay, the PrepSCTFindMarkers and FindAllMarkers functions were used. Each cluster was classified into cell types based on previously known marker genes.

4.5. Subclustering of Otic Epithelial Cell Subtypes

After subsetting the E13.5-day otic epithelial cell subtype (C2), the same preprocessing as previously described was performed. When the resolution of the FindClusters function was set to 0.03, 2 clusters were identified; at a resolution of 0.1, 6 clusters were identified; whereas at 0.5, 9 clusters were found. Marker genes were identified in the nine clusters at a resolution of 0.5, as in the previous method.

4.6. High-Dimensional WGNCA Analysis

Using hdWGCNA (v.0.3.03), co-expression network analysis was conducted on the E13.5-day otic epithelial cell subtype [53]. After setting the otic epithelial cell subtype using the SetupForWGCNA function, the SCT assay was set using the SetDatExpr function. Next, to infer an appropriate soft power threshold, the TestSoftPowers function was used to perform network type in a signed manner. After calculating the lowest soft power threshold for which the scale-free topology model fit is 0.8 or higher, the ConstructNetwork function was used to construct a co-expression network. Next, after scaling using Seurat’s ScaleData function, the harmonized module eigengenes were computed using the ModuleEigengenes function. To identify the hub gene of each module, the ModuleConnectivity function was used to compute the eigengene-based connectivity (kME) of each gene. Each module was classified according to region and function using previously known marker genes and GO enrichment analysis.

4.7. Network Analysis of Foxg1 and Gata3

The Pearson correlation coefficient between Foxg1 and Gata3 and all genes was calculated in the SCT assay count slot of the Seurat object subset of the E13.5 otic epithelial cell subtype (C2). The p-value was adjusted by applying Bonferroni correction, and genes with adjusted p-values < 0.05 and correlation coefficients > 0.15 were selected. After adding module information obtained from hdWGCNA analysis to the selected genes, the gene network was reconstructed.

4.8. Gene Ontology Enrichment Analysis

To confirm the functions of modules and Foxg1 and Gata3 network-related genes, gene symbols were mapped to Entrez IDs using org.Mm.eg.db (v.3.19.1) [80]. GO enrichment analysis was conducted using the enrichGO function of ClusterProfiler (v.4.12.0), applying the Benjamini–Hochberg (BH) method (pAdjustMethod = “BH”), where pvalueCutoff = 0.01 and qvalueCutoff = 0.05 criteria, and identifying GO terms for “Biological process (BP)” [81].

4.9. Hearing Loss-Associated Gene Enrichment and Correlation Analysis

We used the ClinGen database related to hearing loss, which includes categories such as “Gene”, “Curated Disease Association”, “Inheritance”, and “Classification” [82]. Among the genes included in the database, we found 35 genes that overlapped with those included in each module and sorted diseases by module. The kME values of the genes included in the module were normalized by Z-score. We calculated pairwise correlation coefficients for 35 genes that overlapped between module eigengene and the Clingen database.

4.10. Statistical Analysis and Visualization

All analyses and visualizations were performed using the statistical programming language R (v.4.4.1) [83]. Single-cell analysis pipeline and visualization, including Seurat object creation, merging, quality control and filtering, SCTransform normalization, dimensionality reduction (PCA), data integration (harmony), nonlinear dimensionality reduction (UMAP), finding cluster markers, and the assignment of cell types, were performed using built-in functions in Seurat and ggplot2 (v.3.5.1) [77,84]. hdWGCNA pipeline and visualization, including co-expression network analysis, the calculation of module eigengenes and connectivity, as well as the computation of hub gene signature scores employing the UCell method, were performed using built-in functions in hdWGCNA and fmsb (v.0.7.6) [53,85]. Foxg1 and Gata3 network analysis was conducted using Pearson’s correlation and a customized code, followed by Bonferroni correction; then, visualization was performed using Seurat and igraph (v.2.0.3) [77,86]. Gene Ontology enrichment analysis was conducted using built-in functions in ClusterProfiler and Fisher’s exact test, followed by BH correction; enrichplot (v.1.25.0) was employed for visualization. Hearing loss-associated gene enrichment and correlation analysis was conducted using pairwise Pearson’s correlation and a customized code for genes overlapping between module eigengene and the Clingen database; ggplot2 and Complexheatmap (v.2.21.1) were used for visualization [81,87,88]. Schematics of the data analysis pipeline and implementable codes for detailed statistical analysis methods are available at http://github.com/YJkil/Cochlear_Duct (accessed on 26 September 2024).

Supplementary Materials

The following supporting information can be downloaded at https://www.mdpi.com/article/10.3390/ijms252312700/s1.

Author Contributions

Conceptualization, S.S. and S.-W.J.; methodology, H.Y. and Y.G.; software, Y.G.; validation, Y.G., J.R. and Y.M.; formal analysis, Y.G., J.R. and H.Y.; investigation, Y.G. and J.R.; resources, K.-H.N. and S.-W.J.; data curation, Y.G., J.R. and H.Y.; writing—original draft preparation, Y.G., J.R. and H.Y.; writing—review and editing, S.S. and S.-W.J.; visualization, Y.G., J.R. and H.Y.; supervision S.S. and S.-W.J.; project administration, S.S. and S.-W.J.; funding acquisition, S.S., S.-W.J. and K.-H.N. All authors have read and agreed to the published version of the manuscript.

Funding

This study was supported by the Korea Research Institute of Bioscience and Biotechnology (KRIBB) Research Initiative Program (KGM1012412) and the following grants: RS-2023-00247255, 2020R1A6A1A06046235, and 2022R1I1A1A01068448.

Institutional Review Board Statement

The animal study protocol was approved by the protocols of the Institutional Animal Care and Use Committee of the Asan Institute for Life Sciences (No. 2018-12-256).

Informed Consent Statement

Not applicable.

Data Availability Statement

The datasets and materials used and/or analyzed during the current study are available from the corresponding author upon reasonable request.

Conflicts of Interest

The authors declare no conflicts of interest.

References

  1. Kochhar, A.; Hildebrand, M.S.; Smith, R.J. Clinical aspects of hereditary hearing loss. Genet. Med. 2007, 9, 393–408. [Google Scholar] [CrossRef] [PubMed]
  2. Zhang, W.; Kim, S.M.; Wang, W.; Cai, C.; Feng, Y.; Kong, W.; Lin, X. Cochlear Gene Therapy for Sensorineural Hearing Loss: Current Status and Major Remaining Hurdles for Translational Success. Front. Mol. Neurosci. 2018, 11, 221. [Google Scholar] [CrossRef] [PubMed]
  3. Pyott, S.J.; Pavlinkova, G.; Yamoah, E.N.; Fritzsch, B. Harmony in the Molecular Orchestra of Hearing: Developmental Mechanisms from the Ear to the Brain. Annu. Rev. Neurosci. 2024, 47, 1–20. [Google Scholar] [CrossRef] [PubMed]
  4. Egilmez, O.K.; Kalcioglu, M.T. Genetics of Nonsyndromic Congenital Hearing Loss. Scientifica 2016, 2016, 7576064. [Google Scholar] [CrossRef]
  5. Shearer, A.E.; Hildebrand, M.S.; Schaefer, A.M.; Smith, R.J. Genetic Hearing Loss Overview; GeneReviews®: Seattle, WA, USA, 2023. Available online: https://www.ncbi.nlm.nih.gov/books/NBK1434/ (accessed on 10 November 2024).
  6. Wang, L.; Kempton, J.B.; Brigande, J.V. Gene Therapy in Mouse Models of Deafness and Balance Dysfunction. Front. Mol. Neurosci. 2018, 11, 300. [Google Scholar] [CrossRef]
  7. Wu, D.K.; Kelley, M.W. Molecular mechanisms of inner ear development. Cold Spring Harb. Perspect. Biol. 2012, 4, a008409. [Google Scholar] [CrossRef]
  8. Zine, A.; Fritzsch, B. Early Steps towards Hearing: Placodes and Sensory Development. Int. J. Mol. Sci. 2023, 24, 6994. [Google Scholar] [CrossRef] [PubMed]
  9. Riccomagno, M.M.; Takada, S.; Epstein, D.J. Wnt-dependent regulation of inner ear morphogenesis is balanced by the opposing and supporting roles of Shh. Genes Dev. 2005, 19, 1612–1623. [Google Scholar] [CrossRef]
  10. Bok, J.; Raft, S.; Kong, K.A.; Koo, S.K.; Dräger, U.C.; Wu, D.K. Transient retinoic acid signaling confers anterior-posterior polarity to the inner ear. Proc. Natl. Acad. Sci. USA 2011, 108, 161–166. [Google Scholar] [CrossRef]
  11. Lin, Z.; Cantos, R.; Patente, M.; Wu, D.K. Gbx2 is required for the morphogenesis of the mouse inner ear: A downstream candidate of hindbrain signaling. Development 2005, 132, 2309–2318. [Google Scholar] [CrossRef]
  12. Kopecky, B.; Johnson, S.; Schmitz, H.; Santi, P.; Fritzsch, B. Scanning thin-sheet laser imaging microscopy elucidates details on mouse ear development. Dev. Dyn. 2012, 241, 465–480. [Google Scholar] [CrossRef] [PubMed]
  13. Muthu, V.; Rohacek, A.M.; Yao, Y.; Rakowiecki, S.M.; Brown, A.S.; Zhao, Y.T.; Meyers, J.; Won, K.J.; Ramdas, S.; Brown, C.D.; et al. Genomic architecture of Shh-dependent cochlear morphogenesis. Development 2019, 146, dev181339. [Google Scholar] [CrossRef]
  14. Morsli, H.; Tuorto, F.; Choo, D.; Postiglione, M.P.; Simeone, A.; Wu, D.K. Otx1 and Otx2 activities are required for the normal development of the mouse inner ear. Development 1999, 126, 2335–2343. [Google Scholar] [CrossRef]
  15. Vendrell, V.; Lopez-Hernandez, I.; Duran Alonso, M.B.; Feijoo-Redondo, A.; Abello, G.; Galvez, H.; Giraldez, F.; Lamonerie, T.; Schimmang, T. Otx2 is a target of N-myc and acts as a suppressor of sensory development in the mammalian cochlea. Development 2015, 142, 2792–2800. [Google Scholar] [CrossRef] [PubMed]
  16. Kelley, M.W. Cochlear Development; New Tools and Approaches. Front. Cell Dev. Biol. 2022, 10, 884240. [Google Scholar] [CrossRef] [PubMed]
  17. Kiernan, A.E.; Ahituv, N.; Fuchs, H.; Balling, R.; Avraham, K.B.; Steel, K.P.; Hrabé de Angelis, M. The Notch ligand Jagged1 is required for inner ear sensory development. Proc. Natl. Acad. Sci. USA 2001, 98, 3873–3878. [Google Scholar] [CrossRef]
  18. Murata, J.; Ohtsuka, T.; Tokunaga, A.; Nishiike, S.; Inohara, H.; Okano, H.; Kageyama, R. Notch-Hes1 pathway contributes to the cochlear prosensory formation potentially through the transcriptional down-regulation of p27Kip1. J. Neurosci. Res. 2009, 87, 3521–3534. [Google Scholar] [CrossRef]
  19. Lanford, P.J.; Lan, Y.; Jiang, R.; Lindsell, C.; Weinmaster, G.; Gridley, T.; Kelley, M.W. Notch signalling pathway mediates hair cell development in mammalian cochlea. Nat. Genet. 1999, 21, 289–292. [Google Scholar] [CrossRef]
  20. Dabdoub, A.; Puligilla, C.; Jones, J.M.; Fritzsch, B.; Cheah, K.S.; Pevny, L.H.; Kelley, M.W. Sox2 signaling in prosensory domain specification and subsequent hair cell differentiation in the developing cochlea. Proc. Natl. Acad. Sci. USA 2008, 105, 18396–18401. [Google Scholar] [CrossRef]
  21. Kempfle, J.S.; Turban, J.L.; Edge, A.S. Sox2 in the differentiation of cochlear progenitor cells. Sci. Rep. 2016, 6, 23293. [Google Scholar] [CrossRef]
  22. Kiernan, A.E.; Pelling, A.L.; Leung, K.K.; Tang, A.S.; Bell, D.M.; Tease, C.; Lovell-Badge, R.; Steel, K.P.; Cheah, K.S. Sox2 is required for sensory organ development in the mammalian inner ear. Nature 2005, 434, 1031–1035. [Google Scholar] [CrossRef] [PubMed]
  23. Lawoko-Kerali, G.; Rivolta, M.N.; Holley, M. Expression of the transcription factors GATA3 and Pax2 during development of the mammalian inner ear. J. Comp. Neurol. 2002, 442, 378–391. [Google Scholar] [CrossRef] [PubMed]
  24. Duncan, J.S.; Lim, K.C.; Engel, J.D.; Fritzsch, B. Limited inner ear morphogenesis and neurosensory development are possible in the absence of GATA3. Int. J. Dev. Biol. 2011, 55, 297–303. [Google Scholar] [CrossRef]
  25. Duncan, J.S.; Fritzsch, B. Continued expression of GATA3 is necessary for cochlear neurosensory development. PLoS ONE 2013, 8, e62046. [Google Scholar] [CrossRef] [PubMed]
  26. Morsli, H.; Choo, D.; Ryan, A.; Johnson, R.; Wu, D.K. Development of the mouse inner ear and origin of its sensory organs. J. Neurosci. 1998, 18, 3327–3335. [Google Scholar] [CrossRef]
  27. Kil, S.H.; Collazo, A. Origins of inner ear sensory organs revealed by fate map and time-lapse analyses. Dev. Biol. 2001, 233, 365–379. [Google Scholar] [CrossRef]
  28. Ohyama, T.; Basch, M.L.; Mishina, Y.; Lyons, K.M.; Segil, N.; Groves, A.K. BMP signaling is necessary for patterning the sensory and nonsensory regions of the developing mammalian cochlea. J. Neurosci. 2010, 30, 15044–15051. [Google Scholar] [CrossRef]
  29. Blauwkamp, M.N.; Beyer, L.A.; Kabara, L.; Takemura, K.; Buck, T.; King, W.M.; Dolan, D.F.; Barald, K.F.; Raphael, Y.; Koenig, R.J. The role of bone morphogenetic protein 4 in inner ear development and function. Hear. Res. 2007, 225, 71–79. [Google Scholar] [CrossRef]
  30. Hébert, J.M.; McConnell, S.K. Targeting of cre to the Foxg1 (BF-1) locus mediates loxP recombination in the telencephalon and other developing head structures. Dev. Biol. 2000, 222, 296–306. [Google Scholar] [CrossRef]
  31. Yang, H.; Ryu, J.; Lim, C.; Choi, J.W.; Park, Y.J.; Jang, S.W.; Shim, S. SOXE group transcription factors regulates the expression of FoxG1 during inner ear development. Biochem. Biophys. Res. Commun. 2022, 623, 96–103. [Google Scholar] [CrossRef]
  32. Kumamoto, T.; Hanashima, C. Evolutionary conservation and conversion of Foxg1 function in brain development. Dev. Growth Differ. 2017, 59, 258–269. [Google Scholar] [CrossRef]
  33. Pauley, S.; Lai, E.; Fritzsch, B. Foxg1 is required for morphogenesis and histogenesis of the mammalian inner ear. Dev. Dyn. 2006, 235, 2470–2482. [Google Scholar] [CrossRef] [PubMed]
  34. Hwang, C.H.; Simeone, A.; Lai, E.; Wu, D.K. Foxg1 is required for proper separation and formation of sensory cristae during inner ear development. Dev. Dyn. 2009, 238, 2725–2734. [Google Scholar] [CrossRef]
  35. He, Z.H.; Li, M.; Fang, Q.J.; Liao, F.L.; Zou, S.Y.; Wu, X.; Sun, H.Y.; Zhao, X.Y.; Hu, Y.J.; Xu, X.X.; et al. FOXG1 promotes aging inner ear hair cell survival through activation of the autophagy pathway. Autophagy 2021, 17, 4341–4362. [Google Scholar] [CrossRef] [PubMed]
  36. He, Z.; Fang, Q.; Li, H.; Shao, B.; Zhang, Y.; Zhang, Y.; Han, X.; Guo, R.; Cheng, C.; Guo, L.; et al. The role of FOXG1 in the postnatal development and survival of mouse cochlear hair cells. Neuropharmacology 2019, 144, 43–57. [Google Scholar] [CrossRef] [PubMed]
  37. Zhang, S.; Zhang, Y.; Dong, Y.; Guo, L.; Zhang, Z.; Shao, B.; Qi, J.; Zhou, H.; Zhu, W.; Yan, X.; et al. Knockdown of Foxg1 in supporting cells increases the trans-differentiation of supporting cells into hair cells in the neonatal mouse cochlea. Cell Mol. Life Sci. 2020, 77, 1401–1419. [Google Scholar] [CrossRef]
  38. Driver, E.C.; Kelley, M.W. Development of the cochlea. Development 2020, 147, dev162263. [Google Scholar] [CrossRef]
  39. Sun, Y.; Wang, L.; Zhu, T.; Wu, B.; Wang, G.; Luo, Z.; Li, C.; Wei, W.; Liu, Z. Single-cell transcriptomic landscapes of the otic neuronal lineage at multiple early embryonic ages. Cell Rep. 2022, 38, 110542. [Google Scholar] [CrossRef]
  40. Cao, J.; Spielmann, M.; Qiu, X.; Huang, X.; Ibrahim, D.M.; Hill, A.J.; Zhang, F.; Mundlos, S.; Christiansen, L.; Steemers, F.J.; et al. The single-cell transcriptional landscape of mammalian organogenesis. Nature 2019, 566, 496–502. [Google Scholar] [CrossRef]
  41. Korsunsky, I.; Millard, N.; Fan, J.; Slowikowski, K.; Zhang, F.; Wei, K.; Baglaenko, Y.; Brenner, M.; Loh, P.R.; Raychaudhuri, S. Fast, sensitive and accurate integration of single-cell data with Harmony. Nat. Methods 2019, 16, 1289–1296. [Google Scholar] [CrossRef]
  42. Li, W.; Alahdal, M.; Deng, Z.; Liu, J.; Zhao, Z.; Cheng, X.; Chen, X.; Li, J.; Yin, J.; Li, Y.; et al. Molecular functions of FSTL1 in the osteoarthritis. Int. Immunopharmacol. 2020, 83, 106465. [Google Scholar] [CrossRef] [PubMed]
  43. Edri, R.; Yaffe, Y.; Ziller, M.J.; Mutukula, N.; Volkman, R.; David, E.; Jacob-Hirsch, J.; Malcov, H.; Levy, C.; Rechavi, G.; et al. Analysing human neural stem cell ontogeny by consecutive isolation of Notch active neural progenitors. Nat. Commun. 2015, 6, 6500. [Google Scholar] [CrossRef]
  44. Hertzano, R.; Puligilla, C.; Chan, S.L.; Timothy, C.; Depireux, D.A.; Ahmed, Z.; Wolf, J.; Eisenman, D.J.; Friedman, T.B.; Riazuddin, S.; et al. CD44 is a marker for the outer pillar cells in the early postnatal mouse inner ear. J. Assoc. Res. Otolaryngol. 2010, 11, 407–418. [Google Scholar] [CrossRef] [PubMed]
  45. Tischfield, M.A.; Baris, H.N.; Wu, C.; Rudolph, G.; Van Maldergem, L.; He, W.; Chan, W.M.; Andrews, C.; Demer, J.L.; Robertson, R.L.; et al. Human TUBB3 mutations perturb microtubule dynamics, kinesin interactions, and axon guidance. Cell 2010, 140, 74–87. [Google Scholar] [CrossRef] [PubMed]
  46. Rao, M.S.; Shetty, A.K. Efficacy of doublecortin as a marker to analyse the absolute number and dendritic growth of newly generated neurons in the adult dentate gyrus. Eur. J. Neurosci. 2004, 19, 234–246. [Google Scholar] [CrossRef]
  47. Kempfle, J.S.; Luu, N.C.; Petrillo, M.; Al-Asad, R.; Zhang, A.; Edge, A.S.B. Lin28 reprograms inner ear glia to a neuronal fate. Stem Cells 2020, 38, 890–903. [Google Scholar] [CrossRef] [PubMed]
  48. Jain, V.; Yang, W.H.; Wu, J.; Roback, J.D.; Gregory, S.G.; Chi, J.T. Single Cell RNA-Seq Analysis of Human Red Cells. Front. Physiol. 2022, 13, 828700. [Google Scholar] [CrossRef]
  49. Biben, C.; Weber, T.S.; Potts, K.S.; Choi, J.; Miles, D.C.; Carmagnac, A.; Sargeant, T.; de Graaf, C.A.; Fennell, K.A.; Farley, A.; et al. In vivo clonal tracking reveals evidence of haemangioblast and haematomesoblast contribution to yolk sac haematopoiesis. Nat. Commun. 2023, 14, 41. [Google Scholar] [CrossRef]
  50. Neftel, C.; Laffy, J.; Filbin, M.G.; Hara, T.; Shore, M.E.; Rahme, G.J.; Richman, A.R.; Silverbush, D.; Shaw, M.L.; Hebert, C.M.; et al. An Integrative Model of Cellular States, Plasticity, and Genetics for Glioblastoma. Cell 2019, 178, 835–849.e821. [Google Scholar] [CrossRef]
  51. Yamamoto, R.; Ohnishi, H.; Omori, K.; Yamamoto, N. In silico analysis of inner ear development using public whole embryonic body single-cell RNA-sequencing data. Dev. Biol. 2021, 469, 160–171. [Google Scholar] [CrossRef]
  52. Silbereis, J.C.; Pochareddy, S.; Zhu, Y.; Li, M.; Sestan, N. The Cellular and Molecular Landscapes of the Developing Human Central Nervous System. Neuron 2016, 89, 248–268. [Google Scholar] [CrossRef] [PubMed]
  53. Morabito, S.; Reese, F.; Rahimzadeh, N.; Miyoshi, E.; Swarup, V. hdWGCNA identifies co-expression networks in high-dimensional transcriptomics data. Cell Rep. Methods 2023, 3, 100498. [Google Scholar] [CrossRef] [PubMed]
  54. Zhang, T.; Xu, J.; Maire, P.; Xu, P.X. Six1 is essential for differentiation and patterning of the mammalian auditory sensory epithelium. PLoS Genet. 2017, 13, e1006967. [Google Scholar] [CrossRef] [PubMed]
  55. Legan, P.K.; Lukashkina, V.A.; Goodyear, R.J.; Kössi, M.; Russell, I.J.; Richardson, G.P. A targeted deletion in alpha-tectorin reveals that the tectorial membrane is required for the gain and timing of cochlear feedback. Neuron 2000, 28, 273–285. [Google Scholar] [CrossRef]
  56. Ishii, N.; Wanaka, A.; Ohno, K.; Matsumoto, K.; Eguchi, Y.; Mori, T.; Tsujimoto, Y.; Tohyama, M. Localization of bcl-2, bax, and bcl-x mRNAs in the developing inner ear of the mouse. Brain Res. 1996, 726, 123–128. [Google Scholar] [CrossRef] [PubMed]
  57. Zelarayan, L.C.; Vendrell, V.; Alvarez, Y.; Domínguez-Frutos, E.; Theil, T.; Alonso, M.T.; Maconochie, M.; Schimmang, T. Differential requirements for FGF3, FGF8 and FGF10 during inner ear development. Dev. Biol. 2007, 308, 379–391. [Google Scholar] [CrossRef]
  58. Filova, I.; Pysanenko, K.; Tavakoli, M.; Vochyanova, S.; Dvorakova, M.; Bohuslavova, R.; Smolik, O.; Fabriciova, V.; Hrabalova, P.; Benesova, S.; et al. ISL1 is necessary for auditory neuron development and contributes toward tonotopic organization. Proc. Natl. Acad. Sci. USA 2022, 119, e2207433119. [Google Scholar] [CrossRef]
  59. Geng, R.; Noda, T.; Mulvaney, J.F.; Lin, V.Y.; Edge, A.S.; Dabdoub, A. Comprehensive Expression of Wnt Signaling Pathway Genes during Development and Maturation of the Mouse Cochlea. PLoS ONE 2016, 11, e0148339. [Google Scholar] [CrossRef]
  60. Tornari, C.; Towers, E.R.; Gale, J.E.; Dawson, S.J. Regulation of the orphan nuclear receptor Nr2f2 by the DFNA15 deafness gene Pou4f3. PLoS ONE 2014, 9, e112247. [Google Scholar] [CrossRef]
  61. Raft, S.; Andrade, L.R.; Shao, D.; Akiyama, H.; Henkemeyer, M.; Wu, D.K. Ephrin-B2 governs morphogenesis of endolymphatic sac and duct epithelia in the mouse inner ear. Dev. Biol. 2014, 390, 51–67. [Google Scholar] [CrossRef]
  62. Dvorakova, M.; Macova, I.; Bohuslavova, R.; Anderova, M.; Fritzsch, B.; Pavlinkova, G. Early ear neuronal development, but not olfactory or lens development, can proceed without SOX2. Dev. Biol. 2020, 457, 43–56. [Google Scholar] [CrossRef] [PubMed]
  63. Hosoya, M.; Fujioka, M.; Okano, H.; Ozawa, H. Mapping of Notch signaling in the developing organ of Corti in common marmosets. Front. Neuroanat. 2023, 17, 1188886. [Google Scholar] [CrossRef] [PubMed]
  64. Szeto, I.Y.Y.; Chu, D.K.H.; Chen, P.; Chu, K.C.; Au, T.Y.K.; Leung, K.K.H.; Huang, Y.H.; Wynn, S.L.; Mak, A.C.Y.; Chan, Y.S.; et al. SOX9 and SOX10 control fluid homeostasis in the inner ear for hearing through independent and cooperative mechanisms. Proc. Natl. Acad. Sci. USA 2022, 119, e2122121119. [Google Scholar] [CrossRef]
  65. Cox, B.C.; Liu, Z.; Lagarde, M.M.; Zuo, J. Conditional gene expression in the mouse inner ear using Cre-loxP. J. Assoc. Res. Otolaryngol. 2012, 13, 295–322. [Google Scholar] [CrossRef]
  66. Tateya, T.; Sakamoto, S.; Ishidate, F.; Hirashima, T.; Imayoshi, I.; Kageyama, R. Three-dimensional live imaging of Atoh1 reveals the dynamics of hair cell induction and organization in the developing cochlea. Development 2019, 146, dev177881. [Google Scholar] [CrossRef] [PubMed]
  67. Liu, Z.; Owen, T.; Zhang, L.; Zuo, J. Dynamic expression pattern of Sonic hedgehog in developing cochlear spiral ganglion neurons. Dev. Dyn. 2010, 239, 1674–1683. [Google Scholar] [CrossRef]
  68. Hanashima, C.; Li, S.C.; Shen, L.; Lai, E.; Fishell, G. Foxg1 suppresses early cortical cell fate. Science 2004, 303, 56–59. [Google Scholar] [CrossRef] [PubMed]
  69. Xuan, S.; Baptista, C.A.; Balas, G.; Tao, W.; Soares, V.C.; Lai, E. Winged helix transcription factor BF-1 is essential for the development of the cerebral hemispheres. Neuron 1995, 14, 1141–1152. [Google Scholar] [CrossRef]
  70. Cargnin, F.; Kwon, J.S.; Katzman, S.; Chen, B.; Lee, J.W.; Lee, S.K. FOXG1 Orchestrates Neocortical Organization and Cortico-Cortical Connections. Neuron 2018, 100, 1083–1096.e1085. [Google Scholar] [CrossRef]
  71. Liu, J.; Yang, M.; Su, M.; Liu, B.; Zhou, K.; Sun, C.; Ba, R.; Yu, B.; Zhang, B.; Zhang, Z.; et al. FOXG1 sequentially orchestrates subtype specification of postmitotic cortical projection neurons. Sci. Adv. 2022, 8, eabh3568. [Google Scholar] [CrossRef]
  72. Chen, J.; Gao, D.; Sun, L.; Yang, J. Kölliker’s organ-supporting cells and cochlear auditory development. Front. Mol. Neurosci. 2022, 15, 1031989. [Google Scholar] [CrossRef] [PubMed]
  73. Kagoshima, H.; Ohnishi, H.; Yamamoto, R.; Yasumoto, A.; Tona, Y.; Nakagawa, T.; Omori, K.; Yamamoto, N. EBF1 Limits the Numbers of Cochlear Hair and Supporting Cells and Forms the Scala Tympani and Spiral Limbus during Inner Ear Development. J. Neurosci. 2024, 44, e1060232023. [Google Scholar] [CrossRef] [PubMed]
  74. Powers, K.G.; Wilkerson, B.A.; Beach, K.E.; Seo, S.S.; Rodriguez, J.S.; Baxter, A.N.; Hunter, S.E.; Bermingham-McDonogh, O. Deletion of the Ebf1, a mouse deafness gene, causes a dramatic increase in hair cells and support cells of the organ of Corti. Development 2024, 151, dev202816. [Google Scholar] [CrossRef] [PubMed]
  75. Kassambara, A. rstatix: Pipe-Friendly Framework for Basic Statistical Tests. R Package Version 0.7.0. 2021. Available online: https://cran.r-project.org/package=rstatix (accessed on 23 September 2024).
  76. Kassambara, A. ggpubr:‘Ggplot2’based Publication Ready Plots. 2020. Available online: https://cran.r-project.org/package=ggpubr (accessed on 23 September 2024).
  77. Hao, Y.; Stuart, T.; Kowalski, M.H.; Choudhary, S.; Hoffman, P.; Hartman, A.; Srivastava, A.; Molla, G.; Madad, S.; Fernandez-Granda, C.; et al. Dictionary learning for integrative, multimodal and scalable single-cell analysis. Nat. Biotechnol. 2024, 42, 293–304. [Google Scholar] [CrossRef]
  78. Hafemeister, C.; Satija, R. Normalization and variance stabilization of single-cell RNA-seq data using regularized negative binomial regression. Genome Biol. 2019, 20, 296. [Google Scholar] [CrossRef]
  79. Micali, N.; Ma, S.; Li, M.; Kim, S.K.; Mato-Blanco, X.; Sindhu, S.K.; Arellano, J.I.; Gao, T.; Shibata, M.; Gobeske, K.T.; et al. Molecular programs of regional specification and neural stem cell fate progression in macaque telencephalon. Science 2023, 382, eadf3786. [Google Scholar] [CrossRef]
  80. Carlson, M.; Falcon, S. org.Mm.eg.db: Genome Wide Annotation for Mouse. R Package Version 3.8.2. Available online: https://bioconductor.org/packages/release/data/annotation/html/org.Mm.eg.db.html (accessed on 23 September 2024).
  81. Wu, T.; Hu, E.; Xu, S.; Chen, M.; Guo, P.; Dai, Z.; Feng, T.; Zhou, L.; Tang, W.; Zhan, L.; et al. clusterProfiler 4.0: A Universal Enrichment Tool for Interpreting Omics Data. Innovation 2021, 2, 100141. [Google Scholar] [CrossRef]
  82. DiStefano, M.T.; Hughes, M.Y.; Patel, M.J.; Wilcox, E.H.; Oza, A.M. Expert interpretation of genes and variants in hereditary hearing loss. Med. Genet. 2020, 32, 109–115. [Google Scholar] [CrossRef]
  83. R Core Team. R: A Language and Environment for Statistical Computing; Foundation for Statistical Computing: Vienna, Austria, 2013. [Google Scholar]
  84. Wickham, H.; Chang, W.; Wickham, M.H. Package ‘ggplot2’. Create Elegant Data Visualisations Using the Grammar of Graphics; Version 2. 2016, pp. 1–189. Available online: https://cran.r-project.org/package=ggplot2 (accessed on 23 September 2024).
  85. Nakazawa, M.; Nakazawa, M.M. Package ‘fmsb’. 2019. Available online: https://cran.r-project.org/web/packages/fmsb/fmsb.pdf (accessed on 23 September 2024).
  86. Csardi, G.; Nepusz, T. The igraph software. Complex Syst. 2006, 1695, 862049. [Google Scholar]
  87. Yu, G. Enrichplot: Visualization of Functional Enrichment Result. R Package Version 2019, 1. Available online: https://bioconductor.org/packages/release/bioc/html/enrichplot.html (accessed on 23 September 2024).
  88. Gu, Z.; Eils, R.; Schlesner, M. Complex heatmaps reveal patterns and correlations in multidimensional genomic data. Bioinformatics 2016, 32, 2847–2849. [Google Scholar] [CrossRef]
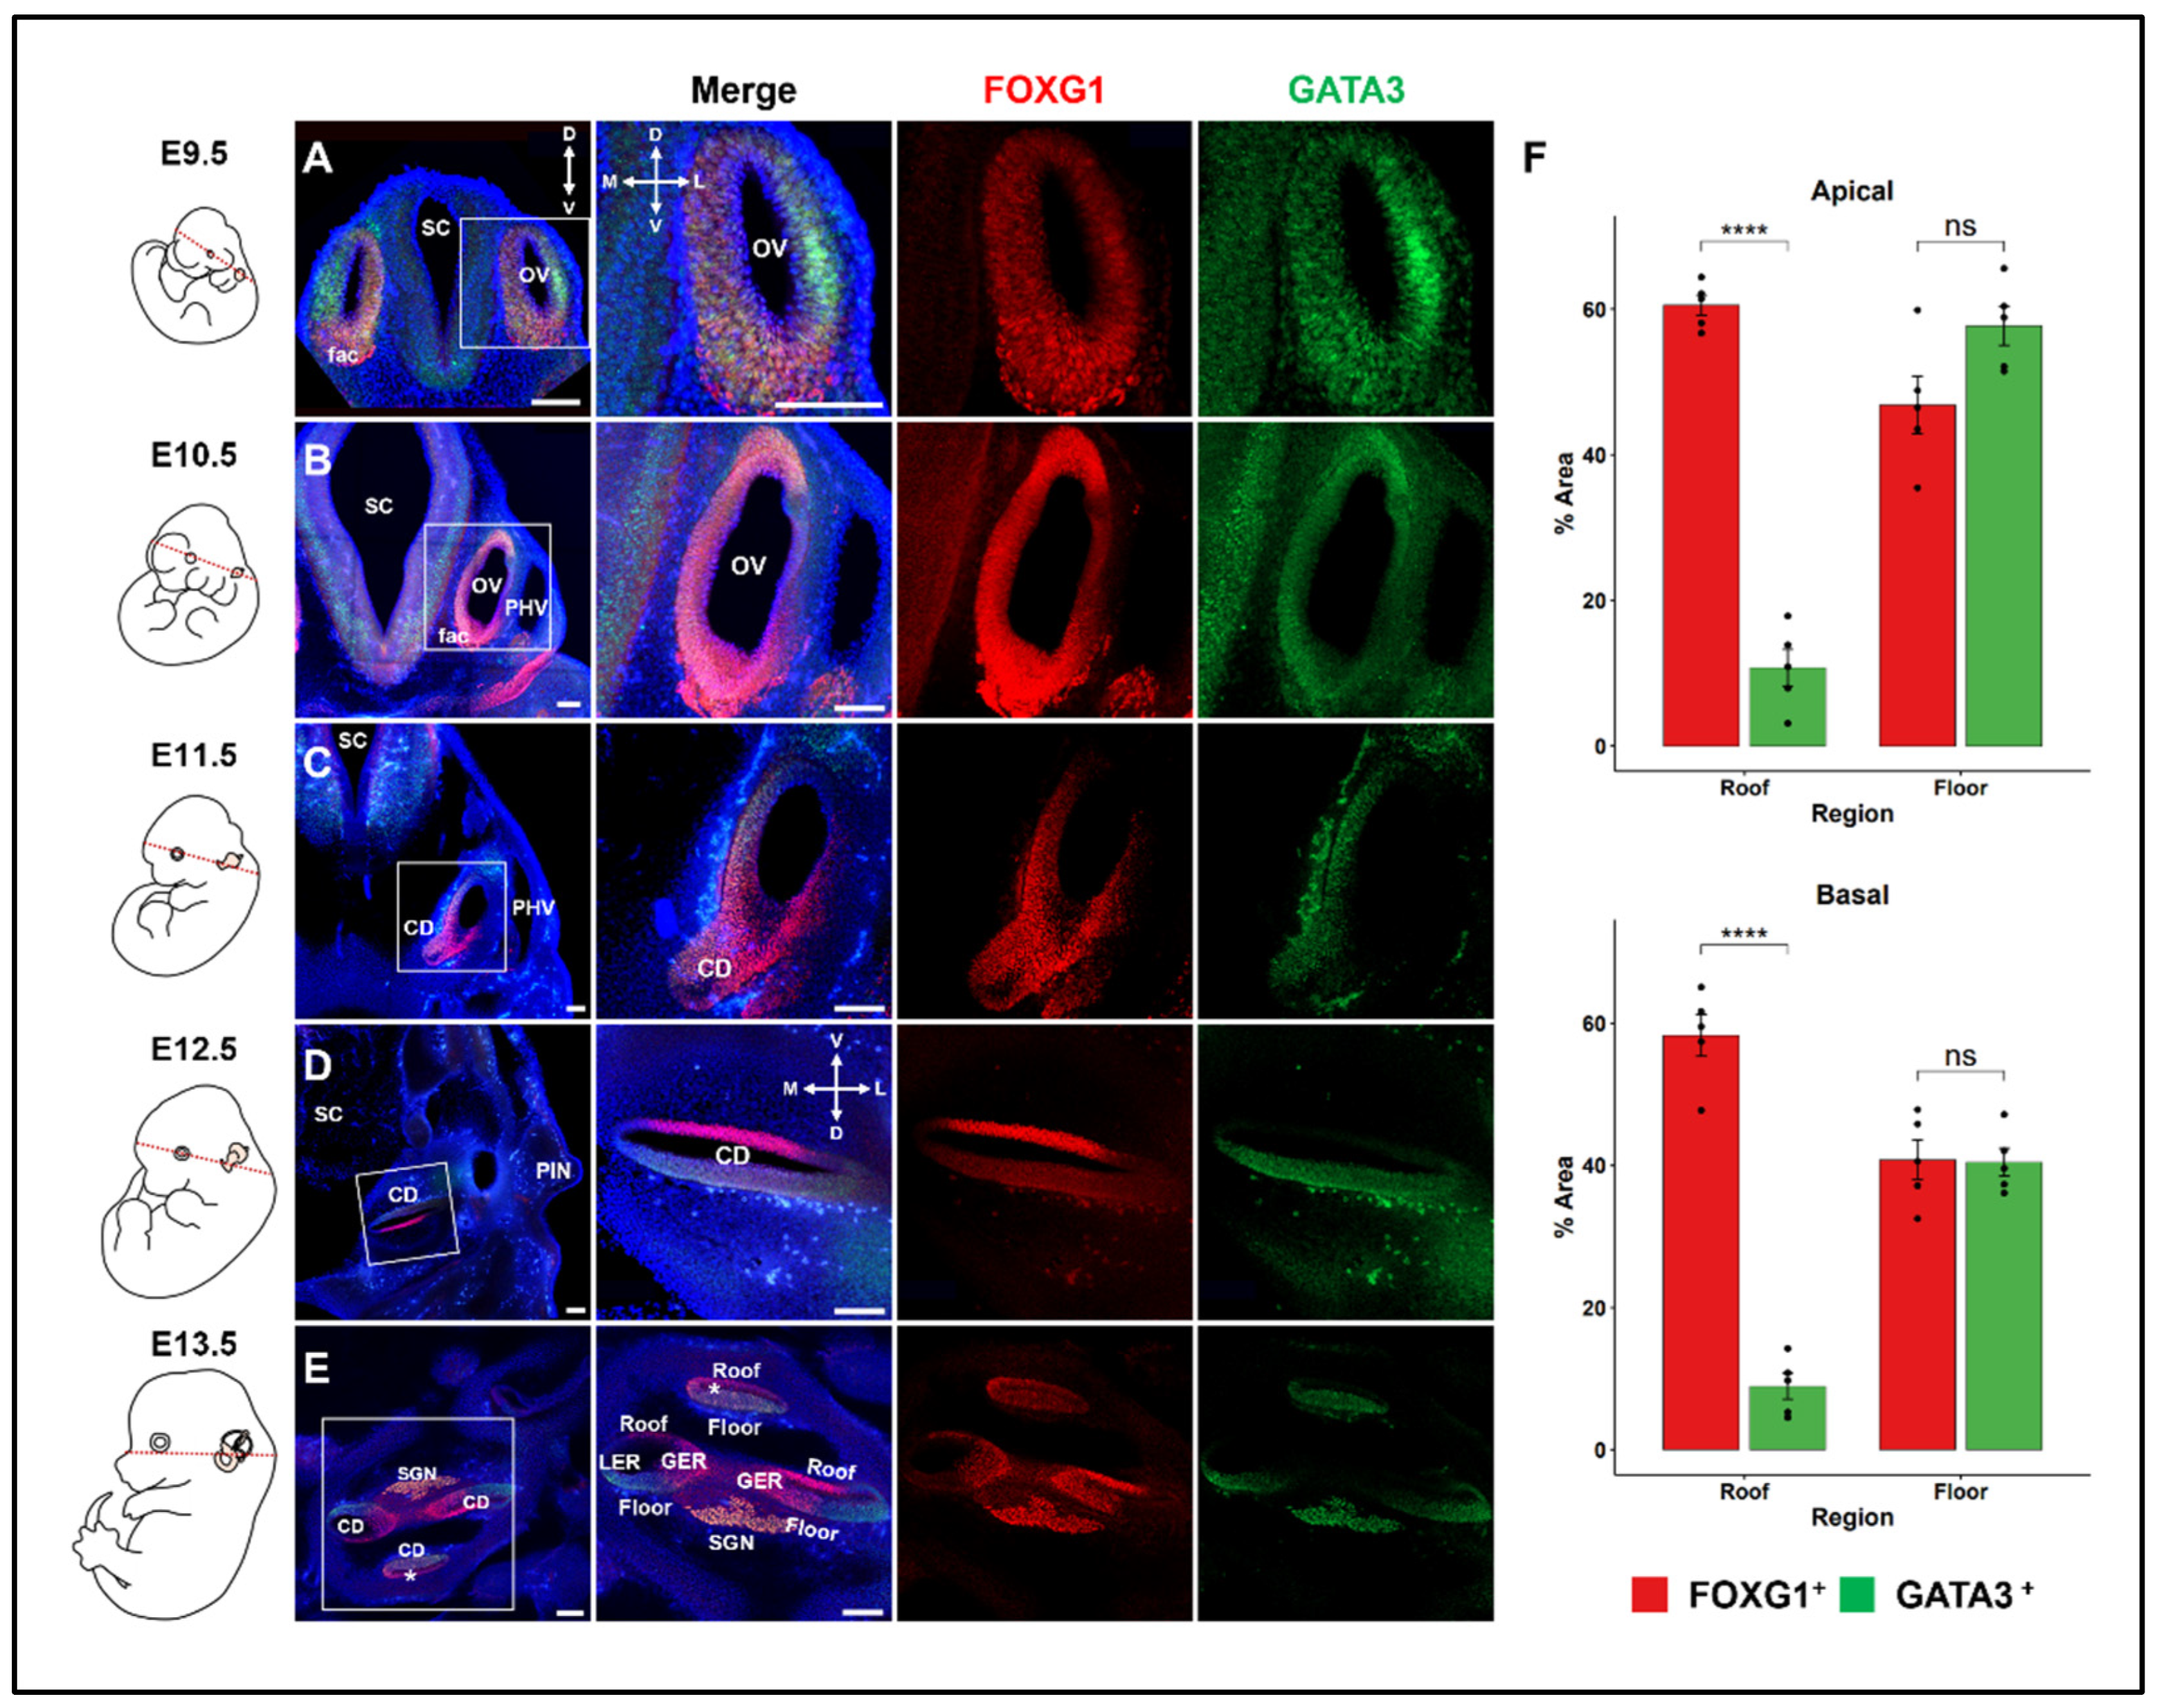
Figure 1. Expressions of FOXG1 and GATA3 in the developing inner ear. At E9.5–E10.5, the otic vesicle begins to extend, and from E11.5, the cochlear duct begins to extend; the cross section of the cochlear duct is observed at E12.5 and E13.5. The section plane is indicated in the embryo image on the left. (A,B) At E9.5–E10.5, FOXG1 and GATA3 are expressed throughout the otic vesicle. (C) In the cochlea at E11.5, Gata3 shows a change in expression toward the medial–lateral part, whereas Foxg1 maintains global expression. (D) In the cochlea at E12.5, Gata3 is expressed only in the dorsal region, whereas Foxg1 continues to be expressed in both the dorsal and ventral regions. (E) At E13.5, three cochlear sections and nearby ganglia are visible. In all sections, Gata3 is expressed at the base, Foxg1 is expressed throughout the apical duct (asterisk in E), and only Gata3 is expressed at the base. Scale bar = 100 μm. CD, cochlear duct; fac, facio-acoustic (VII-VIII) neural crest complex; GER, the greater epithelial ridge; LER, the lesser epithelial ridge; OV, otic vesicle; PHV, primary head vein; PIN, Pinna; SC, Spinal cord. (F) Quantitative analysis of changes in Foxg1 expression at the base and apex of E13.5 cochlea. The cochlea was divided into the roof and floor, and the proportion of cells expressing Foxg1 and Gata3 in the corresponding region was shown (n = 5). At the apex, Foxg1 expression was high at the roof and floor, but was decreased at the floor of the base compared to the apex. **** p ≤ 0.0001.
Ijms 25 12700 g001
Figure 2. Identification of inner-ear cell type. (AC) UMAP plots for cell type (A), reference (B), and stage (C). (D) UMAP plots showing marker gene expression in individual clusters. (E) Dot plots showing the expressions of the top 5 marker genes and their proportion in individual cell clusters. Color gradient represents the average expression, and dot size indicates the percentage of expressed cells.
Ijms 25 12700 g002
Figure 3. hdWGCNA of cochlear epithelial cell subtype. (A) UMAP plots showing modules identified by hdWGCNA and the top 10 hub genes for each module. Colors represent the following modules: CD−M1 (roof) in orange, CD−M2 (LER and PD) in green, CD−M3 (GER and PD) in red, CD−M4 (cell cycle) in cyan, CD−M5 (epithelial patterning) in dark green, CD−M6 (GER and Roof) in light pink, CD−M7 (cartilage) in dark blue, CD−M8 (protein and RNA metabolism) in medium blue, CD−M9 (ribosome) in pink, and CD−M10 (mitochondria) in dark purple. (B) Radar plot showing the kME values of hub genes. Colors represent the following genes: Foxg1 in light pink, Gata3 in green, Otx2 in orange, Bmp4 in red, Sox2 in cyan, and Fgf10 in medium blue. (C) UMAP plot showing the hub gene network.
Ijms 25 12700 g003
Figure 4. Network analysis of Foxg1 and Gata3. (A) UMAP plot showing the expression of Foxg1 and Gata3. Colors represent the following genes: Foxg1 in red, Gata3 in green, and cells with blended expression of both genes in yellow. (B) Gene network of the top 20 genes highly correlated with Foxg1. Colors represent the following modules: CD−M3 (GER and PD) in red and CD−M6 (GER and roof) in light pink. (C) Gene network of the top 20 genes highly correlated with Gata3. Colors represent the following modules: CD−M2 (LER and PD) in green. (D) Dot plot showing the Gene Ontology (GO) terms related to the biological process for genes included in the Foxg1 network. Dot size represents the gene count, whereas color represents the adjusted p-value. (E) Dot plot showing the GO terms related to the biological process for genes included in the Gata3 network. Dot size represents gene count, and color represents the adjusted p-value.
Ijms 25 12700 g004
Figure 5. Expression of various marker genes in the E13.5 cochlear duct. (A) OTX2, a cochlear roof marker, is specifically expressed in the roof of the apical and primary ducts. FOXG1 is expressed throughout the basal, roof, and GER. In vertex ducts, they are visible on both the roof and the floor. (B) SOX2, a sensory domain marker, is co-expressed in the basal region with Gata3, and Gata3 is expressed more broadly throughout the LER. (C) Unlike GATA3, SOX9 is expressed throughout the cochlear epithelium. (D) The expression of JAG1 can be observed in the prosensory domain and GER, together with that of FOXG1. Scale bar = 100 μm. GER, greater epithelial ridge; LER, lesser epithelial ridge; PSD, prosensory domain; SGN, spiral ganglion neurons.
Ijms 25 12700 g005
Figure 6. The association between hearing loss-associated disease and modules. (A) Heatmap showing genes and hearing loss-related diseases divided by modules. (B) Heatmap showing genes and the Z-scored kME values for each module. (C) Scheme summarizing the structure of the cochlear duct and genes related to hearing loss diseases within each module.
Ijms 25 12700 g006
Disclaimer/Publisher’s Note: The statements, opinions and data contained in all publications are solely those of the individual author(s) and contributor(s) and not of MDPI and/or the editor(s). MDPI and/or the editor(s) disclaim responsibility for any injury to people or property resulting from any ideas, methods, instructions or products referred to in the content.