1. Introduction
The human vitamin K epoxide reductase (hVKORC1), an endoplasmic reticulum (ER) protein, reduces inactive vitamin K 2,3-epoxide to active vitamin K quinone, required for blood coagulation [
1,
2,
3,
4]. Four functional cysteine residues of hVKORC1 control all steps of its repeatedly reproduced enzymatic cycle. Two cysteine residues, C
43 and C
51, are located in the ER luminal loop (L-loop), and two others, C
132 and C
135, are positioned in the luminal end of the transmembrane domain (TMD), forming the C
132XXC
135 motif of the active site. To regain the catalytic activity of hVKORC1, these cysteines must be reduced by an external redox protein through a C
43- and C
51-mediated sequential electron-transfer process. This process is required prior to intra-protein electron transfer to the C
132XXC
135 motif involved in the vitamin K transformation. Using numerical modelling, we suggested that the protein disulfide isomerase (PDI) is the most probable hVKORC1 redox partner, initiating its activation by delivering the reducing equivalents [
5]. Our in silico prediction was later confirmed by in vitro data [
6].
hVKORC1 is a small (163 amino acids) modular and multifaceted protein consisting of structurally diverse domains located in different environments: a well-folded TMD placed in the membrane, an intrinsically disordered L-loop protruding into the ER, and highly flexible N- and C-terminals floating in the cytoplasm. Each of these domains fulfils its specific role, complementing and ensuring the functions of other regions of hVKORC1, providing the global implementation of mutually interconnected and tightly regulated functions of hVKORC1 [
5,
7].
The perfectly controlled multi-step enzymatic process of the native hVKORC1 is frequently deregulated by missense mutations. A genetic polymorphism of hVKORC1 associates with low or accelerated vitamin K recycling rates [
4,
8,
9,
10], causing serious diseases such as haemorrhages and thrombosis, including enhanced thrombogenicity in severe COVID-19 cases [
11]. Moreover, the hVKORC1 polymorphism affects the anti-vitamin K anticoagulant (AVK) drug dose responses, promoting resistance to treatment [
10,
12,
13]. Currently available AVKs are the vitamin K-competitive coumarin or indanedione derivatives [
14]. If hVKORC1 mutations are frequently associated with resistance phenomena, the hVKORC1 physiological response to AVKs is also highly patient-dependent. In vitro studies of 25 hVKORC1 mutants showed that only six increased hVKORC1 resistance to AVKs, and others led to a loss of activity [
8]. These mutations are located either in the TMD or in the L-loop. Curiously, out of 45 L-loop residues (R33-N77), 19 (more than 40%) show different genetic variations.
Therefore, the study of hVKORC1 and its mutants is of significant interest for fundamental research to understand their activation by the protein redox through thiol-disulfide exchange reactions [
15,
16,
17], a crucial process in biology that plays a primary role in protective mechanisms against oxidative stress or redox regulation of cell signalling [
18]. The study of these proteins, which constitute clinically relevant targets, is also pursued, with applied objectives focused both on the understanding of the mechanisms of mutation-induced resistance to AVKs and on the development of strategies aimed at modulating its aberrant activity by alternative approaches, other than classical inhibition of the active site.
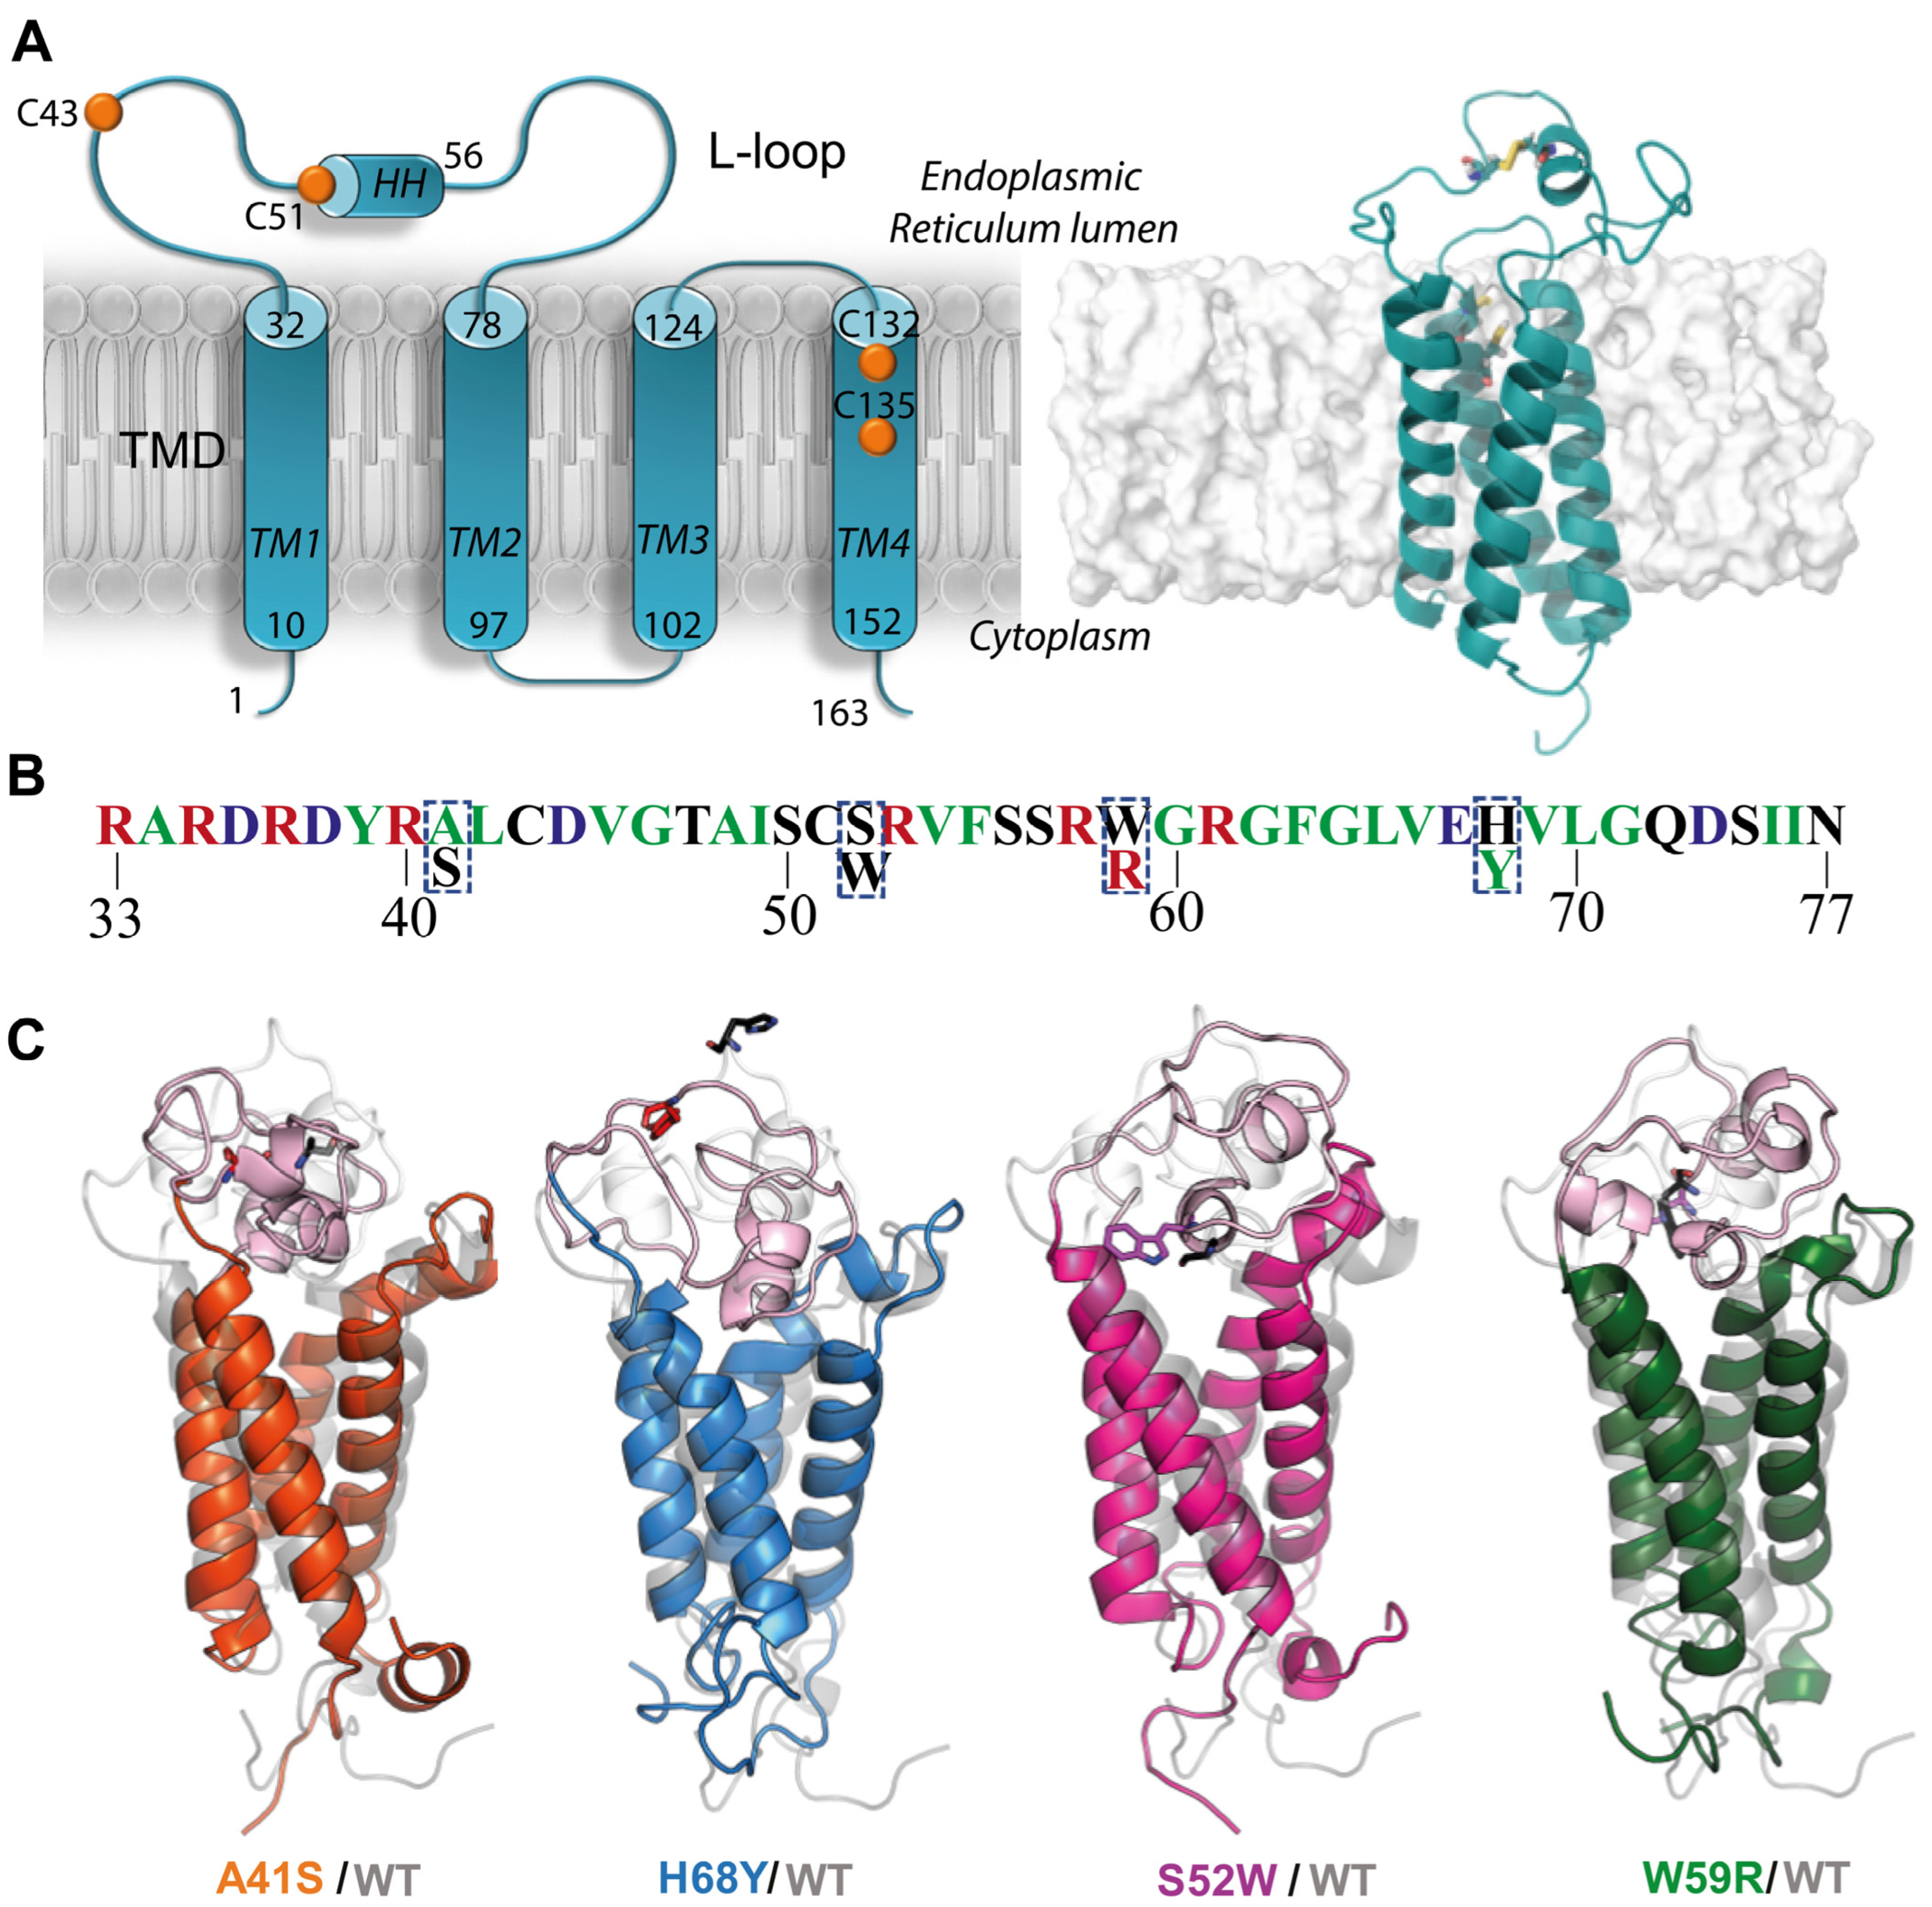
Such research can be based on the pioneering three-dimensional (3D) de novo model of hVKORC1, which established the four-helices hVKORC1 topology of TMD [
19] (
Figure 1A). The correctness of this model was later confirmed by crystallographic studies [
20]. This model was used to generate putative functionally related enzymatic states of hVKORC1, which were further confirmed by assessing their capacity to recognise and bind vitamin K and AVKs. In silico-predicted binding energies were found to be highly correlated with experimental inhibiting constants [
19]. Moreover, this de novo model of hVKORC1 and the crystallographic structure of the redox protein PDI (in oxidised and reduced states, respectively) were carefully studied by in silico methods and used to generate the first molecular PDI/hVKOC1 precursor complex [
5,
7].
In this work, we concentrate on four L-loop mutants possessing the point missense mutations: two (A41S and H68Y) associated with the resistance phenotype observed in patients, and two others (S52W and W59R) leading to a loss of hVKORC1 activity, as was reported by in vitro determination of kinetic and inhibition constants [
8]. Our choice of mutants was not influenced by the level of their responses to AVKs or vitamin K, but guided by differences in physico-chemical properties between native and mutated residues as well as their position on the L-loop (
Figure 1B).
The point mutations A41S and S52W are located in the “cap” region, stabilised by a disulfide bridge S-S formed by C
43 and C
51, groups directly involved in interconversion with the dithiol of the redox Protein Disulfide Isomerase (PDI). The remaining W59R and H68Y are positioned in the “hinge”, a fully relaxed L-loop region, involved in PDI recognition [
5].
We do not explore the recognition of hVKORC1 mutants by AVKs targeting the reduced (active) state of the enzyme. Our primary focus lies in identification of the effects caused by mutations on the oxidised (inactive) state of hVKORC1, which is a target of its redox protein PDI. Using purely numerical approaches such as 3D modelling and molecular dynamics (MD) simulation, we investigated mutation-induced effects on the structure and dynamics of hVKORC1 in the fully oxidised state. We compared the inherent hVKORC1 mutation-induced effects and interpreted them in structural, dynamical, and free energy-related terms, completing the DYNASOME [
21] description of each mutant. Next, we explored the intra-protein pockets in the native hVKORC1 and its mutants to describe the POCKETOME [
22] of each protein studied. DYNASONE and POCKETOME constitute the primary basis for both objectives: deciphering the fundamental mechanisms regulating the abnormal hVKORC1 mutants’ functions (aberrant activation, resistance phenomenon, atypical enzymatic transformation, etc.) and their practical application in the clinic and pharmacology.
Given that the active site of hVKORC1 has traditionally been used for AVK development, we paid special attention to the L-loop, suggesting its potential use as an alternative pharmacological target. We hypothesised that identifying the L-loop allosteric pockets would allow its use as an innovative target for the development of novel drugs, non-competitive with vitamin K, which would inhibit the L-loop plasticity required for hVKORC1 binding to its redox protein.
Despite the clear advantage of allosteric drugs, their design in many cases does not always succeed [
23,
24,
25]. Therefore, we explored the refined models of hVKORC1
A41S, hVKORC1
H68Y, hVKORC1
S52W, and hVKORC1
W59R mutants (
Figure 1C) as putative PDI targets, similarly to hVKORC1
WT [
5,
7]. Identification of hVKORC1 interactions with PDI may deliver another therapeutic target—the interaction interface formed during the recognition and multistep binding processes of PDI to the L-loop. These interaction interface modulators may regulate or prevent aberrant hVKORC1 activation.
The use of these two types of protein targets—inherent allosteric sites and interaction interfaces—for drug development has been classically viewed as largely distinct approaches. Later, a new generation of drugs was proposed that combined the inherent allosteric regulation of proteins (molecular level) and the protein network data (cellular level), called “allo-network drugs” [
26]. Therefore, characterising promising allosteric pockets of the native hVKORC1 and its mutants, as well as the studying of PDI recognition by hVKORC1 mutants, is an urgent task to bring us closer to such developments.
2. Results
2.1. Modelling and Data Processing
Structural (3D) models of hVKORC1 mutants were built by homology modelling using the experimentally confirmed de novo model of the native enzyme as a template (
Figure 1A). These homology models were further refined by conventional MD simulation (all-atom, with explicit water) (
Figure 1C). For each hVKORC1 mutant, three independent MD trajectories (replicas 1–3, each of 0.5 µs) were generated under strictly identical conditions to examine their consistency and completeness, and extend conformational sampling. The generated data were analysed for each full-length protein and per domain using either a single or concatenated trajectory. To avoid the protein motion as a rigid body, all data were normalised by least-squares fitting of MD conformations to the initial structure (t = 0 μs). Further, all data generated for the native protein (hVKORC1
WT) and its mutants were merged and normalised by fitting onto the hVKORC1
WT initial conformation (t = 0 µs). These standardised data were used for proteins cross-comparisons. To be able to make such a comparison, we used the same protocol and criteria for data generation of hVKORC1 mutants and their analysis as for native hVKORC1, as described in our previous papers [
5,
7,
19].
2.2. General Characterisation of the MD Trajectories
The root-mean-square deviations (RMSDs) and root-mean-square fluctuations (RMSFs) calculated on MD conformations of the individual trajectories of each mutant display comparable profiles, demonstrating the good reproducibility of the generated data (
Figure S1). The RMSD values and their variations across all trajectories of hVKORC1
A41S and hVKORC1
S52W are lower and range from 2 to 6.5 Å. Nevertheless, some trajectories of hVKORC1
W59R and hVKORC1
H68Y exhibit higher RMSD variations with significantly increasing values (up to 8–10 Å), while other replicas vary slightly, similar to hVKORC1
WT. The profiles of the RMSF curves are also comparable between the three MD replicas of each mutant, differing only in the values of highly fluctuating N- and C-termini, L-loop, and linkers between the TMD helices, and between the L-loop and TM1. These RMSF profiles are typical of hVKORC1, displaying a saddle-like shape for the L-loop residues, where two maxima are separated by a hollow formed by residues in proximity to S
50C
51S
52. The RMSF maxima differed significantly between trajectories of the same mutant and between mutants.
To compare hVKORC1 mutants with the native protein (hVKORC1
WT), the RMSF values were recalculated for the concatenated trajectories of each protein and standardised to the same conformation (t = 0 µs, hVKORC1
WT). Comparing the normalised RMSF curves, we noted that (i) the L-loop saddle relative to the humps is deeper in mutants than in hVKORC1
WT; (ii) TM helical linkers in mutants fluctuate more compared with those of hVKORC1
WT; and (iii) maximally fluctuating fragments show different values in hVKORC1 mutants (
Figure 2A).
As the L-loop is a key moiety in hVKORC1 activation and carries numerous missense mutations impacting hVKORC1 functions, we mainly focused our analysis on this region comparing R33-N77 aas. The RMSD distributions of the L-loop are described by multimodal Gaussian curves (
Figure 2B). Each RMSD curve shows a single highest peak corresponding to the most probable RMSD value specific to each protein studied. The lower probabilistic peaks are either adjacent to the highest peak (hVKORC1
WT, hVKORC1
W59R, and hVKORC1
H68Y) or widely separated (hVKORC1
A41S, hVKORC1
S52W) along the RMSD axis. We note that the RMSD curves are most similar in hVKORC1
W59R and hVKORC1
WT by their profile, the range of values (from 1.5 to 5 Å), and the position of the highest peak (at 2.1 and 2.3 Å respectively). The RMSD probability distribution in other mutants shows a more expanded range of value (up to 7–8 Å). The RMSF probability curves in all mutants represent monomodal flattened distributions with very large variance except hVKORC1
W59R, which shows, for a large majority of its MD conformations, a well-shaped Gaussian peak ranged from 1.5 to 2.5 Å (
Figure 2C).
2.3. L-Loop Shape and Conformational Features
Despite the large heterogeneity of RMSD and RMSF distributions, the L-loop size, evaluated by the radius of gyration (Rg), revealed that the majority of the L-loop conformations in all mutants adopt a compact globular shape of comparable size (Rg of 10–11 Å) (
Figure 2D,E). However, hVKORC1
A41S and hVKORC1
W59R display two L-loop sizes; one is slightly reduced and the other increased compared with the compact “closed” L-loop of hVKORC1
WT. Only a few L-loop conformations of hVKORC1 mutants exhibit an enlarged size (up to 13–14 Å).
Suggesting a dependence between L-loop conformation and shape, we characterised the conformational space of the L-loop explored by each hVKORC1 mutant during MD simulations using ensemble-based convergence analysis [
27]. First, the L-loop conformations of each mutant were grouped with different RMSD threshold values varying from 2.4 to 7.0 Å with a step of 0.2 Å (
Figure S2). With a cut-off of 4.0 Å, up to 98–100% of the L-loop conformations of all mutants were clustered.
By comparing the population of clusters obtained for the L-loop of each hVKORC1 mutant, we observed that most conformations of hVKORC1
A41S are included in two main clusters: highly populated C1 (64%) and half-times smaller C2 (26%); the rest of the conformations form a sparsely populated group (9%) (
Figure 3A and
Figure S2). L-loop conformations of hVKORC1
H68Y are mainly grouped in cluster C1 (69%), and the rest are distributed in three clusters with a comparable population: C2 (12%), C3 (9%), and C4 (8%). L-loop conformations of hVKORC1
S52W form two almost equally populated clusters, C1 (37%) and C2 (32%), while the other clusters are less populated: C3 (17%), C4 (9%), and C5 (5%). All hVKORC1
W59R L-loop conformations are grouped into two clusters, C1 (62%) and C2(36%).
For each mutant, the representative conformation of each cluster is divergent in folding (2D) and tertiary (3D) structure. Likewise, representative conformations of the most populated clusters of different mutants are also structurally distinct. Nevertheless, the most populated cluster, C1, in all mutants is composed of a compact globular-shaped L-loop having the “closed” conformation, as observed in hVKORC1
WT [
5,
7]. The sparsely populated clusters contain extended L-loop conformations exhibiting an “open” shape, except for hVKORC1
W59R. In this mutant, both clusters are composed of the “closed” L-loop conformations, differing slightly in the degree of globularity. Similarly to hVKORC1
WT, numerous intermediate conformations between the “closed” and “open” shapes of the L-loop are observed in the mutants. The predominant globular form of the L-loop is stabilised by an extended network of non-covalent interactions—H-bonds linking residues within the “cap” or “hinge” and van der Waals contacts holding the “cap” and “hinge” in close proximity (
Figure 3C). The number of H-bonds in most L-loop conformations typically ranges from 5 and 12 contacts for all mutants, with the number being higher in hVKORC1
WT, hVKORC1
H68Y, and hVKORC1
S52W and lower in hVKORC1
A41S and hVKORC1
W59R. Van der Waals forces involve two (in hVKORC1
H68Y and hVKORC1
W59R) or four (in hVKORC1
A41S and hVKORC1
S52W) pairs of interacting residues.
To understand the factors contributing to the fixedness of the L-loop, we analysed the occurrence of H-bonds, stabilising the L-loop of each protein as a function of time. We observed that some H-bonds are observed in all mutants and maintained over extensive simulation time. For example, the D38⋯R53 salt-bridge interaction, observed in hVKORC1
WT, is conserved in the “closed” conformations of the mutants and is stronger in hVKORC1
H68Y, hVKORC1
S52W, and hVKORC1
W59R (
Figure 3B). The loss of such interactions favours the “opening” of L-loop conformations, and such conformations form sparsely populated clusters (e.g., clusters C3 and C4 in hVKORC1
S52W) (
Figure 3B and
Figure S2). Such elongated L-loop conformations are generally observed in the simulation time ranges where the RMSD varies significantly and may correspond to transient states of the L-loop.
Backbone–backbone H-bonds L42⋯A48 and T47⋯I49 are conserved in all mutants and stable throughout all MD trajectories. The stabilisation of the “cap” region, along with the S−S covalent bridge, is maintained by salt–bridge interactions and backbone–backbone H-bonds L42⋯A48 and T47⋯I49. The observed H-bonds, shown in
Figure 3C, explain the cohesion of each L-loop module, “cap” and “hinge”, in each mutant, as in hVKORC1
WT [
5,
7].
The “closed” shape of the L-loop is maintained by non-covalent interactions between the hydrophobic residues of the two L-loop modules. The observed patterns of intramolecular contacts caused by van der Waals forces in the hVKORC1 L-loop evidenced their key role in maintaining two L-loop fragments in close proximity. These results show that intramolecular interactions (van der Waals and electrostatic forces) are dominant factors in stabilising the compact “globule-shaped” L-loop. Such intermolecular forces, at the origin of the globularity of the L-loop, prevent its expansion (“opening”) caused by the solvent.
2.4. L-Loop Folding and Plasticity
Similarly to the native enzyme in the oxidised state, the helical folding in mutants involves nearly every tier of L-loop residues with mean values of 30, 34, 27, and 27% in hVKORC1
A41S, hVKORC1
H68Y, hVKORC1
S52W, and hVKORC1
W59R, respectively. Such a fold is exhibited by three small (3–4 residues) transient helices H1-L, H2-L, and H3-L, partially converting between αH- and 3
10-helices (
Figure S3 and
Figure 4B). In most cases, the helical content in mutants is close to that in hVKORC1
WT; nevertheless, its probability is different for each protein studied (
Figure 4A). The helical content probability curves of hVKORC1
A41S, hVKORC1
S52W, and hVKORC1
WT show the best superimposition. Their most probable folding is identical (28%) and the probability of L-loop conformations having less or more folded structure is different only slightly. The helical content of most L-loop conformations in hVKORC1
W59R varies from lower (18%) to higher (35%), with a most probable value of 28%. In hVKORC1
H68Y, two main L-loop conformations with helical contents of 18 and 23–27% are observed.
Clustering of L-loop conformations based on the secondary structures showed that H1-L is the most conserved among all mutants by size and appears mainly as an α-helix, except in rare conformations in which the α-helix does transit into a small 3
10-helix (
Figure 4B). The H2-L helix is fully transient (α-helix ↔ 3
10-helix), and its 3
10-helix fraction is predominant. The reversibly transient H2-L, seen as shortened or elongated in length, is a single or sequential double helix, with a 3
10-helix fraction varying in the mutants: hVKORC1
A41S > hVKORC1
S52W > hVKORC1
W59R ≈ hVKORC1
H68Y. Likewise, H3-L is completely transient, exhibiting distinct fractions of two types of helices in different mutants. In hVKORC1
S52W, H3-L also transits into a coil (α-helix ↔ 3
10-helix ↔ coil). The combination of helical fractions is a fundamental criterion for grouping the L-loop conformations according to their folding.
The positions of the L-loop helices in the mutants are overall conserved in sequence, as was observed in the native enzyme [
5]. To illustrate the relative orientation of the L-loop helices in 3D space, their spatial dynamical drift was analysed. The axis of each helix was defined for MD conformations from concatenated trajectories (sampling every 100 ps), superimposed, and projected onto a randomly chosen L-loop conformation (
Figure 4C). The extended distributions of superimposed axes (elongated by 50% to better represent their position and direction) for all helices form extended distributions, showing both the most probable and the rarest positions.
The broad distribution of helices in the mutants differs from the dense and compact reap-like distributions of hVKORC1
WT [
5]. The axis of each helix varies considerably in its spatial orientation within its distribution for a given mutant, as well as for the same helix between different mutants, reflecting the mutant-specific drift of each helix.
In mutants, the L-loop helices’ drift is ensured by their highly flexible linkers (see RMSF), which, together with the linker connecting the L-loop to TM1 from TMD, provide higher helix mobility compared with hVKORC1WT. H1-L, mostly folded into a regular α-helix, contains C43 that is covalently linked to C51, located on the coil connecting the H1-L and H2-L helices. Such an S−S covalent bond significantly restricts the conformational mobility of the “cap” region. A large, coiled linker connecting the H2-L and H3-L helices favours the large movement of these helices.
This observation, at first glance, seems inconsistent with the preferred “closed” L-loop conformation. We note that in several mutants, the TMD helix fragments, located near the L-loop, exhibit mutant-induced partial unfolding (
Figure S3). In particular, in all mutants, the upper segments of TM2 and TM3 adjacent to the L-loop are partially disordered, exhibiting reversible transitions (α-helix ↔ 3
10-helix or/and α-helix ↔ 3
10-helix ↔ coil).
This partial unfolding of the TMD helices increases their flexibility, which affects the plasticity of the L-loop, as evidenced by increased drift of the L-loop helices. We hypothesised that the drift of the L-loop helices and the movement of the upper segments of TM2 and TM3 may be highly correlated.
2.5. Inherent Dynamics of hVKORC1 Mutants
To characterise the plasticity of the studied proteins, the inherent dynamics of hVKORC1 mutants were first analysed by estimating the collective motions using Principal Component Analysis (PCA) performed in Cartesian coordinates and a singular value decomposition approach [
28]. Calculations were performed on Cα atoms only. The first two PCA components (modes) denote high mobility of the terminal residues (N- and C-term) (
Figure S4), which was also evidenced by their highest RMSF values. Since the N- and C-terms (M1-G9 and K152-H163 aas) are not the focus of our study, they were excluded from further computation of the explained variance by different principal components (PC).
Ten modes, characterised by the cumulative and individual explained variances, describe about 90–95% of the variance of hVKORC1 containing TMD and the L-loop, or only the L-loop (
Figure 5A). Projecting MD conformations into phase space along the first three principal eigenvectors (PC1, PC2, and PC3) revealed that (i) the sampled conformational space is largely extended in all mutants versus a more compact area in hVKORC1
WT; (ii) the hVKORC1 conformations provide poor overlap between hVKORC1
WT and its mutant subspaces, especially for the L-loop (
Figure 5B).
The first two principal components, PC1 and PC2, characterise most of the movements in all mutants. PC1 is the direction along which the projections have the largest variance, and PC2 is the direction which maximises the variance among all directions orthogonal to the first. These two PCs adequately characterise the degree of inharmonicity of the inherent molecular dynamics of each studied protein. The atomic displacements in the first two PCA modes were projected onto the respective average structures to visualise the direction and amplitude of the principal movements (lowest frequency, most collective motion) (
Figure 5C,D).
In the studied proteins, all structural elements of the L-loop, including helical and coiled linkers, are involved in large-amplitude collective movements. However, the motion of the L-loop in mutants differs from the scissor-like movements observed in hVKORC1
WT, and also alters between mutants. The two L-loop fragments—the “cap”, stabilised by disulfide bridge and H-bond interactions, and the significantly relaxed “hinge”—exhibit a wide range of motions, oriented either in the opposite or orthogonal direction relative to each other or alongside it. The amplitude and direction of these movements also differ between distinct hVKORC1 mutants. The scissor-like movement of the H1-L helix (“cap”) and the linker connecting H2-L and H3-L (“hinge”) found in hVKORC1
WT is also observed in hVKORC1
S52W, but the movement of “hinge” is decomposed into two components, having orthogonal directions and increased amplitudes. The “hinge” motion in other mutants is also broken down into two or more components, characterised by alternating local displacements that differ in direction and amplitude. This decomposition of the “hinge” motion is closely connected to the large collective motion of the TM helices, an effect not observed in hVKORC1
WT. In hVKORC1
WT, the structurally stable and almost static TMD helices participate only in collective drift within the membrane [
19], whereas in mutants, the TMD helices exhibit ample motion of their regions adjacent to the L-loop.
To elucidate the interplay between the L-loop and TMD movements, cross-correlation matrices were calculated for the Cα atom pairs of each hVKORC1 mutant. The pairwise Cα–Cα distance patterns demonstrate the coupled motions within each structural domain, L-loop and TMD, and between these domains (
Figure 5E). We noted that (i) the fine-grained muted patterns of hVKORC1
H68Y, hVKORC1
S52W, and hVKORC1
WT are composed of well-defined blocks, generally corresponding to the structural elements (helices or coils) of protein, and exhibiting positive or negative correlations; (ii) the hVKORC1
A41S and hVKORC1
W59R cross-correlation patterns are noticeably brighter and composed of enlarged grain blocks that frequently overlap between different structural units (helices and coils) and/or domains (TMD and L-loop). Focusing on the L-loop, its inherent cross-correlation pattern is also different between the studied proteins. In particular, we observed (i) a distinct red block demarcating L-loop residues, subdivided into two sub-blocks, showing a positive correlation of its structural units—“cap” and “hinge”—only in hVKORC1
H68Y and hVKORC1
WT; (iii) the red L-loop block is significantly reduced in hVKORC1
A41S and hVKORC1
S52W and increased in hVKORC1
W59R.
The coherence of the motions of the L-loop “hinge” and TM2 helix promotes a reduction of the L-loop fraction in the pattern, showing independent dynamics in hVKORC1
A41S and hVKORC1
S52W, while the TM1 contribution to motion consistent with L-loop movement leads to an increase in the dynamical coupling of the L-loop and TMD in hVKORC1
W59R. Such an effect was observed early in the metastable reduced states of hVKORC1
WT occurring during the enzymatic cycle [
19].
Focusing on the relationships between the point mutations and other residues of hVKORC1 and comparing them with the native protein, we note that the short- and long-range effects significantly alter the correlation pattern (
Figure 5F). Mutation impacts the coupling of proteins residues which manifest through both local (short-range) and widespread (long-range) scaling effects evidenced at the sequence level and 3D space (tertiary structure).
For instance, A41S, positioned on the linker connecting TM1 and the L-loop, positively correlates with the H1-L helix (L-loop). This correlation shows an increase in local coupling within the “cap” of the L-loop, exhibiting higher collective motion in the mutant compared to the native protein. Additionally, the A41S mutation alternatively correlates with each membrane helix. Thus, its correlation is negative with the upper half of TM1, the whole of TM2 and the middle part of TM3, while with TM4, only positive correlations are observed. The S52W mutation diminishes and partially alters the correlations between all residues of the mutant with respect to hVKORC1WT. The H68Y mutation did not significantly alter local coupling compared to the native protein; in both proteins, all residues of the L-loop are positively correlated. In contrast, this mutation influences dynamical relationships with TM2 (negative correlations) and TM3 (positive correlations). In hVKORC1W59R, the W59R correlates positively with half of the protein, involving the L-loop, TM1, TM2, and the loops connecting TM1 and TM2, and negatively with TM3 and TM4. Thus, W59R is the most troublemaking mutation of hVKORC1, disturbing the dynamics of half of the protein, whereas the other mutations only affect a quarter. Such a comparison allows us to confirm again that in all proteins studied, the missense point mutations of key residues affect the DYNASOME of the protein and this influence is sequence-dependent.
2.6. The Free Energy Landscape as a Quantitative Measure of the Mutation-Induced Effects in hVKORC1
To compare the conformational space of hVKORC1 mutants, we adopted a robust strategy for the in-depth analysis: generating a free energy landscape along specifically chosen coordinates called “reaction coordinates” or “collective variables” that describe the conformation of a protein [
29,
30,
31]. The intrinsic protein energy landscape can be quantified using the density of states or the statistical energy distribution of conformations, which can be quantified by transforming the canonical ensemble representation to a microcanonical one.
Such interpretation leads to quantitatively significant results that allow comparison of different forms and states of proteins or their mutants. The relative Gibbs free energy ΔG is a measure of the probability of finding the system in a given state. This representation of the protein sampling by using reaction coordinates can be a quintessential model system for assessing barrier crossing events in proteins [
32,
33]. In general, this process can be estimated from an incomplete sampling of the protein states, if it is an unbiased sampling.
In our case, using rich numerical data obtained by merging all generated trajectories for hVKORC1WT and its four mutants, we attempted to compare the MD conformations of different hVKORC1 proteins that differ by only one residue. Since all proteins were simulated under identical conditions, these data, after normalisation to the same conformation, can also be interpreted in terms of the relative free energy.
To generate the free energy cumulative landscape (FECL) of hVKORC1 and its mutants, we used the first two PCA principal components (PC1 and PC2, describing about 90–95% of variance) as reaction coordinates. The FECL constructed on PC1 versus PC2 shows a rugged landscape spectrum, revealing the high conformational diversity of the L-loop, reflected by the multiple well-defined minima resulting from the multimodal distribution of both reaction coordinates metrics (
Figure 6A,B).
The deepest W1, together with the adjacent low minimum W4, forms an almost common conformational space consisting of two close subspaces, separated from the others by very high energy barriers. This FECL profile is derived, on one hand, from the bimodal distribution of the PC1 component, showing a well-defined sharp probability maximum, complemented by a flat extended peak, and, on the other hand, from a series of maxima in the multimodal distribution of PC2 with a single distinct higher peak. As a result, the deepest W1 on the hVKORC1 FECL is completed by a series of minima represented by lower adjacent wells W2–W4 and a distant low minimum W5, separated from the other wells in the FECL by very high energy barriers.
The Gibbs free energy landscape, exhibiting multiple minima, was searched for its protein content. Each well on the FECL includes different content, consisting of MD conformations of two or three proteins (W1, W2, and W4) or a single protein (W4 and W5) (
Figure 6C,D). We explored the content of each well regarding the protein composition. The wells W1, W2, and W4 are multi-protein sub-ensembles that compile from the MD conformations of different proteins. In particular, the hVKORC1
WT MD conformations are the major component (56%) of W1, coexisting with the hVKORC1
H68Y mutant (23%); the other mutants are also present in W1, but in a minor quantity (4–9%). Similarly, W2 is principally composed of MD conformations of two proteins, hVKORC1
A41S (60%) and hVKORC1
W59R (35%); the hVKORC1
WT MD conformations (5%) complete the W2 sub-ensembles. The three-component W4 contains hVKORC1
H68Y (48%), hVKORC1
WT (37%), and hVKORC1
S52W (15%) MD conformations. In contrast, W3 and W5 contain mono-protein sub-ensembles composed of only hVKORC1
W59R (95%) and hVKORC1
S52W (100%) MD conformations, respectively.
From this analysis, some general conclusions may be postulated: (i) the minimum-compactness energy landscape spectrum corresponds to a conformational ensemble composed of the native protein hVKORC1WT and mutants having the major native-like shape and size of L-loop (‘closed’ conformation with Rg of 10.7 Å); (ii) W2, proximal to W1, is composed mainly of two mutants, hVKORC1A41S and hVKORC1W59R, possessing a more compact globular L-loop (Rg of 10.2 Å) with a highly conserved H1-L helix; (iii) W1 and W2 contain only “closed” L-loop conformations differing mainly at the level of their compactness; (iv) W3 and W5 minima are composed of less “closed” and “open” L-loop conformations of hVKORC1W59R and hVKORC1S52W, respectively; (v) W4 compiles all less “closed” L-loop conformations of all proteins, except hVKORC1A41S and hVKORC1W59R in which almost L-loop conformations are “closed”.
Our results indicate that the minima of the free energy landscape reflect internal conformational and structural features of the L-loop. L-loop conformations of the same shape and size form overlapping subspaces even from different proteins, both native and mutated. Distinguishing and isolating the conformational ensemble of each disordered protein differing from others by a point mutation is a not trivial task, even if one uses PCA-derived metrics describing the largest variances of the studied proteins.
2.7. Pocket Search in the Native hVKORC1 and Its Mutants
Our previous studies of hVKORC1 focused either on developing topological and 3D models of its functionally related states (inactive, activated, and active) formed during the catalytic cycle [
19] and studying the mutation-induced effects on the structural and dynamic properties of hVKORC1 in the inactive (oxidised) state by comparison with the native protein (present work). The characterisation of conformational ensembles using structural, dynamics, and free-energy descriptors was compiled as the DYNASOME defining hVKORC1 as the modular intrinsically disordered protein [
5,
7]. In these studies, we have not addressed one of the most interesting aspects of hVKORC1: its binding pockets, playing a crucial role in the physiological functioning of this enzyme. Some pockets are responsible for the recognition and binding of its redox protein, and others for the binding of vitamin K and AVKs. Although hVKORC1 state-selective recognition of vitamin K in its different forms (epoxide, semiquinone, and quinone) and their binding in the active site pocket have been studied [
19], as well as recognition of hVKORC1 by PDI [
5], the pockets of the inactive (fully oxidised) state are still not sufficiently characterised.
The structural and dynamic variations in intrinsically disordered proteins lead to a large set of different conformations (conformational space), which often result in the formation of “cryptic” or “hidden” pockets that require a conformational change to be apparent [
34]. To explore the putative cryptic pockets in hVKORC1, we first searched the MD simulation data by testing whether or not the cryptic pockets are observed in the inactive state of each protein studied.
A pocket search (using MDpocket [
35]) of the full-length hVKORC1
WT and the L-loop alone revealed the well-known active site pocket and allosteric pocket on the L-loop (
Figure 7A). The found pockets were numbered according to their volume (V)—the largest P1, extending from the L-loop S-S bridge across the entire upper half of the TMD, and a smaller P2 located between the L-loop “cap” and “hinge”.
The pocket P1 in the inactive state of hVKORC1WT is closed to vitamin K entry (vitamin K gateway) by an L-loop S-S bridge. Its elongated tunnel-like shape with a volume of 600–1050 Å3 likely shows the circuit positions that vitamin K visits, starting from its entry into activated hVKORC1, its positions in the active site where the vitamin K is transformed by the active hVKORC1 from the epoxy form to semi-quinone and then into quinone, which leaves the enzyme.
Because we believe that the L-loop is a domain of hVKORC1 suitable, in isolated form, for in silico and in vitro studies, the L-loop pockets were characterised only for this cleaved module alone. The pocket P2 shows an almost spherical shape of a volume varied from 50 to 230 Å
3 (
Figure 7B,C). Tiny P3 (0 to 100 Å
3) corresponds to the upper part of the P1 pocket, starting from the L-loop.
The pocket P2 is formed by the charged (R35, D36, R53, R61 and E67), polar (S57 and T47), and hydrophobic (C43, I49, and L65) residues (
Figure 7D). Similarly, the P3 surface is also formed by highly heterogeneous residues (R37, S52, R53, R61 and I75). In the analysis of the hydrophobicity score, the essential pocket descriptor [
36], in a function of the pocket volume, we note that the maximal size of P2 and P3 corresponds to the hydrophobicity score of 10-15. Nevertheless, the detailed analysis of conformations having the maximal volume of pockets P2 (460–506 Å
3) and P3 (184–220 Å
3) showed the pocket score ranging from 1 to 27 and from 2.6 to 15.3), respectively.
While arginine (R) residues—R35, R53, and R61—contribute to the formation of either one L-loop pocket or both, we analysed the volume of two pockets as a function of arginine quantity at the pockets’ surfaces (
Figure 7F). The P2 surface contains from one to three arginine residues (R35, R53, and R61), and the pocket volume apparently depends on the orientation of their side chains. Indeed, in smaller P2, the side chain of R35 is oriented outside of the pocket cavity, while the side chains of R53 and R61 are positioned inside the cavity and contribute to stabilising the “open” conformation of the L-loop. In contrast, if the side chains of all arginine residues are outside of the P2 pocket cavity, the volume of P2 is considerably increased, as observed in the “closed” L-loop conformation. The surface of the small P3 pocket comprises one or two arginine residues, R35 and R61. The smallest volume of P3 is observed in the “closed” L-loop conformations with R35 and R61 side chains oriented outside and inside the pocket, respectively. The “open” L-loop conformations with a similar outside orientation of R35 and R61 exhibit a larger P3 cavity.
The orientation of the arginine side chain is not a single factor impacting pocket volume. A similar effect may be occurring from the inside-outside orientation of the other residues’ side chains, contributing to the pockets’ surface formation (
Figure 7D).
The analysis of pockets in hVKORC1 mutants clearly demonstrates the mutation-induced effects on their appearance, localization, and size (
Figure 8).
First, the large tunnel-like P1 of hVKORC1WT is transformed in each mutant into a spherical pocket located at the S-S bond formed by the catalytic cysteine residues C132 and C135. The pocket volume is significantly reduced (by a factor of 2–3) in all mutants compared with hVKORC1WT. Moreover, in addition to this pocket, in hVKORC1A41S and hVKORC1W59R, two tiny pockets, P2 and P3, are found. These pockets do not correspond to the P2 and P3 pockets in the native protein, but rather are products of the disrupted tunnel-like pocket P1 of hVKORC1WT, as indicated by their positions.
As for the general identity (status) of the detected pockets, both in native hVKORC1 and in its mutants, they are all transient and vary from 0 to a maximum value, which depends on the pocket and the protein. Therefore, the intrinsically disordered hVKORC1 in the native and mutated forms possesses cryptic pockets which may expand the scope of drug discovery of these targets.
2.8. Probing of the PDI Recognition by hVKORC1 Mutants
To complete the comparative characterisation of hVKORC1 mutants with the native protein, we explored the protein disulphide isomerase (PDI) binding to each mutant. We probed only the modelling of the non-covalent molecular complex preceding the thiol-disulfide exchange reaction, a state described by the precursor complex. To dock PDI and each mutant, we used the protein–protein automatic docking with High Ambiguity Driven protein–protein DOCKing (HADDOCK) [
37,
38]. Unlike other protein–protein docking approaches, based on the combination of energetics and shape complementarity, HADDOCK uses biophysical interactions data—in our case, a short distance between sulphur atoms from the cysteine residues of two interacting protein, PDI and hVKORC1, to drive the docking process. We successfully used this approach to build a de novo model of the first precursor of PDI/hVKORC1 molecular complex formed by native hVKORC1 and its redox protein PDI. We are now asking: do missense mutations influence PDI recognition by hVKORC1? To achieve this, we carefully performed the docking using protocol parameters and procedures previously used for the native protein.
The docking solutions and their clustering show that two mutants, hVKORC1
A41S and hVKORC1
W59R, docked onto PDI, systematically reproduced the PDI/hVKORC1
WT precursor complex (
Figure 9 and
Figure S5; Table S1).
The docking solutions for two other mutants represent models of complexes PDI/hVKORC1 in which the redox protein is inserted into the membrane. In addition, in the PDI/hVKORC1H68Y model, the PDI protein shows significant infolding. Such models are incompatible with the environmental conditions and the protein functions.
3. Discussion
Continually emerging variability of pathogenic proteins frequently leads either to alternation of the protein activity or resistance to currently used drugs, which pose a huge challenge for the treatment of many diseases. It is critical to comprehensively characterise the mutation-induced effects and decipher their mechanisms. Such a description of mutated proteins is frequently performed by structure-based computational methods, producing spatiotemporally linked information on the mutation-induced structural effects at the atomistic level. Apart from the knowledge that sheds light on a deep comprehension of dysfunctionality or aberrant functionality of the missense variants (fundamental learning in biology), the in silico data produced are largely used for the development of novel drugs to combat resistance effects or prevent possible evasion of resistance tactics by pathogens (pharmacological or clinical application of learning).
In our work, we focused on the human Vitamin K Epoxide Reductase Complex, an important therapeutic target. The continued emergence of hVKORC1 strains with reduced susceptibility to available anticoagulants (VKAs) is a major public health concern that threatens ongoing efforts against blood clotting disorders in humans [
8,
12] or expansion-resistant rat populations [
39,
40]. In some cases, genetic polymorphism induced either impaired enzymatic ability or the complete absence of catalytic property, leading to the failure of metabolic and biochemical reactions in tissues [
41]. For a small VKORC1 protein (163 aas), a total number of 193 variants was reported in the LOVD
3 database [
42]. Since factors contributing to this variability include age, vitamin K intake, concomitant medications, acute and chronic disease status, ethnicity, and genetics [
43,
44,
45], the effects observed in patients treated with vitamin K antagonists are highly heterogeneous [
46].
Given these challenges associated with ambiguous interpretation of empirical data, numerical characterisation of hVKORC1 should be (i) separated as much as possible from uncertain/contradictory literature data, and (ii) based on methods that produce pragmatic and rational results, a strategy that we already used for a study of this protein [
7,
19]. Moreover, with such a great number of hVKORC1 missense variants and the intrinsic disorders of this protein, using in silico methods is the most appropriate approach to obtain crucial, high-quality information. The reliability of using in silico methods for hVKORC1 characterisation has already been successfully demonstrated by the generation of de novo 3D models of a protein with a four-helix transmembrane domain and an intrinsically disordered L-loop [
19], which were confirmed by crystallographic structures published four years later [
20].
The multifaceted description of a protein by compiling data describing its chemical composition (sequence, 1D), local folding (secondary structures, 2D), global architecture (tertiary structure, 3D), and dynamics (conformational ensemble) completes its DYNASOME [
21]. Such a description provides a solid basis for studying the relationships between the DYNASOME descriptors and the protein activities (e.g., signalling and enzymatic reactions). During these physiological processes, a protein forms metastable protein–protein molecular complexes that constitute its INTERACTOME [
47]. Protein–protein binding occurs through the surface allosteric binding pockets, which are topographically distinct from the orthosteric site that binds the natural ligands, forming the POCKETOME of a protein [
22,
48]. In sum, this multifaceted “omics” (multi-omics) characterisation of a protein is a crucial cornerstone for the understanding of biological processes in which a given protein participates.
In our study, we focused mainly on the luminal loop (L-loop), the principal mediator of hVKORC1 activation, and a region often carrying numerous missense mutations. Four L-loop hVKORC1 mutants, possessing missense mutations A41S, W59R, S52W, and H68Y, were studied by numerical approaches (in silico) and compared with the native protein. All proteins were considered in the fully oxidised (inactive) state. Although these four hVKORC1 mutants were associated in [
8] with the resistance phenotype observed in patients (hVKORC1
A41S and hVKORC1
H68Y) or leading to a loss of hVKORC1 activity (hVKORC1
S52W and hVKORC1
W59R), their selection for the multi-omics characterisation was based on a purely logical concept that primarily focuses on differences in physico-chemical properties between native and mutated residues, as well as the locations of missense mutations, which are positioned either in the “cap” (A41S and S52W) or in the “hinge” (W59R and H68Y). Since the S-S disulphide bridge formed by C
43 and C
51 in the “cap” is involved in the direct thiol-disulfide interconversion between hVKORC1 and its redox protein PDI, and the fully relaxed “hinge” is involved in the recognition of the PDI [
5], we hypothesised that the chosen missense mutations may provoke effects detectable at all levels of multi-omics description.
All studied proteins, the native hVKORC1 and its mutants, show similar topology but different structures and dynamics (DYNASOME). The L-loop missense mutations affect the folding and dynamical properties of the L-loop itself, as well as the TMD. Similarly to hVKORC1WT, the compact globular-like “closed” L-loop conformation is the most common of all mutants, while the extended “open” shape is observed either rarely (hVKORC1A41S and hVKORC1W59R) or never (hVKORC1S52W and hVKORC1H68Y). Despite the similar shape, the L-loop conformations in the proteins studied exhibit significantly different folding (2D structure), a propriety typical of intrinsically disordered proteins and apparently mutant-dependent, since this compact globular conformation of the L-loop is maintained mainly by van der Waals contacts, specific for every mutant. Interestingly, transient structural elements of the L-loop (α-helix, 310-helix, coil) and their combination, and their relative orientation in 3D space, are also mutant-specific.
The DYNASOME characterisation of hVKORC1 mutants showed that L-loop missense mutation effects indicate a strong interdependence of the L-loop and the TMD not found in the native protein. The great dissimilarity between the DYNASOME of the native protein and its mutants is evidenced by the mutant-induced partial unfolding of TM2 and TM3 TMD helices in the fractions adjacent to the L-loop. This structural disorder increases the flexibility of these helices, affects the plasticity of the L-loop, and alternates correlations of the inherent dynamics in hVKORC1 mutants with respect to the native protein. According to our analysis, the W59R is the most troublemaking mutation of hVKORC1, disturbing the dynamics of half of the protein, whereas the other mutations only affect a quarter of the protein.
As we reported previously, the structural and dynamics metrics of native hVKORC1, simulated either as the protein inserted into a membrane [
5,
19] or placed in an aqueous solution [
7], are similar. These results indicate that hVKORC1 is composed of the stable transmembrane domain and the disordered L-loop, located in the endoplasmic reticulum lumen. Furthermore, the de novo predicted model of hVKORC1 matches well with crystallographic structures (no membrane) [
20]. Based on these results, the mutated proteins were simulated in an aqueous solution. However, since we observed that the missense mutations affect not only the L-loop but also part of the transmembrane helices, it will be interesting in perspective to analyse these mutants as inserted into the membrane to distinguish between the mutation-induced effects and those promoted by the membrane.
To reveal the underlying relationships between the DYNASOME–POCKETOME–INTERACTOME of the five hVKORC1 proteins, we characterised (i) their sequence–structure–dynamics properties, which evidenced their mutant-specific dependence, (ii) compared the topography of these intrinsically disordered proteins through the free energy landscape, (iv) localised their cryptic pockets, and (v) explored them as PDI targets.
Observing such a large number of mutation-induced effects through the DYNASOME–POCKETOME–INTERACTOME description, and their clear sequence-dependence, we attempted to compare these proteins and distinguish them by generating a free energy landscape. Since the motion of these proteins is a central factor determining their DYNASOME properties, a cumulative free energy landscape was constructed on two principal components describing the vast majority of hVKORC1 movements. Because all proteins studied are intrinsically disordered, we did not expect to obtain completely separated global minima for each protein. However, we observed two local minima (W3 and W5) consisting of the conformations of only one protein, hVKORC1W59R and hVKORC1S52W, respectively. The deepest wells, W1, W2, and W4, include different content, consisting of MD conformations of two or three proteins.
Our results indicate that the minima of the hVKORC1 free energy landscape reflect rather the inherent conformational and structural features of the local L-loop. The most differing mutant-specific L-loop conformations are compiled in distant wells; however, L-loop conformations of the same shape and size form overlapping subspaces even from different proteins, both native and mutants. Distinguishing and isolating the conformational ensemble of each disordered protein, which differs from others by point mutation, is a not trivial task, even if one uses PCA-derived metrics describing the largest variances of the studied proteins.
Another consequence of the mutation-induced effects on protein DYNASOME manifests in the global changes (geometric, topological, and probabilistic) of the inherent pockets. Structural changes drive the formation and evolution of cryptic sites. The highly varied L-loop conformations in the native protein promote the formation of pockets varying in their volume, and belonging to cryptic pockets [
34], detected during MD simulations [
49]. In some hVKORC1 mutants, these pockets disappear completely, while in others, they appear as new pockets. Although the globular “closed” conformation of the L-loop is the most likely among all hVKORC1 studied, we observed an alteration of the recognition properties of the L-loop with respect to PDI, the hVKORC1 redox protein. According to our preliminary studies (docking trials), two mutants, hVKORC1
A41S and hVKORC1
W59R, recognise PDI similarly to the native protein, while two others, apparently, are not capable of binding this redox protein. Since the folding and binding are tightly coupled, the changes in folding of the L-loop in hVKORC1
S52W and hVKORC1
H68Y may be the crucial factors influencing the PDI recognition and binding.
Since we studied the inactive form of the protein, we cannot draw any conclusions regarding the sensitivity or resistance of the mutants to AVKs (warfarin or its analogue), since this property is manifested exclusively by the activated protein. Likewise, it is not possible to estimate the correctness or predictability of the results obtained by docking trials. To our knowledge, the ability or incapacity of hVKORC1 mutants to recognise and bind its redox protein has never been reported in the literature.
Based on our results, we postulated that (i) the intra-protein allosteric regulation is specific to the native hVKORC1 and each of its mutants; (ii) the inherent allosteric regulation and cryptic pockets of each mutant depend on its DYNASOME; (iii) the recognition of the redox protein by hVKORC1 (INTREACTOME) depends on their DYNASOME. This multifaceted description of proteins produces ”omics” data sets, which are the crucial keys to understanding the physiological processes of proteins and the pathologies caused by degradation at any of these “omics” levels. Additionally, such characterisation opens novel perspectives for the development of “allo-network drugs” necessary for the treatment of blood disorders.
This innovative concept of “allo-network drugs” is based on two types of inhibition: intra-protein competitive or allosteric inhibitors and inter-protein modulators interacting at the protein-protein interaction interface [
26]. Such an approach is a way to improve treatment by increasing the drugs’ specificity, avoiding or significantly reducing the side effects caused by non-specific molecules, and possibly limiting the rapid evolution of new protein strains.


