Article

Real-Time Determination of Intracellular cAMP Reveals Functional Coupling of Gs Protein to the Melatonin MT1 Receptor

1
Division of Life Science and the Biotechnology Research Institute, Hong Kong University of Science and Technology, Hong Kong, China
2
State Key Laboratory of Molecular Neuroscience, Molecular Neuroscience Center, Hong Kong University of Science and Technology, Hong Kong, China
3
Hong Kong Center for Neurodegenerative Diseases, 17 Science Park West Avenue, Hong Kong Science Park, Shatin, Hong Kong, China
*
Author to whom correspondence should be addressed.
These authors contributed equally to this work.
Int. J. Mol. Sci. 2024, 25(5), 2919; https://doi.org/10.3390/ijms25052919
Submission received: 25 January 2024 / Revised: 23 February 2024 / Accepted: 28 February 2024 / Published: 2 March 2024

Abstract

:
Melatonin is a neuroendocrine hormone that regulates the circadian rhythm and many other physiological processes. Its functions are primarily exerted through two subtypes of human melatonin receptors, termed melatonin type-1 (MT1) and type-2 (MT2) receptors. Both MT1 and MT2 receptors are generally classified as Gi-coupled receptors owing to their well-recognized ability to inhibit cAMP accumulation in cells. However, it remains an enigma as to why melatonin stimulates cAMP production in a number of cell types that express the MT1 receptor. To address if MT1 can dually couple to Gs and Gi proteins, we employed a highly sensitive luminescent biosensor (GloSensorTM) to monitor the real-time changes in the intracellular cAMP level in intact live HEK293 cells that express MT1 and/or MT2. Our results demonstrate that the activation of MT1, but not MT2, leads to a robust enhancement on the forskolin-stimulated cAMP formation. In contrast, the activation of either MT1 or MT2 inhibited cAMP synthesis driven by the activation of the Gs-coupled β2-adrenergic receptor, which is consistent with a typical Gi-mediated response. The co-expression of MT1 with Gs enabled melatonin itself to stimulate cAMP production, indicating a productive coupling between MT1 and Gs. The possible existence of a MT1-Gs complex was supported through molecular modeling as the predicted complex exhibited structural and thermodynamic characteristics that are comparable to that of MT1-Gi. Taken together, our data reveal that MT1, but not MT2, can dually couple to Gs and Gi proteins, thereby enabling the bi-directional regulation of adenylyl cyclase to differentially modulate cAMP levels in cells that express different complements of MT1, MT2, and G proteins.

1. Introduction

Melatonin is a pleiotropic hormone produced by both prokaryotes and eukaryotes. One of the prominent functions of melatonin in humans is the regulation of our circadian rhythm. The synthesis and release of melatonin from the pineal gland are synchronized with the diurnal rhythm, and reach a peak at night time. Melatonin primarily signals through the activation of G protein-coupled receptors (GPCRs), and two subtypes of human melatonin receptors have been identified and denoted as type-1 (MT1) and type-2 (MT2) receptors [1,2]. Both MT1 and MT2 receptors belong to the Class A GPCR family, and they are expressed in a variety of tissues that range from multiple brain regions to numerous peripheral tissues such as the liver and skin [3]. The wide distribution of melatonin receptors implies that the therapeutic potentials of melatoninergic ligands can go far beyond the treatment of sleep disorders [4]. Indeed, melatonin receptors are implicated in the pathophysiology of Alzheimer’s disease [5,6], major depression [7], type 2 diabetes [8], and several other disorders [4]. Irrespective of the therapeutic areas, the beneficial effects of melatonin are invariably manifested through the melatonin receptors and their corresponding G protein-regulated signaling networks.
MT1 and MT2 receptors are commonly classified as Gi-coupled receptors because their cellular signals are blocked upon the ADP-ribosylation of Gαi/o proteins by pertussis toxin (PTX) [9]. Melatonin inhibits adenylyl cyclase (AC) through Gi proteins in many different types of cells and tissues [10,11,12,13,14] to exert its functions, including the regulation of the circadian rhythm and insulin secretion [15,16]. Paradoxically, and despite their demonstrated coupling to Gi proteins, the melatonin receptors are seemingly also able to stimulate the production of intracellular cAMP. Several studies have reported melatonin-induced cAMP formation in different cell types that express the MT1 or MT2 receptor endogenously or upon transfection [17,18,19,20,21]. The expression of the human MT1 receptor in the SH-SY5Y neuroblastoma cell line produced a different phenotypic outcome compared to its expression in other mammalian cell lines commonly used in heterologous expression studies. Instead of the inhibition of AC as observed in many cellular models [10,11,12,13,14,22], melatonin acutely stimulated cAMP synthesis and potentiated forskolin-stimulated cAMP production in SH-SY5Y cells [17]. This intriguing observation was presumed to arise from the indirect regulation of AC, as the melatonin-induced response in SH-SY5Y cells requires the mobilization of internal calcium stores [17], and because the protein kinase C (PKC)-mediated activation of distinct isoforms of AC (e.g., AC2 and AC4) has previously been demonstrated [23,24]. Although plausible, the proposed mechanism would entail the release of Gβγ dimer from Gi proteins that are activated by the melatonin receptors [25], but the melatonin-mediated stimulation of cAMP formation in SH-SY5Y cells is independent of functional Gi proteins [17].
As exemplified by the β-adrenergic receptors [26,27], it has long been known that GPCRs can dually couple to Gi and Gs proteins, and this possibility cannot be entirely excluded for the melatonin receptors. There is indeed evidence of Gs coupling to melatonin receptors. Melatonin has been shown to dose-dependently stimulate cAMP synthesis in rabbit nonpigmented ciliary epithelial cells [20] and chick adenohypophysis cells [21], while the MT1-mediated stimulation of cAMP in 22Rv1 and RWPE-1 human prostate epithelial cells is abolished upon the knockdown of Gαs, but not of Gαi2 [18]. The functional characterization of melatonin receptors from the Atlantic salmon in mammalian COS-7, CHO, and SH-SY5Y cells has also demonstrated a robust stimulation of a cAMP-driven CRE-Luc reporter through melatonin [28]. Moreover, the ability of melatonin to potentiate forskolin-induced cAMP production in different cell types [17,19,28,29] may reflect receptor coupling to Gs, because all isoforms of AC respond synergistically to Gαs and forskolin stimulations [30]. Given the contradictory reports on the regulation of intracellular cAMP levels by melatonin, it remains unresolved as to whether the melatonin receptors are dually coupled to Gi and Gs proteins.
Since Gs-dependent signals appear to participate in multiple biological actions of melatonin, ranging from the regulation of extracellular signal-regulated kinase (ERK) [19,21], c-Jun N-terminal kinase (JNK) [24], Cl conductance [20,29], to lipolysis [31], it is pertinent to establish if MT1 and MT2 are indeed capable of directly stimulating Gs. Given that classical (e.g., [3H]adenine, [32P]ATP, RIA, and ELISA) as well as contemporary (e.g., enzyme fragment complementation) methods for assaying intracellular cAMP levels often require one or more incubation steps and subsequent cell lysis, they may not be ideal for determining dual coupling to Gs and Gi, which could be temporally regulated [27]. We therefore employed a highly sensitive luminescent biosensor (GloSensorTM) to monitor real-time changes in intracellular cAMP in intact live HEK293 cells expressing the MT1 or MT2 receptor. The GloSensorTM assay utilizes a mutant form of Photinus pyralis luciferase that was engineered to produce light upon binding cAMP [32], and it has been successfully utilized to study the regulation of cAMP by different GPCRs in HEK293 cells [33,34]. Here, we report that the activation of MT1 (but not MT2) leads to a robust enhancement of forskolin-stimulated cAMP formation in a Gαs-dependent manner.

2. Results

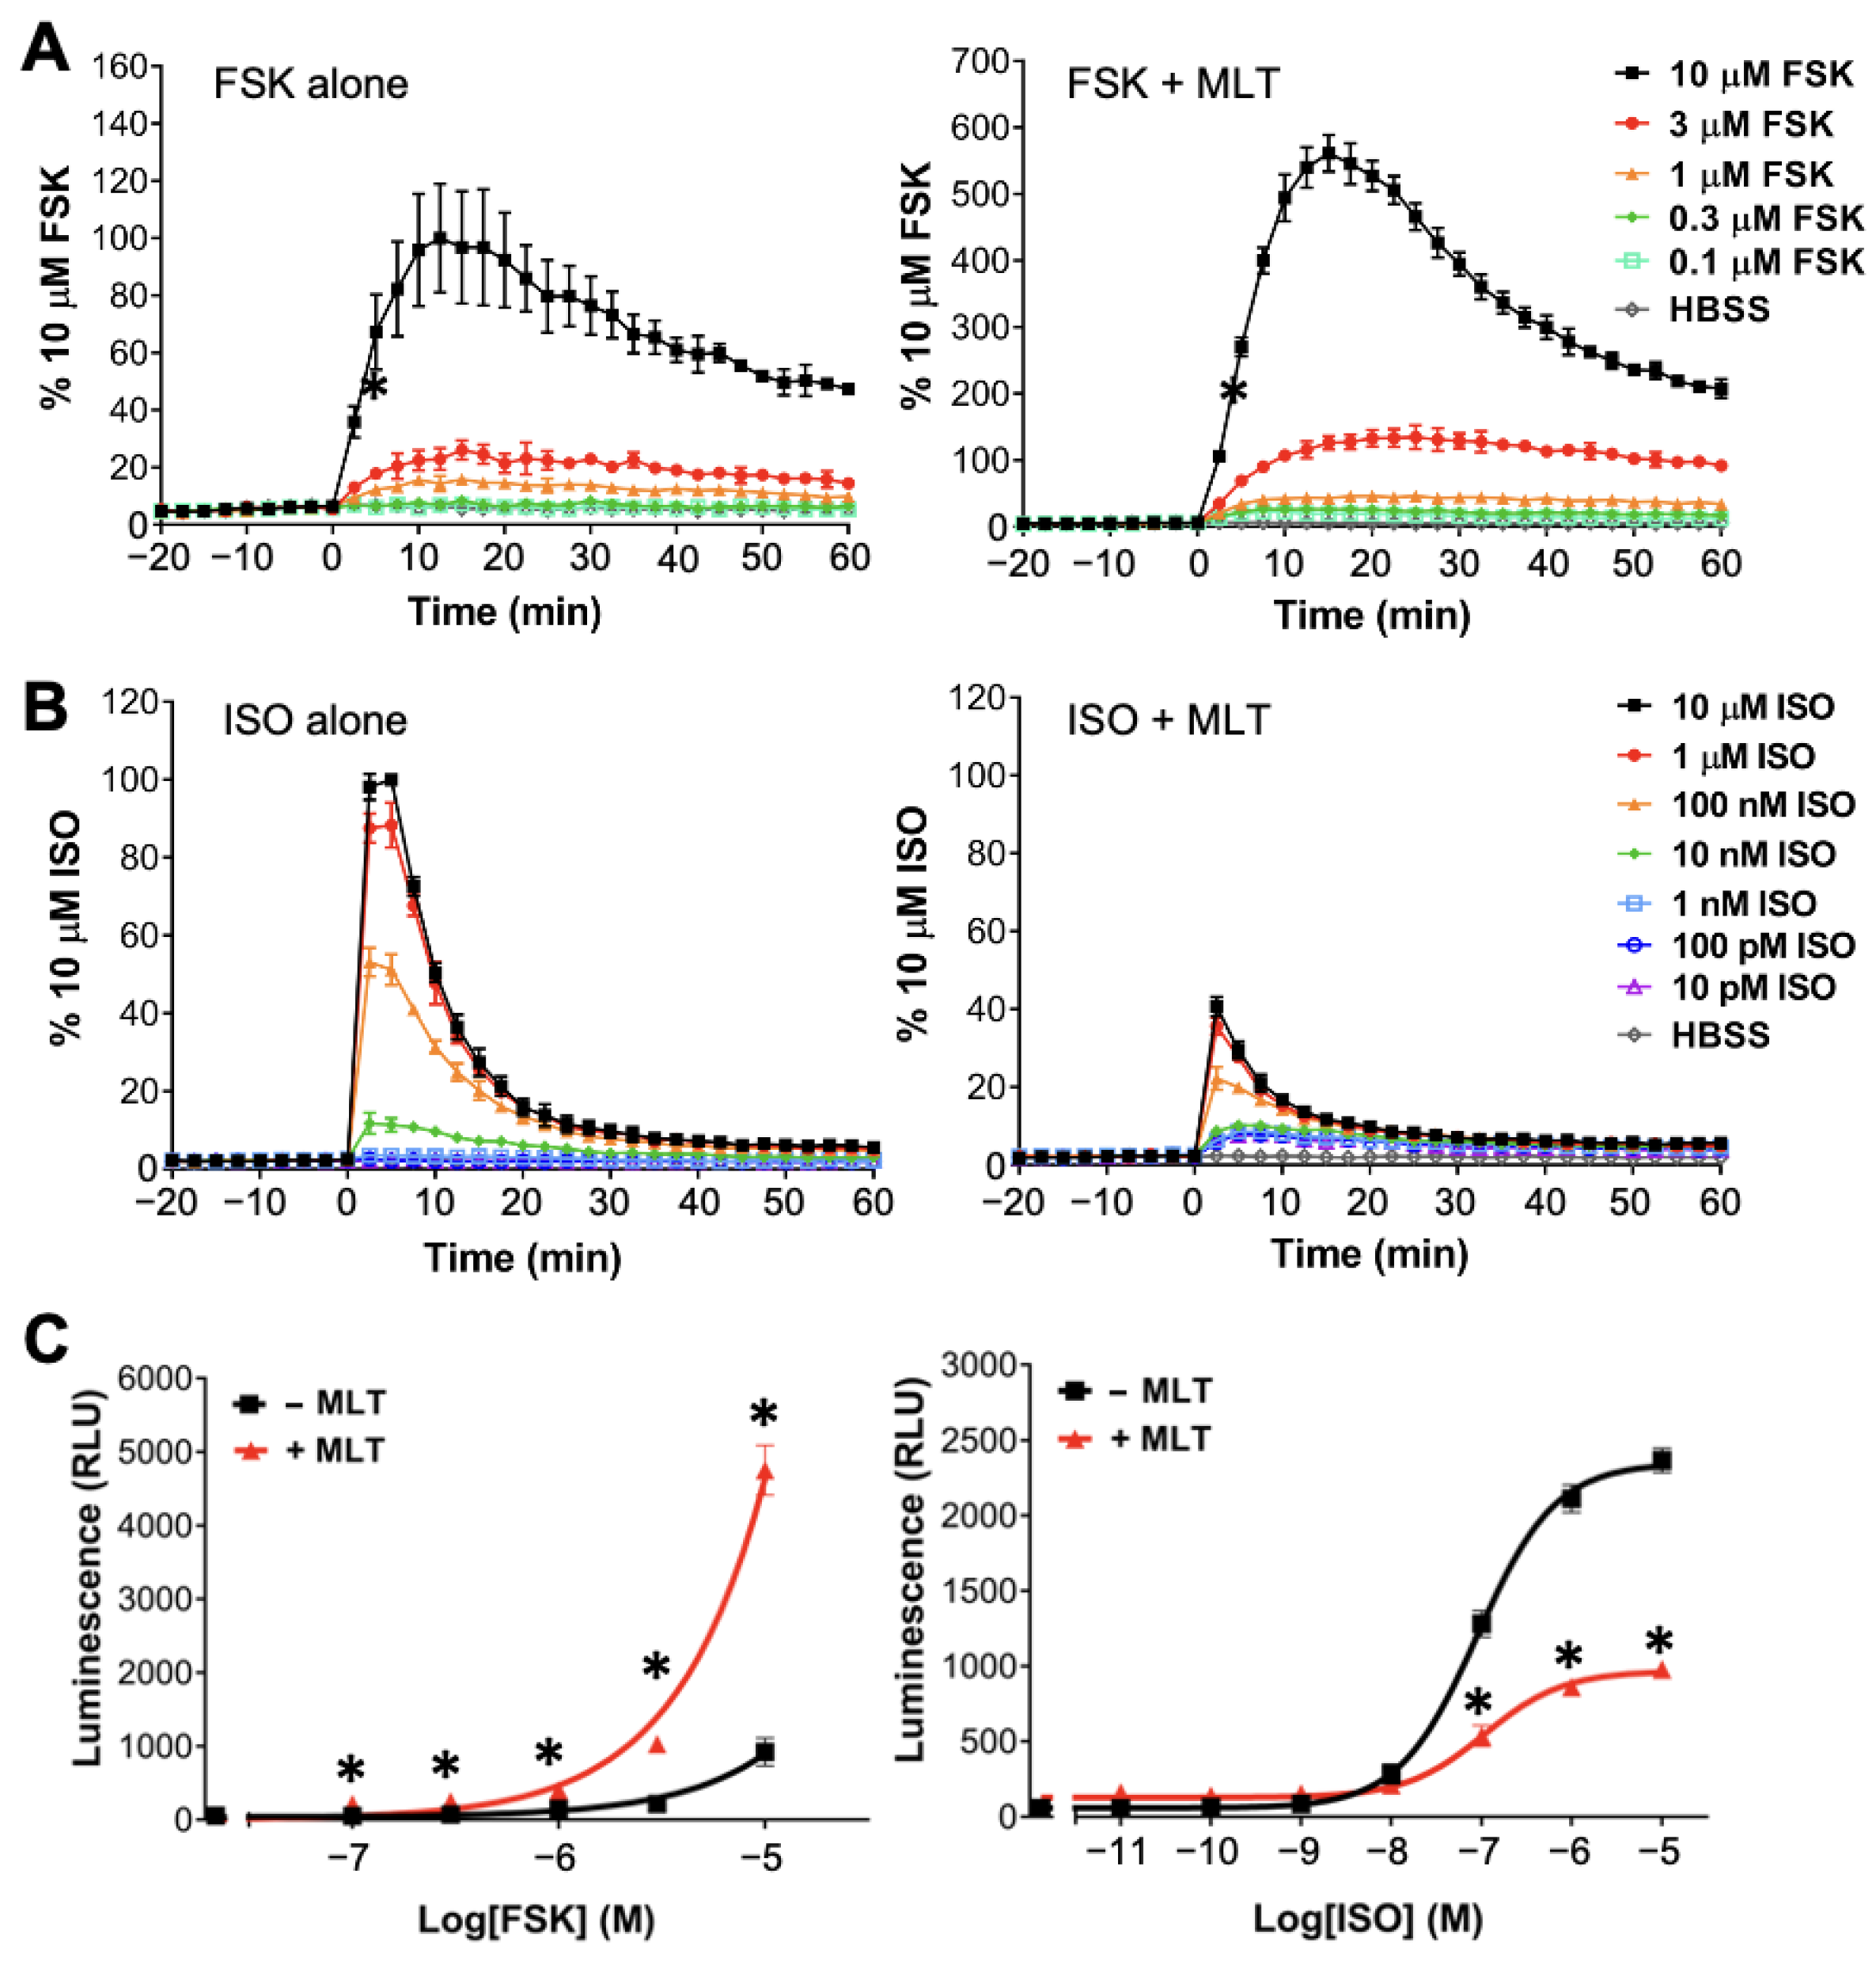
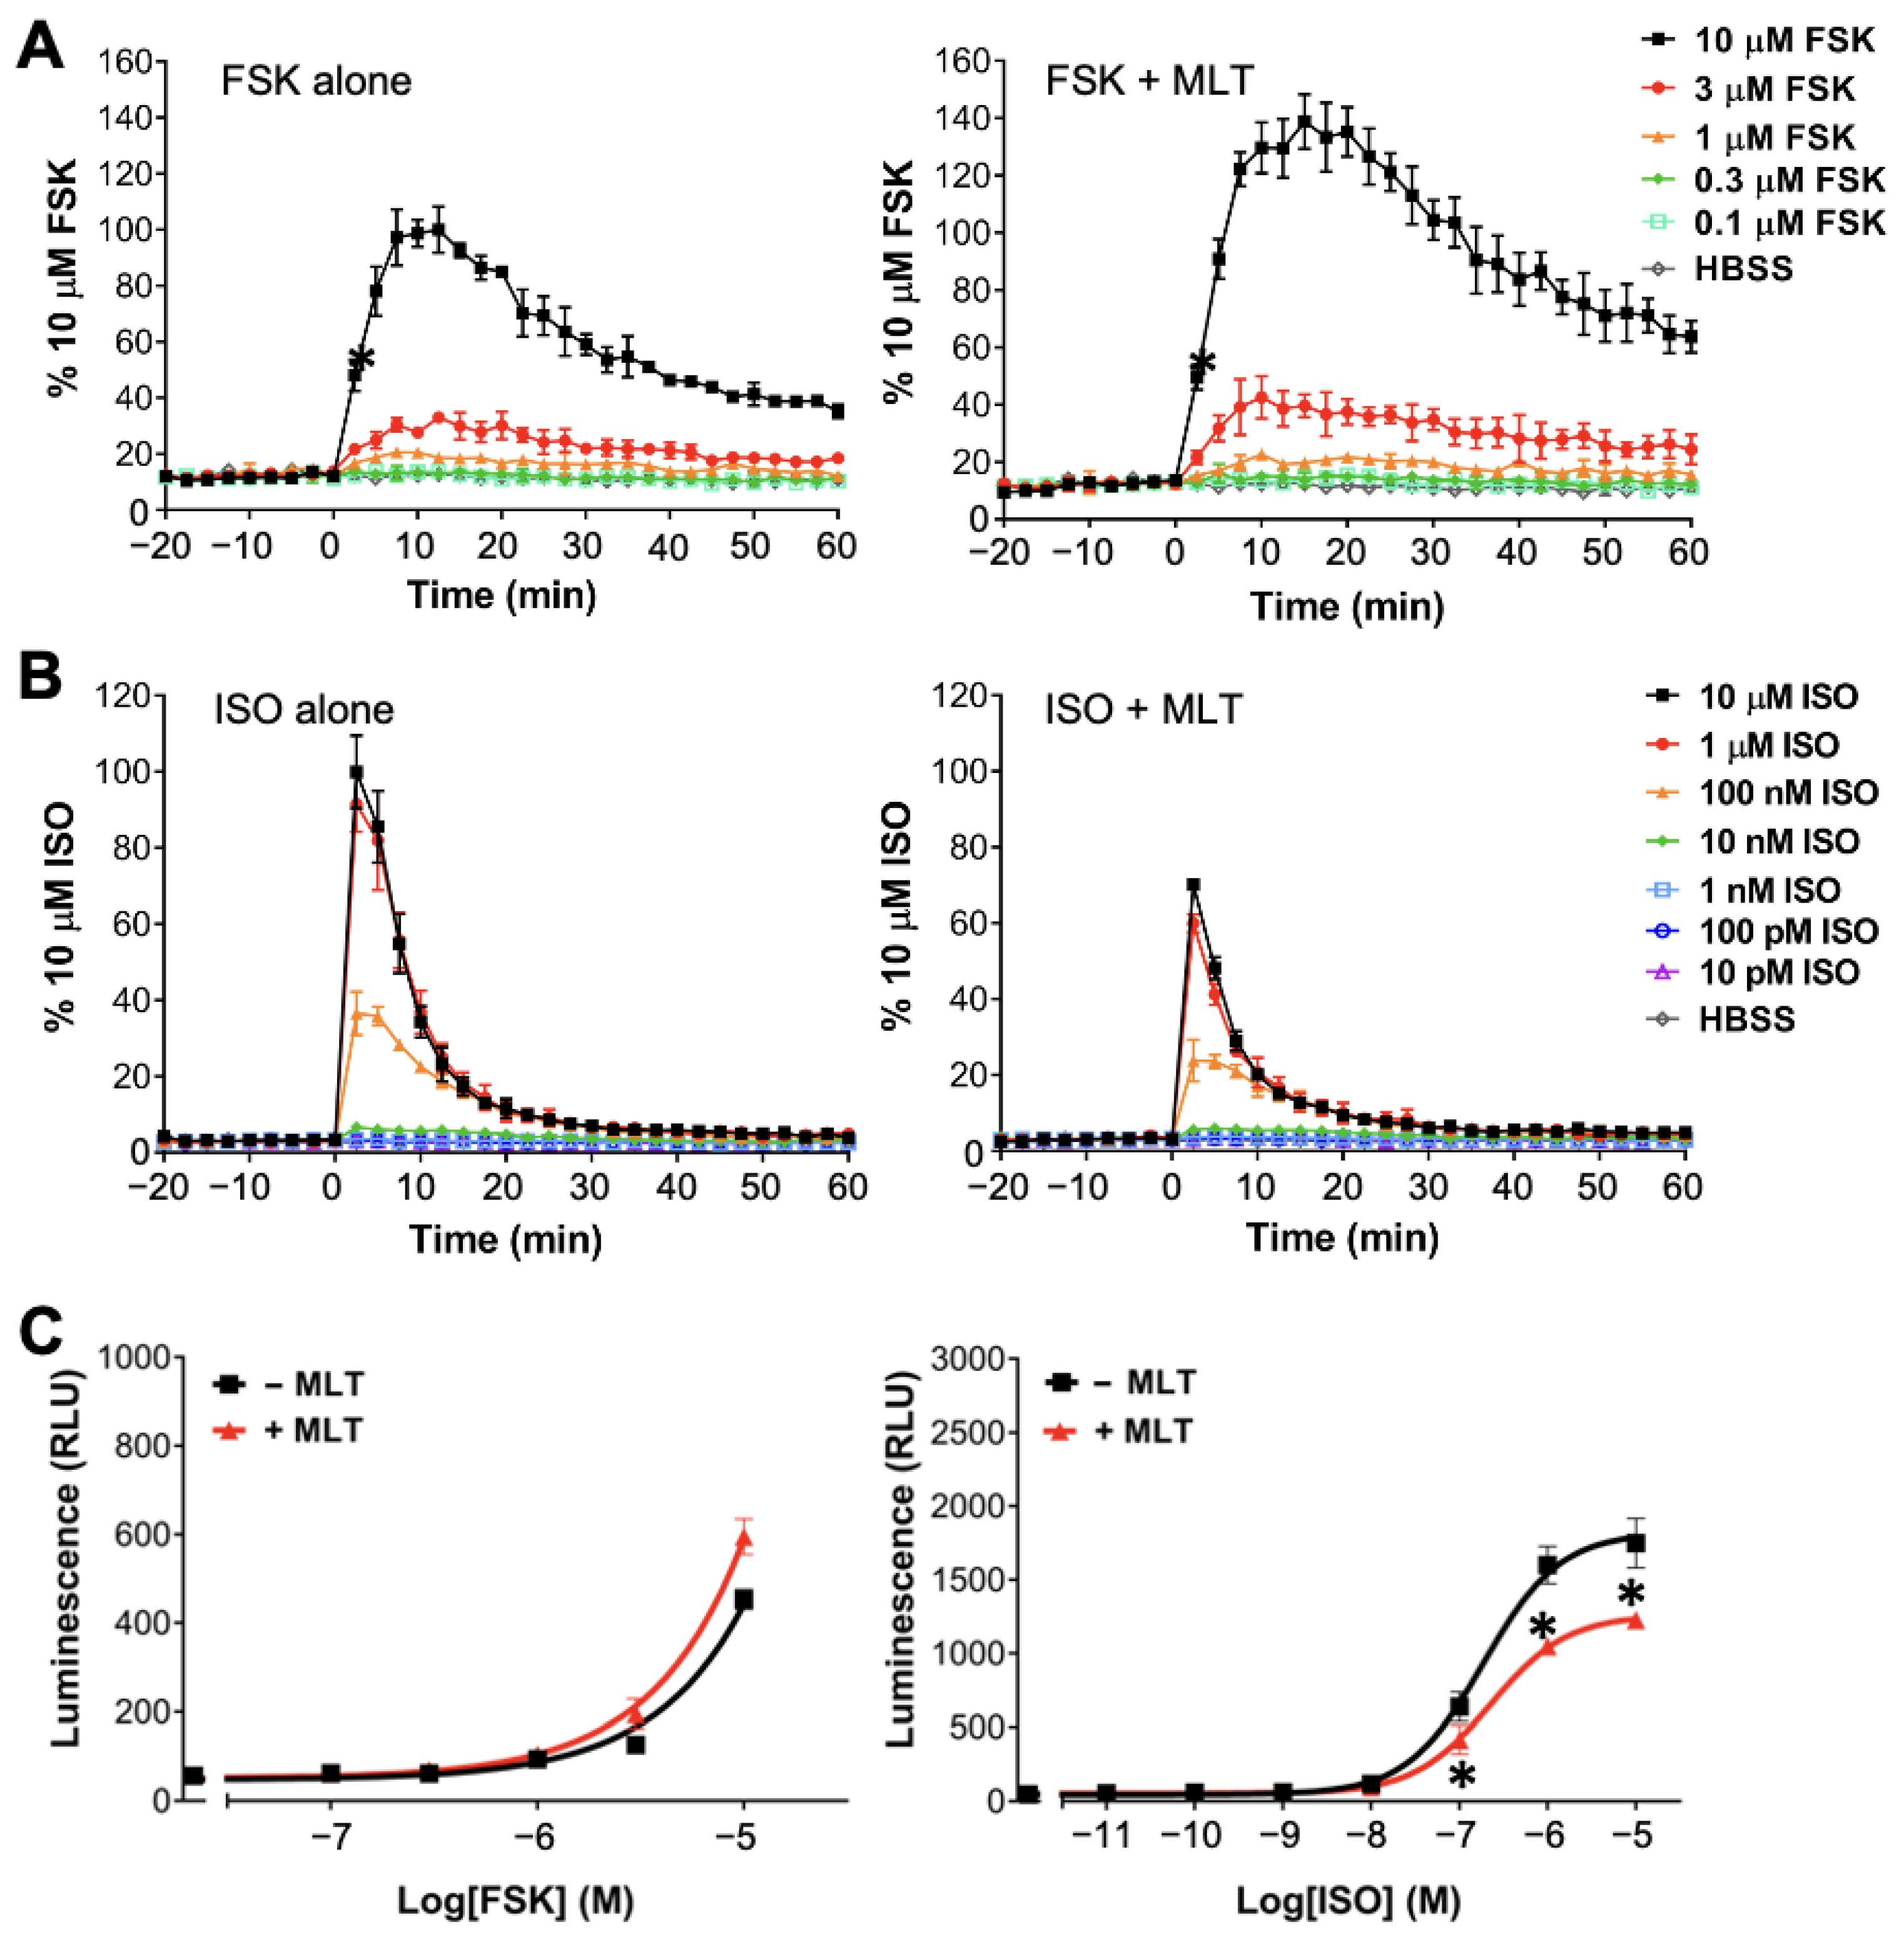
2.1. Realtime Detection of cAMP in Live HEK293 Cells

In our experiments, the HEK293 cells were used for the heterologous expression of the MT1 or MT2 receptors, with the advantage of providing identical cellular background for the comparison of the signaling difference(s) between the two melatonin receptor subtypes. We first established the ability of the GloSensorTM cAMP assay to detect changes in the intracellular cAMP concentration in live HEK293 cells upon stimulation by forskolin and isoproterenol. Forskolin is a natural diterpene that increases the cAMP level in cells by directly activating the ACs and is a common tool for studying the activities of Gi or Gs proteins [35]. Isoproterenol activates Gs-coupled β2-adrenergic receptors (β2ARs) and is known to increase cAMP production in HEK293 cells by stimulating the endogenously expressed β2AR [36,37]. The biosensor pGloSensorTM-22F (0.5 μg) and MT1 (0.5 μg) were introduced into HEK293 cells on 60 mm dishes through PEI transfection. Transfectants were re-seeded onto 96-well plates one day later and then assayed after another day. As illustrated in Figure 1A (left panel), the application of forskolin at increasing concentrations (100 nM to 10 μM) rapidly increased the intracellular cAMP level, with a peak occurring at ~15 min. At the highest concentration of forskolin tested (i.e., 10 μM), the stimulated response was sustained over a period of 60 min (Figure 1A, left panel). Likewise, a concentration-dependent (10 pM to 10 μM) stimulation of cAMP formation by isoproterenol was clearly detected in these live cells (Figure 1B, left panel). The responses driven by isoproterenol were more rapid with peak attainment at ~5 min, and were transient rather than sustained (Figure 1B, left panel). The observed characteristics of isoproterenol are typical of GPCR-regulated pathways. These studies demonstrate the real-time detection of intracellular cAMP in live HEK293 cells.

2.2. Atypical Regulations of cAMP by MT1

We then examined the real-time cAMP response of the same transfectants upon a simultaneous challenge with a saturating concentration (100 nM) of melatonin. As a Gi-coupled receptor, the activation of MT1 is expected to suppress the stimulatory actions of forskolin and isoproterenol. Surprisingly, the simultaneous addition of melatonin significantly stimulated the forskolin response across the different concentrations of forskolin tested, with up to a six-fold enhancement at 10 μM of forskolin (Figure 1A, right panel). In contrast, melatonin inhibited isoproterenol-stimulated cAMP formation in the MT1 transfectants (Figure 1B, right panel), as one would expect for a Gi-coupled receptor agonist; melatonin inhibited the isoproterenol response by ~55%. The contrasting actions of melatonin on forskolin- and isoproterenol-stimulated cAMP formation are clearly illustrated upon plotting the cAMP-driven luminescence against the concentrations of forskolin/isoproterenol used in the absence or presence of 100 nM melatonin (Figure 1C).
When similar studies were performed on HEK293 cells co-expressing MT2 and the biosensor pGloSensorTM-22F, both forskolin and isoproterenol stimulated real-time productions of cAMP in concentration-dependent manners (Figure 2A,B, left panels). Melatonin, however, neither enhanced nor inhibited the forskolin-stimulated response in the MT2 transfectants (Figure 2A, right panel; Figure 2C, left panel), but remained capable of suppressing isoproterenol-induced cAMP formation (Figure 2B, right panel). The magnitude of the melatonin-mediated inhibition of the isoproterenol response was weaker in the MT2 transfectants compared to that in MT1 transfectants (Figure 2C, right panel).
Next, we investigated the effect of different concentrations of melatonin on the cAMP stimulation by 10 μM forskolin or 1 μM isoproterenol. The cAMP response was measured at 15 min or 5 min after forskolin or isoproterenol treatment, respectively. Interestingly, in the absence of agonists, the overexpression of either MT1 or MT2 receptors significantly suppressed the cAMP stimulation by both forskolin and isoproterenol compared to the pcDNA3.1 empty vector control, with a ~60% reduction in the basal cAMP level (Figure 3A). In contrast, no inhibition was observed in transfectants overexpressing the Gi-coupled dopamine D2 receptor (D2R; Figure 3A). This result suggests the existence of a constitutive inhibitory activity of the melatonin receptors, which was absent from D2R.
The ligand-induced receptor activity on cAMP production was then investigated, and corresponding dose response curves were generated. Increasing concentrations of melatonin or quinpirole (agonist of D2R) were co-administered with 10 μM forskolin or 1 μM isoproterenol in the MT1-, MT2-, or D2R-expressing cells. In the MT1 transfectants, melatonin potentiated the forskolin-stimulated cAMP response across various melatonin concentrations tested (1 nM to 1 μM) as compared to cells treated with forskolin alone (Figure 3B, upper left panel). However, no significant change in the forskolin-stimulated cAMP level was observed in the MT2 transfectants treated with different concentrations of melatonin (Figure 3B, upper left panel). In contrast to the forskolin-induced cAMP response, the application of melatonin significantly inhibited isoproterenol-induced cAMP production in both MT1 and MT2 transfectants in a dose-dependent manner, with a maximal reduction of ~50% and ~40% in cAMP level, respectively (Figure 3B, lower left panel). On the other hand, as expected for a typical Gi-coupled receptor, the activation of D2R by quinpirole dose-dependently suppressed both forskolin- and isoproterenol-induced cAMP production, with the maximal of a more than 80% reduction in both forskolin- and isoproterenol-stimulated responses (Figure 3B, upper and lower right panels). These results demonstrate an atypical stimulatory action of melatonin on the forskolin-induced cAMP response by the MT1 receptor.

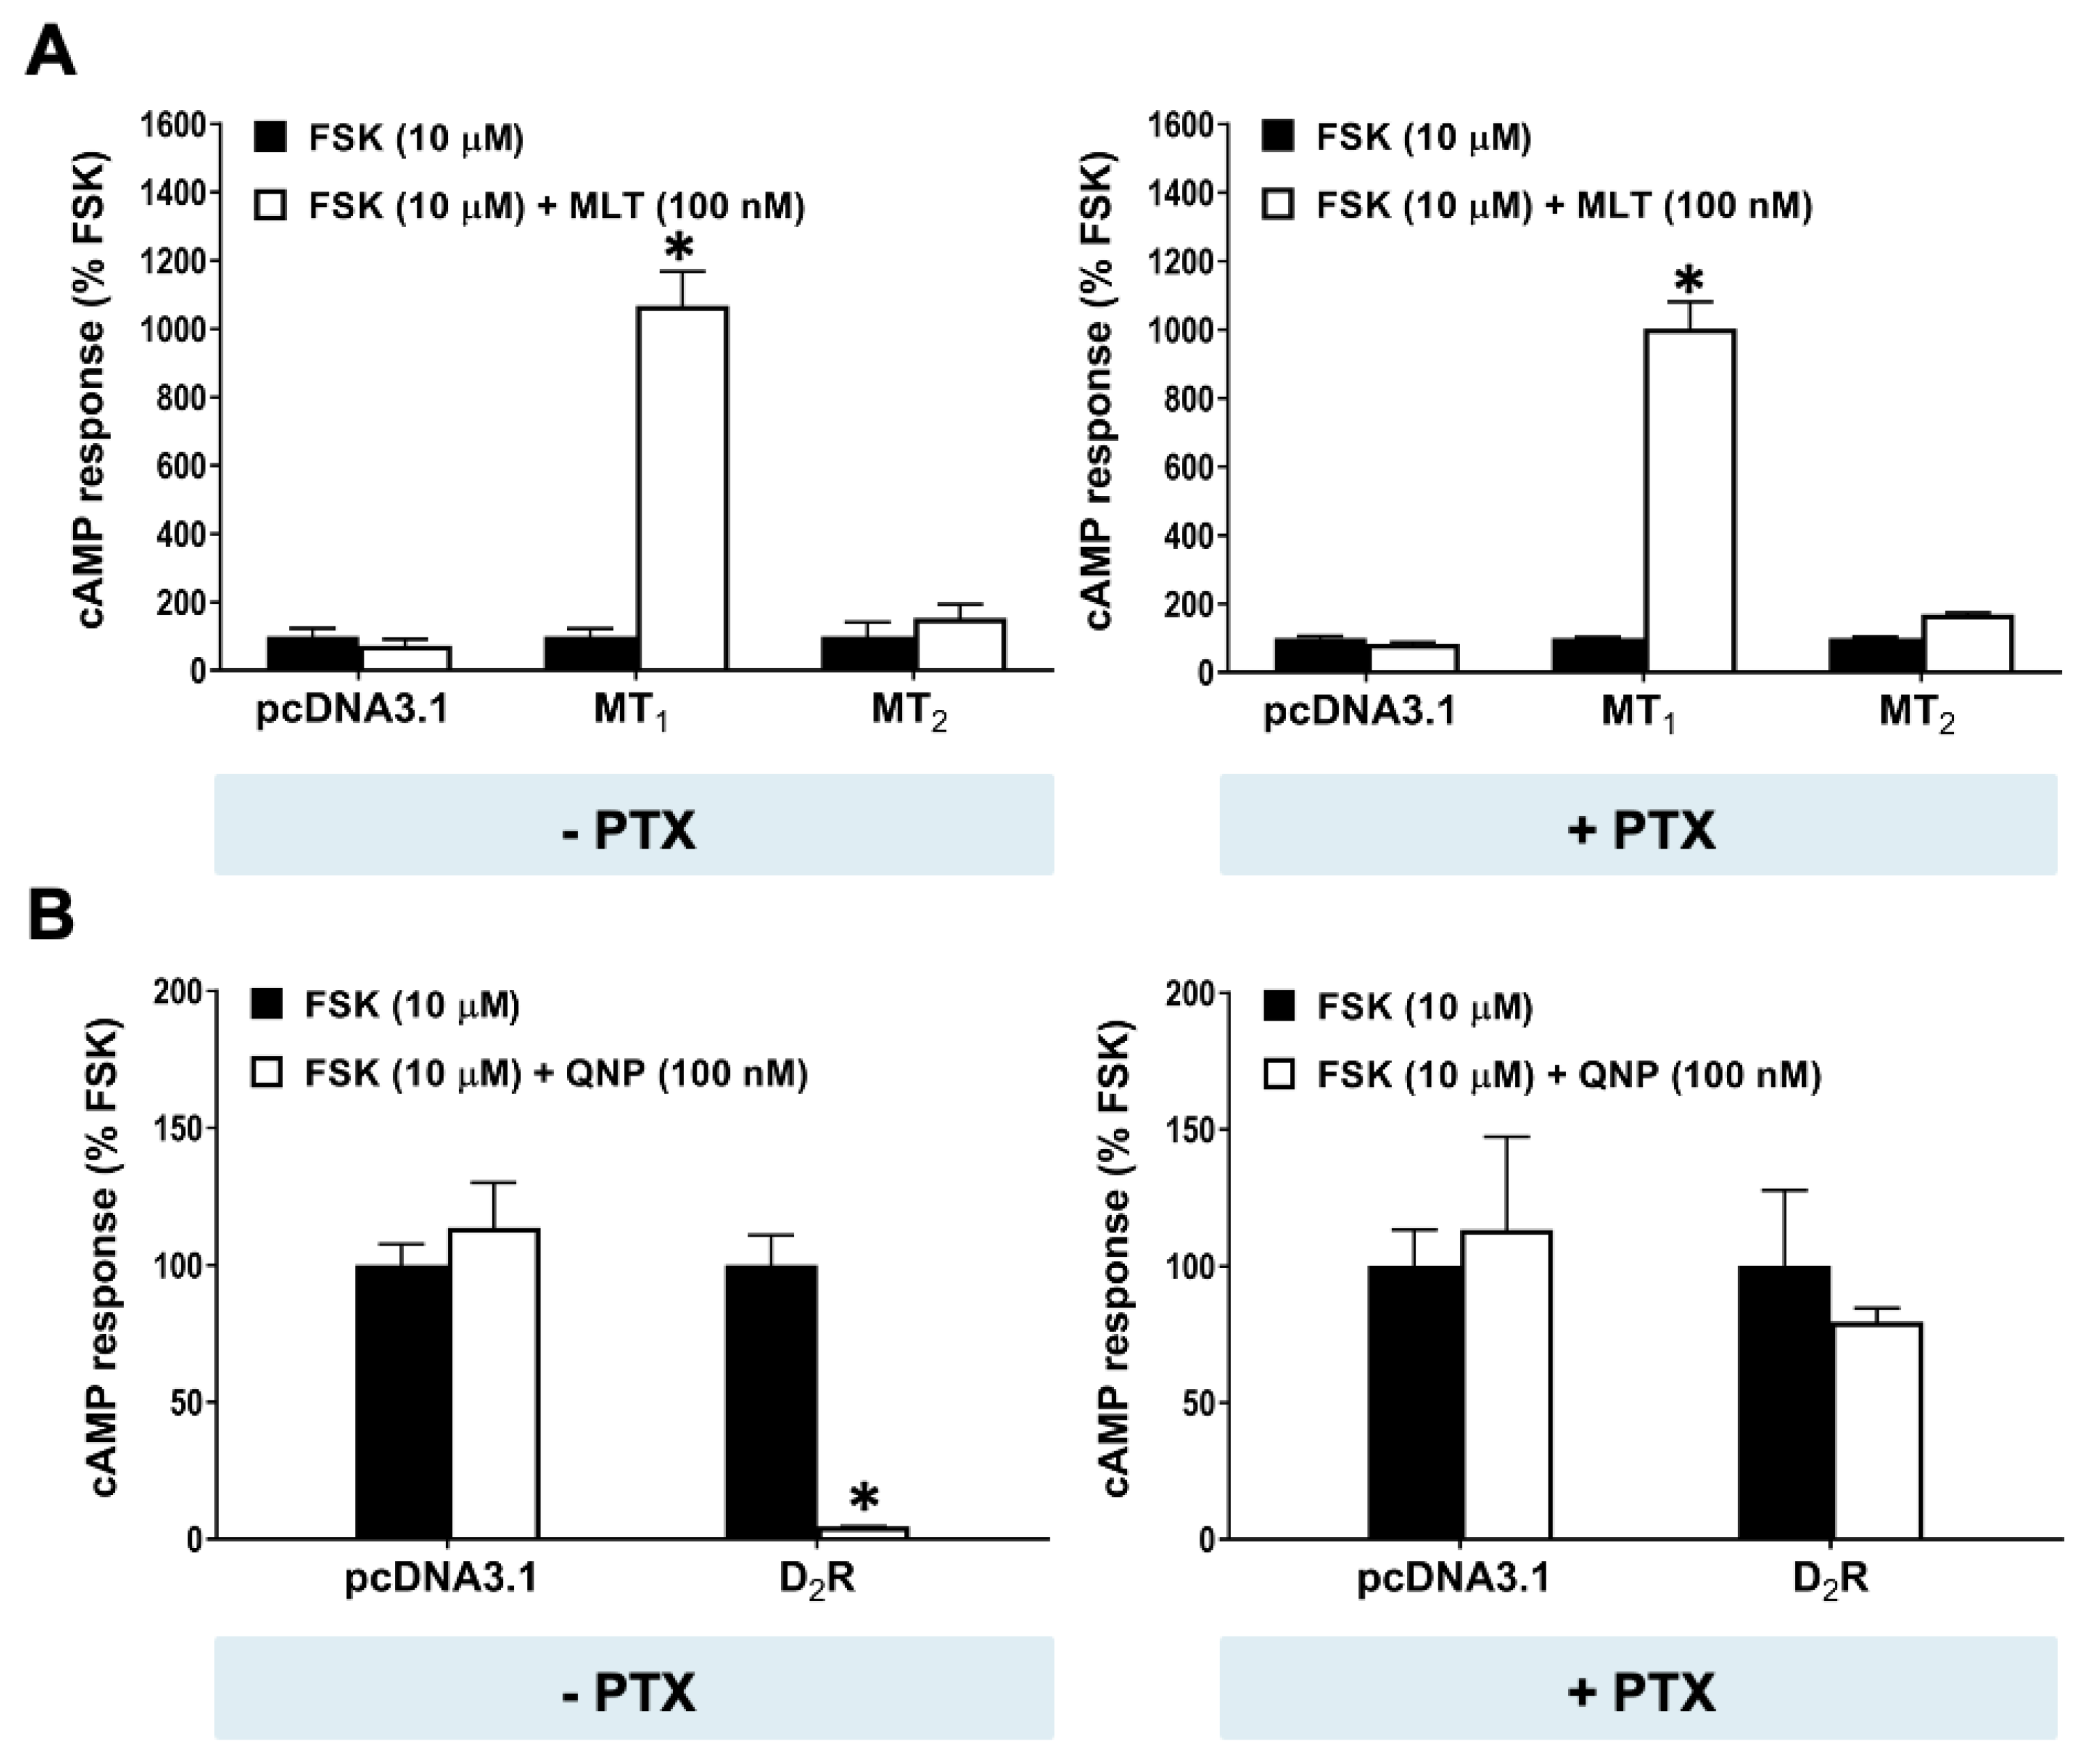
2.3. cAMP Stimulation by MT1 Is Independent of Gi Signaling

To dissect the signaling mechanism underlying the atypical stimulation on the forskolin-induced cAMP response by the MT1 receptor, we first assessed the involvement of Gi signaling since the Gβγ dimer from Gi proteins has been shown to contribute to the activation of several AC isoforms [38]. We examined the effect of PTX, a toxin widely used to block the Gi signaling pathway [39], on the cAMP response in HEK293 cells expressing MT1, MT2, or D2R. As illustrated in Figure 4A, the overnight treatment of cells with PTX (100 ng/mL) failed to suppress or block the promoting effect of 100 nM melatonin on forskolin-induced cAMP formation in the MT1 transfectants, whereas the same PTX treatment completely abolished the inhibitory effect of quinpirole on forskolin-induced cAMP production in cells expressing D2R (Figure 4B). This result excludes the involvement of Gi signaling in the MT1-mediated potentiation of cAMP stimulation by forskolin.

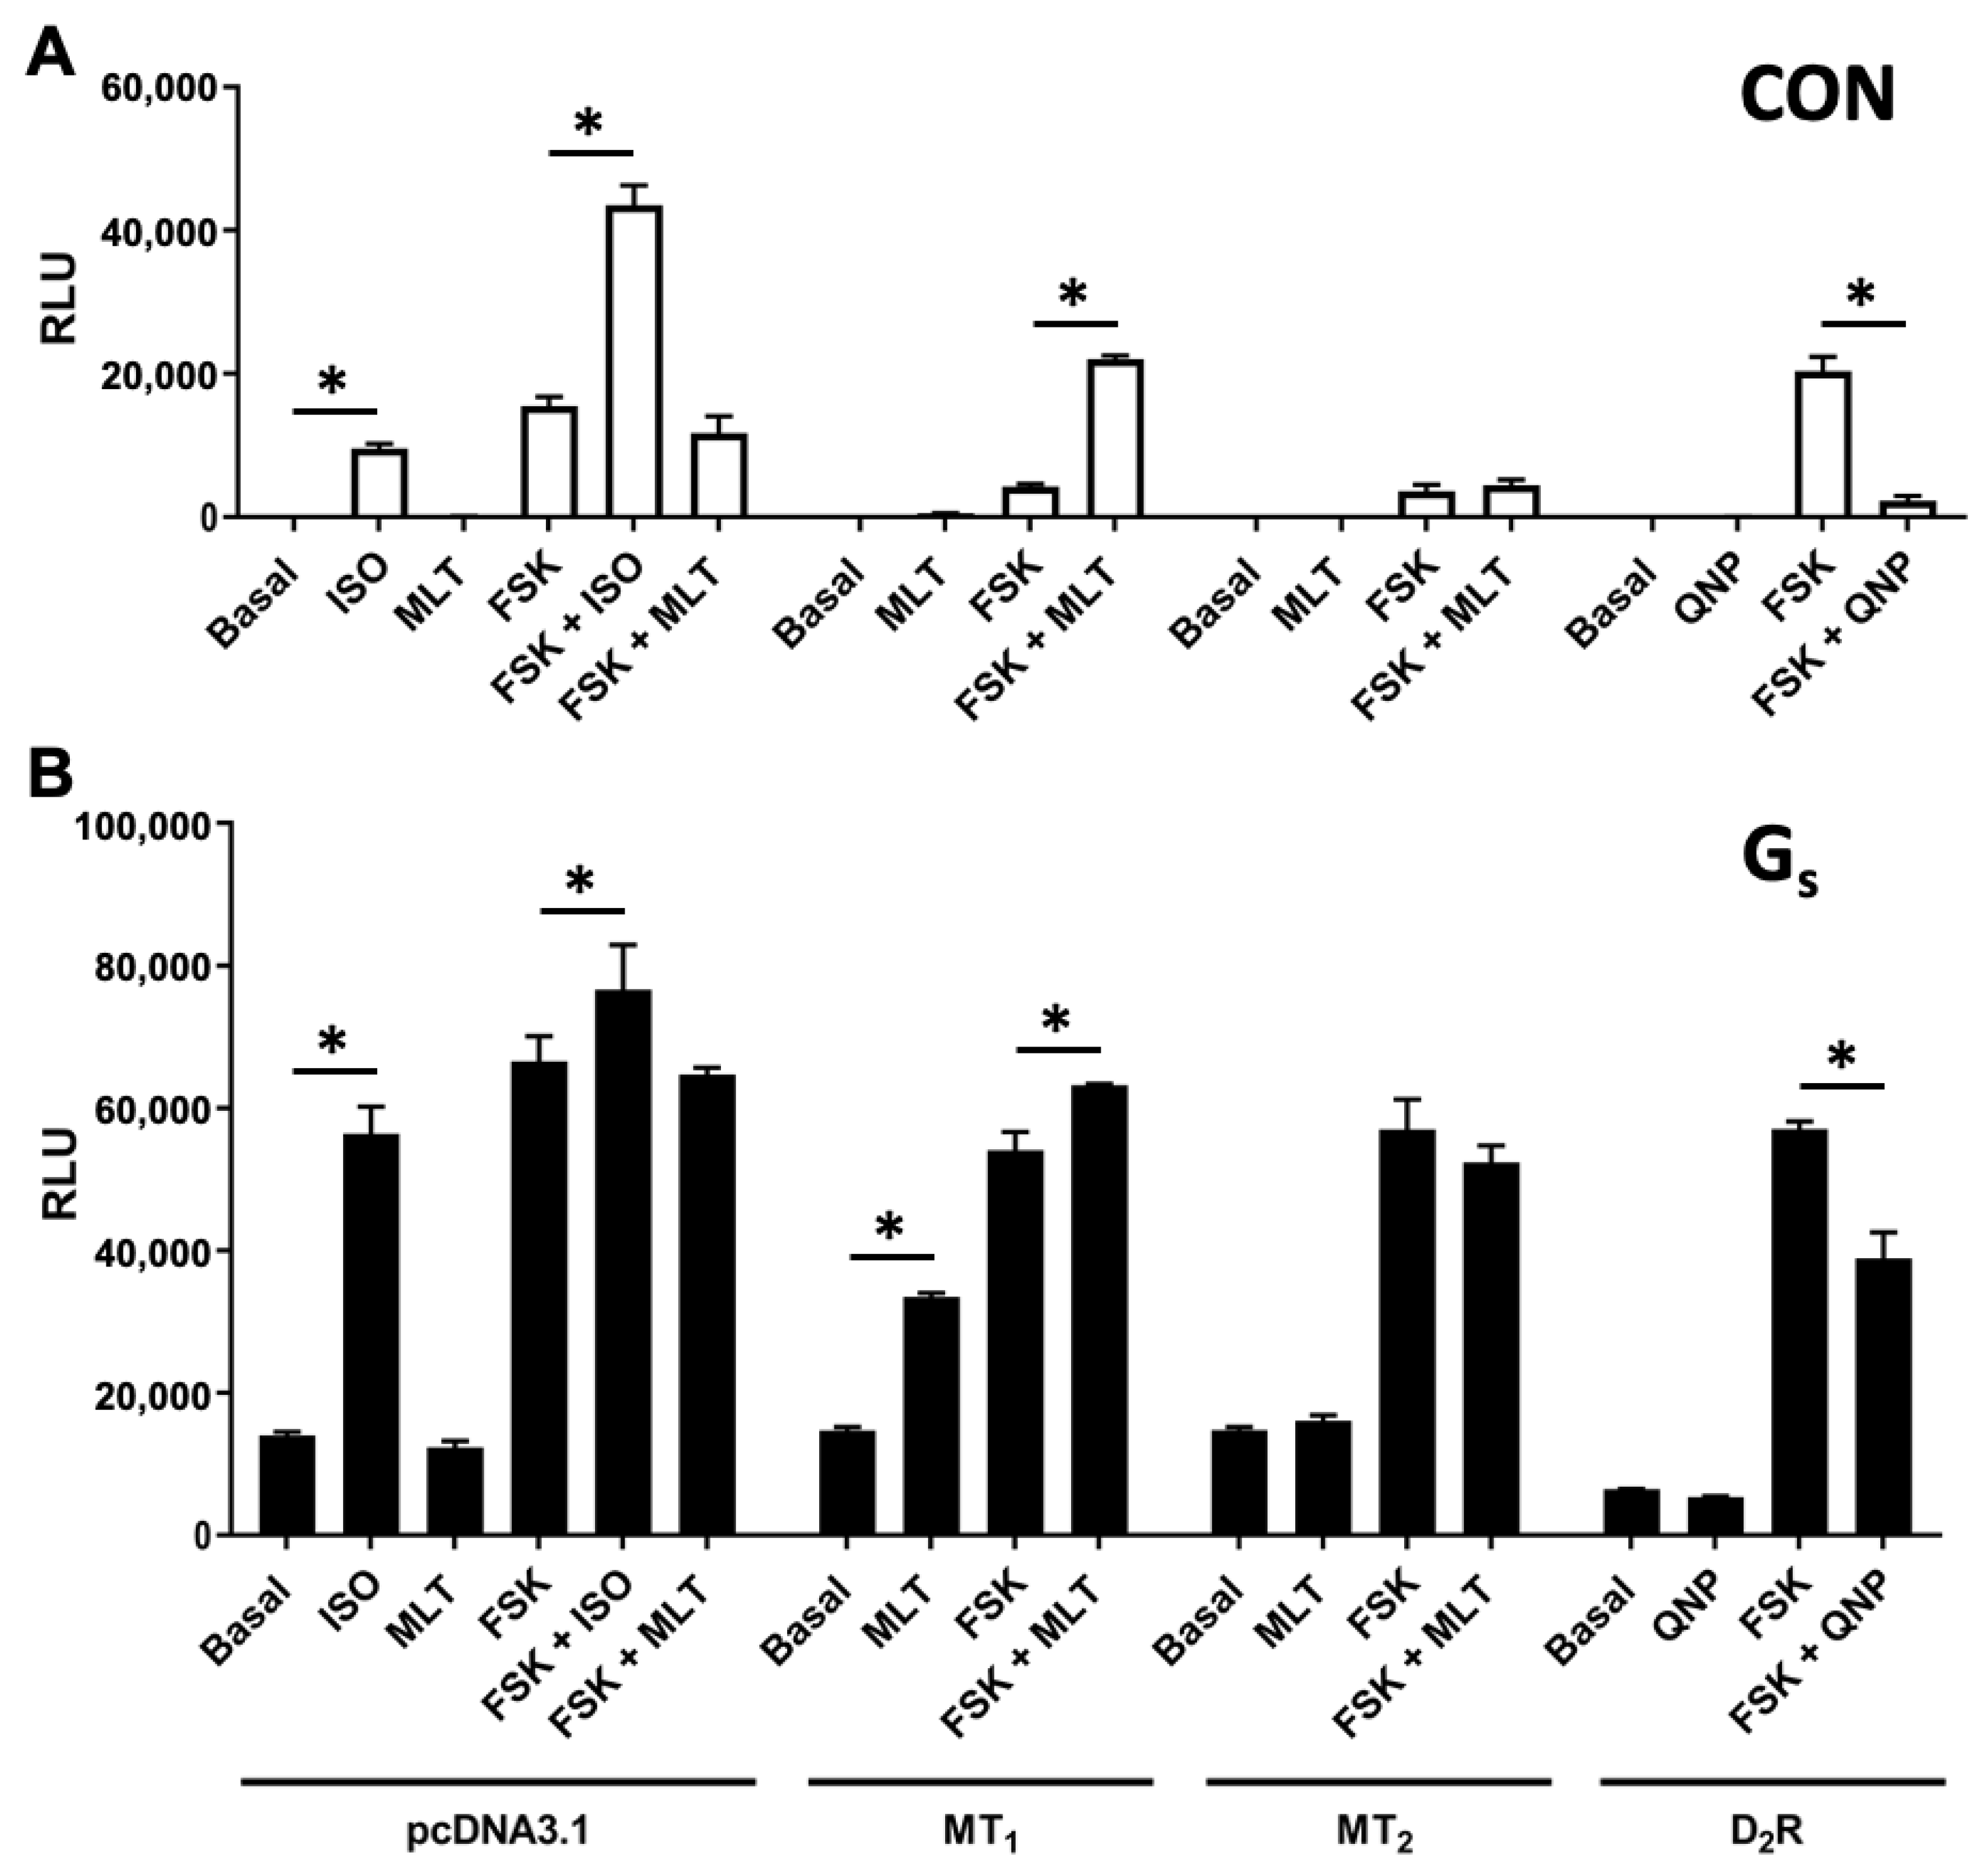
2.4. MT1 Stimulates cAMP Production through Gαs Protein

Gs protein has been reported to potentiate the response of AC (isoforms type II, V, and VI) toward forskolin [40]. As illustrated in Figure 5A, the activation of endogenous Gs-coupled β2AR indeed resulted in the potentiation of the forskolin response in HEK293 cells. Likewise, the ability of melatonin to significantly enhance forskolin-induced cAMP production in MT1 transfectants (Figure 1A, right panel; Figure 3B, upper left panel) could also be mediated through Gs. However, unlike the activation of β2AR by isoproterenol, melatonin alone did not stimulate cAMP formation in MT1 transfectants (Figure 5A). This might be attributed to a stronger coupling of the MT1 receptor to Gi than to Gs proteins, resulting in constitutive Gi activity and a lower forskolin response, as observed in Figure 3A. If so, the increased expression of Gs may shift the coupling specificity of MT1 away from Gi and enable melatonin to stimulate cAMP production in the absence of forskolin. The overexpression of Gαs sensitized the forskolin-induced cAMP production (Figure 5A,B) and resulted in an apparent impairment of the ability of isoproterenol to further enhance the forskolin response. Similar results were obtained with MT1. The simultaneous addition of melatonin significantly enhanced the forskolin-induced cAMP response in the MT1/Gαs transfectants (Figure 5B), albeit to a lesser extent as compared to the MT1 transfection alone (Figure 5A). More importantly, melatonin alone significantly stimulated cAMP formation in MT1/Gαs transfectants (Figure 5B). The co-expression of Gαs with MT2 or D2R, however, did not enable the corresponding agonists to trigger cAMP production (Figure 5B), thereby demonstrating a unique Gs-coupling property of the MT1 receptor.

2.5. Molecular Modeling Predicts a Viable MT1-Gs Complex

Given the prior demonstration of the dual coupling of the β2AR to both Gs and Gi proteins [26,41] and numerous hints of MT1 being capable of stimulating cAMP production [17,18,19,20], it seems plausible that MT1 can interact with Gs. We used computational tools to generate a MT1-Gs structure and compared the stability of this complex against the resolved structure of MT1-Gi [PDB code 7VGZ; [42]]. An MT1-Gs complex was constructed using Modeller10.4 and the top 10 models out of 1,000 ensembles generated via LD (see Section 4) were evaluated at their receptor-G protein interface. The top model for MT1-Gs is illustrated in Figure 6A; it closely resembles the overall topological configuration of MT1-Gi (also shown in Figure 6A). This similarity in the arrangement of G protein isoforms potentially explains the comparable energy functions observed. The MT1-Gs complex has a low dissociation constant, indicating high-affinity binding, and a free energy of binding that is comparable to that of the MT1-Gi complex (as depicted in Figure 6B). These findings provide further evidence supporting the potential feasibility of coupling Gs proteins to MT1. A viable MT1-Gs complex should exhibit a low dissociation constant for high-affinity binding and a favorable free energy of binding. The measured free energy of approximately −10 kcal/mol and a dissociation constant of 1 × 10⁻⁵ mM (Figure 6B) are consistent with these requirements. Additionally, the interface area of approximately 1000 A ° , as observed in the MT1-Gs complex, is comparable to that of the MT1-Gi complex (Figure 6B). These measurements provide additional support for the idea that MT1 can form signaling assemblies with both Gi and Gs proteins through dual coupling. The observed similarities in stability during the formation of these signaling assemblies indicate that MT1 can effectively interact with and activate both Gi and Gs proteins, contributing to the diversity and complexity of its signaling capabilities.
However, a significant difference was observed in the dissociation constant, with MT1-Gi displaying a value of 1 × 10⁻⁴ mM and MT1-Gs having a 10-fold higher affinity at 1 × 10⁻⁵ mM (Figure 6B). Although this suggests that the MT1-Gs complex is more stable than the MT1-Gi complex, the probability or preference of G protein coupling with MT1 cannot be solely concluded based on their dissociation constants, because other factors such as the relative abundance of individual protein would affect the equilibrium. Collectively, our predicted model demonstrates that following activation, the orientations and energy functions favor the coupling of Gs proteins in a manner that closely resembles the coupling of Gi proteins.

3. Discussion

The long-standing conundrum of the Gi-coupled melatonin receptors stimulating the formation of cAMP in specific cell types has raised an important question of whether such observations are due to the direct or indirect regulation of AC. The ability of melatonin receptors to activate Gq [9,43] provides an avenue for melatonin to stimulate specific isoforms of AC via PKC-mediated phosphorylation [23]. A more tantalizing explanation is that the melatonin receptors can dually couple to Gs and Gi to directly regulate AC in a manner similar to that of the well-established β2AR [41]. Direct and indirect activations of effectors can typically be discerned by their temporal characteristics. The direct stimulation of AC by Gs should be detectable immediately, while regulations through phosphorylation events would be delayed. Hence, we used the GloSensorTM system to examine the real-time cAMP responses driven by the melatonin receptors in HEK293 cells. Our data revealed an atypical cAMP regulation by the MT1 receptor. The results from both the functional and molecular modeling experiments support the notion that MT1 can interact productively with Gs to stimulate AC, and the magnitude of this response is amplified upon the sensitization/activation of AC by forskolin. Given the transient nature of Gs-induced AC activity (Figure 1B and Figure 2B), MT1/Gs-mediated cAMP formation might be masked in standard assays that require extended manipulations or incubations such as radioimmunoassays and reporter gene assays.
It has long been considered that both MT1 and MT2 receptors are primarily coupled to Gi proteins and inhibit the cAMP level [44]. Indeed, the current study observed a constitutive suppressive effect of MT1 and MT2 on the forskolin- and isoproterenol-induced cAMP production (Figure 3A). The application of melatonin significantly inhibited the isoproterenol-induced cAMP response in both MT1- and MT2-expressing cells, as one would expect for Gi-coupled receptors. These data support the canonical coupling of Gi protein to the MT1 and MT2 receptors. However, contradictory to what was observed for the isoproterenol-stimulated cAMP responses, the application of melatonin led to a prominent potentiation of forskolin-induced cAMP production in MT1-expressing cells whereas no effect was observed in the MT2-expressing cells. The contrasting actions of melatonin on forskolin- and isoproterenol-stimulated cAMP formation in the MT1-expressing cells imply the existence of an atypical and alternative signaling mechanism mediated by the MT1 receptor. The results from the Gs co-expression experiment suggest that MT1 indeed possesses the ability to directly activate Gs, since the increased availability of Gs allowed for the lucid detection of the MT1-mediated stimulation of AC (Figure 5), presumably by favoring Gs to compete against Gi in binding to MT1. Although such a response may be considered as “forced coupling”, neither MT2 nor D2R was capable of elevating cAMP levels in the Gαs transfectants (Figure 5). The favorable parameters of the predicted MT1-Gs complex generated by molecular modeling (Figure 6) suggest the possible existence of this complex alongside the known MT1-Gi structure [42]. The predicted affinity of MT1 for Gs is comparable to, if not higher than, that for Gi.
Our results from the real-time GloSensorTM cAMP assay and molecular modeling tend to corroborate with previous reports on the stimulatory effect of melatonin on cAMP production [17,18,19,20,21] and support the peculiar capacity of MT1 to signal through Gs [19,24]. In the same cell system, the activation of the prototypical Gi-coupled receptor, D2R, significantly suppressed the forskolin-induced cAMP synthesis. Though the Gβγ dimer from Gi proteins has been shown to contribute to the activation of several AC isoforms [38], our data from the PTX experiment excluded the involvement of Gi signaling in the MT1-mediated potentiation of cAMP stimulation by forskolin. Furthermore, the co-expression experiments indeed suggest a functional coupling of Gs to the MT1 receptor. Firstly, with the overexpression of Gs protein, melatonin could initiate a significant rise in the intracellular cAMP level through MT1 even in the absence of forskolin, whereas no detectable changes were observed for the MT2 or D2R transfectants. Paradoxically, as opposed to what was observed for the forskolin-induced response, the activation of MT1 significantly suppressed the isoproterenol-stimulated cAMP formation, which implicates the functional coupling of Gi protein to the receptor. Hence, the present study explicitly demonstrates the dual activation of Gs and Gi signaling pathways by the MT1 receptor in the HEK293 cell system. The various scenarios under which MT1 may stimulate or inhibit the activity of AC are depicted in Figure 7.
Dual coupling has been observed for multiple GPCRs, including the prototypical β2AR, which can signal through both Gs and Gi proteins [26,27]. Based on the contrasting actions of melatonin on forskolin- and isoproterenol-stimulated cAMP formation in the MT1-expressing cells, we proposed that MT1 can bi-directionally regulate AC by alternating its signaling pathways between Gs and Gi, which depends on the relative abundance of the G proteins in the cellular system (Figure 7). Hence, in the MT1 transfectants, the binding of melatonin activates MT1, resulting in the potentiation of a forskolin-stimulated cAMP response owing to its strong synergism with activated Gs proteins. It should be noted that the activation of the endogenous β2AR receptor by isoproterenol can markedly stimulate cAMP level in HEK293 cells, whereas cAMP stimulation through MT1 activation necessities the overexpression of Gs protein, which implies that the Gs coupling affinity is relatively weaker for the MT1 receptor. It is therefore not surprising that with the simultaneous addition of melatonin and isoproterenol, the β2AR outcompetes MT1 for the endogenous Gs protein. As a result, MT1 signaling switches to the Gi pathway due to its coupling to the spatially more abundant Gi protein. Therefore, unlike the forskolin-induced cAMP response, melatonin significantly inhibited isoproterenol-induced cAMP synthesis in the MT1-expressing cells. This proposed mechanism enables the MT1 receptor to signal through alternative G protein pathways in the same cellular context.
The differential signaling pathways mediated by the MT1 receptor under different stimulations (forskolin or β2AR receptor) could be observed in a specific cellular context. An illustrative example of cell context-dependent signaling is the Gi-mediated stimulation of type II adenylyl cyclase (ACII) through the βγ dimer. For biological systems with the expression of ACII, the activation of Gi-coupled receptors could lead to an upregulation in the intracellular cAMP level in the presence of activated Gs or PKC [23]. In addition, Gαs was shown to sensitize forskolin-induced cAMP production in a cell-context dependent manner [40,45]. With the recently resolved cryo-EM structures of adenylyl cyclase 9 (AC9) [46], the distinct sites for interaction with Gαs and forskolin on AC9 were identified. Gαs was shown to interact with the C2a catalytic domain of AC9, whereas forskolin was shown to bind to an allosteric site adjacent to the catalytic site. These data revealed the structural basis of the commonly known synergistic activation of AC by Gαs and forskolin. Similarly, the MT1 receptor/G protein coupling efficiency is highly cell context-dependent, which could be modulated by the relative abundance of the G proteins in the cellular system; Gs overexpression in the HEK293 cell system increased the proportion of MT1 receptor coupling to the Gs proteins, thereby leading to a lucid detection of an elevated cAMP level upon receptor activation. Therefore, MT1-mediated cAMP stimulation via coupling to Gs was observed only under certain circumstances, depending on the relative abundance of the G proteins. An illustrative example for the coupling of MT1 receptor to the Gs protein is the human prostate epithelial cells, which express high levels of MT1 and MT2 receptors as well as Gs protein [18]. As demonstrated in the study using human prostate cancer cell line 22Rv1 and human prostate epithelial cell line RWPE-1, the application of 2-iodomelatonin increased the intracellular level of cAMP, and this effect was blocked by the nonselective MT1/MT2 receptor antagonist luzindole but not the selective MT2 receptor antagonist, 4P-PDOT. In this study, the knockdown of Gs abrogated the stimulatory effect of 2-iodomelatonin on cAMP level, thereby demonstrating the stimulatory effect of endogenous MT1 signaling on cAMP level by coupling to the Gs protein. Hence, it would be rationale to postulate that for cells with high expression levels of both MT1 and Gs protein, the activation of MT1 may upregulate cAMP level through the activation of AC.
Interestingly, the present study also revealed a constitutive inhibitory effect of MT1 and MT2 on the cAMP level. Indeed, most GPCRs do exhibit some degree of basal activity. With regard to melatonin receptors, a previous study has suggested that the MT1 receptor is tightly pre-coupled to Gi and is spontaneously active [47]. The affinity of Gi toward MT1 was not altered in the presence of melatonin, and the GTPγS binding assay revealed a constitutive activity of Gi in the reconstituted membrane of MT1 and Gi1 [47]. In addition, MT2 has been reported to activate Gαi1 and Gαz proteins spontaneously based on BRET assays [48].
The difference between the present study and previous publications is possibly due to the alternative detection methods. Most of the published studies detected cAMP pathway through radioimmunoassays or radiometric assays [44,49,50], which require a prolonged drug incubation time (agonist and forskolin) [24] or the treatment of cells with agonist prior to the addition of forskolin [51]. The change in cAMP level was often determined as an accumulative result over time instead of reflecting the real-time level, which could be affected by downstream effectors through indirect/feedback mechanisms. Using the [3H]cAMP accumulation assay as an example, the cells labeled with [3H]adenine would be incubated with drugs for 30 min at 37 °C before the collection of the total labeled nucleotide fraction from the cell lysates, and the [3H]cAMP level would be determined using the ratio of the [3H]cAMP fraction over total nucleotide [24]. However, as detected through the real-time GloSensorTM cAMP assay, the activity of forskolin or isoproterenol on cAMP production started to diminish after 15 min or 5 min of drug treatment, respectively. Hence, the GloSensorTM cAMP assay would be a better means to reflect the real-time changes in cAMP levels in live intact cell systems.
In conclusion, the present study demonstrates the functional coupling of Gs protein to the melatonin MT1, but not the MT2 receptor. The stimulation of MT1 can lead to the dual activation of the Gs and Gi pathways in the HEK293 cells. This ability of MT1 to regulate AC bi-directionally may explain the seemingly contradictory effects of melatonin on intracellular cAMP levels observed in different cell types, since the net production of cAMP will depend on the relative abundance of Gs, Gi, MT1, and MT2 and on the efficiency of the respective receptor/G protein coupling. The further characterization of the signaling property of the MT1 receptor will be required to better elucidate its functional significance in various cellular systems. In addition, the GloSensorTM cAMP assay may be a better option for future studies on GPCR-mediated cAMP regulation as it enables the real-time determination of the highly dynamic intracellular cAMP level.

4. Materials and Methods

4.1. Materials

The cDNAs encoding MT1 and MT2 were kindly provided by Dr. Steven Reppert (Massachusetts General Hospital, Boston, MA, USA). The D2R (NM_000795) and Gαs (NM_000516) cDNA were purchased from the cDNA Resource Center (www.cdna.org; accessed on 25 January 2024).

4.2. Cell Culture and Transfection

Human Embryonic Kidney 293 cells (HEK293 cells; ATCC, CRL-1573) were cultured in Minimum Essential Medium (MEM; Gibco, Thermo Fisher Scientific, Waltham, MA, USA) supplemented with 10% (v/v) heat-inactivated fetal bovine serum (Gibco), 100 µg/mL streptomycin and 100 units/mL penicillin, and grown in a humidified 37 °C, 5% CO2 incubator. The day before transfection, the cells were seeded onto 60 mm dishes at a density of 3.5 × 10⁵ cells/mL in 4 mL MEM and incubated at 37 °C with 5% CO2 overnight. Transient transfection was performed using Polyethylenimine 25 kDa linear (PEI) transfection reagent (Polysciences, Inc., Warrington, PA, USA) in a ratio of 1:4 (DNA in µg/PEI in µL). The empty vector pcDNA3.1 was used to balance the amount of DNA in each transfection.

4.3. GloSensor cAMP Assay

A GloSensor cAMP assay was performed according to the manufacturer’s protocol (Promega, Madison, WI, USA). Briefly, HEK293 cells were transiently transfected with the pGloSensor-22F cAMP plasmid and the desired receptor or G protein constructs in a 60 mm dish. After 24 h, transfected cells were re-plated onto a white 96-well cell culture plate and incubated at 37 °C with 5% CO2 overnight. The growth medium was then replaced with equilibration medium (HBSS with 10 mM HEPES, pH 7.4) containing the GloSensor cAMP Reagent. The cells were incubated with the GloSensor cAMP Reagent at room temperature for 20 min, and the luminescence was monitored to obtain a steady-state basal signal. To study the cAMP response in HEK293 cells expressing MT1 or MT2, transfected cells were treated with increasing concentrations of forskolin or isoproterenol in the absence or presence of 100 nM melatonin. To study the receptor-mediated cAMP response in HEK293 cells expressing MT1, MT2, or D2R, 10 µM forskolin or 1 μM isoproterenol along with varying concentrations of melatonin or quinpirole were added to the cells. The effect of PTX on cAMP regulation by GPCRs was examined in transfected cells pretreated overnight with vehicle or PTX (100 ng/mL) prior to 10 μM forskolin stimulation in the absence or presence of 100 nM melatonin or quinpirole. Luminescence was measured using the SpectraMax L microplate reader (Molecular Devices, LLC., San Jose, CA, USA). The GraphPad Prism 9 software was used for graph plotting, and concentration-response curves were generated using one-site competition non-linear regression.

4.4. Loop Modeling and the Generation of Initial Structures

The structure of the intracellular loop 3 (IL3) in GPCRs is often unresolved in crystal structures due to its inherent flexibility, despite its crucial role in G protein coupling [52]. To overcome this challenge, we used Modeller10.4 to reconstruct the complete active MT1 receptor [PDB code 7VGZ; [42]] and generated a specific active conformation for IL3 in the MT1 receptor. The missing IL3 segment was identified using EMBOSS Needle, a pairwise alignment tool that compares a protein sequence from the PDB structure with that in the FASTA file [53]. The final model of the refined loop was selected based on the DOPE scoring function and subsequently validated using PROCHECK (https://www.ebi.ac.uk/thornton-srv/software/PROCHECK/; accessed on 25 January 2024) [54,55]. To establish reasonable starting conformations of the MT1-Gs complex, the generated MT1 receptor structure and the Gs protein [PDB code 8DCS; [56]] were superimposed onto the crystal structures of the active MT1-Gi complex [PDB code 7VGZ; [42]] and the active β1-adrenergic receptor [PDB code 8DCS; [56]]. These reference templates were chosen because they share a similar orientation and conformation during G protein coupling. It is important to note that since no crystallized structure of the MT1-Gs complex is currently available, and different orientations may be required for receptor-G protein interactions, we cannot disregard the possibility of various modes of interactions. Hence, two different reference template structures were employed to impose the MT1-Gs complex. These positions were chosen to ensure compatibility with the binding pockets of the receptor and G protein [57,58].

4.5. Determining Receptor-G Protein Interface via Local Docking

Due to limited knowledge and the dynamic nature of interactions between the receptor and G protein complex [59], Rosetta Local Dock (LD) was employed to explore potential modes of Gs protein coupling with MT1. We focused on investigating the interface between MT1 and the heterotrimeric Gs by identifying and comparing probable regions of interaction. The superimposed MT1-Gs complex was then prepared for LD by removing extraneous information, such as water molecules that are not recognized by the Rosetta program. LD was performed by repacking the side chains, optimizing the initial structure of the predicted model, and generating 1000 ensembles. Default docking parameters, such as a docking partner distance of 3 A ° and rotation of 8°, were employed [57]. To prevent unintended perturbations between multi-chain proteins, the α-subunit and βγ-dimer of the Gs protein were restricted by optimizing them together during the entire docking process [58]. These ensembles were sorted based on their lowest interface scores and total Rosetta scores, and the top 10 models were selected for further analysis.

4.6. Scoring and Analysis of the Predicted Complex Models

The top 10 predicted models selected based on their lowest Rosetta interface scores [60] were submitted to the PRODIGY web server (bianca.science.uu.nl/prodigy/; accessed on 25 January 2024) for further analysis. The PRODIGY web server was used to evaluate the dissociation constant at 37 °C and the free energy of binding [61]. The interface areas between the MT1 and Gs proteins were measured using UCSF Chimera in the default mode [62]. For the visualization of the entire assemblies, the PyMOL molecular Graphics System 2.1 (Schrödiner, LLC., New York, NY, USA) was employed.

Author Contributions

Data curation, L.H.T., S.T.C. and S.L.; formal analysis, L.H.T., S.T.C. and S.L.; investigation, L.H.T., S.T.C. and S.L.; project administration, Y.H.W.; supervision, Y.H.W.; writing—original draft, L.H.T., S.T.C. and S.L.; writing—review and editing, Y.H.W. All authors have read and agreed to the published version of the manuscript.

Funding

This work was supported in part by grants from the University Grants Committee of Hong Kong (AoE/M-604/16), Research Grants Council, Hong Kong (16103015 and T13-605/18-W), the National Key Basic Research Program of China (2013CB530900), Innovation and Technology Commission of Hong Kong (ITCPD/17-9), and Hong Kong Jockey Club.

Institutional Review Board Statement

Not applicable.

Informed Consent Statement

Not applicable.

Data Availability Statement

The data presented in this study are available on reasonable request from the corresponding author.

Conflicts of Interest

The authors declare no conflicts of interest.

Abbreviations

AC, adenylyl cyclase; β2ARs, β2-adrenergic receptors; ERK, extracellular signal-regulated kinase; FSK, forskolin; GPCRs, G protein-coupled receptors; ISO, isoproterenol; JNK, c-Jun N-terminal kinase; MLT, melatonin; MT1 and MT2, melatonin type-1 and type-2 receptors; PTX, pertussis toxin; PKC, protein kinase C; QNP, quinpirole

References

  1. Reppert, S.M.; Weaver, D.R.; Ebisawa, T. Cloning and characterization of a mammalian melatonin receptor that mediates reproductive and circadian responses. Neuron 1994, 13, 1177–1185. [Google Scholar] [CrossRef] [PubMed]
  2. Reppert, S.M.; Godson, C.; Mahle, C.D.; Weaver, D.R.; Slaugenhaupt, S.A.; Gusella, J.F. Molecular characterization of a second melatonin receptor expressed in human retina and brain: The Mel1b melatonin receptor. Proc. Natl. Acad. Sci. USA 1995, 92, 8734–8738. [Google Scholar] [CrossRef] [PubMed]
  3. Jockers, R.; Delagrange, P.; Dubocovich, M.L.; Markus, R.P.; Renault, N.; Tosini, G.; Cecon, E.; Zlotos, D.P. Update on melatonin receptors: IUPHAR Review 20. Br. J. Pharmacol. 2016, 173, 2702–2725. [Google Scholar] [CrossRef] [PubMed]
  4. Liu, J.; Clough, S.J.; Hutchinson, A.J.; Adamah-Biassi, E.B.; Popovska-Gorevski, M.; Dubocovich, M.L. MT1 and MT2 melatonin receptors: A therapeutic perspective. Annu. Rev. Pharmacol. Toxicol. 2016, 56, 361–383. [Google Scholar] [CrossRef] [PubMed]
  5. Savaskan, E.; Ayoub, M.A.; Ravid, R.; Angeloni, D.; Fraschini, F.; Meier, F.; Eckert, A.; Müller-Spahn, F.; Jockers, R. Reduced hippocampal MT2 melatonin receptor expression in Alzheimer’s disease. J. Pineal Res. 2005, 38, 10–16. [Google Scholar] [CrossRef] [PubMed]
  6. Roy, J.; Wong, K.Y.; Aquili, L.; Uddin, M.S.; Heng, B.C.; Tipoe, G.L.; Wong, K.H.; Fung, M.L.; Lim, L.W. Role of melatonin in Alzheimer’s disease: From preclinical studies to novel melatonin-based therapies. Front. Neuroendocrinol. 2022, 65, 100986. [Google Scholar] [CrossRef] [PubMed]
  7. Hickie, I.B.; Rogers, N.L. Novel melatonin-based therapies: Potential advances in the treatment of major depression. Lancet 2011, 378, 621–631. [Google Scholar] [CrossRef]
  8. Bonnefond, A.; Clément, N.; Fawcett, K.; Yengo, L.; Vaillant, E.; Guillaume, J.-L.; Dechaume, A.; Payne, F.; Roussel, R.; Czernichow, S.; et al. Rare MTNR1B variants impairing melatonin receptor 1B function contribute to type 2 diabetes. Nat. Genet. 2012, 44, 297. [Google Scholar] [CrossRef]
  9. Browning, C.; Beresford, I.; Fraser, N.; Giles, H. Pharmacological characterization of human recombinant melatonin mt1 and MT2 receptors. Br. J. Pharmacol. 2000, 129, 877–886. [Google Scholar] [CrossRef]
  10. Li, L.; Xu, J.N.; Wong, Y.H.; Wong, J.T.Y.; Pang, S.F.; Shiu, S.Y.W. Molecular and cellular analyses of melatonin receptor-mediated cAMP signaling in rat corpus epididymis. J. Pineal Res. 1998, 25, 219–228. [Google Scholar] [CrossRef]
  11. Brydon, L.; Petit, L.; Delagrange, P.; Strosberg, A.D.; Jockers, R. Functional expression of MT2 (Mel1b) melatonin receptors in human PAZ6 adipocytes. Endocrinology 2001, 142, 4264–4271. [Google Scholar] [CrossRef]
  12. Kiefer, T.; Ram, P.T.; Yuan, L.; Hill, S.M. Melatonin inhibits estrogen receptor transactivation and cAMP levels in breast cancer cells. Breast Cancer Res. Treat. 2002, 71, 37–45. [Google Scholar] [CrossRef]
  13. Picinato, M.C.; Hirata, A.E.; Cipolla-Neto, J.; Curi, R.; Carvalho, C.R.O.; Anhê, G.F.; Carpinelli, A.R. Activation of insulin and IGF-1 signaling pathways by melatonin through MT1 receptor in isolated rat pancreatic islets. J. Pineal Res. 2008, 44, 88–94. [Google Scholar] [CrossRef]
  14. Carbajo-Pescador, S.; García-Palomo, A.; Martín-Renedo, J.; Piva, M.; González-Gallego, J.; Mauriz, J.L. Melatonin modulation of intracellular signaling pathways in hepatocarcinoma HepG2 cell line: Role of the MT1 receptor. J. Pineal Res. 2011, 51, 463–471. [Google Scholar] [CrossRef]
  15. Travnickova-Bendova, Z.; Cermakian, N.; Reppert, S.M.; Sassone-Corsi, P. Bimodal regulation of mPeriod promoters by CREB-dependent signaling and CLOCK/BMAL1 activity. Proc. Natl. Acad. Sci. USA 2002, 99, 7728–7733. [Google Scholar] [CrossRef]
  16. Peschke, E.; Bach, A.G.; Mühlbauer, E. Parallel signaling pathways of melatonin in the pancreatic β-cell. J. Pineal Res. 2006, 40, 184–191. [Google Scholar] [CrossRef] [PubMed]
  17. Schuster, C.; Williams, L.M.; Morris, A.; Morgan, P.J.; Barrett, P. The human MT1 melatonin receptor stimulates cAMP production in the human neuroblastoma cell line SH-SY5Y cells via a calcium-calmodulin signal transduction Pathway. J. Neuroendocrinol. 2005, 17, 170–178. [Google Scholar] [CrossRef] [PubMed]
  18. Shiu, S.Y.W.; Pang, B.; Tam, C.W.; Yao, K.-M. Signal transduction of receptor-mediated antiproliferative action of melatonin on human prostate epithelial cells involves dual activation of Gαs and Gαq proteins. J. Pineal Res. 2010, 49, 301–311. [Google Scholar] [CrossRef] [PubMed]
  19. Chen, L.; He, X.; Zhang, Y.; Chen, X.; Lai, X.; Shao, J.; Shi, Y.; Zhou, N. Melatonin receptor type 1 signals to extracellular signal-regulated kinase 1 and 2 via Gi and Gs dually coupled pathways in HEK-293 cells. Biochemistry 2014, 53, 2827–2839. [Google Scholar] [CrossRef] [PubMed]
  20. Huete-Toral, F.; Crooke, A.; Martínez-Águila, A.; Pintor, J. Melatonin receptors trigger cAMP production and inhibit chloride movements in nonpigmented ciliary epithelial cells. J. Pharmacol. Exp. Ther. 2015, 352, 119–128. [Google Scholar] [CrossRef] [PubMed]
  21. Liu, X.; Wang, L.; Wang, Z.; Dong, Y.; Chen, Y.; Cao, J. Mel1b and Mel1c melatonin receptors mediate green light-induced secretion of growth hormone in chick adenohypophysis cells via the AC/PKA and ERK1/2 signalling pathways. J. Photochem. Photobiol. B Biol. 2021, 225, 112322. [Google Scholar] [CrossRef]
  22. MacKenzie, R.S.; Melan, M.A.; Passey, D.K.; Witt-Enderby, P.A. Dual coupling of MT1 and MT2 melatonin receptors to cyclic AMP and phosphoinositide signal transduction cascades and their regulation following melatonin exposure. Biochem. Pharmacol. 2002, 63, 587–595. [Google Scholar] [CrossRef]
  23. Tsu, R.C.; Wong, Y.H. Gi-mediated stimulation of type II adenylyl cyclase is augmented by Gq-coupled receptor activation and phorbol esters treatment. J. Neurosci. 1996, 16, 1317–1323. [Google Scholar] [CrossRef] [PubMed]
  24. Chan, A.S.L.; Lai, F.P.L.; Lo, R.K.H.; Voyno-Yasenetskaya, T.A.; Stanbridge, E.J.; Wong, Y.H. Melatonin mt1 and MT2 receptors stimulate c-Jun N-terminal kinase via pertussis toxin-sensitive and -insensitive G proteins. Cell. Signal. 2002, 14, 249–257. [Google Scholar] [CrossRef] [PubMed]
  25. Yung, L.Y.; Tsim, S.T.; Wong, Y.H. Stimulation of cAMP accumulation by the cloned Xenopus melatonin receptor through Gi and Gz proteins. FEBS Lett. 1995, 372, 99–102. [Google Scholar] [CrossRef] [PubMed]
  26. Asano, T.; Katada, T.; Gilman, A.G.; Ross, E.M. Activation of the inhibitory GTP-binding protein of adenylate cyclase, Gi, by β-adrenergic receptors in reconstituted phospholipid vesicles. J. Biol. Chem. 1984, 259, 9351–9354. [Google Scholar] [CrossRef] [PubMed]
  27. Daaka, Y.; Luttrell, L.M.; Lefkowitz, R.J. Switching of the coupling of the β2-adrenergic receptor to different G proteins by protein kinase A. Nature 1997, 390, 88–91. [Google Scholar] [CrossRef]
  28. Ciani, E.; Fontaine, R.; Maugars, G.; Mizrahi, N.; Mayer, I.; Levavi-Sivan, B.; Weltzien, F.A. Melatonin receptors in Atlantic salmon stimulate cAMP levels in heterologous cell lines and show season-dependent daily variations in pituitary expression levels. J. Pineal Res. 2019, 67, e12590. [Google Scholar] [CrossRef]
  29. Nelson, C.S.; Marino, J.L.; Allen, C.N. Melatonin receptor potentiation of cyclic AMP and the cystic fibrosis transmembrane conductance regulator ion channel. J. Pineal Res. 1999, 26, 113–121. [Google Scholar] [CrossRef]
  30. Dessauer, C.W.; Scully, T.T.; Gilman, A.G. Interactions of forskolin and ATP with the cytosolic domains of mammalian adenylyl cyclase. J. Biol. Chem. 1997, 272, 22272–22277. [Google Scholar] [CrossRef]
  31. Jin, J.-X.; Sun, J.-T.; Jiang, C.-Q.; Cui, H.-D.; Bian, Y.; Lee, S.; Zhang, L.; Lee, B.C.; Liu, Z.-H. Melatonin regulates lipid metabolism in porcine cumulus–oocyte complexes via the melatonin receptor 2. Antioxidants 2022, 11, 687. [Google Scholar] [CrossRef]
  32. Binkowski, B.F.; Butler, B.L.; Stecha, P.F.; Eggers, C.T.; Otto, P.; Zimmerman, K.; Vidugiris, G.; Wood, M.G.; Encell, L.P.; Fan, F.; et al. A luminescent biosensor with increased dynamic range for intracellular cAMP. ACS Chem. Biol. 2011, 6, 1193–1197. [Google Scholar] [CrossRef] [PubMed]
  33. DiRaddo, J.O.; Miller, E.J.; Hathaway, H.A.; Grajkowska, E.; Wroblewska, B.; Wolfe, B.B.; Liotta, D.C.; Wroblewski, J.T. A real-time method for measuring cAMP production modulated by Gαi/o-coupled metabotropic glutamate receptors. J. Pharmacol. Exp. Ther. 2014, 349, 373–382. [Google Scholar] [CrossRef] [PubMed]
  34. Goulding, J.; Maya, L.T.; Hill, S.J. Characterisation of endogenous A2A and A2B receptor-mediated cyclic AMP responses in HEK 293 cells using the GloSensorTM biosensor: Evidence for an allosteric mechanism of action for the A2B-selective antagonist PSB 603. Biochem. Pharmacol. 2018, 147, 55–66. [Google Scholar] [CrossRef]
  35. Insel, P.A.; Ostrom, R.S. Forskolin as a tool for examining adenylyl cyclase expression, regulation, and G protein signaling. Cell. Mol. Neurobiol. 2003, 23, 305–314. [Google Scholar] [CrossRef] [PubMed]
  36. Schmitt, J.M.; Stork, P.J.S. β2-adrenergic receptor activates extracellular signal-regulated kinases (ERKs) via the small G protein Rap1 and the serine/threonine kinase B-Raf. J. Biol. Chem. 2000, 275, 25342–25350. [Google Scholar] [CrossRef]
  37. Violin, J.D.; DiPilato, L.M.; Yildirim, N.; Elston, T.C.; Zhang, J.; Lefkowitz, R.J. β2-adrenergic receptor signaling and desensitization elucidated by quantitative modeling of real time cAMP dynamics. J. Biol. Chem. 2008, 283, 2949–2961. [Google Scholar] [CrossRef]
  38. Tang, W.J.; Gilman, A.G. Type-specific regulation of adenylyl cyclase by G protein beta gamma subunits. Science 1991, 254, 1500–1503. [Google Scholar] [CrossRef]
  39. Kurose, H.; Katada, T.; Amano, T.; Ui, M. Specific uncoupling by islet-activating protein, pertussis toxin, of negative signal transduction via alpha-adrenergic, cholinergic, and opiate receptors in neuroblastoma x glioma hybrid cells. J. Biol. Chem. 1983, 258, 4870–4875. [Google Scholar] [CrossRef]
  40. Sutkowski, E.M.; Tang, W.-J.; Broome, C.W.; Robbins, J.D.; Seamon, K.B. Regulation of forskolin interactions with type I, II, V, and VI adenylyl cyclases by Gs alpha. Biochemistry 1994, 33, 12852–12859. [Google Scholar] [CrossRef]
  41. Xiao, R.P. β-adrenergic signaling in the heart: Dual coupling of the β2- adrenergic receptor to Gs and Gi proteins. Sci. STKE 2001, 2001, re15. [Google Scholar] [CrossRef]
  42. Wang, Q.; Lu, Q.; Guo, Q.; Teng, M.; Gong, Q.; Li, X.; Du, Y.; Liu, Z.; Tao, Y. Structural basis of the ligand binding and signaling mechanism of melatonin receptors. Nat. Commun. 2022, 13, 454. [Google Scholar] [CrossRef] [PubMed]
  43. Guo, Q.; Wang, Z.; Dong, Y.; Cao, J.; Chen, Y. Physiological crosstalk between the AC/PKA and PLC/PKC pathways modulates melatonin-mediated, monochromatic-light-induced proliferation of T-lymphocytes in chickens. Cell Tissue Res. 2017, 369, 555–565. [Google Scholar] [CrossRef] [PubMed]
  44. Dubocovich, M.L.; Markowska, M. Functional MT1 and MT2 melatonin receptors in mammals. Endocrine 2005, 27, 101–110. [Google Scholar] [CrossRef] [PubMed]
  45. Alewijnse, A.E.; Smit, M.J.; Pena, M.S.R.; Verzijl, D.; Timmerman, H.; Leurs, R. Modulation of forskolin-mediated adenylyl cyclase activation by constitutively active Gs-coupled receptors. FEBS Lett. 1997, 419, 171–174. [Google Scholar] [CrossRef] [PubMed]
  46. Qi, C.; Lavriha, P.; Mehta, V.; Khanppnavar, B.; Mohammed, I.; Li, Y.; Lazaratos, M.; Schaefer, J.V.; Dreier, B.; Plückthun, A.; et al. Structural basis of adenylyl cyclase 9 activation. Nat. Commun. 2022, 13, 1045. [Google Scholar] [CrossRef] [PubMed]
  47. Roka, F.; Brydon, L.; Waldhoer, M.; Strosberg, A.D.; Freissmuth, M.; Jockers, R.; Nanoff, C. Tight association of the human Mel1a-melatonin receptor and Gi: Precoupling and constitutive activity. Mol. Pharmacol. 1999, 56, 1014–1024. [Google Scholar] [CrossRef]
  48. Karamitri, A.; Jockers, R. Melatonin in type 2 diabetes mellitus and obesity. Nat. Rev. Endocrinol. 2019, 15, 105–125. [Google Scholar] [CrossRef] [PubMed]
  49. Steiner, A.L.; Pagliara, A.S.; Chase, L.R.; Kipnis, D.M. Radioimmunoassay for cyclic nucleotides: II. adenosine 3′,5′-monophosphate and guanosine 3′,5′-monophosphate in mammalian tissues and body fluids. J. Biol. Chem. 1972, 247, 1114–1120. [Google Scholar] [CrossRef]
  50. Skomedal, T.; Grynne, B.; Osnes, J.B.; Sjetnan, A.E.; Øye, I. A radioimmunoassay for cyclic AMP (cAMP) obtained by acetylation of both unlabeled and labeled (3H-cAMP) ligand, or of unlabeled ligand only. Acta Pharmacol. Toxicol. 1980, 46, 200–204. [Google Scholar] [CrossRef]
  51. Witt-Enderby, P.A.; Dubocovich, M.L. Characterization and regulation of the human ML1A melatonin receptor stably expressed in Chinese hamster ovary cells. Mol. Pharmacol. 1996, 50, 166–174. [Google Scholar] [PubMed]
  52. Wang, J.; Miao, Y. Recent advances in computational studies of GPCR-G protein interactions. Adv. Protein Chem. Struct. Biol. 2019, 116, 397–419. [Google Scholar] [PubMed]
  53. Clark, J.J.; Benson, M.L.; Smith, R.D.; Carlson, H.A. Inherent versus induced protein flexibility: Comparisons within and between Apo and holo structures. PLoS Comput. Biol. 2019, 15, e1006705. [Google Scholar] [CrossRef] [PubMed]
  54. Laskowski, R.A.; MacArthur, M.W.; Moss, D.S.; Thornton, J.M. PROCHECK: A program to check the stereochemical quality of protein structures. J. Appl. Cryst. 1993, 26, 283–291. [Google Scholar] [CrossRef]
  55. Katiyar, A.; Lenka, S.K.; Lakshmi, K.; Chinnusamy, V.; Bansal, K.C. In silico characterization and homology modeling of thylakoid bound ascorbate peroxidase from a drought tolerant wheat cultivar. Genom. Proteom. Bioinform. 2009, 7, 185–193. [Google Scholar] [CrossRef] [PubMed]
  56. Su, M.; Paknejad, N.; Zhu, L.; Wang, J.; Do, H.N.; Miao, Y.; Liu, W.; Hite, R.K.; Huang, X.-Y. Structures of β1-adrenergic receptor in complex with Gs and ligands of different efficacies. Nat. Commun. 2022, 13, 4095. [Google Scholar] [CrossRef]
  57. Lyskov, S.; Gray, J.J. The Rosettadock server for local protein-protein docking. Nucleic Acids Res. 2008, 36, W233–W238. [Google Scholar] [CrossRef]
  58. Chaudhury, S.; Berrondo, M.; Weitzner, B.D.; Muthu, P.; Bergman, H.; Gray, J.J. Benchmarking and analysis of protein docking performance in Rosetta v3.2. PLoS ONE 2011, 6, e22477. [Google Scholar] [CrossRef]
  59. Dijkman, P.M.; Castell, O.K.; Goddard, A.D.; Munoz-Garcia, J.C.; de Graaf, C.; Wallace, M.I.; Watts, A. Dynamic tuneable G protein-coupled receptor monomer-dimer populations. Nat. Commun. 2018, 9, 1710. [Google Scholar] [CrossRef]
  60. Kaczor, A.A.; Guixà-González, R.; Carriõ, P.; Poso, A.; Dove, S.; Pastor, M.; Selent, J. Multi-component protein-protein docking based protocol with external scoring for modeling dimers of G protein-coupled receptors. Mol. Inform. 2015, 34, 246–255. [Google Scholar] [CrossRef]
  61. Xue, L.C.; Rodrigues, J.P.; Kastritis, P.L.; Bonvin, A.M.; Vangone, A. PRODIGY: A web server for predicting the binding affinity of protein-protein complexes. Bioinformatics 2016, 32, 3676–3678. [Google Scholar] [CrossRef] [PubMed]
  62. Goddard, T.D.; Huang, C.C.; Meng, E.C.; Pettersen, E.F.; Couch, G.S.; Morris, J.H.; Ferrin, T.E. UCSF Chimerax: Meeting modern challenges in visualization and analysis. Protein Sci. 2017, 27, 14–25. [Google Scholar] [CrossRef] [PubMed]
Figure 1. Kinetic profiles of the GloSensorTM cAMP assay detecting the cAMP response in HEK293 cells transfected with 0.5 μg MT1 and 0.5 μg biosensor pGloSensorTM-22F. Transfected cells were treated with increasing concentrations of (A) forskolin (FSK) or (B) isoproterenol (ISO) in the absence (left) or presence (right) of 100 nM melatonin (MLT). Representative graphs of three independent experiments performed in triplicate are shown. Data are expressed as a percentage of the peak luminescence obtained under the 10 μM FSK or 10 μM ISO condition and shown as mean ± SD of the triplicate determinations. (C) Luminescence measured at 12.5 min for FSK treatment (left) or 2.5 min for the ISO treatment (right) after the addition of compounds were plotted against the concentrations of the forskolin/isoproterenol used in the absence or presence of 100 nM melatonin. Representative graphs of three independent experiments performed in triplicate are shown, and the data represent the mean ± SD of the triplicate determinations. A statistical analysis was performed using a two-tailed t-test; * p < 0.01.
Ijms 25 02919 g001
Figure 2. Kinetic profiles of the GloSensorTM cAMP assay detecting cAMP response in HEK293 cells transfected with 0.5 μg MT2 and 0.5 μg biosensor pGloSensorTM-22F. (AC) MT2 transfectants were treated as described in Figure 1, and the results were analyzed in the same manner. Representative graphs of three independent experiments performed in triplicate are shown, and the data represent the mean ± SD of the triplicate determinations. A statistical analysis was performed using a two-tailed t-test; * p < 0.01.
Ijms 25 02919 g002
Figure 3. GloSensorTM cAMP assay detecting the cAMP regulation in HEK 293 cells. Cells were transiently transfected with pcDNA3.1 empty vector control, MT1 (0.5 μg), MT2 (0.5 μg), or D2R as a Gi-coupled receptor control (0.5 μg), together with the biosensor pGloSensorTM-22F (0.5 μg). (A) The cAMP levels measured at 15 min or 5 min for FSK (left) or ISO (right) treatment, respectively. (B) Effects of MLT or quinpirole (QNP) on FSK-(upper) or ISO-induced (lower) cAMP production in MT1 and MT2 (left), or D2R-transfected (right) HEK 293 cells. The data represent the mean ± SEM of the three independent experiments performed in triplicate. A statistical analysis was performed using ANOVA and Dunnett’s test; ns, not significant; * p < 0.01.
Ijms 25 02919 g003
Figure 4. Effect of PTX treatment on cAMP response in HEK293 cells expressing melatonin MT1, MT2, or dopamine D2 receptors. HEK293 cells were transfected with pcDNA3.1 empty vector, MT1 (0.5 μg), MT2 (0.5 μg), or D2R (0.5 μg), together with the biosensor pGloSensorTM-22F (0.5 μg). Transfected HEK293 cells were subjected to an overnight vehicle or PTX (100 ng/mL) treatment prior to 10 μM FSK stimulation in the absence or presence of (A) 100 nM MLT or (B) 100 nM QNP. Representative graphs of three independent experiments performed in triplicate are shown. cAMP responses at 15 min are normalized to the response with forskolin alone and shown as the mean ± SD of the triplicate determinations. A statistical analysis was performed using a two-tailed t-test; * p < 0.01.
Ijms 25 02919 g004
Figure 5. The cAMP regulation by GPCRs under different G protein systems. pcDNA3.1, MT1 (0.5 μg), MT2 (0.5 μg), and D2R (0.5 μg) were transiently transfected into HEK 293 cells together with pGloSensorTM-22F (0.5 μg), with or without the co-expression of Gs protein (0.5 μg). The cAMP regulation in HEK 293 cells (A) under an endogenous G protein system or (B) with the overexpression of Gs protein was detected using the GloSensorTM cAMP assay. Representative graphs of three independent experiments performed in triplicate are shown. The RLU reading of the assay was plotted after a 15 min treatment with a vehicle (basal), ISO (100 nM), MLT (100 nM), or QNP (100 nM) with or without FSK (10 μM) as indicated. Data are shown as the mean ± SD of the triplicate determinations. A statistical analysis was performed using ANOVA and Dunnett’s test; * p < 0.01.
Ijms 25 02919 g005
Figure 6. (A) Molecular models of the potential Gs protein (top) and Gi protein (bottom) coupling to the monomeric form of MT1. MT1 is depicted in pink; Gs protein subunits, in shades of orange; and Gi protein subunits, in shades of yellow. (B) Scoring parameters (interface area, dissociation constant, and free energy of binding) of the receptor-G protein interface. The values were obtained by averaging the scores of the top 10 predicted models for each receptor-G protein complex. actMT1Gs structures predicted using MT1Gi (PDB code 7VGZ) and β1AR-Gs (PDB code 8DCS) templates are labeled as actMT1Gs (7vgz) and actMT1Gs (8dcs), respectively. Mean ± SEM was determined. A two-tailed t-test was conducted for each complex; and significance levels are denoted as ** p < 0.05, **** p < 0.01.
Ijms 25 02919 g006
Figure 7. Schematic representation depicting the regulation of AC (blue) by the MT1 receptor (pink) under different conditions. In the basal state, MT1 is primarily coupled to Gi (purple) rather than to Gs (green). Forskolin (FSK) directly activates AC as indicated by a red halo. Although the activation of MT1 by melatonin (MLT; purple dot) tends to inhibit AC (black blunted arrow), the MT1/Gs signal (red line with arrow) synergizes with FSK to enhance AC activity (larger halo). The activation of the β2AR by isoproterenol (ISO; orange dot) also stimulates AC, which can be partially suppressed upon the activation of MT1. When the Gs expression is increased, the proportion of MT1 bound to Gs relative to Gi will increase, thereby allowing MLT to stimulate AC without the need of FSK.
Ijms 25 02919 g007
Disclaimer/Publisher’s Note: The statements, opinions and data contained in all publications are solely those of the individual author(s) and contributor(s) and not of MDPI and/or the editor(s). MDPI and/or the editor(s) disclaim responsibility for any injury to people or property resulting from any ideas, methods, instructions or products referred to in the content.

