
Developmental and Housekeeping Genes: Two Types of Genetic Organization in the Drosophila Genome


Abstract
1. Introduction
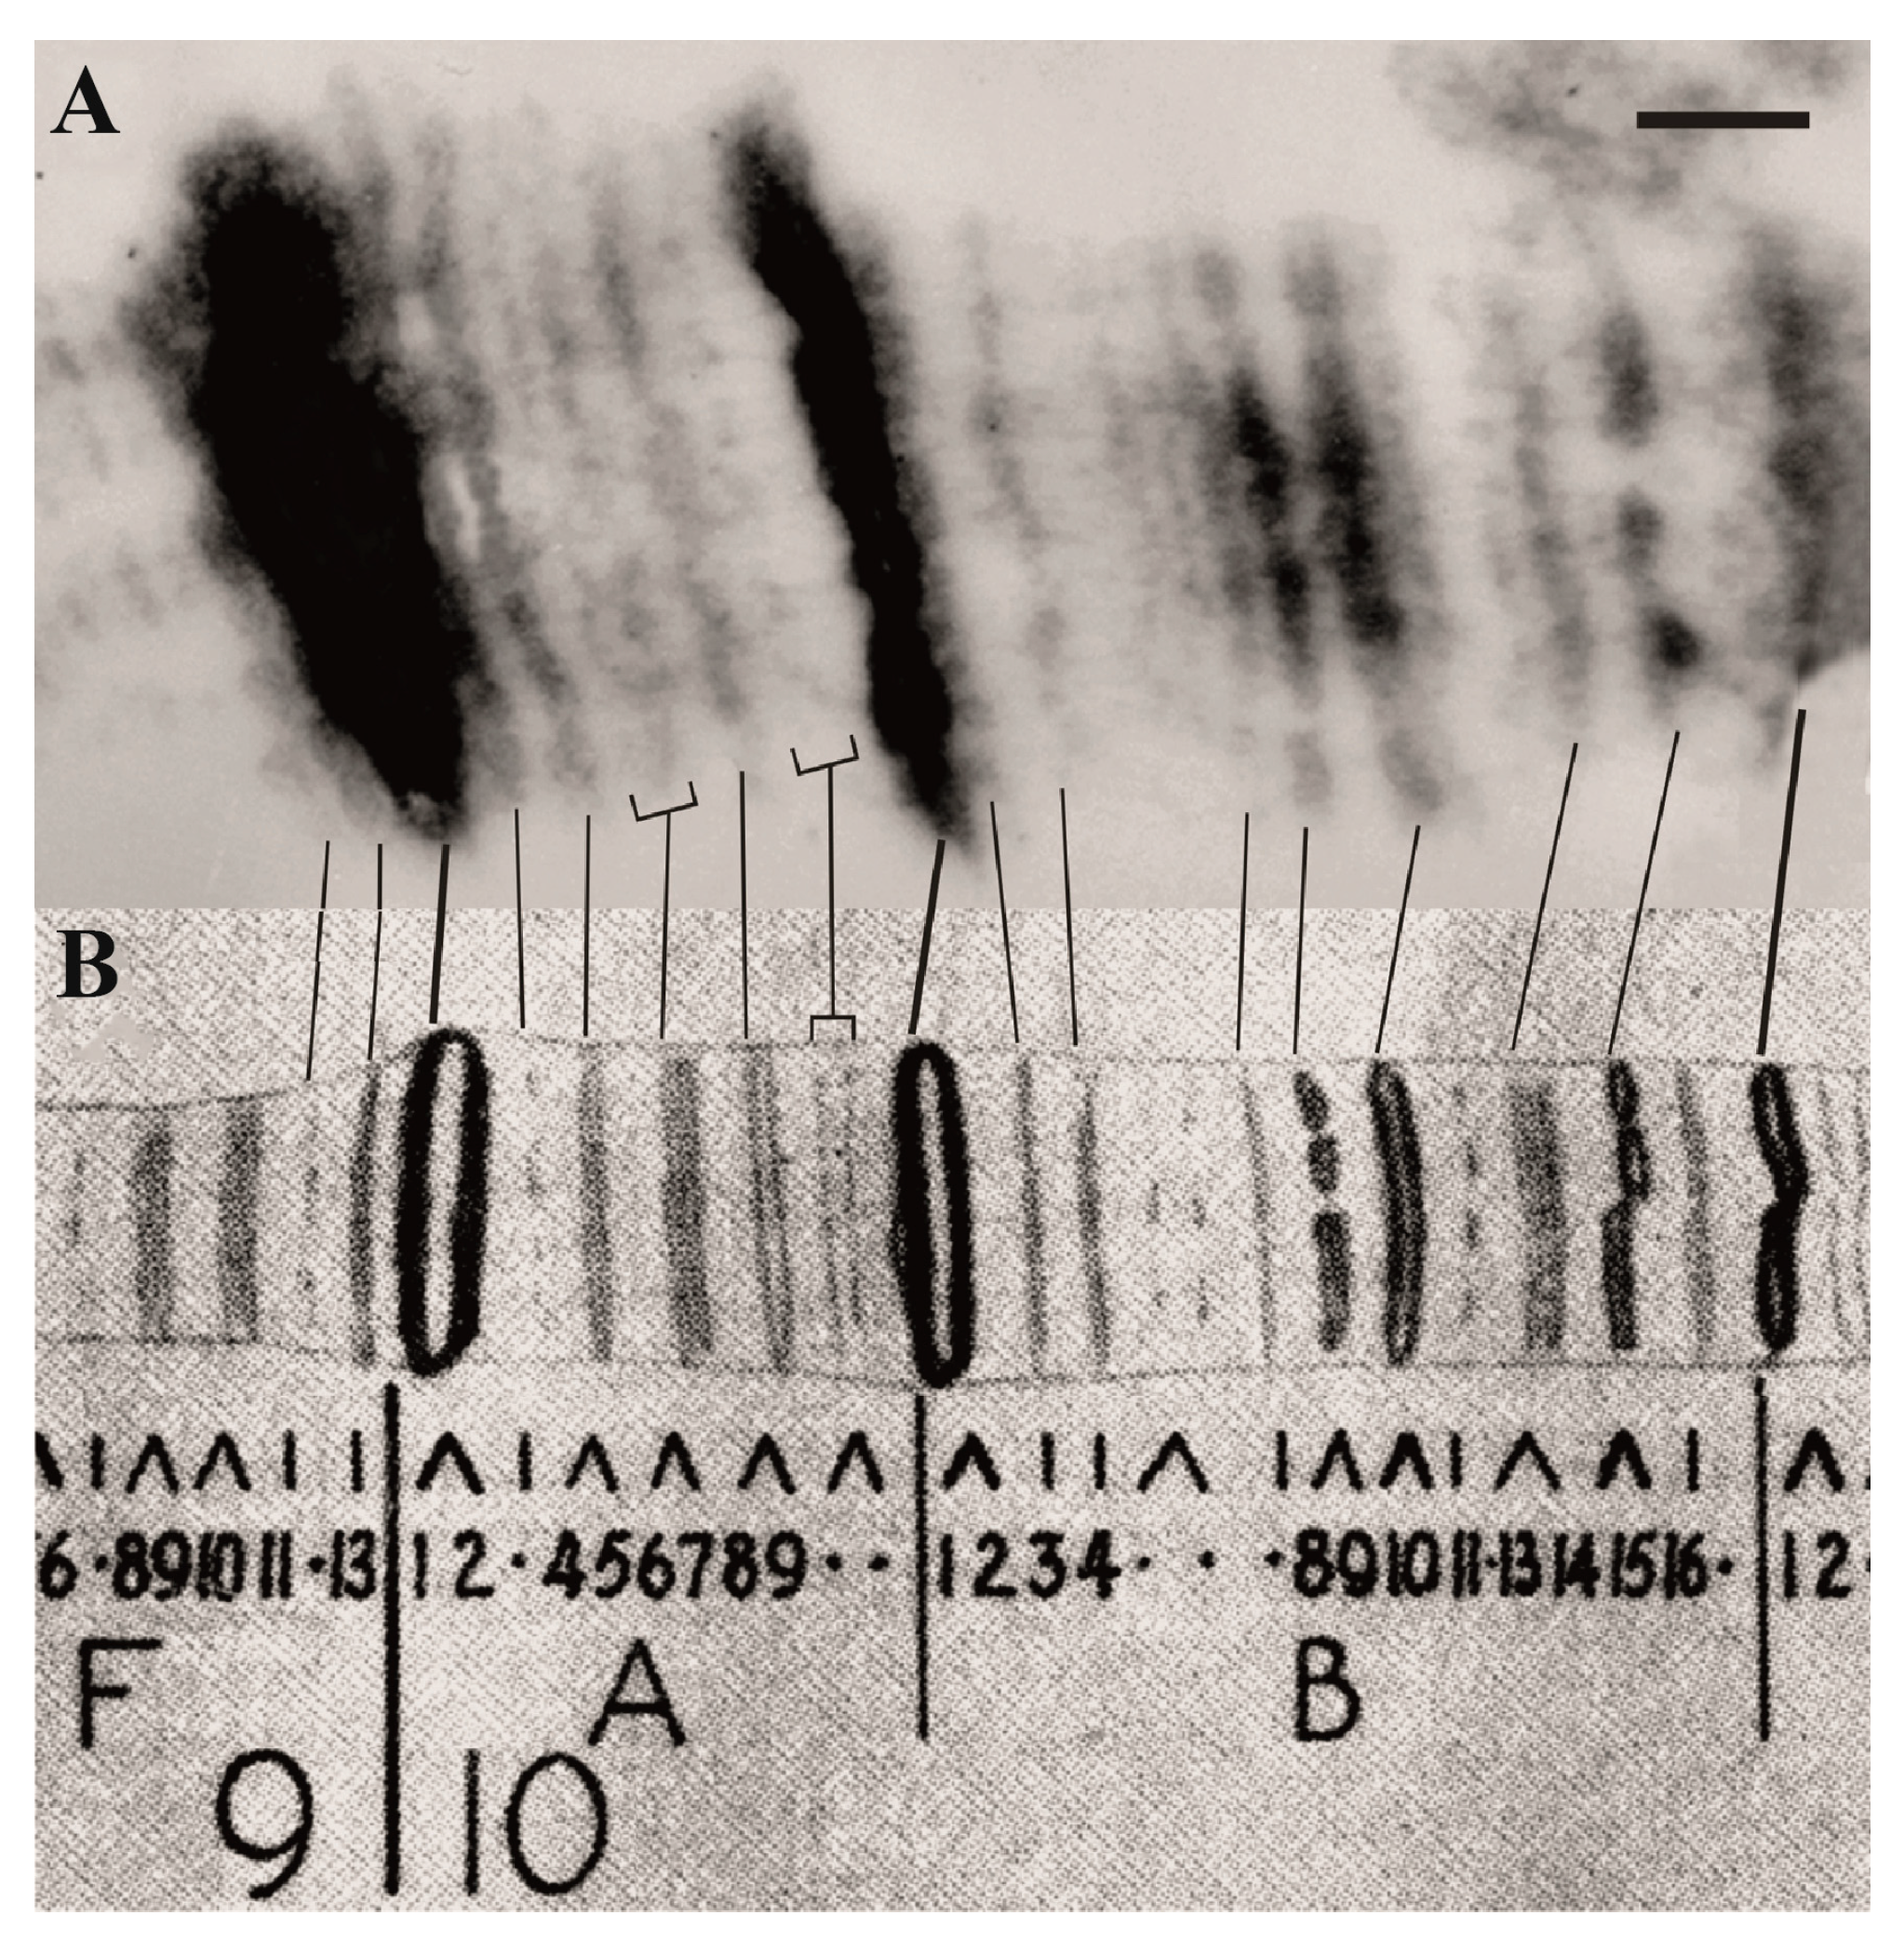
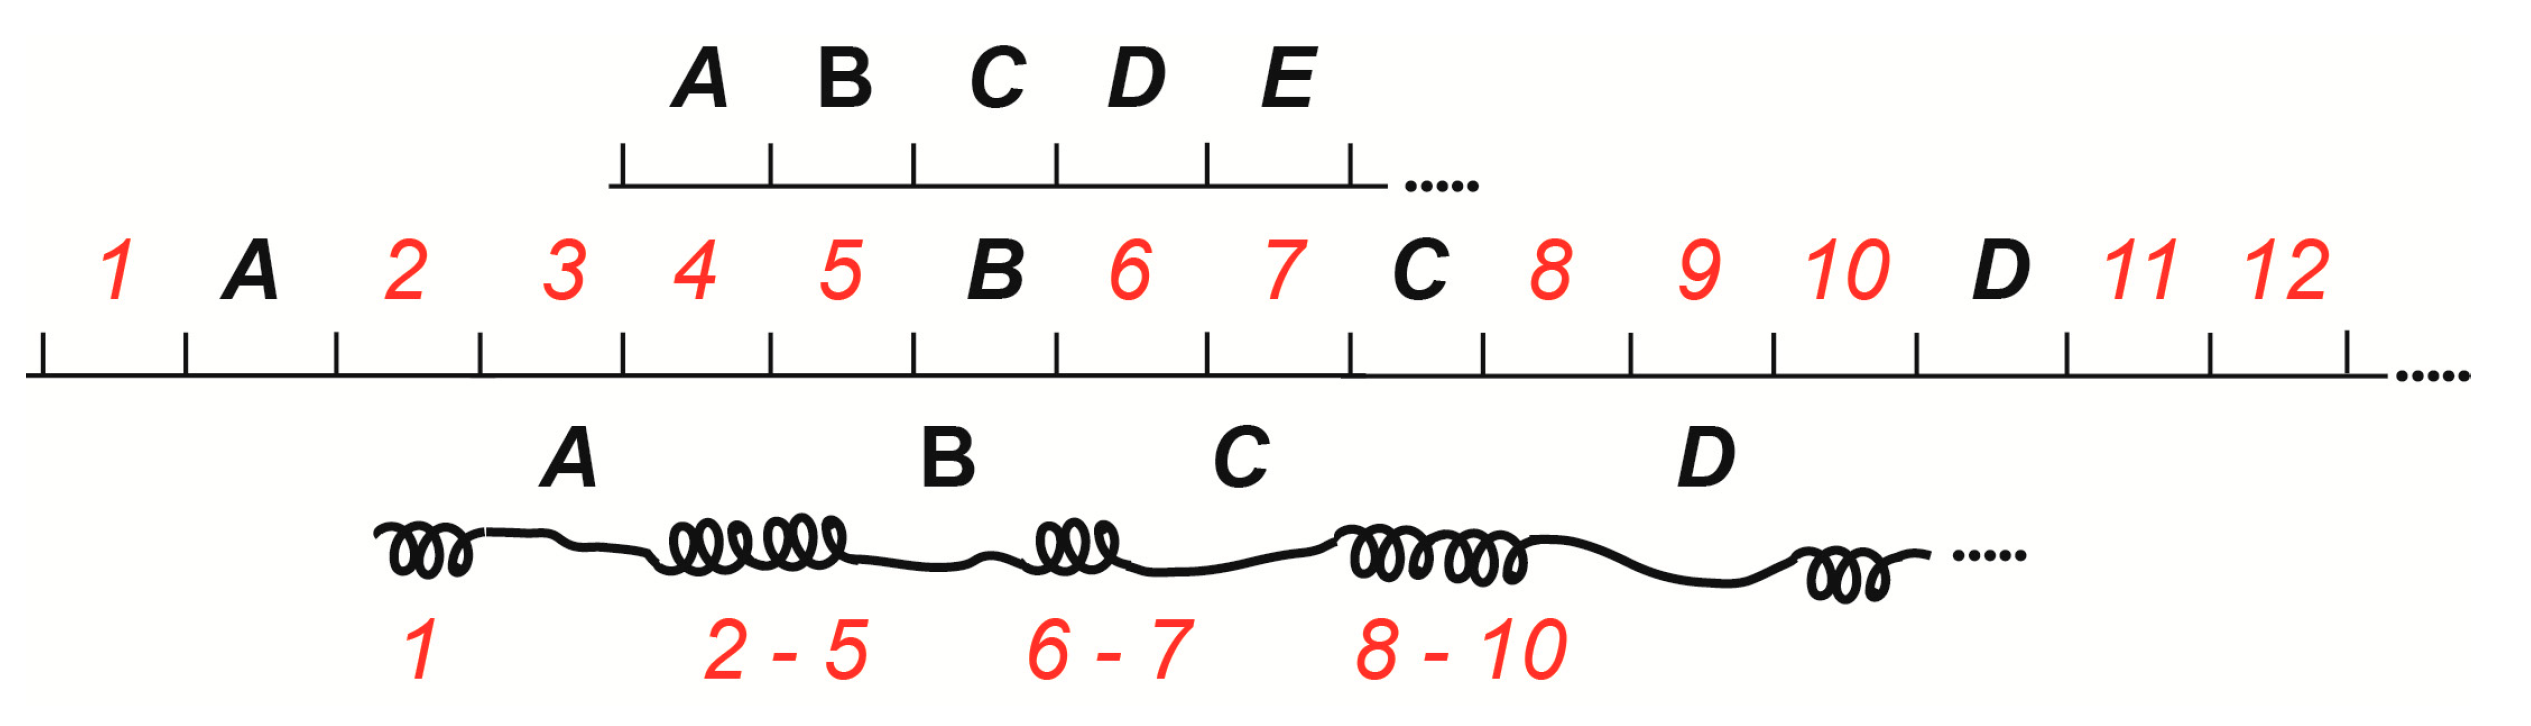
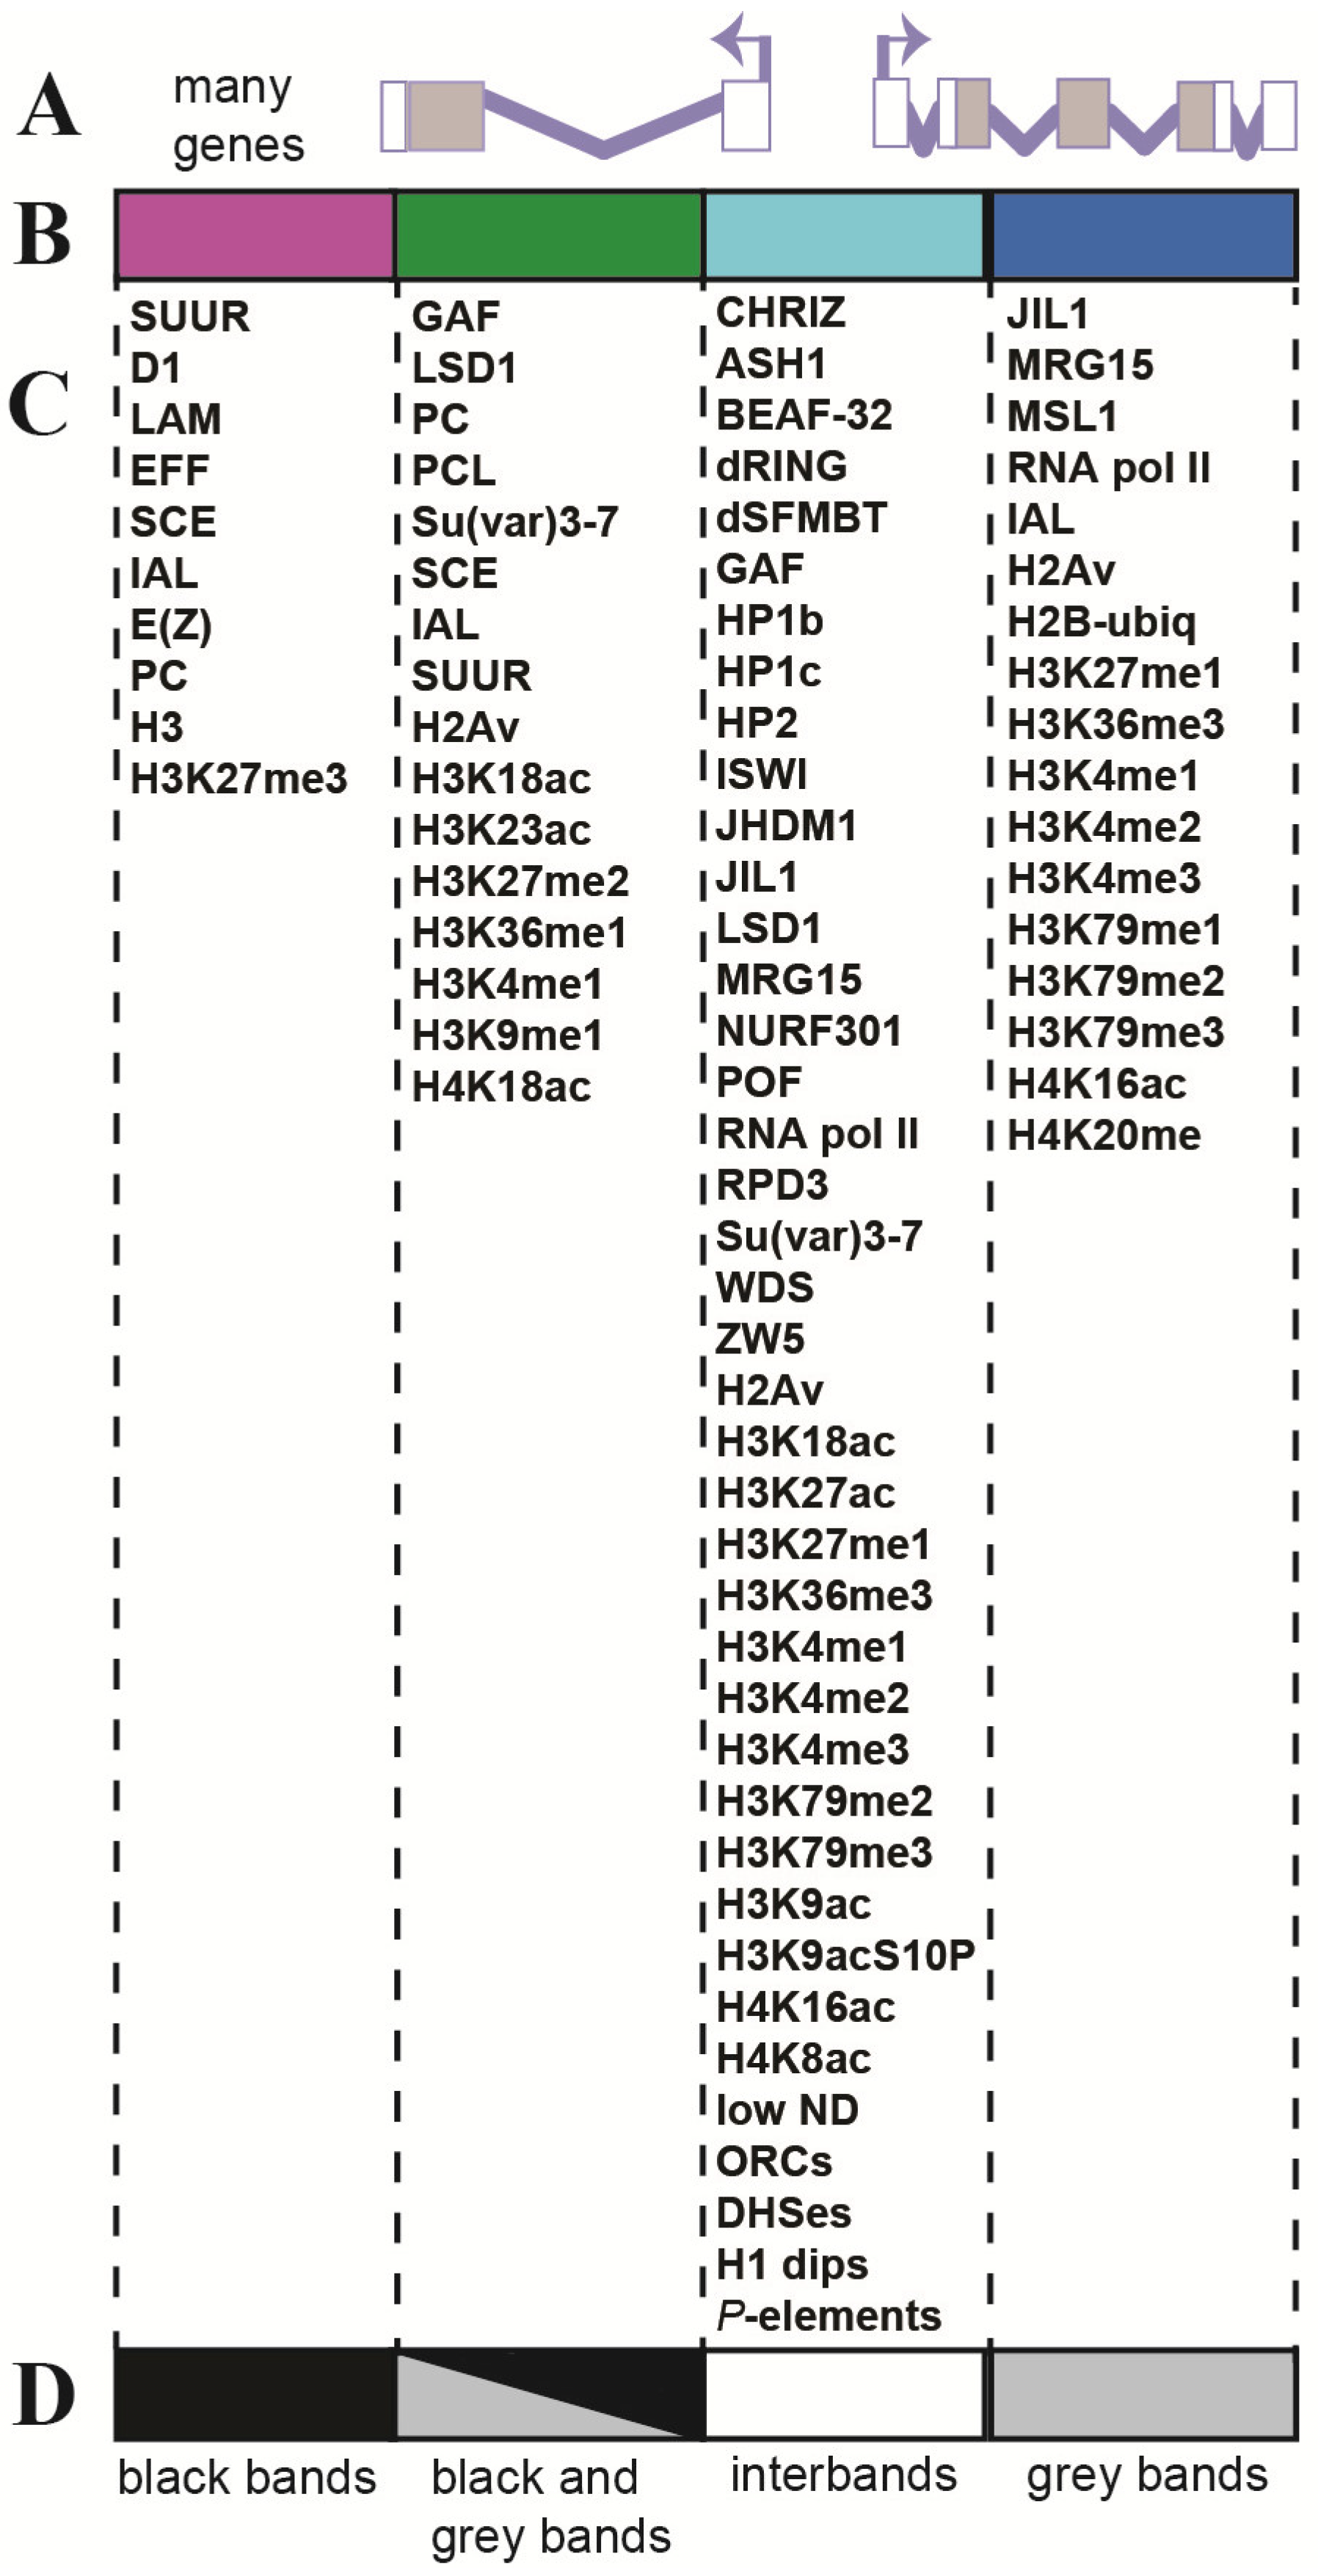
2. The 4HMM Model of Chromatin States in Chromosomes and Assignment of Genes to Chromosome Structures
3. Housekeeping and Developmental Genes
4. The Organization of Two Gene Types in the Drosophila Genome


| Genomic and Functional Properties | Type of Genes | References | |
|---|---|---|---|
| Housekeeping Genes | Developmental Genes | ||
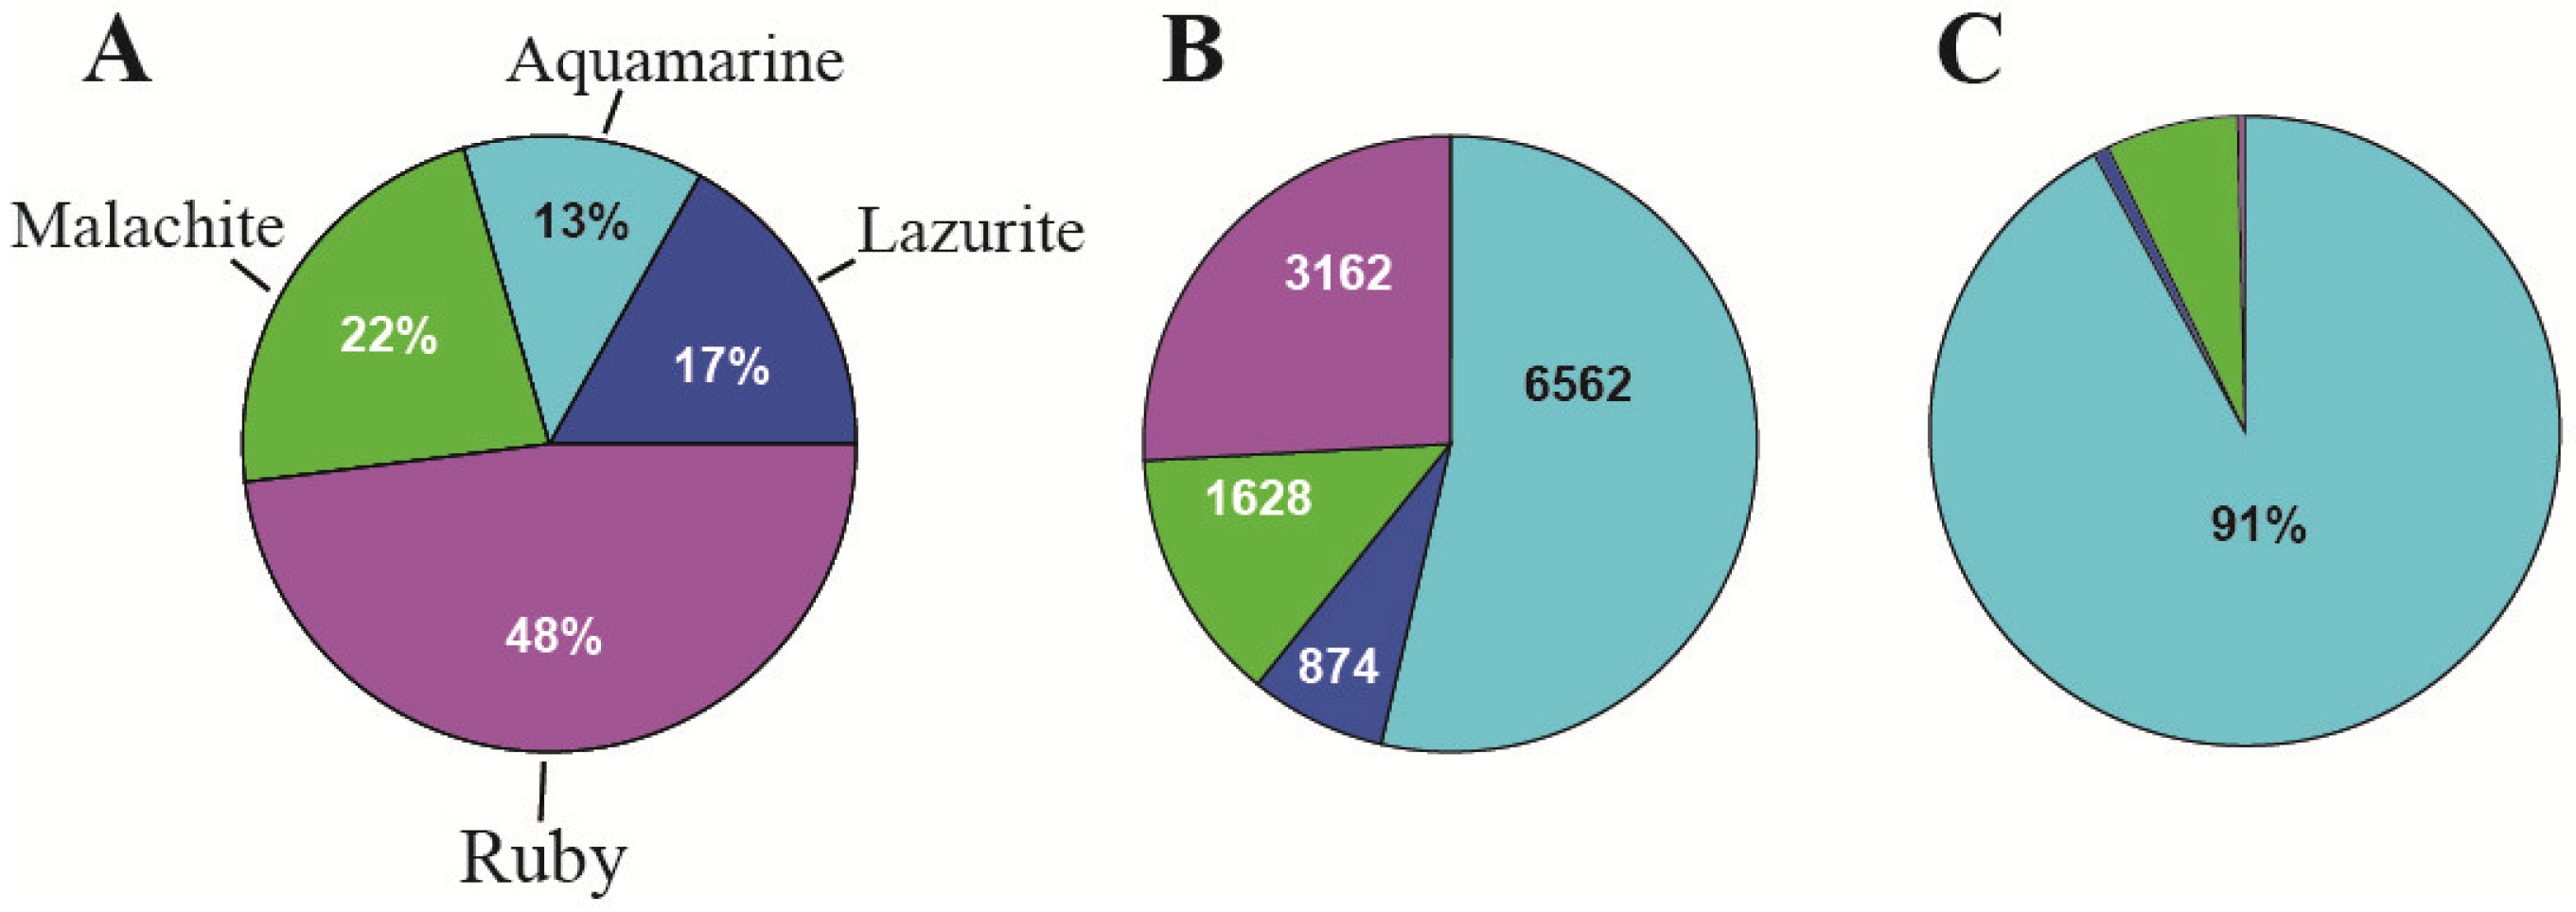
| 1. Assignment of genes to chromosomal structures | Promoters lie in the interbands (aquamarine chromatin), while gene bodies reside in the adjacent gray bands (lazurite chromatin) | Groups of genes cluster together in black bands (ruby chromatin) | [2,32,47] |
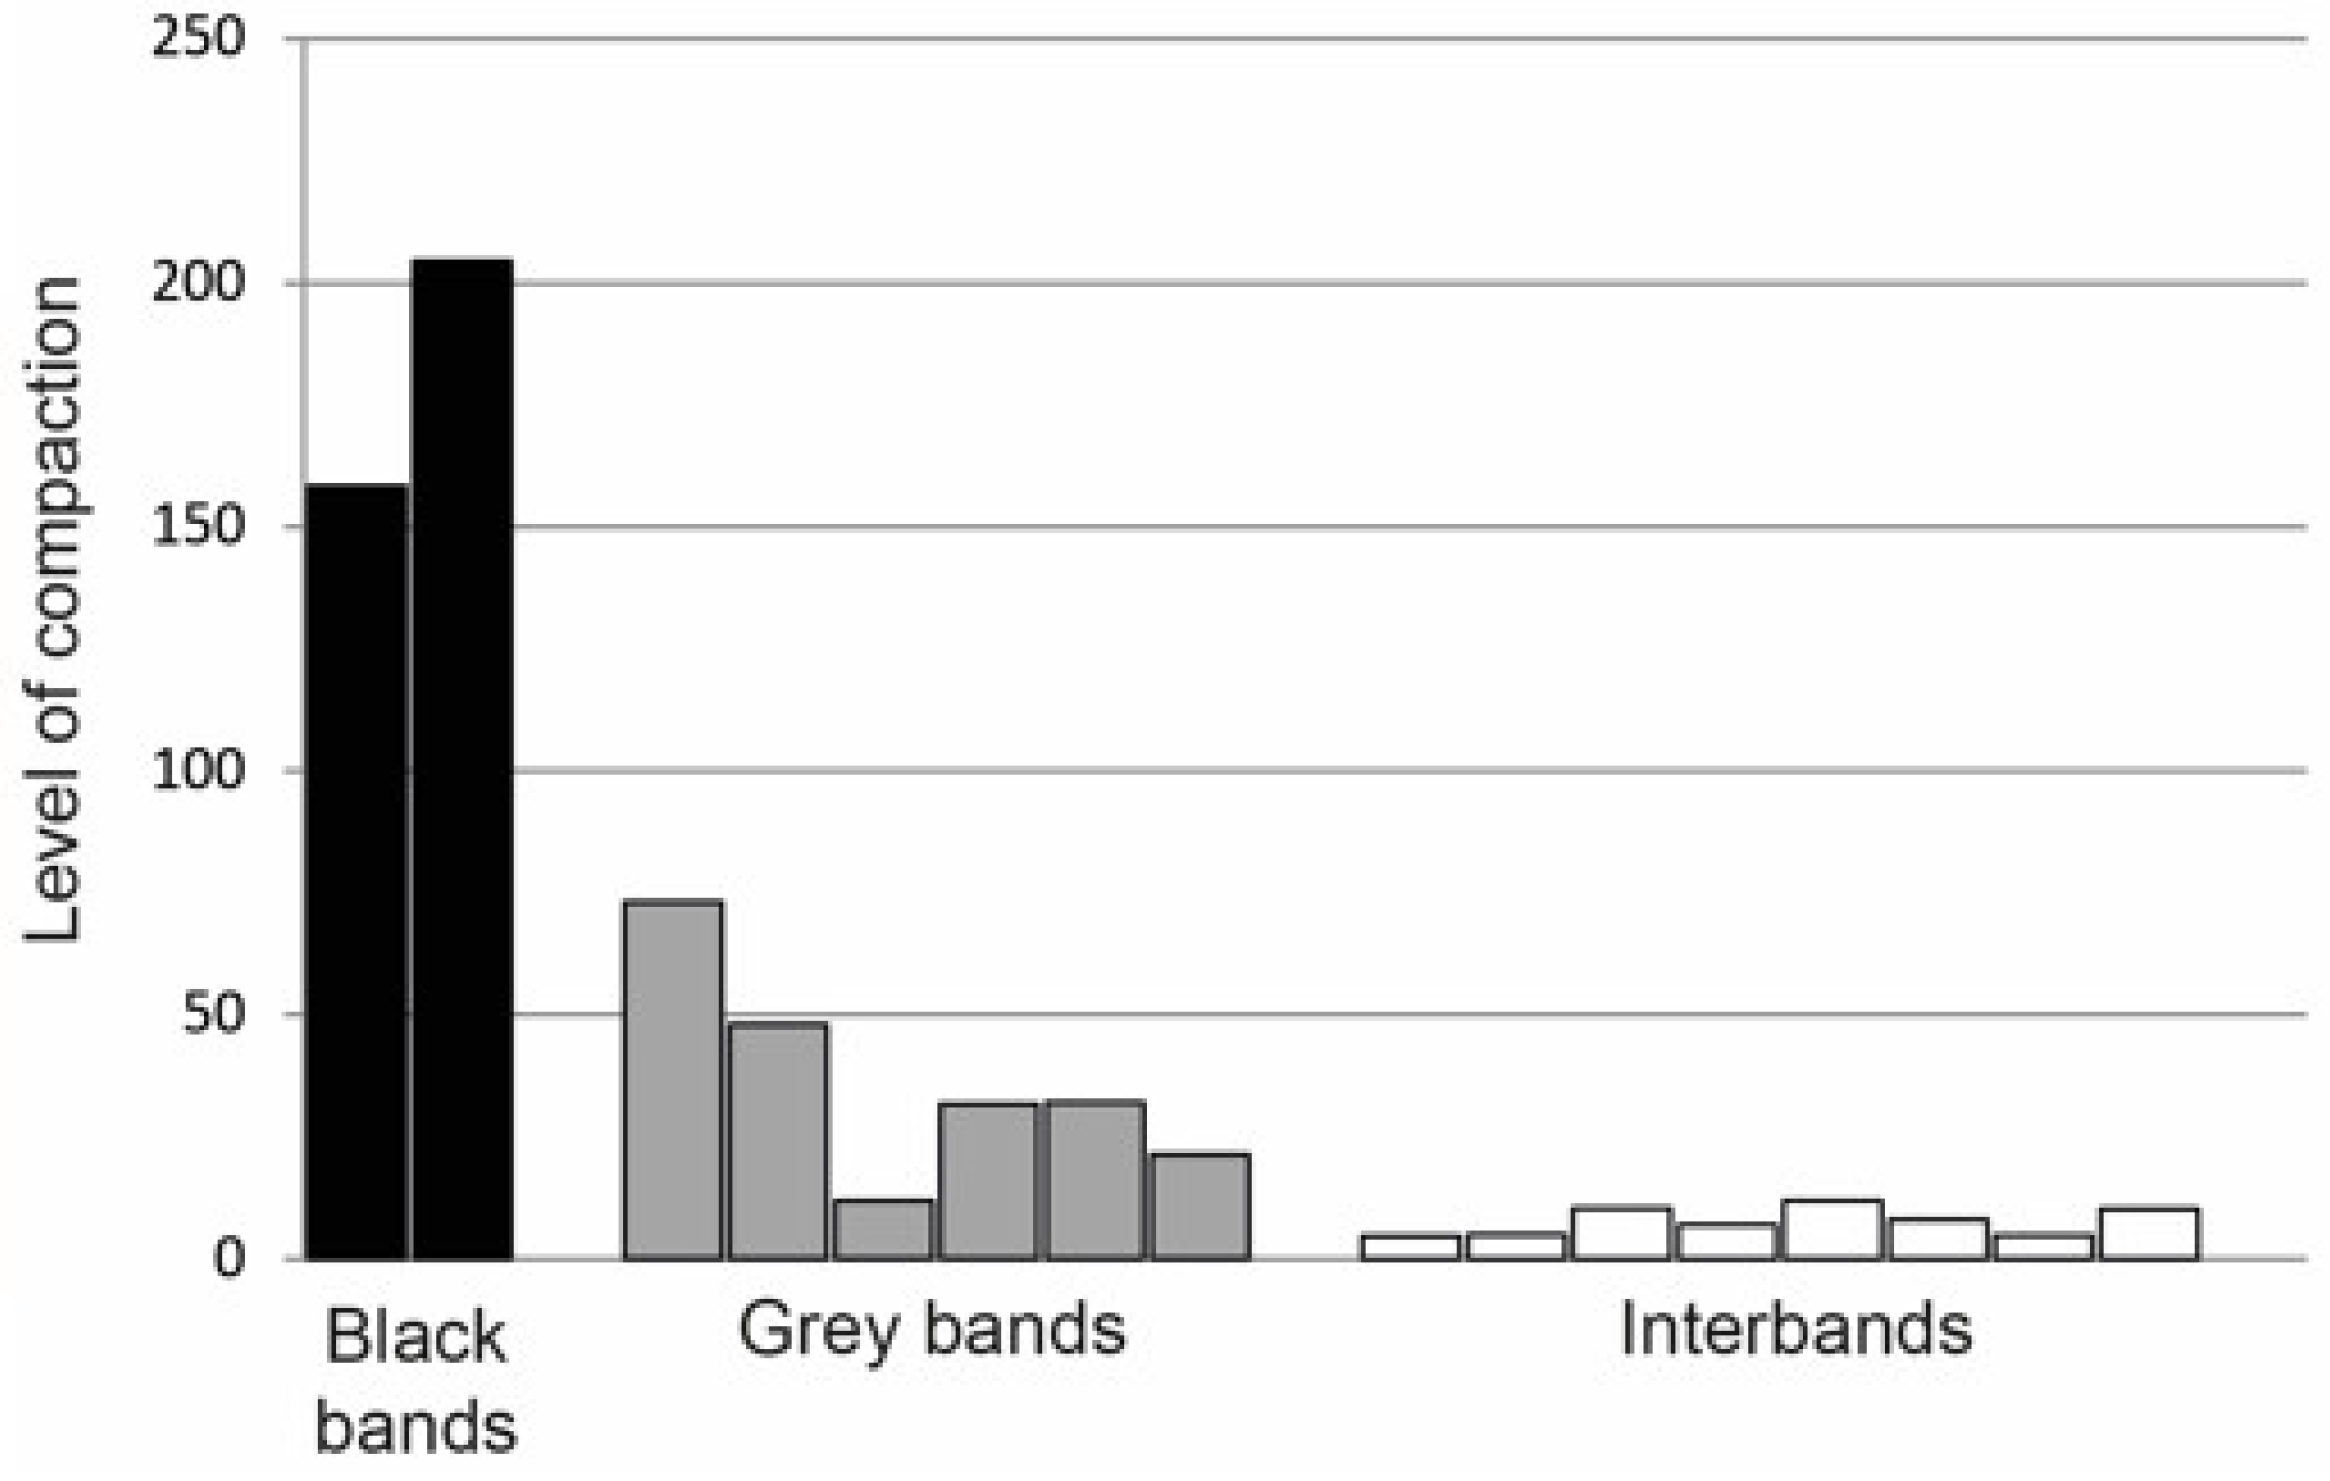
| 2. Packing density of chromosomal material | 5–10-fold in promoters (interbands) and 35–70-fold in gene bodies (gray bands) | 150–200-fold in developmental genes (black bands) | [31,32] |
| Openness of chromatin to DNase I | Maximum where housekeeping gene promoter is located | Minimum where developmental genes are located | [30] |
| Chromatin composition | Proteins and histone modification characteristics for open chromatin | Composition of compact chromatin | [2,48] |
| 3. The organization of replication | 91% of origin recognition complexes (ORCs) (in interbands) | Only 9% of origin recognition complexes (ORCs) are in the other types of chromatin states | [2] and Figure 5C, this paper |
| Early replication | Late replication | ||
| 4. Structure of genes in chromosomes | |||
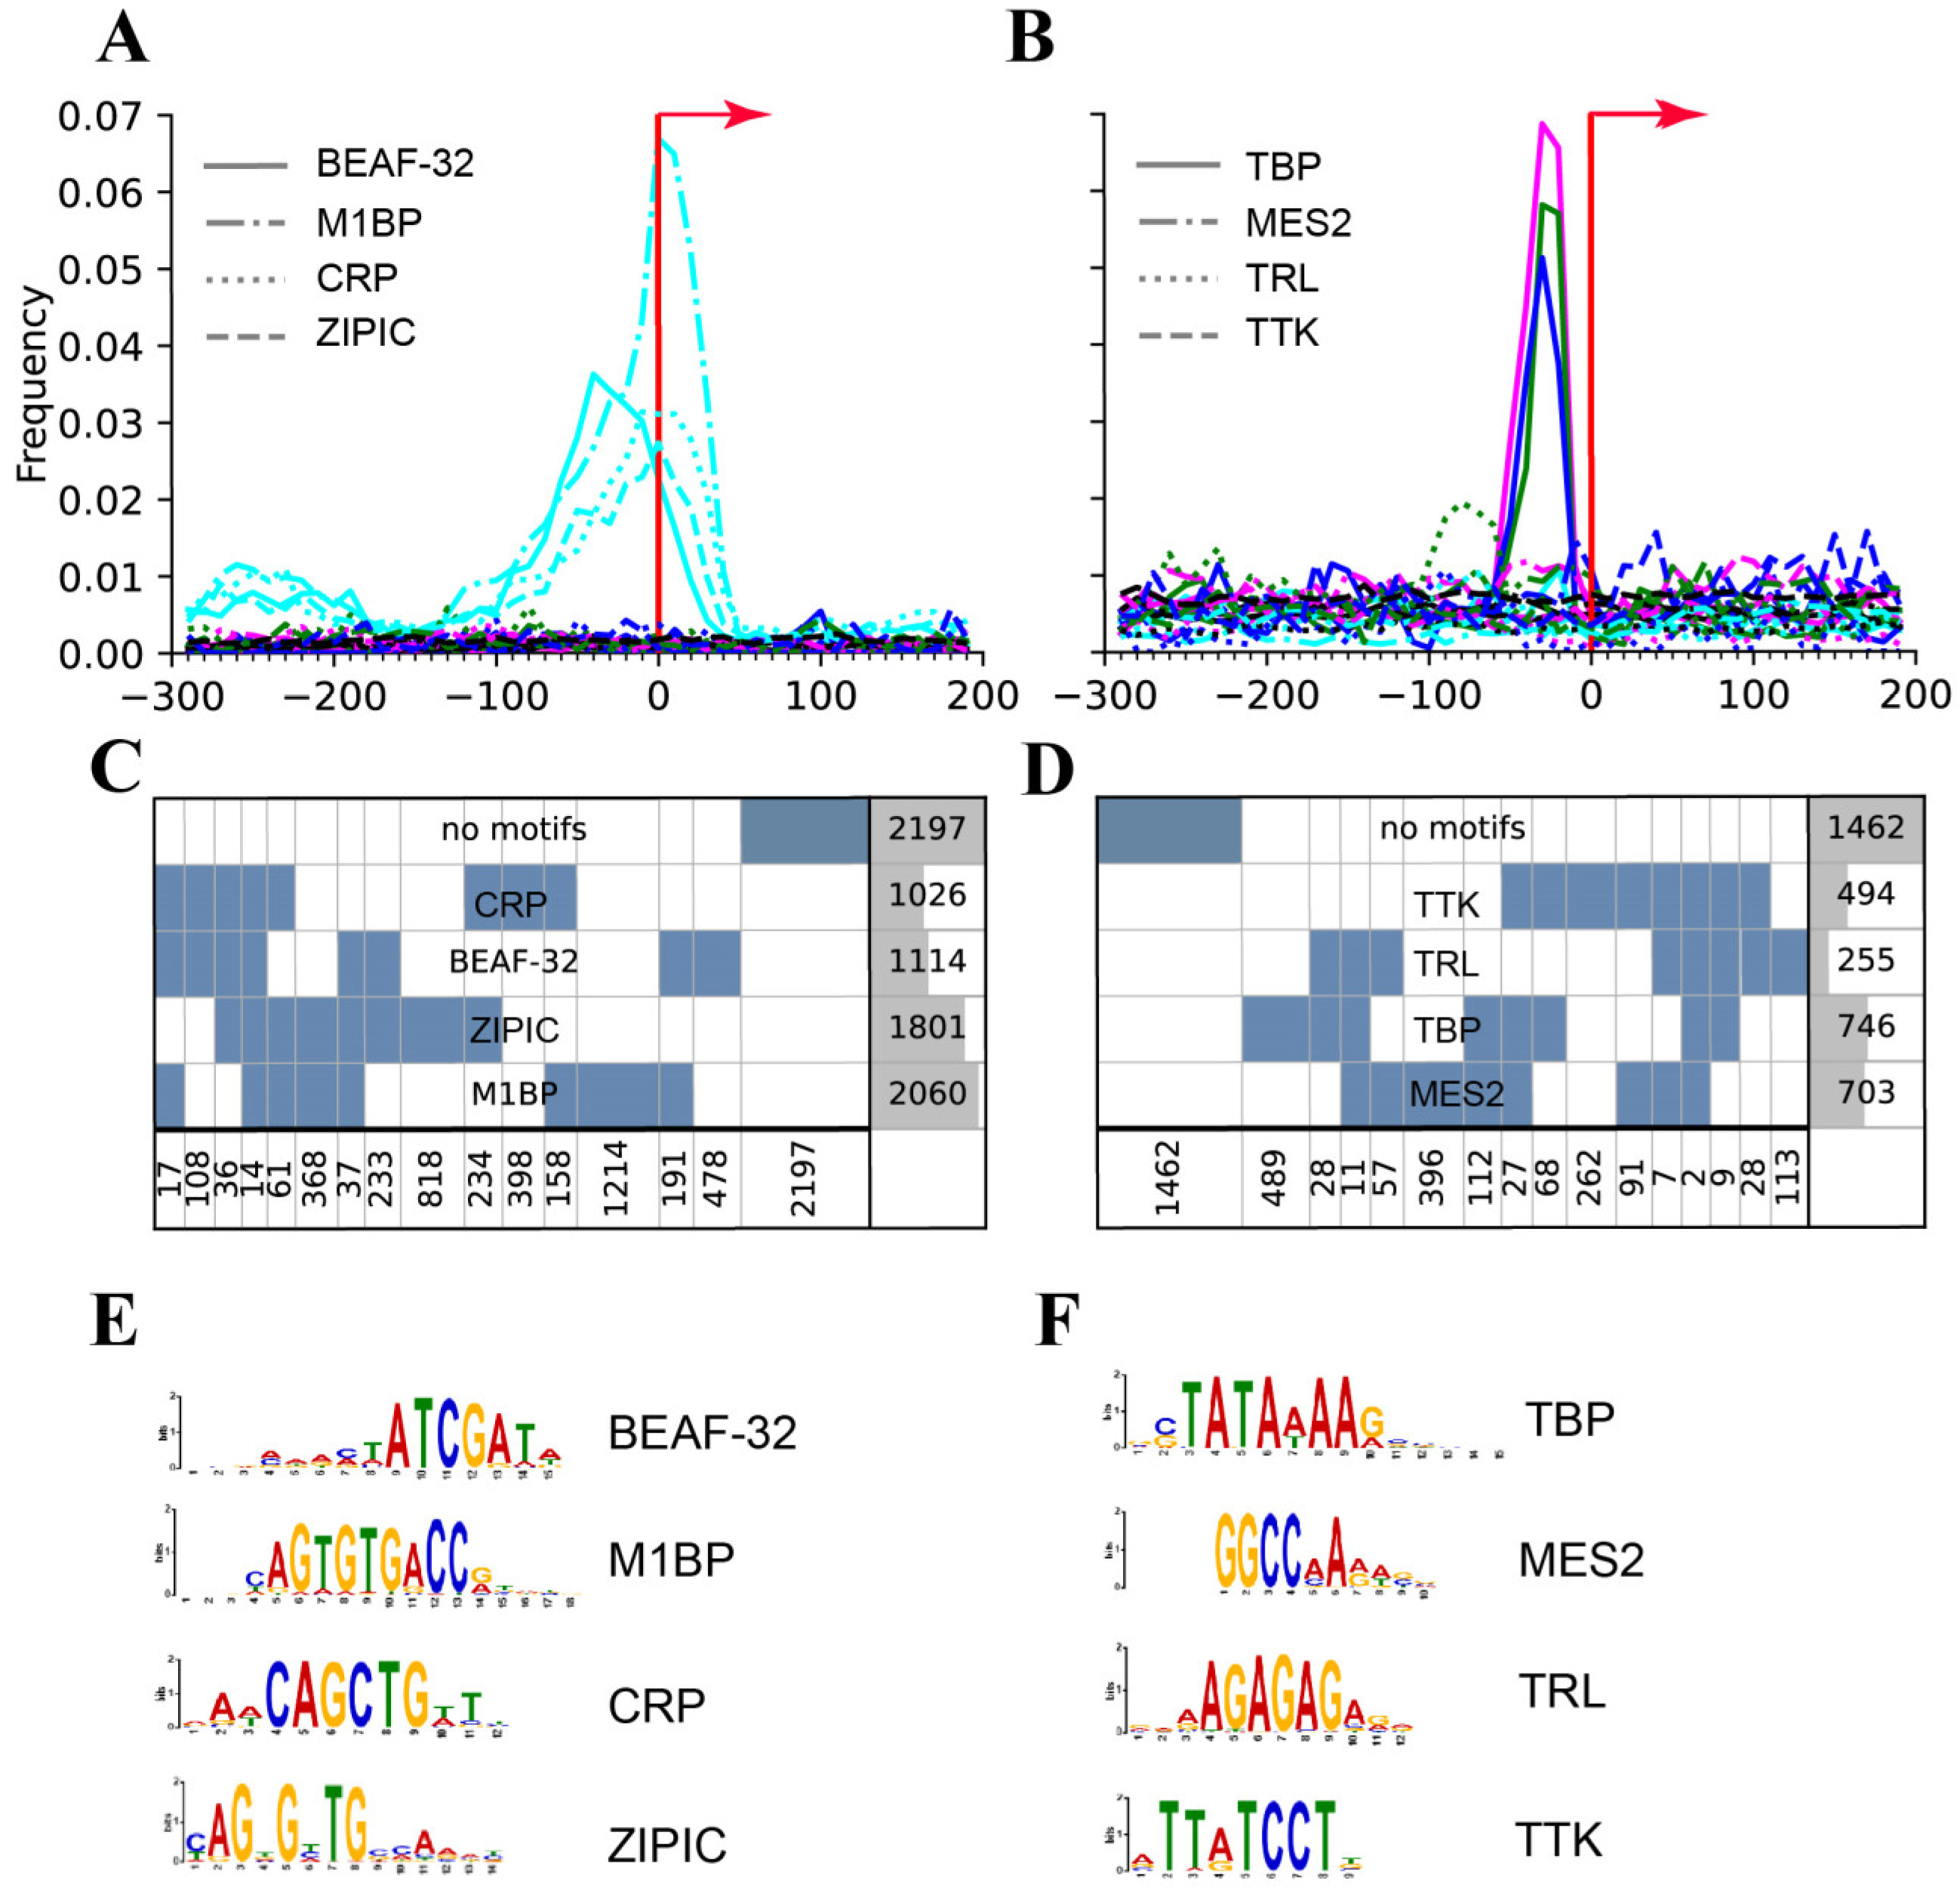
| a) Promoters | Broad promoters | Peaked promoters | [85] |
| Motifs revealed: MIBP, BEAF, CRP, ZIPIC | Only a TATA revealed | [64] | |
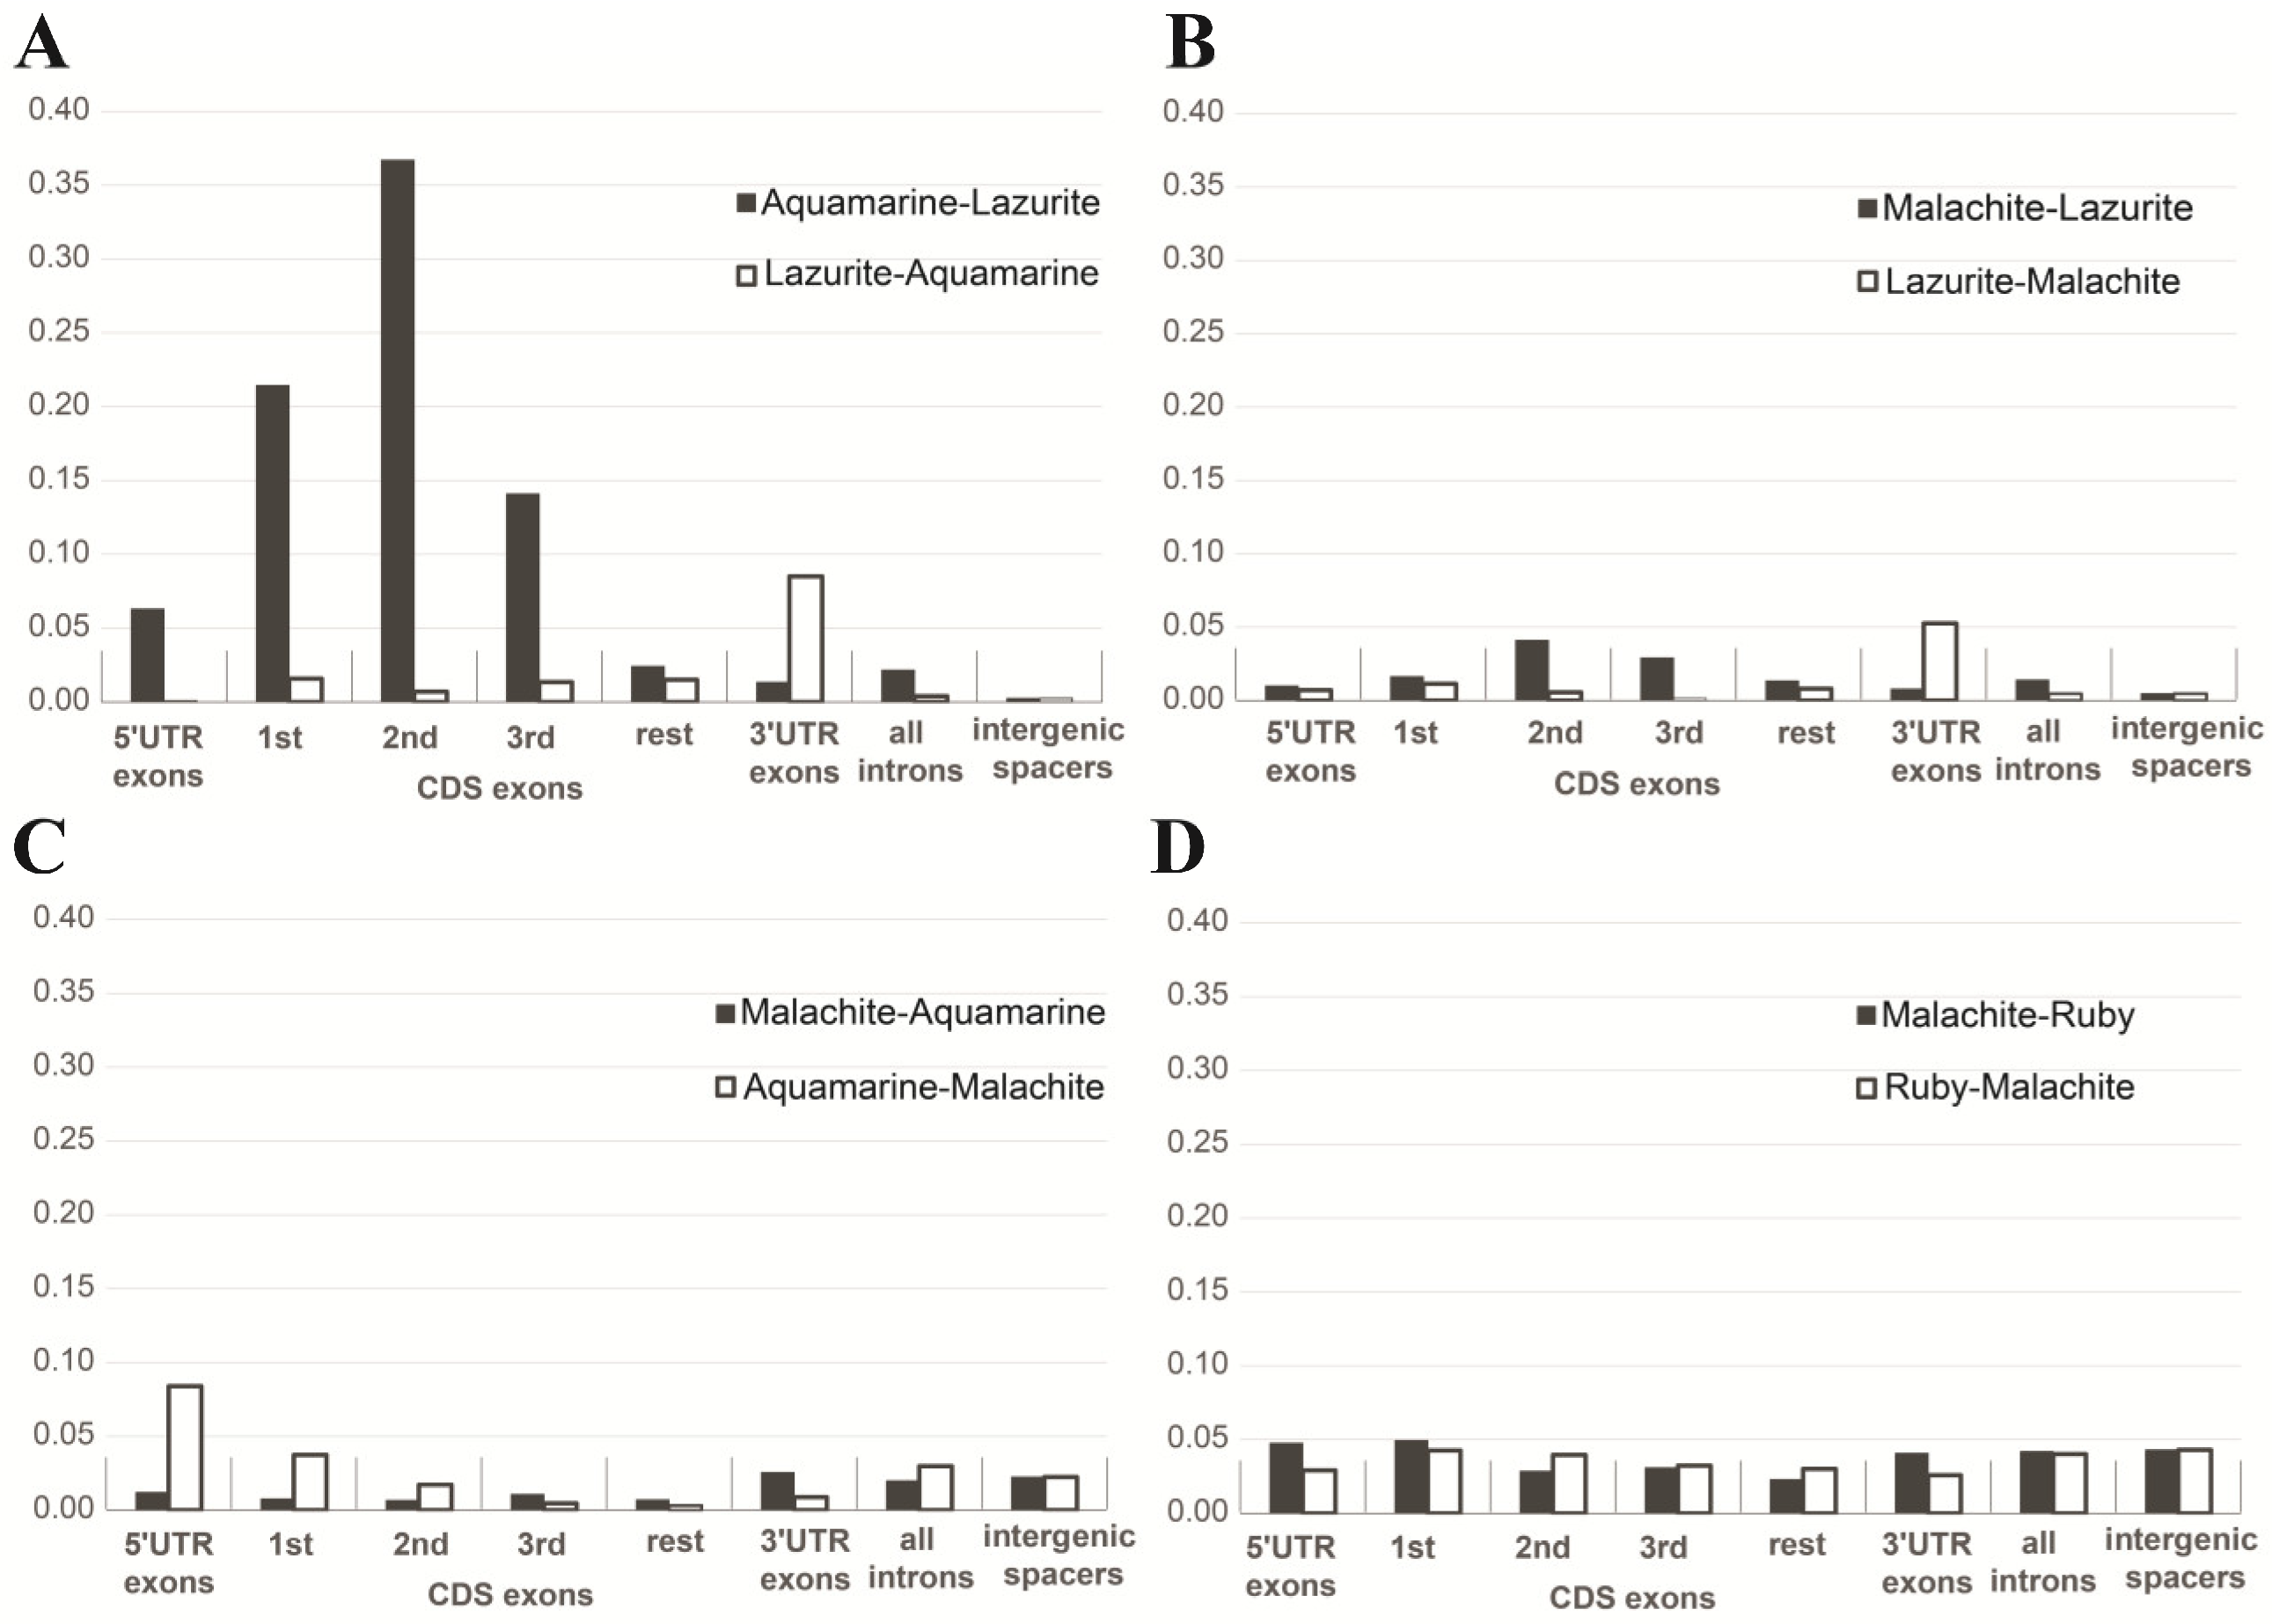
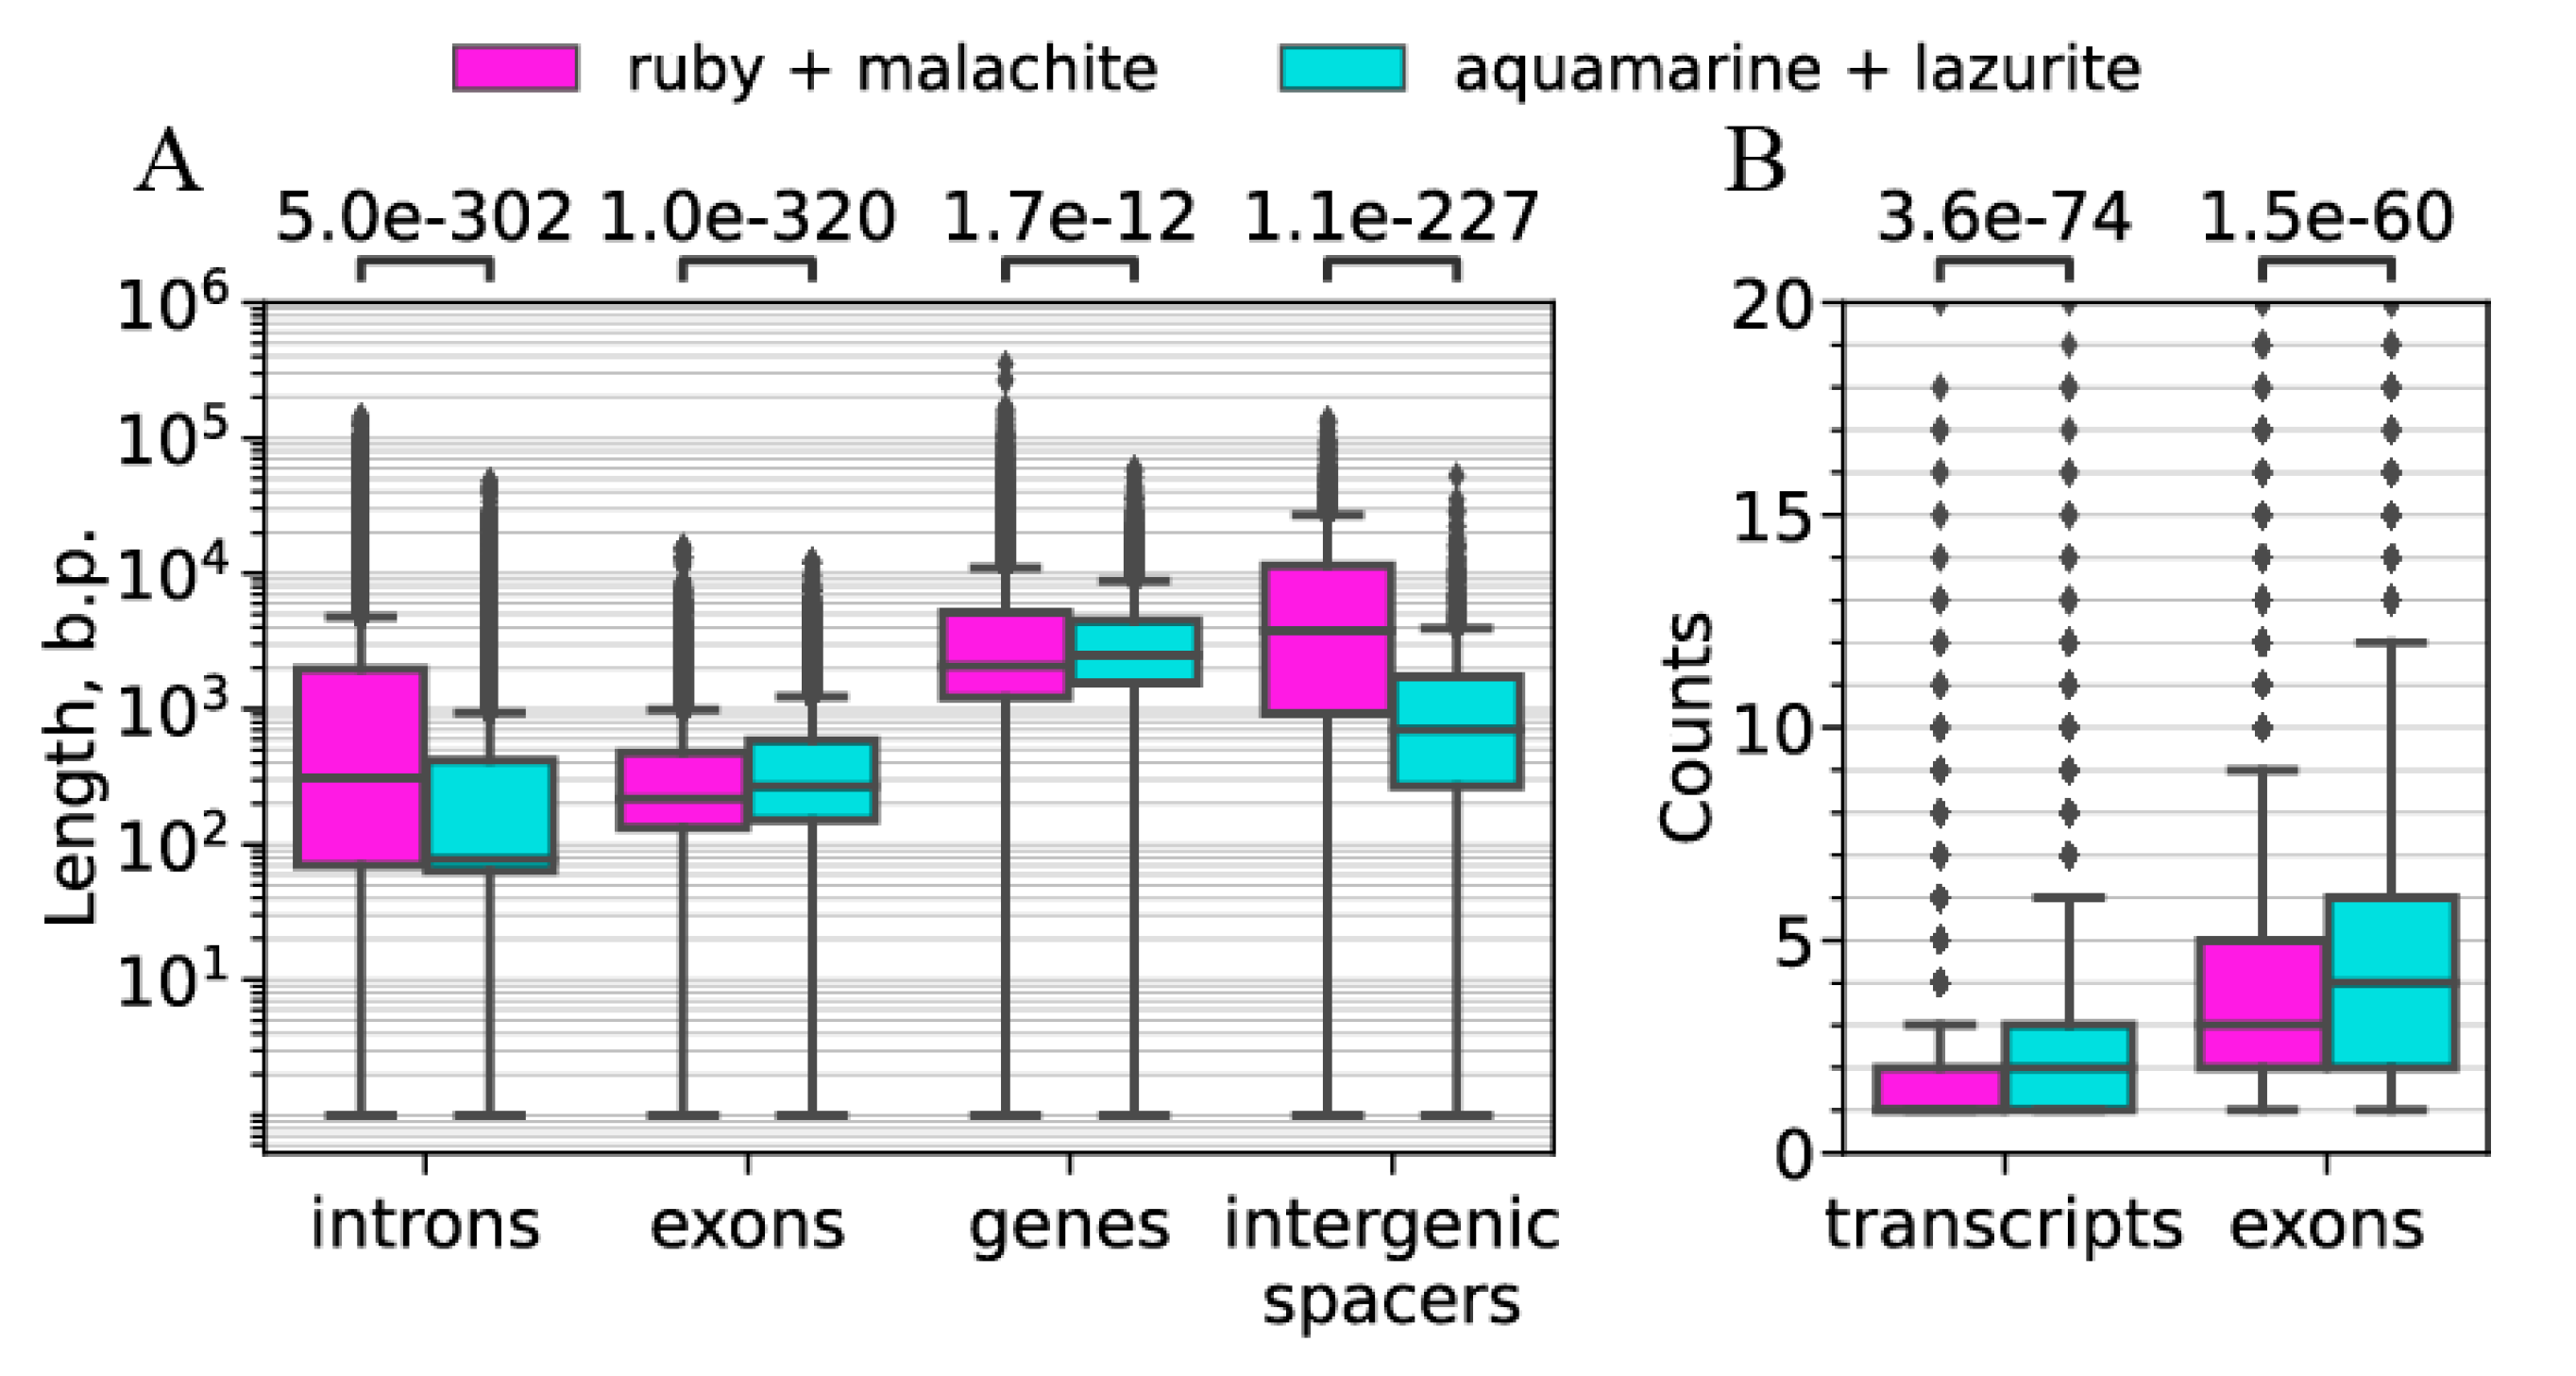
| b) Intergenic spacers in gene clusters | Median: 706 bp | Median: 3769 bp | Figure 10A |
| c) Lengths of genes | Median: 2481 bp | Median: 2078 bp | Figure 10A |
| d) Lengths of exons | Median: 267 bp | Median: 217 bp | Figure 10A |
| e) Lengths of introns | Median 78 bp | Median: 309 bp | Figure 10B |
| f) Number of exons | Median 3 | Median 4 | Figure 10B |
| g) Number of transcripts | Median 1 | Median 2 | Figure 10B |
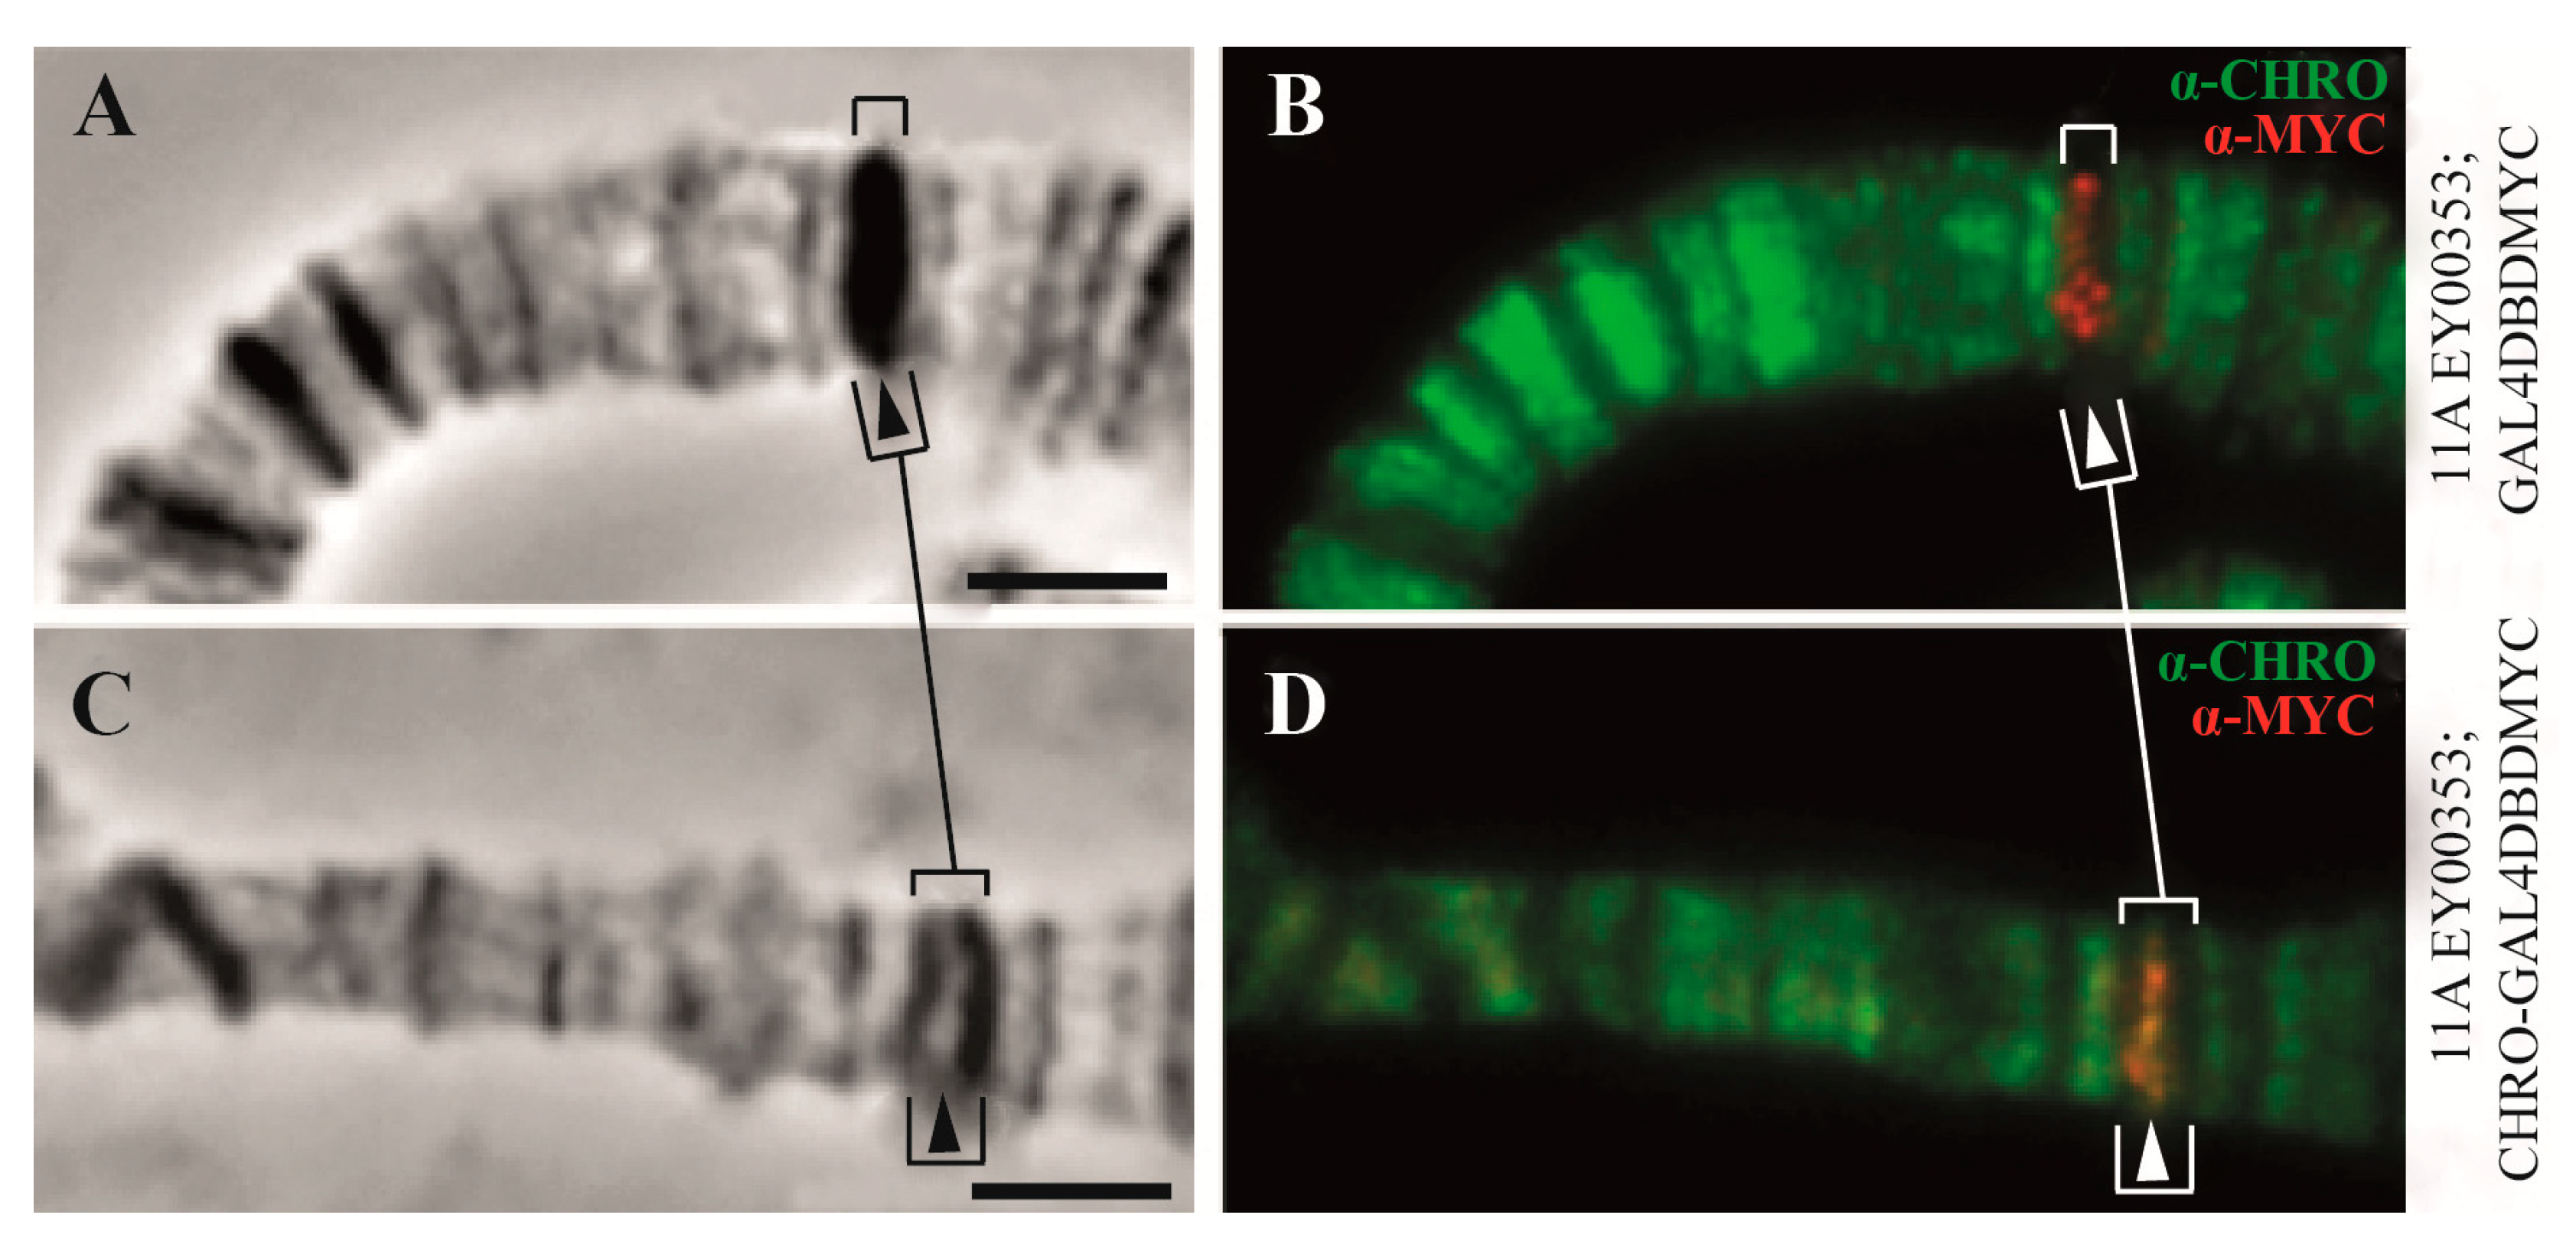
| 5. CHRIZ/CHROMATORmediated transcription | CHRIZ/CHROMATOR plays a role in chromatin decondensation | Unknown proteins | [84] |
Author Contributions
Funding
Institutional Review Board Statement
Informed Consent Statement
Data Availability Statement
Conflicts of Interest
Correction Statement
References
- Painter, T.S. Salivary chromosomes and the attack on the gene. J. Hered. 1934, 25, 465–476. [Google Scholar] [CrossRef]
- Zhimulev, I.F.; Zykova, T.Y.; Goncharov, F.P.; Khoroshko, V.A.; Demakova, O.V.; Semeshin, V.F.; Pokholkova, G.V.; Boldyreva, L.V.; Demidova, D.S.; Babenko, V.N.; et al. Genetic organization of polytene chromosome bands and interbands in Drosophila melanogaster. PLoS ONE 2014, 9, e101631. [Google Scholar] [CrossRef] [PubMed]
- Bridges, C.B. A revised map of the salivary gland X-chromosome of Drosophila melanogaster. J. Hered. 1938, 29, 11–13. [Google Scholar] [CrossRef]
- Speiser, C. Eine Hypothese uber die functionelle Organization der Chromosomen hoherer Organismen. Theoret. Appl. Genet. 1974, 44, 97–99. [Google Scholar] [CrossRef]
- Zhimulev, I.F.; Belyaeva, E.S. Proposals to the problem of structural and functional organization of polytene chromosomes. Theor. Appl. Genet. 1975, 45, 335–340. [Google Scholar] [CrossRef] [PubMed]
- Zhimulev, I.F. Genetic organization of polytene chromosomes. Adv. Genet. 1999, 39, 1–589. [Google Scholar] [CrossRef] [PubMed]
- Adams, M.D.; Celniker, S.E.; Holt, R.A.; Evans, C.A.; Gocayne, J.D.; Amanatides, P.G.; Scherer, S.E.; Li, P.W.; Hoskins, R.A.; Galle, R.F.; et al. The genome sequence of Drosophila melanogaster. Science 2000, 287, 2185–2195. [Google Scholar] [CrossRef] [PubMed]
- Kim, K.E.; Peluso, P.; Babayan, P.; Yeadon, P.J.; Yu, C.; Fisher, W.W.; Chin, C.S.; Rapicavoli, N.A.; Rank, D.R.; Li, J.; et al. Long-read, whole-genome shotgun sequence data for five model organisms. Sci. Data 2014, 1, 140045. [Google Scholar] [CrossRef] [PubMed]
- Solares, E.A.; Chakraborty, M.; Miller, D.E.; Kalsow, S.; Hall, K.; Perera, A.G.; Emerson, J.J.; Hawley, R.S. Rapid Low-Cost Assembly of the Drosophila melanogaster Reference Genome Using Low-Coverage, Long-Read Sequencing. G3 2018, 8, 3143–3154. [Google Scholar] [CrossRef] [PubMed]
- Ilyin, Y.V.; Tchurikov, N.A.; Ananiev, E.V.; Ryskov, A.P.; Yenikolopov, G.N.; Limborska, S.A.; Maleeva, N.E.; Gvozdev, V.A.; Georgiev, G.P. Studies on the DNA fragments of mammals and Drosophila containing structural genes and adjacent sequences. Cold Spring Harbor Symp. Quant. Biol. 1978, 42 Pt 2, 959–969. [Google Scholar] [CrossRef] [PubMed]
- Finnegan, D.J.; Rubin, G.M.; Young, M.W.; Hogness, D.S. Repeated gene families in Drosophila melanogaster. Cold Spring Harbor Symp. Quant. Biol. 1978, 42 Pt 2, 1053–1063. [Google Scholar] [CrossRef]
- Wilson, C.; Pearson, R.K.; Bellen, H.J.; O’Kane, C.J.; Grossniklaus, U.; Gehring, W.J. P-element-mediated enhancer detection: An efficient method for isolating and characterizing developmentally regulated genes in Drosophila. Genes Dev. 1989, 3, 1301–1313. [Google Scholar] [CrossRef]
- Semeshin, V.F.; Demakov, S.A.; Perez Alonso, M.; Belyaeva, E.S.; Bonner, J.J.; Zhimulev, I.F. Electron microscopical analysis of Drosophila polytene chromosomes. V. Characteristics of structures formed by transposed DNA segments of mobile elements. Chromosoma 1989, 97, 396–412. [Google Scholar] [CrossRef] [PubMed]
- Demakov, S.A.; Vatolina, T.Y.; Babenko, V.N.; Semeshin, V.F.; Belyaeva, E.S.; Zhimulev, I.F. Protein composition of interband regions in polytene and cell line chromosomes of Drosophila melanogaster. BMC Genom. 2011, 12, 566. [Google Scholar] [CrossRef]
- Keppy, D.O.; Welshons, W.J. The synthesis of compound bands in Drosophila melanogaster salivary gland chromosomes. Chromosoma 1980, 76, 191–200. [Google Scholar] [CrossRef]
- Rykowski, M.C.; Parmelee, S.J.; Agard, D.A.; Sedat, J.W. Precise determination of the molecular limits of a polytene chromosome band: Regulatory sequences for the Notch gene are in the interband. Cell 1988, 54, 461–472. [Google Scholar] [CrossRef] [PubMed]
- Eagen, K.P.; Hartl, T.A.; Kornberg, R.D. Stable chromosome condensation revealed by chromosome conformation capture. Cell 2015, 163, 934–946. [Google Scholar] [CrossRef] [PubMed]
- Ulianov, S.V.; Khrameeva, E.E.; Gavrilov, A.A.; Flyamer, I.M.; Kos, P.; Mikhaleva, E.A.; Penin, A.A.; Logacheva, M.D.; Imakaev, M.V.; Chertovich, A.; et al. Active chromatin and transcription play a key role in chromosome partitioning into topologically associating domains. Genome Res. 2016, 26, 70–84. [Google Scholar] [CrossRef]
- Razin, S.V.; Gavrilov, A.A.; Vassetzky, Y.S.; Ulianov, S.V. Topologically-associating domains: Gene warehouses adapted to serve transcriptional regulation. Transcription 2016, 7, 84–90. [Google Scholar] [CrossRef] [PubMed][Green Version]
- Stadler, M.R.; Haines, J.E.; Eisen, M.B. Convergence of topological domain boundaries, insulators, and polytene interbands revealed by high-resolution mapping of chromatin contacts in the early Drosophila melanogaster embryo. Elife 2017, 6, e29550. [Google Scholar] [CrossRef] [PubMed]
- The modENCODE Consortium; Roy, S.; Ernst, J.; Kharchenko, P.V.; Kheradpour, P.; Negre, N.; Eaton, M.L.; Landolin, J.V.; Bristow, C.F.; Ma, L.; et al. Identification of functional elements and regulatory circuits by Drosophila modENCODE. Science 2010, 330, 1787–1797. [Google Scholar] [CrossRef] [PubMed]
- Filion, G.J.; van Bemmel, J.G.; Braunschweig, U.; Talhout, W.; Kind, J.; Ward, L.D.; Brugman, W.; de Castro, I.J.; Kerkhoven, R.M.; Bussemaker, H.J.; et al. Systematic protein location mapping reveals five principal chromatin types in Drosophila cells. Cell 2010, 143, 212–224. [Google Scholar] [CrossRef] [PubMed]
- Kolasinska-Zwierz, P.; Down, T.; Latorre, I.; Liu, T.; Liu, X.S.; Ahringer, J. Differential chromatin marking of introns and expressed exons by H3K36me3. Nat. Genet. 2009, 41, 376–381. [Google Scholar] [CrossRef] [PubMed]
- Schwartz, S.; Meshorer, E.; Ast, G. Chromatin organization marks exon-intron structure. Nat. Struct. Mol. Biol. 2009, 16, 990–995. [Google Scholar] [CrossRef]
- Wagner, E.J.; Carpenter, P.B. Understanding the language of Lys36 methylation at histone H3. Nat. Rev. Mol. Cell Biol. 2012, 13, 115–126. [Google Scholar] [CrossRef] [PubMed]
- Kharchenko, P.V.; Alekseyenko, A.A.; Schwartz, Y.B.; Minoda, A.; Riddle, N.C.; Ernst, J.; Sabo, P.J.; Larschan, E.; Gorchakov, A.A.; Gu, T.; et al. Comprehensive analysis of the chromatin landscape in Drosophila melanogaster. Nature 2011, 471, 480–485. [Google Scholar] [CrossRef] [PubMed]
- Ernst, J.; Kheradpour, P.; Mikkelsen, T.S.; Shoresh, N.; Ward, L.D.; Epstein, C.B.; Zhang, X.; Wang, L.; Issner, R.; Coyne, M.; et al. Mapping and analysis of chromatin state dynamics in nine human cell types. Nature 2011, 473, 43–49. [Google Scholar] [CrossRef] [PubMed]
- Vu, H.; Ernst, J. Universal annotation of the human genome through integration of over a thousand epigenomic datasets. Genome Biol. 2022, 23, 9. [Google Scholar] [CrossRef] [PubMed]
- Sequeira-Mendes, J.; Aragüez, I.; Peiró, R.; Mendez-Giraldez, R.; Zhang, X.; Jacobsen, S.E.; Bastolla, U.; Gutierrez, C. The Functional Topography of the Arabidopsis Genome Is Organized in a Reduced Number of Linear Motifs of Chromatin States. Plant Cell 2014, 26, 2351–2366. [Google Scholar] [CrossRef] [PubMed]
- Milon, B.; Sun, Y.; Chang, W.; Creasy, T.; Mahurkar, A.; Shetty, A.; Nurminsky, D.; Nurminskaya, M. Map of open and closed chromatin domains in Drosophila genome. BMC Genom. 2014, 15, 988. [Google Scholar] [CrossRef]
- Kozlova, T.Y.; Kokoza, E.B.; Tretyakova, I.V.; Kokoza, E.B.; Pirrotta, V.; Grafodatskaya, V.E.; Belyaeva, E.S.; Zhimulev, I.F. Molecular and cytogenetical characterization of the 10 Al-2 band and adjoining region in the Drosophila melanogaster polytene X- Chromosome. Genetics 1994, 136, 1063–1073. [Google Scholar] [CrossRef] [PubMed]
- Vatolina, T.Y.; Boldyreva, L.V.; Demakova, O.V.; Demakov, S.A.; Kokoza, E.B.; Semeshin, V.F.; Babenko, V.N.; Goncharov, F.P.; Belyaeva, E.S.; Zhimulev, I.F. Identical functional organization of cell line interphase and polytene chromosomes in Drosophila melanogaster. PLoS ONE 2011, 6, e25960. [Google Scholar] [CrossRef]
- Font-Burgada, J.; Rossell, D.; Auer, H.; Azorín, F. Drosophila HP1c isoform interacts with the zinc-finger proteins WOC and Relative-of-WOC to regulate gene expression. Genes Dev. 2008, 22, 3007–3023. [Google Scholar] [CrossRef] [PubMed]
- Ebert, A.; Lein, S.; Schotta, G.; Reuter, G. Histone modification and the control of heterochromatic gene silencing in Drosophila. Chromosome Res. 2006, 14, 377–392. [Google Scholar] [CrossRef] [PubMed]
- Jamrich, M.; Greenleaf, A.L.; Bautz, E.K. Localization of RNA polymerase in polytene chromosomes of Drosophila melanogaster. Proc. Natl. Acad. Sci. USA 1977, 74, 2079–2083. [Google Scholar] [CrossRef]
- Sass, H.; Bautz, E.K. Interbands of polytene chromosomes: Binding sites and start points for RNA polymerase B (II). Chromosoma 1982, 86, 77–93. [Google Scholar] [CrossRef] [PubMed]
- Orian, A.; Grewal, S.S.; Knoepfler, P.S.; Edgar, B.A.; Parkhurst, S.M.; Eisenman, R.N. Genomic binding and transcriptional regulation by the Drosophila Myc and Mnt transcription factors. Cold Spring Harb. Sym. 2005, 70, 299–307. [Google Scholar] [CrossRef] [PubMed]
- Zhao, K.; Hart, C.M.; Laemmli, U.K. Visualisation of chromosomaldomains with boundary element-associated factor BEAF-32. Cell 1995, 81, 879–889. [Google Scholar] [CrossRef]
- Dorn, R.; Krauss, V.; Reuter, G.; Saumweber, H. The enhancer of position-effect variegation of Drosophila, E(var)3-93D, codes for a chromatin protein containing a conserved domain common to several transcriptional regulators. Proc. Natl. Acad. Sci. USA 1993, 90, 11376–11380. [Google Scholar] [CrossRef] [PubMed]
- Gerasimova, T.I.; Corces, V.G. Polycomb and trithorax group proteins mediate the function of a chromatin insulator. Cell 1998, 92, 511–521. [Google Scholar] [CrossRef] [PubMed]
- Wallace, H.A.; Plata, M.P.; Kang, H.J.; Ross, M.; Labrador, M. Chromatin insulators specifically associate with different levels of higher-order chromatin organization in Drosophila. Chromosoma 2010, 119, 177–194. [Google Scholar] [CrossRef]
- Eggert, H.; Gortchakov, A.; Saumweber, H. Identification of the Drosophila interband-specific protein Z4 as a DNA-binding zinc-finger protein determining chromosomal structure. J. Cell Sci. 2004, 117, 4253–4264. [Google Scholar] [CrossRef] [PubMed]
- Eaton, M.L.; Prinz, J.A.; MacAlpine, H.K.; Tretyakov, G.; Kharchenko, P.V.; MacAlpine, D.M. Chromatin signatures of the Drosophila replication program. Genome Res. 2011, 21, 164–174. [Google Scholar] [CrossRef] [PubMed]
- Balasov, M.; Huijbregts, R.P.; Chesnokov, I. Role of the Orc6 protein in origin recognition complex-dependent DNA binding and replication in Drosophila melanogaster. Mol. Cell. Biol. 2007, 27, 3143–3153. [Google Scholar] [CrossRef] [PubMed]
- Ahlander, J.; Chen, X.B.; Bosco, G. The N-terminal domain of the Drosophila retinoblastoma protein Rbf1 interacts with ORC and associates with chromatin in an E2F independent manner. PLoS ONE 2008, 3, e2831. [Google Scholar] [CrossRef] [PubMed]
- Khoroshko, V.A.; Levitsky, V.G.; Zykova, T.Y.; Antonenko, O.V.; Belyaeva, E.S.; Zhimulev, I.F. Chromatin heterogeneity and distribution of regulatory elements in the late-replicating intercalary heterochromatin domains of Drosophila melanogaster chromosomes. PLoS ONE 2016, 11, e0157147. [Google Scholar] [CrossRef]
- Zykova, T.Y.; Levitsky, V.G.; Belyaeva, E.S.; Zhimulev, I.F. Polytene chromosomes—A portrait of functional organization of the Drosophila genome. Curr. Genom. 2018, 19, 179–191. [Google Scholar] [CrossRef] [PubMed]
- Boldyreva, L.V.; Goncharov, F.P.; Demakova, O.V.; Zykova, T.Y.; Levitsky, V.G.; Kolesnikov, N.N.; Pindyurin, A.V.; Semeshin, V.F.; Zhimulev, I.F. Protein and genetic composition of four chromatin types in Drosophila melanogaster cell lines. Curr. Genomics 2017, 18, 214–226. [Google Scholar] [CrossRef]
- Demakova, O.V.; Demakov, S.A.; Boldyreva, L.V.; Zykova, T.Y.; Levitsky, V.G.; Semeshin, V.F.; Pokholkova, G.V.; Sidorenko, D.S.; Goncharov, F.P.; Belyaeva, E.S.; et al. Faint gray bands in Drosophila melanogaster polytene chromosomes are formed by coding sequences of housekeeping genes. Chromosoma 2020, 129, 25–44. [Google Scholar] [CrossRef] [PubMed]
- Chintapalli, V.R.; Wang, J.; Dow, J.A. Using FlyAtlas to identify better Drosophila melanogaster models of human disease. Nat. Genet. 2007, 39, 715–720. [Google Scholar] [CrossRef] [PubMed]
- Gustavii, B. How to Write and Illustrate a Scientific Paper, 2nd ed.; Cambridge Univ. Press: Cambridge, UK, 2008; pp. 1–168. [Google Scholar]
- Huang, D.; Sherman, B.; Lempicki, R. Systematic and integrative analysis of large gene lists using DAVID bioinformatics resources. Nat. Protoc. 2009, 4, 44–57. [Google Scholar] [CrossRef] [PubMed]
- Haberle, V.; Arnold, C.D.; Pagani, M.; Rath, M.; Schernhuber, K.; Stark, A. Transcriptional cofactors display specificity for distinct types of core promoters. Nature 2019, 570, 122–126. [Google Scholar] [CrossRef] [PubMed]
- Zabidi, M.A.; Arnold, C.D.; Schernhuber, K.; Pagani, M.; Rath, M.; Frank, O.; Stark, A. Enhancer-core-promoter specificity separates developmental and housekeeping gene regulation. Nature 2015, 518, 556–559. [Google Scholar] [CrossRef] [PubMed]
- Hendy, O.; Serebreni, L.; Bergauer, K.; Muerdter, F.; Huber, L.; Nemčko, F.; Stark, A. Developmental and housekeeping transcriptional programs in Drosophila require distinct chromatin remodelers. Mol. Cell 2022, 82, 3598–3612. [Google Scholar] [CrossRef] [PubMed]
- Jacobs, J.; Pagani, M.; Wenzl, C.; Stark, A. Widespread regulatory specificities between transcriptional co-repressors and enhancers in Drosophila. Science 2023, 381, 198–204. [Google Scholar] [CrossRef] [PubMed]
- Serebreni, L.; Pleyer, L.M.; Haberle, V.; Hendy, O.; Vlasova, A.; Loubiere, V.; Nemčko, F.; Bergauer, K.; Roitinger, E.; Mechtler, K.; et al. Functionally distinct promoter classes initiate transcription via different mechanisms reflected in focused versus dispersed initiation patterns. EMBO J. 2023, 42, e113519. [Google Scholar] [CrossRef]
- Reiter, F.; de Almeida, B.P.; Stark, A. Enhancers display constrained sequence flexibility and context-specific modulation of motif function. Genome Res. 2023, 33, 346–358. [Google Scholar] [CrossRef] [PubMed]
- Joshi, C.J.; Ke, W.; Drangowska-Way, A.; O’Rourke, E.J.; Lewis, N.E. What are housekeeping genes? PLoS Comput. Biol. 2022, 18, e1010295. [Google Scholar] [CrossRef] [PubMed]
- Ohler, U.; Liao, G.C.; Niemann, H.; Rubin, G.M. Computational analysis of core promoters in the Drosophila genome. Genome Biol. 2002, 3, RESEARCH0087. [Google Scholar] [CrossRef] [PubMed]
- Ohler, U. Identification of core promoter modules in Drosophila and their application in accurate transcription start site prediction. Nucleic Acids Res. 2006, 34, 5943–5950. [Google Scholar] [CrossRef]
- Rach, E.A.; Yuan, H.Y.; Majoros, W.H.; Tomancak, P.; Ohler, U. Motif composition, conservation and condition-specificity of single and alternative transcription start sites in the Drosophila genome. Genome Biol. 2009, 10, R73. [Google Scholar] [CrossRef] [PubMed]
- Bailey, T.L. STREME: Accurate and versatile sequence motif discovery. Bioinformatics 2021, 37, 2834–2840. [Google Scholar] [CrossRef]
- Zhimulev, I.F.; Vatolina, T.Y.; Levitsky, V.G.; Kolesnikova, T.D.; Tsukanov, A.V. Development of N.K. Koltsov Idea about Genetic Organization of Interbands in Drosophila melanogaster Polytene Chromosomes. Russ. J. Dev. Biol. 2023, 54, 172–175. [Google Scholar] [CrossRef]
- Lenhard, B.; Sandelin, A.; Carninci, P. Metazoan promoters: Emerging characteristics and insights into transcriptional regulation. Nat. Rev. Genet. 2012, 13, 233–245. [Google Scholar] [CrossRef] [PubMed]
- Andersson, R.; Sandelin, A. Determinants of enhancer and promoter activities of regulatory elements. Nat. Rev. Genet. 2020, 21, 71–87. [Google Scholar] [CrossRef] [PubMed]
- Yang, J.; Ramos, E.; Corces, V.G. The BEAF-32 insulator coordinates genome organization and function during the evolution of Drosophila species. Genome Res. 2012, 22, 2199–2207. [Google Scholar] [CrossRef] [PubMed]
- Li, J.; Gilmour, D.S. Distinct mechanisms of transcriptional pausing orchestrated by GAGA factor and M1BP, a novel transcription factor. EMBO J. 2013, 32, 1829–1841. [Google Scholar] [CrossRef] [PubMed]
- Nitta, K.R.; Jolma, A.; Yin, Y.; Morgunova, E.; Kivioja, T.; Akhtar, J.; Hens, K.; Toivonen, J.; Deplancke, B.; Furlong, E.E.; et al. Conservation of transcription factor binding specificities across 600 million years of bilateria evolution. Elife 2015, 4, e04837. [Google Scholar] [CrossRef]
- Maksimenko, O.; Bartkuhn, M.; Stakhov, V.; Herold, M.; Zolotarev, N.; Jox, T.; Buxa, M.K.; Kirsch, R.; Bonchuk, A.; Fedotova, A.; et al. Two new insulator proteins, Pita and ZIPIC, target CP190 to chromatin. Genome Res. 2015, 25, 89–99. [Google Scholar] [CrossRef] [PubMed]
- Vo Ngoc, L.; Wang, Y.L.; Kassavetis, G.A.; Kadonaga, J.T. The punctilious RNA polymerase II core promoter. Genes Dev. Genes Dev. 2017, 31, 1289–1301. [Google Scholar] [CrossRef] [PubMed]
- Zhu, L.J.; Christensen, R.G.; Kazemian, M.; Hull, C.J.; Enuameh, M.S.; Basciotta, M.D.; Brasefield, J.A.; Zhu, C.; Asriyan, Y.; Lapointe, D.S.; et al. FlyFactorSurvey: A database of Drosophila transcription factor binding specificities determined using the bacterial one-hybrid system. Nucleic Acids Res. 2011, 39, D111–D117. [Google Scholar] [CrossRef] [PubMed]
- Omelina, E.S.; Baricheva, E.M.; Oshchepkov, D.Y.; Merkulova, T.I. Analysis and recognition of the GAGA transcription factor binding sites in Drosophila genes. Comput. Biol Chem. 2011, 35, 363–370. [Google Scholar] [CrossRef] [PubMed]
- Noyes, M.B.; Meng, X.; Wakabayashi, A.; Sinha, S.; Brodsky, M.H.; Wolfe, S.A. A systematic characterization of factors that regulate Drosophila segmentation via a bacterial one-hybrid system. Nucleic Acids Res. 2008, 36, 2547–2560. [Google Scholar] [CrossRef] [PubMed]
- Udvardy, A.; Maine, E.; Schedl, P. The 87A7 chromomere. Identification of novel chromatin structures flanking the heat shock locus that may define the boundaries of higher order domains. J. Mol. Biol. 1985, 185, 341–358. [Google Scholar] [CrossRef] [PubMed]
- Vazquez, J.; Schedl, P. Sequences required for enhancer blocking activity of scs are located within two nuclease-hypersensitive regions. EMBO J. 1994, 13, 5984–5993. [Google Scholar] [CrossRef] [PubMed]
- Geyer, P.K.; Corces, V.G. DNA position-specific repression of transcription by a Drosophila zinc finger protein. Genes Dev. 1992, 6, 1865–1873. [Google Scholar] [CrossRef] [PubMed]
- Kellum, R.; Schedl, P. A position-effect assay for boundaries of higher order chromosomal domains. Cell 1991, 64, 941–950. [Google Scholar] [CrossRef] [PubMed]
- West, A.G.; Gaszner, M.; Felsenfeld, G. Insulators: Many functions, many mechanisms. Genes Dev. 2023, 16, 271–288. [Google Scholar] [CrossRef] [PubMed]
- Vogelmann, J.; Le Gall, A.; Dejardin, S.; Allemand, F.; Gamot, A.; Labesse, G.; Cuvier, O.; Nègre, N.; Cohen-Gonsaud, M.; Margeat, E.; et al. Chromatin insulator factors involved in long-range DNA interactions and their role in the folding of the Drosophila genome. PLoS Genet. 2014, 10, e1004544. [Google Scholar] [CrossRef] [PubMed]
- Melnikova, L.; Molodina, V.; Babosha, V.; Kostyuchenko, M.; Georgiev, P.; Golovnin, A. The MADF-BESS protein CP60 is recruited to insulators via CP190 and has redundant functions in Drosophila. Int. J. Mol. Sci. 2023, 24, 15029. [Google Scholar] [CrossRef] [PubMed]
- Kyrchanova, O.; Klimenko, N.; Postika, N.; Bonchuk, A.; Zolotarev, N.; Maksimenko, O.; Georgiev, P. Drosophila architectural protein CTCF is not essential for fly survival and is able to function independently of CP190. Biochim. Biophys. Acta Gene Regul. Mech. 2021, 1864, 194733. [Google Scholar] [CrossRef] [PubMed]
- Sabirov, M.; Popovich, A.; Boyko, K.; Nikolaeva, A.; Kyrchanova, O.; Maksimenko, O.; Popov, V.; Georgiev, P.; Bonchuk, A. Mechanisms of CP190 interaction with architectural proteins in Drosophila melanogaster. Int. J. Mol. Sci. 2021, 22, 12400. [Google Scholar] [CrossRef] [PubMed]
- Pokholkova, G.V.; Demakov, S.A.; Andreenkov, O.V.; Andreenkova, N.G.; Volkova, E.I.; Belyaeva, E.S.; Zhimulev, I.F. Tethering of CHROMATOR and dCTCF proteins results in decompaction of condensed bands in the Drosophila melanogaster polytene chromosomes but does not affect their transcription and replication timing. PLoS ONE 2018, 13, e0192634. [Google Scholar] [CrossRef]
- Hoskins, R.A.; Landolin, J.M.; Brown, J.B.; Sandler, J.E.; Takahashi, H.; Lassmann, T.; Yu, C.; Booth, B.W.; Zhang, D.; Wan, K.H.; et al. Genome-wide analysis of promoter architecture in Drosophila melanogaster. Genome Res 2011, 21, 182–192. [Google Scholar] [CrossRef]
- Weber, C.C.; Hurst, L.D. Support for multiple classes of local expression clusters in Drosophila melanogaster, but no evidence for gene order conservation. Genome Biol. 2011, 12, R23. [Google Scholar] [CrossRef] [PubMed]
- Corrales, M.; Rosado, A.; Cortini, R.; van Arensbergen, J.; van Steensel, B.; Filion, G.J. Clustering of Drosophila housekeeping promoters facilitates their expression. Genome Res. 2017, 27, 1153–1161. [Google Scholar] [CrossRef] [PubMed]
- Mezey, J.G.; Nuzhdin, S.V.; Ye, F.; Jones, C.D. Coordinated evolution of co-expressed gene clusters in the Drosophila transcriptome. BMC Evol Biol. 2008, 8, 2. [Google Scholar] [CrossRef] [PubMed]


Disclaimer/Publisher’s Note: The statements, opinions and data contained in all publications are solely those of the individual author(s) and contributor(s) and not of MDPI and/or the editor(s). MDPI and/or the editor(s) disclaim responsibility for any injury to people or property resulting from any ideas, methods, instructions or products referred to in the content. |
© 2024 by the authors. Licensee MDPI, Basel, Switzerland. This article is an open access article distributed under the terms and conditions of the Creative Commons Attribution (CC BY) license (https://creativecommons.org/licenses/by/4.0/).
Share and Cite
Zhimulev, I.; Vatolina, T.; Levitsky, V.; Tsukanov, A. Developmental and Housekeeping Genes: Two Types of Genetic Organization in the Drosophila Genome. Int. J. Mol. Sci. 2024, 25, 4068. https://doi.org/10.3390/ijms25074068
Zhimulev I, Vatolina T, Levitsky V, Tsukanov A. Developmental and Housekeeping Genes: Two Types of Genetic Organization in the Drosophila Genome. International Journal of Molecular Sciences. 2024; 25(7):4068. https://doi.org/10.3390/ijms25074068
Chicago/Turabian StyleZhimulev, Igor, Tatyana Vatolina, Victor Levitsky, and Anton Tsukanov. 2024. "Developmental and Housekeeping Genes: Two Types of Genetic Organization in the Drosophila Genome" International Journal of Molecular Sciences 25, no. 7: 4068. https://doi.org/10.3390/ijms25074068
APA StyleZhimulev, I., Vatolina, T., Levitsky, V., & Tsukanov, A. (2024). Developmental and Housekeeping Genes: Two Types of Genetic Organization in the Drosophila Genome. International Journal of Molecular Sciences, 25(7), 4068. https://doi.org/10.3390/ijms25074068