Article

Tumor and Peritoneum-Associated Macrophage Gene Signature as a Novel Molecular Biomarker in Gastric Cancer

1
Department of Surgery, City of Hope National Medical Center, Duarte, CA 91010, USA
2
Integrative Genome Core, Beckman Research Institute, City of Hope National Medical Center, Duarte, CA 91010, USA
3
Department of Computational and Quantitative Medicine, City of Hope National Medical Center, Duarte, CA 91010, USA
4
Molecular Medicine Division, Translational Genomics Research Institute, Phoenix, AZ 85004, USA
5
Cancer Immunotherapeutics Program, Beckman Research Institute, City of Hope National Medical Center, Duarte, CA 91010, USA
*
Author to whom correspondence should be addressed.
Int. J. Mol. Sci. 2024, 25(7), 4117; https://doi.org/10.3390/ijms25074117
Submission received: 19 February 2024 / Revised: 27 March 2024 / Accepted: 5 April 2024 / Published: 8 April 2024

Abstract

:
A spectrum of immune states resulting from tumor resident macrophages and T-lymphocytes in the solid tumor microenvironment correlates with patient outcomes. We hypothesized that in gastric cancer (GC), macrophages in a polarized immunosuppressive transcriptional state would be prognostic of poor survival. We derived transcriptomic signatures for M2 (M2TS, MRC1; MS4A4A; CD36; CCL13; CCL18; CCL23; SLC38A6; FGL2; FN1; MAF) and M1 (M1TS, CCR7; IL2RA; CXCL11; CCL19; CXCL10; PLA1A; PTX3) macrophages, and cytolytic T-lymphocytes (CTLTS, GZMA; GZMB; GZMH; GZMM; PRF1). Primary GC in a TCGA stomach cancer dataset was evaluated for signature expressions, and a log-rank test determined overall survival (OS) and the disease-free interval (DFI). In 341 TCGA GC entries, high M2TS expression was associated with histological types and later stages. Low M2TS expression was associated with significantly better 5-year OS and DFI. We validated M2TS in prospectively collected peritoneal fluid of a GC patient cohort (n = 28). Single-cell RNA sequencing was used for signature expression in CD68+CD163+ cells and the log-rank test compared OS. GC patients with high M2TS in CD68+CD163+ cells in their peritoneal fluid had significantly worse OS than those with low expression. Multivariate analyses confirmed M2TS was significantly and independently associated with survival. As an independent predictor of poor survival, M2TS may be prognostic in primary tumors and peritoneal fluid of GC patients.

1. Introduction

Gastric cancer (GC) is the fifth most common cause of cancer worldwide, with nearly 1 million new cases per year and over 650,000 deaths per year [1]. GC consists of genomically and immunogenically heterogeneous tumors with a poor 5-year overall survival (OS) of 30% in locally advanced stages and 5% in patients with distant disease [2]. Tumor immunogenicity predicts the response to immunotherapeutic agents in solid tumors, and specifically in gastric adenocarcinoma, an immunosuppressive tumor microenvironment (TME) is associated with poor survival and poor therapeutic response to immune checkpoint inhibitors (ICI) [3]. Combined with traditional chemotherapeutic regimens, ICIs, including pembrolizumab and nivolumab, have improved patient survival and are approved for first-line therapy in unresectable advanced or metastatic GC [4,5,6]. Furthermore, immunotherapy has evolved to include a broader scope of targeted antitumor immune modalities, including chimeric antigen receptor T-cells (CAR T-cells), [7] tumor-infiltrating lymphocytes (TIL), and oncolytic viruses [8]. These strategies highlight the importance of defining immune-associated molecular profiles of cancer for a more accurate assessment of patients’ expected outcomes than that provided by the clinical or pathologic tumor, node, metastasis (TNM) stage alone.
Multi-omic studies have deeply characterized the complex and dynamic TME, revealing the direct effects of immune cell phenotypes on tumor growth and treatment responses. Both immunohistochemical (IHC) and transcriptomic analyses have identified T-cell and macrophage infiltrates in primary GC TME [9,10,11]. IHC staining to identify macrophages of either the inflammatory M1 or immunosuppressive M2 type have shown improved OS in patients whose tumors have a lower CD68+ cell population, [12] and CD45+CD68+ infiltration was higher in GC patients with peritoneal metastases (PM) [13]. Furthermore, tumor growth in a murine xenograft model was greater when GC cells were co-inoculated with M2 macrophages [13]. A meta-analysis of studies from Asia and Europe investigating tumor-associated macrophages (TAMs) in GC showed no correlation between CD68+ cell density and patient OS. However, the included studies with various definitions of M2 macrophages showed that a greater infiltration of M2 TAMs was associated with poorer patient OS [14]. A higher IL-6 and elevated CD163+ population were associated with worse disease-free survival (DFS), disease-specific survival (DSS) [15], or higher-stage disease [16]. However, the macrophage phenotype does not exist in a dichotomy of distinct M1 or M2 states. Rather, macrophages exist along a dynamic polarizing spectrum that exhibits plasticity from one phenotype to another [17,18]. TAMs also demonstrate mixed phenotypes that are difficult to classify as distinctly M1 or M2 due to exposure to multiple types of stimuli in the TME [19], and single markers such as IHC-based CD163 alone are not reliable M2 macrophage markers [20]. This diversity in TAM and macrophage polarization has necessitated a more accurate description of macrophage capacity using a combination of markers [21].
IHC staining has shown a correlation between certain M2 macrophage protein markers and survival. However, due to the differing phenotypic states of macrophages, it is not clear if the functional state of macrophages on a transcriptional level in the TME is associated with survival. In addition, the correlation of immunosuppressive macrophages in the peritoneum TME with survival is not known. We aimed to determine whether a highly immunosuppressive phenotype of M2 macrophages in primary tumors was associated with survival and to further characterize the role of this macrophage phenotype in the peritoneum. From whole genome expression profiles of macrophages and T-cells of peripheral blood of healthy donors, we selected three gene panels representing proinflammatory M1 macrophages, severely immunosuppressive M2 macrophages, or cytolytic T-cells. We determined the clinical relevance of these transcriptional signatures for each cell type in primary tumors and peritoneal fluid from GC patients.

2. Results

2.1. Derivation of the Immune Cell Subset-Specific Gene Panels as Transcriptomic Signatures of GC Outcomes

A group of macrophage-associated genes representing a spectrum of polarized M1 and M2 immune states was previously identified in peripheral blood monocytes of healthy donors [22]. We selected genes with the highest and lowest differential expression of M1/M2 ratio of macrophage polarization and defined them as the gene panels for M1-specific or M2-specific transcriptional signatures, respectively. To diversify the function of genes included in the panels, we selected the top 2–3 differentially expressed genes from each category of membrane receptors, cytokines and chemokines, solute carriers, enzymes, extracellular mediators, and DNA-binding factors if the ratio of M1/M2 differential expression (or vice versa) was greater than 10-fold. CCR7, IL2RA, CXCL11, CCL19, CXCL10, PLA1A, and PTX3 genes were selected to define the M1 transcriptomic signature (M1TS), whereas MRC1, MS4A4A, CD36, CCL13, CCL18, CCL23, SLC38A6, FGL2, FN1, and MAF genes were used as the M2 transcriptomic signature (M2TS). The literature was reviewed for independent studies in which genes identified for each signature were investigated to confirm the functional significance of each gene in macrophages. We confirmed the functional or phenotypic association of each selected gene in the signature in independent studies. In M1TS, each of the genes was associated with inflammatory or anti-tumoral functions of macrophages in local TMEs (CCR7 [23,24], CXCL11 [23,25], CCL19 [26,27], CXCL10 [23,25], PLA1A [25], PTX3 [25,28]). For M2TS, additional studies in primary or metastatic tumors similarly were consistent with immunosuppressive or pro-tumoral functions (MRC1 [23,29,30], MS4A4A [31,32], CD36 [23,33,34], CCL13 [35], CCL18 [29,36,37], CCL23 [38,39], SLC38A6, FGL2 [40,41], FN1 [42,43], MAF [30]). We also used granzyme and perforin-associated genes, GZMA, GZMB, GZMH, GZMM, and PRF1, to define a gene signature representing a highly active cytolytic T-lymphocyte (CTLTS) population involved in T-cell mediated antitumor immunity.

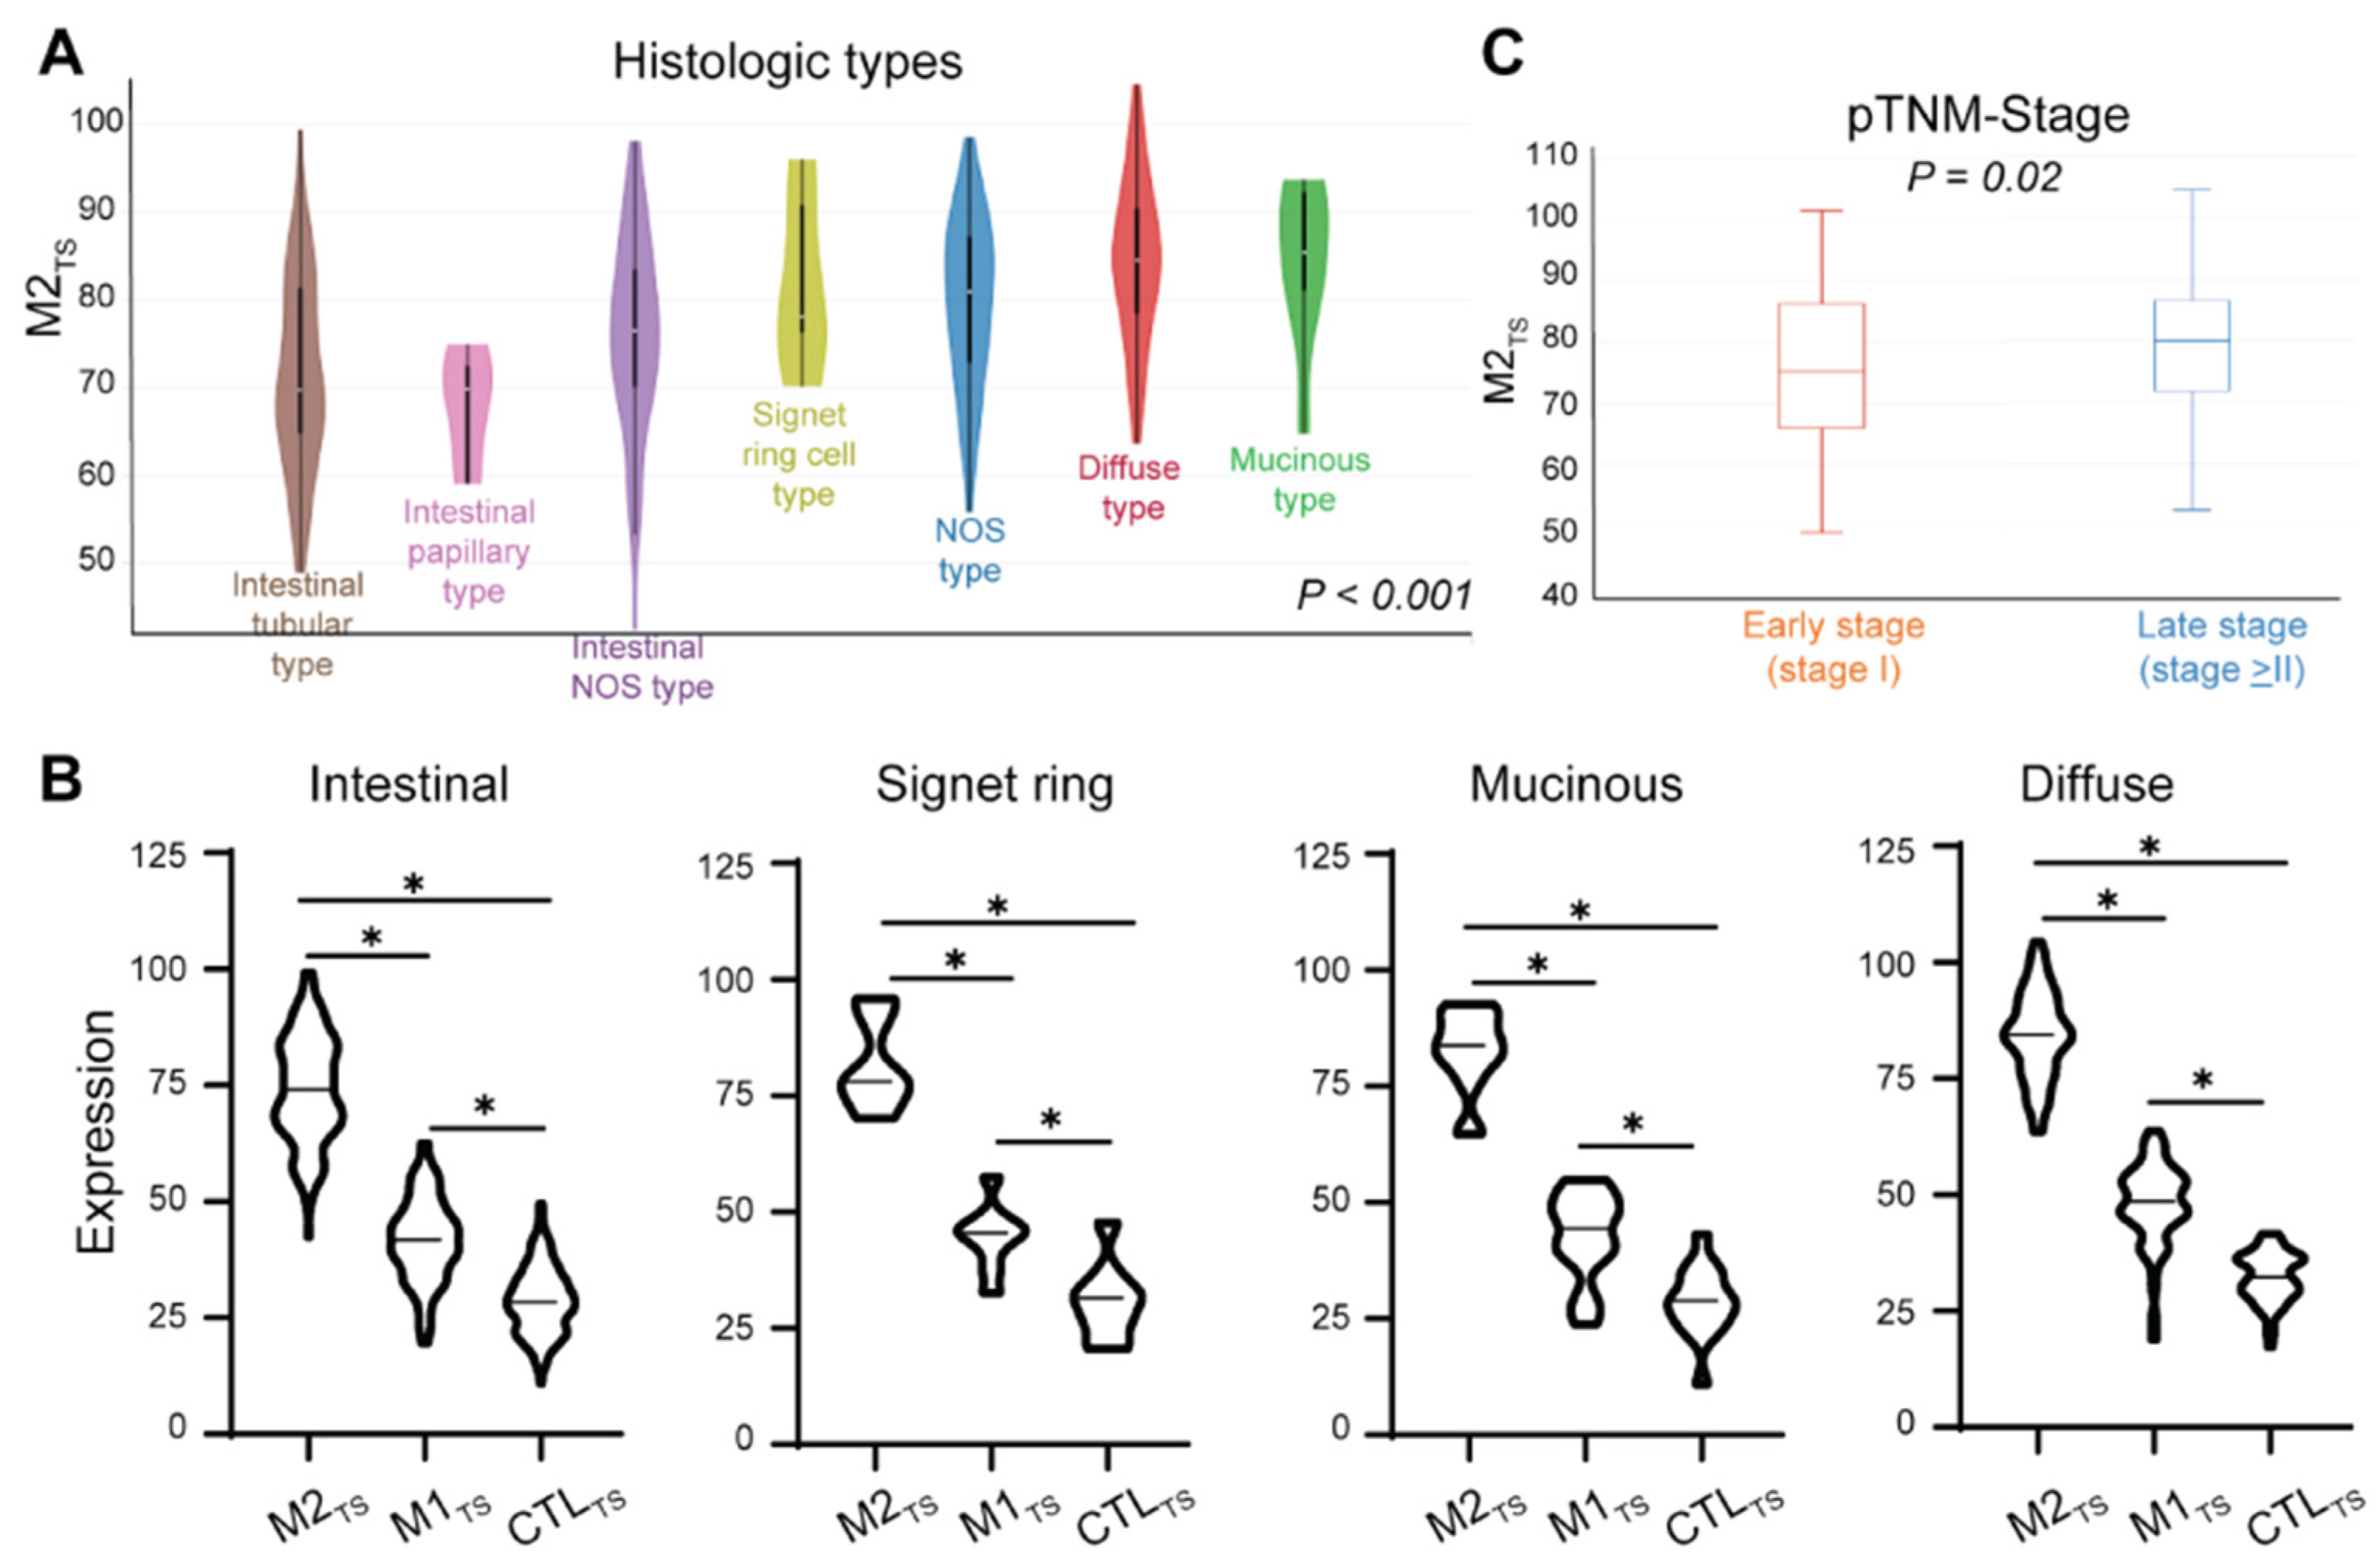
2.2. Highly Immunosuppressive M2TS Is Associated with Negative Prognostic Clinical Factors

We analyzed 341 primary GC samples in the TCGA stomach cancer database. We observed that high M2TS expression levels were significantly associated with known negative prognostic factors, such as histological classifications of signet ring cell (SRC), diffuse, and mucinous type gastric adenocarcinoma in the TCGA stomach cancer cohort (p < 0.001, Figure 1A). Conversely, intestinal type gastric adenocarcinoma (intestinal tubular, papillary, and not otherwise specified (NOS) type) was associated with lower M2TS expression levels. A similar pattern was seen for M1TS, where intestinal type histology appeared to have lower M1TS expression levels than SRC, mucinous, and diffuse types (p < 0.001, Supplementary Figure S1A). Higher levels of CTLTS expression were associated with diffuse and SRC gastric adenocarcinoma. In comparison, intestinal and mucinous types had lower CTLTS expression (p = 0.01, Supplementary Figure S1A). Regardless of histologic subtype, however, all primary gastric tumors had relatively high M2TS expression compared to M1 and CTLTS (Figure 1B).
To evaluate immune signatures and their association with the patient’s GC stage, we defined early GC (EGC) as pathologic stage I and advanced GC (AGC) as pathologic stage II and III based on the 8th edition GC TNM-staging guidelines. We found that lower M2TS expression levels were significantly associated with EGC, whereas AGC had significantly higher M2TS expression (p = 0.02, Figure 1C). Higher M1TS expression was also associated with later stages (p = 0.002, Supplementary Figure S1B). No significant difference was observed of CTLTS expression in early versus late stages (p = 0.06, Supplementary Figure S1B).

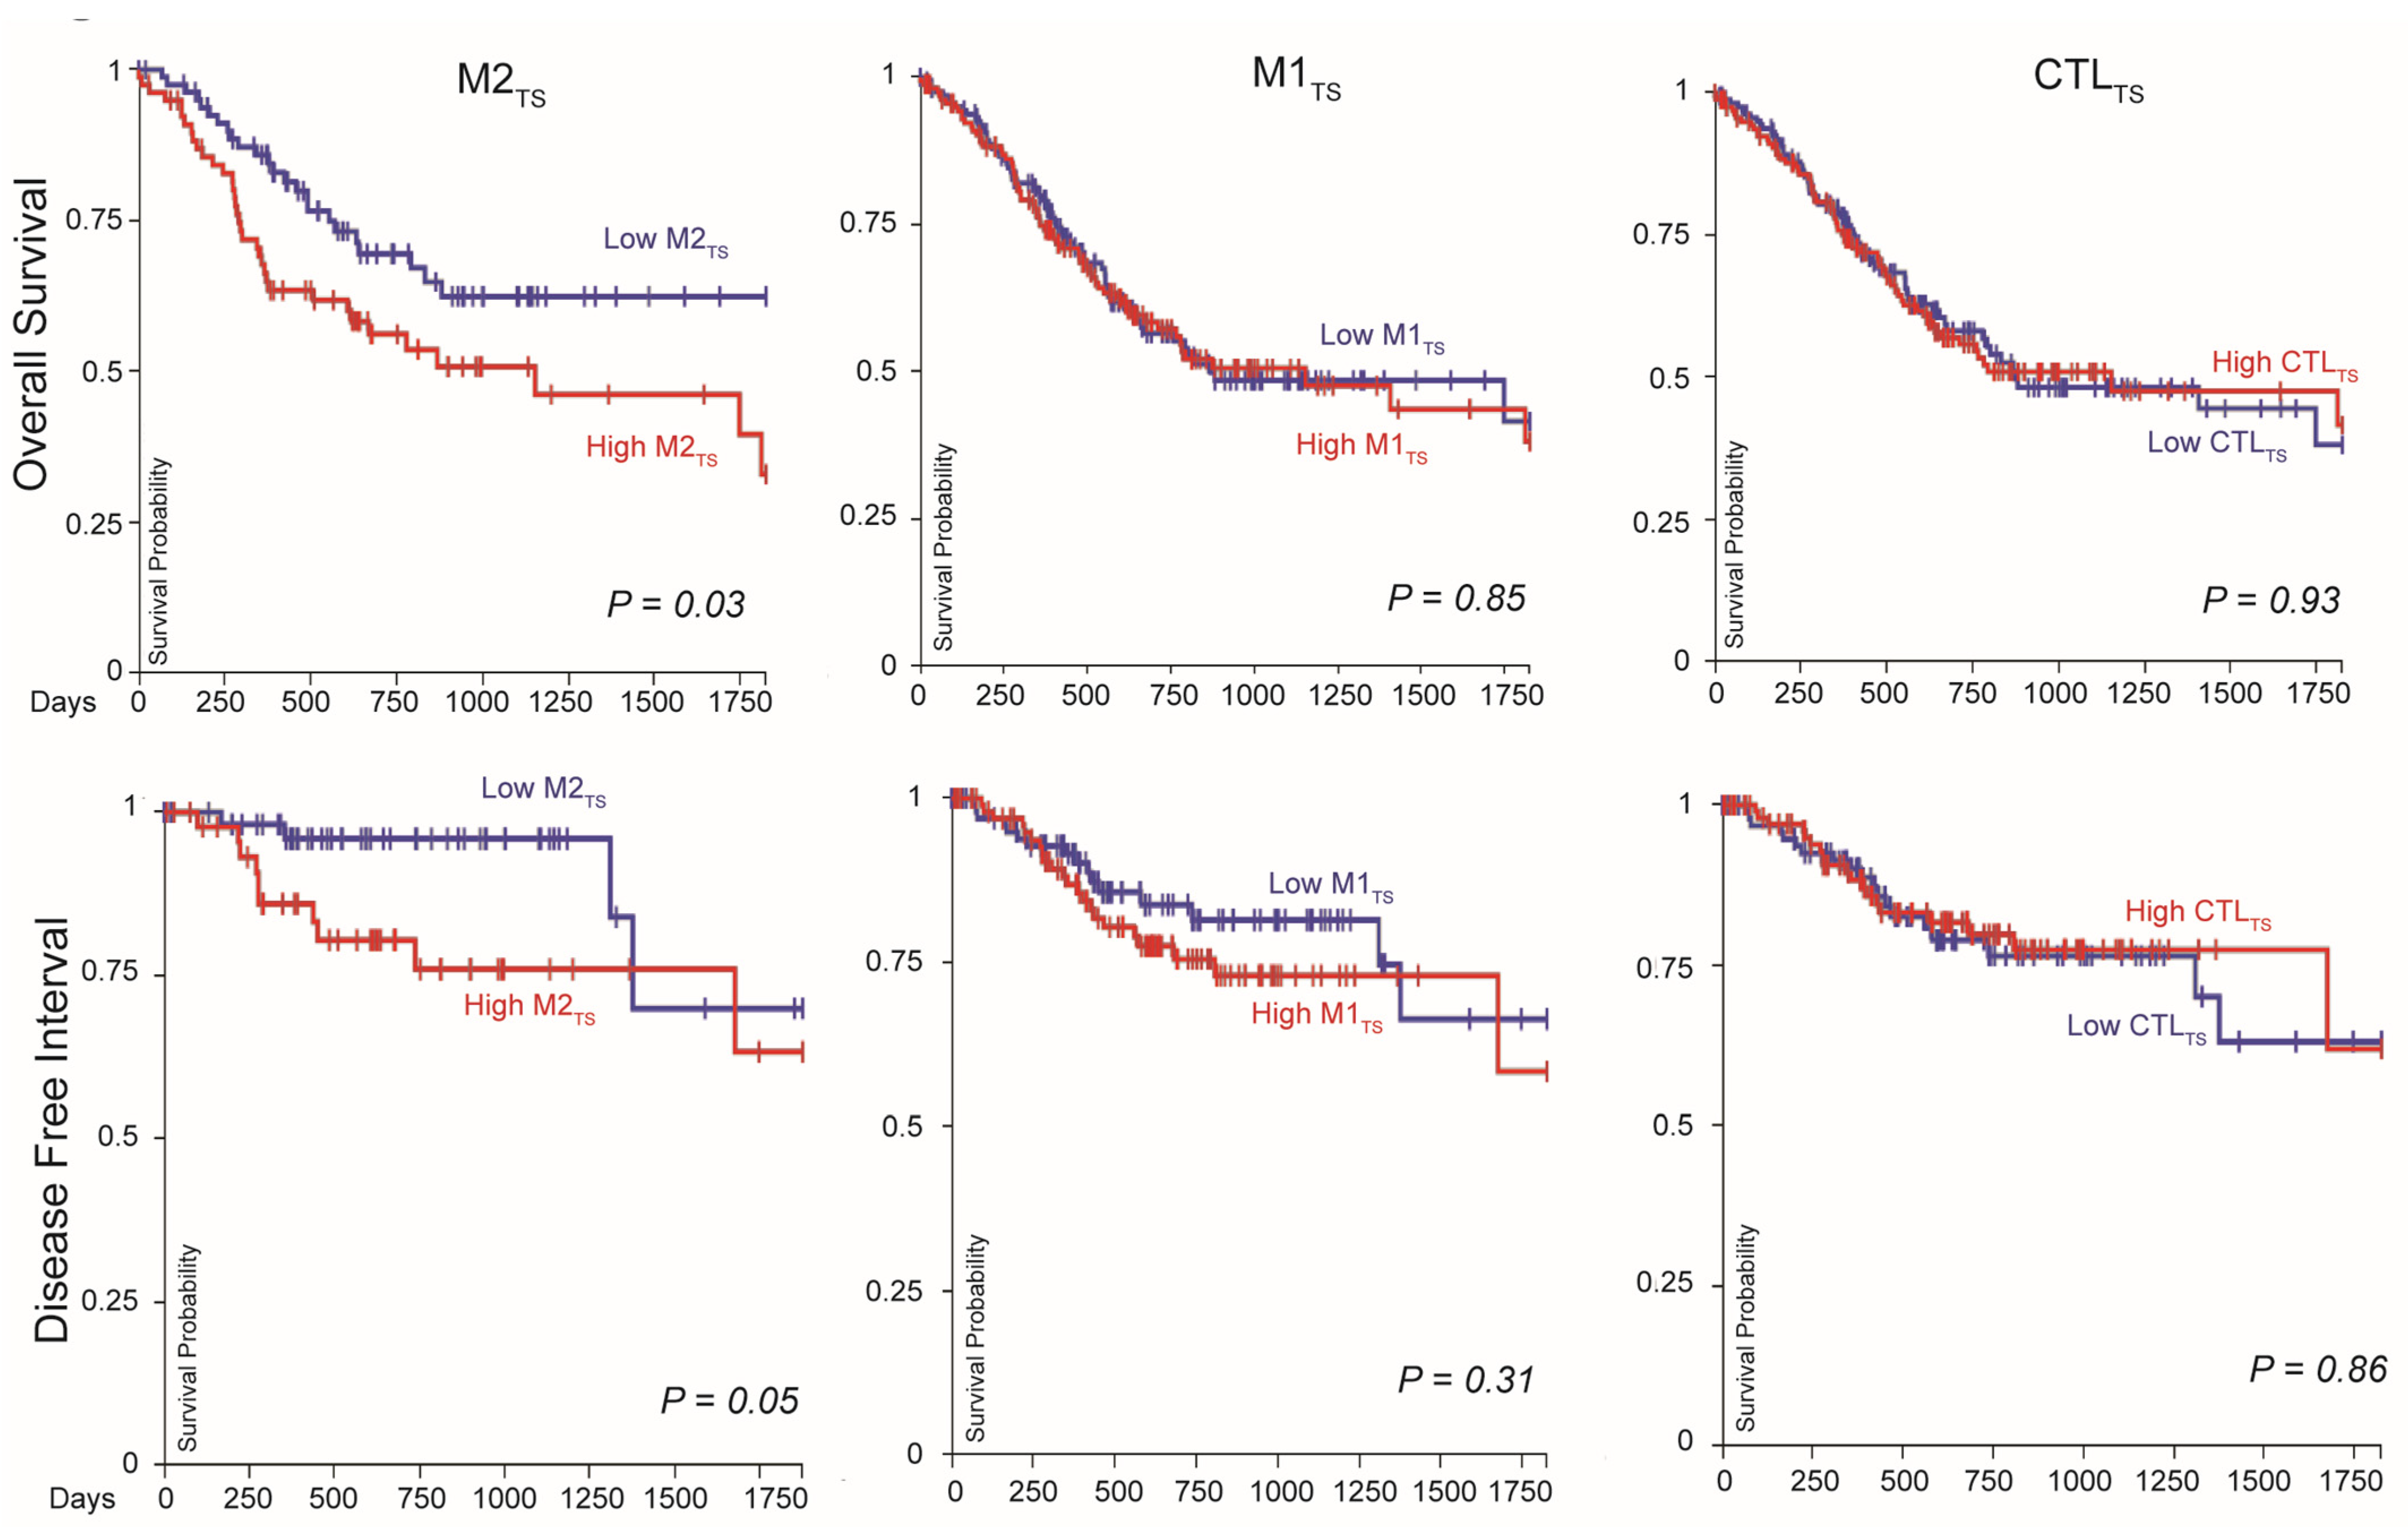
2.3. High M2TS Expression in Primary GC Is Associated with Poor Survival

Because higher M2TS expression was associated with diffuse type and SRC histology and higher pathologic stages, we evaluated whether M2TS expression was related to patient outcomes. We found that the lowest quartile of M2TS expression was significantly associated with better 5-year OS (p = 0.03) and DFI (p = 0.05) compared to the highest quartile of M2TS expression (Figure 2). We found no significant association of OS or DFI with M1TS expression and CTLTS expression (Figure 2). Additionally, we found no significant association of OS or DFI with either CD68 or CD163 expression alone, nor a significant association of OS or DFI with a combined expression of all signatures (Supplementary Figure S2).

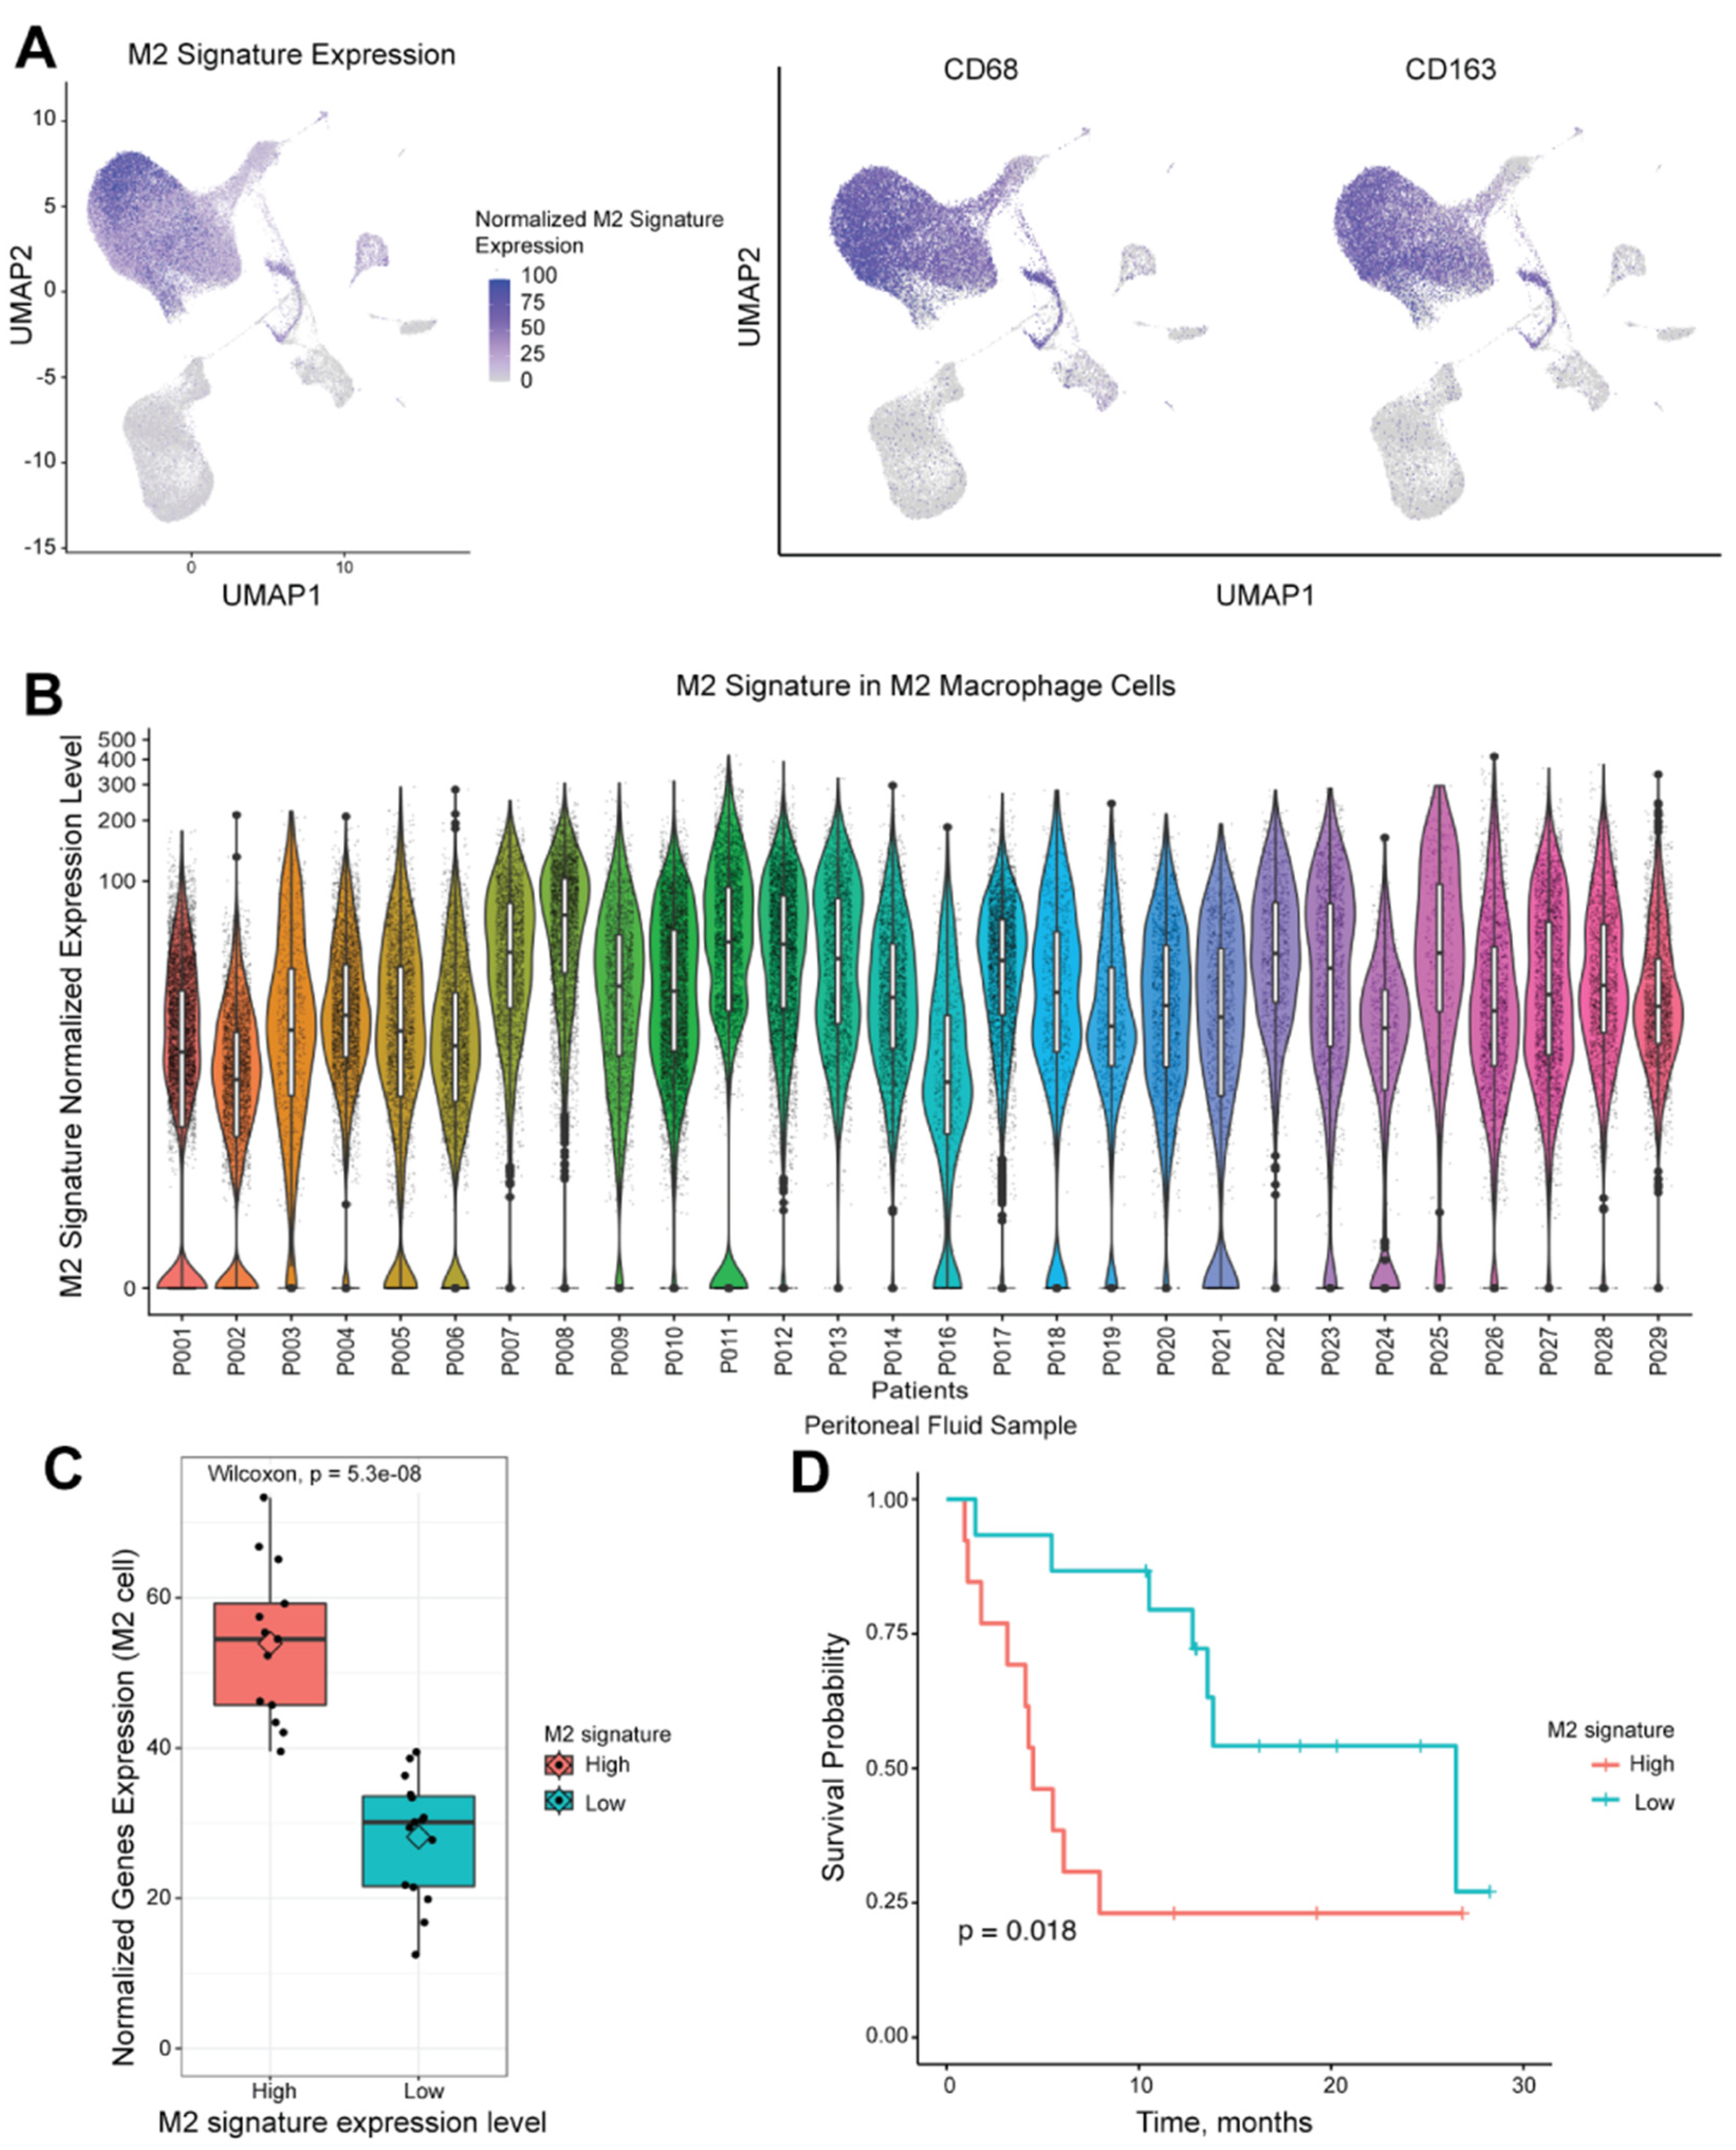
2.4. Single-Cell RNA Sequencing Demonstrates Different Populations of M2 Macrophage Polarization

We used scRNA-seq to determine M2TS expression levels of each immune cell in the peritoneal fluid (washings or ascites) from prospectively collected samples. We confirmed that the M2TS signature was primarily expressed in cells defined as M2 macrophages using CD68 and CD163 expression (Figure 3A). When plotting M2TS expression in each cell per sample, clusters of the signature gene panel expression levels were seen representing M2 cell subtypes with similar transcription of immunosuppressive genes. The expression level of M2TS within CD68+CD163+ cells was found to exist across a continuum within each patient’s peritoneal fluid sample, with several samples containing greater numbers of macrophages with high signature expression (Figure 3B). This finding demonstrates heterogeneity of polarization of cells across samples and the diversity of macrophage polarization states across a spectrum of M2 immunosuppressive transcriptional gene expression. Of the 28 patients, scRNA-seq identified 15 patients with high M2TS expression and 13 with low M2TS expression (Figure 3C).
The GC peritoneal fluid cohort included ethnically diverse patients with heterogeneous primary tumors with and without cytology-positive disease or peritoneal carcinomatosis. Table 1 shows patient demographics, including age, gender, ethnicity, and tumor characteristics, such as histology, molecular features, and TNM stage. No clinical patient- or tumor-specific factors were associated with M2TS expression.

2.5. M2TS in Peritoneal Macrophages Is Associated with OS in GC Patients

Finally, we found that M2TS expression levels in the peritoneal fluid were associated with OS of GC patients. Within CD68+CD163+ cells, samples with high M2TS expression had poorer OS than patients with low M2TS expression in their peritoneal fluid. Median OS was 4.5 months for M2TS high expressors and 26.5 months for low expressors (Figure 3D, hazard ratio (HR) 3.14, 95% confidence interval (CI) 1.17–8.46, p = 0.018). Univariate analysis using both patient and tumor-specific factors to evaluate correlations with survival showed that high M2TS expression was associated with worse survival (Table 2, HR 3.14, 95% CI 1.17–8.46, p = 0.024).
Multivariate analysis, including clinical predictors of worse survival in our cohort, showed that high M2TS expression remained independently predictive of worse survival (Table 3, HR 6.58, 95% CI 1.68–25.79, p = 0.007) after adjusting for other factors. As expected, stage IV was also predictive of worse survival.

3. Discussion

Here, we demonstrate the clinical significance of a distinct immunosuppressive macrophage signature, M2TS (MRC1, MS4A4A, CD36, CCL13, CCL18, CCL23, SLC38A6, FGL2, FN1, MAF) in GC patients. Our unique M2TS was derived from the blood of healthy donors and validated as a biomarker in primary and metastatic gastric tumors as a predictor of poor survival. We showed that high M2TS expression in primary GC from the TCGA stomach cancer cohort is associated with negative prognostic clinicopathologic factors in GC. We further validated its prognostic significance as a biomarker predictive of poor survival across stages in a prospectively collected independent cohort of peritoneal fluid from GC patients. These results strongly suggest that M2TS-expressing macrophages represent a highly immunosuppressive phenotype associated with more aggressive tumor biology and higher stages (Figure 1). Further, this transcriptional signature was also associated with survival in the primary GC cohort from TCGA. Elevated expression of the immunosuppressive M2-macrophage signature was independently predictive of survival for patients with GC. Previous studies using few surface markers [12,13,14,15] to define macrophages as M1 versus M2 are limited by the potential for a spectrum of functional polarization in immunosuppressive or inflammatory capability. Our findings highlight the biological and functional importance of the combination of genes for membrane receptors (MRC1, MS4A4A, CD36), cytokines and chemokines (CCL13, CCL18, CCL23), solute carriers (SLC38A6), extracellular mediators (FGL2, FN1), and DNA binding factors (MAF) that make up the M2TS which are highly differentially expressed in M2-specific macrophages and highlight the importance of macrophage function in both the primary GC and peritoneal microenvironments.
The M2TS assessment in the TCGA stomach cancer cohort provides significant insights into the immune states of the four genomically stable (GS) molecular subtypes of GC [44] that can predict survival and response to therapy [45]. Diffuse type GC is predominately categorized in the GS molecular subtype. GS diffuse type of GC with SRC features has a higher risk of peritoneal recurrence after curative therapy and is relatively resistant to immunotherapy. RNA transcriptional data from the TCGA stomach cancer dataset show that our M2TS is identifiable in 341 entries of primary GC, and high M2TS expression is associated with diffuse type GC. These results add to the current knowledge of the absence of immunogenicity in diffuse phenotypes of GS tumors. M1 and cytolytic T-cell gene signatures were also more likely to be present in diffuse type and SRC GC compared to other histologic types (Supplementary Figure S1). While it is difficult to discern the molecular drivers of poor outcomes by looking at one time point of transcriptomic immune activity, overall, our findings suggest a potentially more immunologically active milieu in diffuse and SRC GC compared to intestinal GC. However, comparing the expressions of each immune subset gene signatures within various primary histologies demonstrates that M2TS is the most highly expressed of the immune signatures (Figure 1B). Moreover, only M2TS was significantly associated with OS, while M1TS and CTLTS were not (Figure 2). Therefore, the immune milieu of GC appears polarized in a M2TS-dominant state that drives the overall condition of the TME.
The association of M2TS with diffuse type and the poor prognosis associated with high M2TS expression in peritoneal fluid are consistent with the current understanding of GCPM, which is the leading cause of therapeutic failure and death. Our prospectively collected peritoneal fluid samples included a heterogenous GC patient population who was both naïve to treatment or received multiple lines of systemic therapy and had either the presence or absence of gross peritoneal tumors, malignant ascites, occult peritoneal cytology positive disease, or fluid cytology negative for malignant cells. Using scRNA-seq analyses of immune transcriptomic signatures, we identified patients with high or low expression of M2TS, including multiple subsets of macrophages expressing varying M2TS. We then validated high M2TS expression in the peritoneal fluid to be associated with poorer OS than patients with lower expression levels (Figure 3). Through univariate analysis, we verified that high M2TS expression is significantly associated with an increased mortality risk (Table 2). Multivariate analysis, including the stage, history of curative resection, tumor differentiation, and microsatellite status, identified M2TS as an independent factor of worse survival (Table 3). These findings highlight the negative impact of a severely immunosuppressive M2 transcriptional state in the peritoneum with regards to disease progression and patient death.
Studies have shown that TAM infiltration in primary GC, defined by IHC staining of single markers such as CD68, is associated with worse survival, possibly by increasing invasiveness via β-catenin [46]. TAMs, defined as CD163+ cells in the tumor stroma and at the margin, were associated with worse survival. These TAMs expressed elevated levels of CXCL12 [47], a chemokine found in immunosuppressive microenvironments [48], suggesting an immunosuppressive function of macrophages. IHC staining has demonstrated an association of TAMs with survival in GC [12,13,14]. However, each of these studies has used 1–2 surface staining markers such as either CD68 or CD163 to define M2 macrophages and therefore do not describe the functional or specific phenotype of TAMs. The use of these markers to define M2 macrophages is nonspecific as there are multiple subtypes of M2 macrophages that are CD68+ or CD163+ with varying immunosuppressive capacity [49]. Conversely, M2TS, a measure of transcriptional expression using genes from multiple functional categories, better describes the functional status of M2 immunosuppressive macrophages. The finding of CD68+CD163+ macrophages from our peritoneal sample cohort with a wide range of M2TS expression (Figure 3B) is consistent with a continuum or spectrum of macrophage polarization, with M2TS high cells representing a highly immunosuppressive polarized subset of CD68+CD163+ macrophages. In our study, expression of single genes CD68 or CD163 was also not associated with survival (Supplementary Figure S2). However, combining markers to define polarization of macrophages is likely an improved way to delineate the most immunosuppressive M2 macrophages [21], and M2TS combination of genes was predictive, while the single TAM genes, likely representing a range of functionally diverse macrophages, were not.
In a previous single-cell transcriptional characterization of GCPM, more M2 macrophages were found in tumors defined as ‘gastric dominant’ versus ‘GI mixed’, and the ‘gastric dominant’ tumors had worse survival [50]. Another multiplex profiling of PM from GC [51] demonstrated a lower relative fraction of monocytes in diffuse GC compared to intestinal and lower monocyte fraction in SRC compared to NOS samples. These findings suggest that monocyte or macrophage functional polarization and phenotype, rather than total population number or fractional proportion, are the primary driver of the immune microenvironment. The study also described ascites samples characterized as a ‘mesenchymal-like’ phenotype with elevated TIM-3 expression and a higher fraction of cytolytic lymphocytes compared to ‘epithelial-like’ phenotypes; the ‘mesenchymal-like’ phenotype had a greater incidence of non-response to chemotherapy. This higher level of TIM-3 checkpoint expression, despite the presence of cytolytic lymphocytes, suggests an immunosuppressive driver in patients with a poor prognosis, given the lack of response to chemotherapy. These studies are, therefore, overall consistent with our findings of the association of immunosuppressive macrophage transcriptional expression with survival, although we have more directly demonstrated this association both in primary GC and peritoneal samples.
One limitation of our study is some incomplete clinical data regarding the PD-L1 and microsatellite status of some patients, as these were not routinely tested on every patient during the collection period. Another limitation is that it is challenging to discern molecular drivers of poor outcomes by looking at a single time point of transcriptomic immune activity. Our results suggest a potentially more immunologically active milieu in diffuse and SRC GC than intestinal GC, given the elevation of each signature level. However, they also indicate that an M2TS dominant state, not consisting of the amount of infiltrating immune cells but rather the transcriptomic status of immune cells, affects OS of GC patients. An additional limitation is the inability to determine whether these tumor and histological classifications directly cause the increased immunosuppressive phenotype of the M2 macrophages or vice versa. But the association of the M2-defining macrophage transcriptional signature with these poor prognostic factors is consistent with its prognostic ability of OS and DFI in primary GC. Another study has shown an association of diffuse histology with an immune desert immunophenotype, lacking significant T-cell infiltration within the tumor [10], which would allow for increased immunosuppressive influence from macrophages in tumors with diffuse histology.
Identification of this transcriptional signature provides opportunities to improve prognostic accuracy and guide the design of future interventional trials. Several drugs are currently under preclinical development and early-phase clinical trials that aim to repolarize M2 macrophages to immune-activating M1 macrophages. For example, colony-stimulating factor 1 (CSF1) or CSF1 receptor (CSF1R) blockade has been shown to repolarize M2 to M1 macrophages and increase tumor sensitivity to other immunotherapies [52,53]. Clinically available drugs targeting CSF1 or CSF1R include pexidartinib, which repolarizes M2 macrophages [54] and has demonstrated safety and activity in a phase 3 trial [55] resulting in the first available systemic therapy available for tenosynovial giant cell tumors. Another type of CSF1 therapy, cabiralizumab, has shown safety in combination with other immunotherapies in a phase 1 trial for several cancer types [56]. A different strategy of macrophage polarization targets the C-C motif chemokine ligand 2 (CCL2)/C-C motif chemokine receptor 2 (CCR2) axis with available drugs such as carlumab, which was well tolerated but not effective in a phase 2 trial of efficacy in metastatic castration-resistant prostate cancer [57]. Another novel strategy uses anti-CD47 antibodies that block the “do not eat me” CD47 and signal regulatory protein alpha (SIRPα) interactions that allow for tumor cell evasion of phagocytosis. Clinically available anti-CD47 therapeutic antibodies include Hu5F9-G4, which was safe and tolerated in phase 1 trials in lymphoma [58] and solid tumors [59]. Several clinically available drugs targeting metabolic pathways used in other diseases, including perhexiline and VLX600, have been shown to repolarize M2 to M1 macrophages [60]. Preclinical studies of alternative therapies such as BMS-794833 [61] or mannose receptor (CD206) conformational switching by RP-182 [62] have shown the ability to repolarize macrophages. They can be studied to determine the effects on macrophages and, ultimately, GC patient outcomes.
The M2TS signature can potentially be used as a prognostic biomarker using samples collected during either the biopsy of the primary tumor during endoscopy, or during diagnostic laparoscopy already routinely performed for staging newly diagnosed GC [42], obviating the need for a new procedure or specimen collection. As our prospective cohort included cytology-negative patients, elevation of the M2TS macrophage transcriptional signature in the peritoneal fluid could potentially represent an even more sensitive prognostic indicator of GC outcomes than cytology; future work will compare cytology status with M2TS macrophage signature in prognostic ability. Nonetheless, the addition of M2TS macrophage transcriptional status to other prognostic factors, including stage, histology, and cytology status, may allow for a more accurate overall prediction of disease biology and influence the aggressiveness and modality (for example, chemotherapy versus immunotherapy) of treatment. Future work will evaluate changes and responses in M2TS status after treatment with chemotherapy, immunotherapy, or both. Because the transcriptional signature includes many genes involved in immunosuppressive functions of macrophages, one or a combination of the associated M2TS genes may be suitable for future investigations targeting this subset of macrophages.
In conclusion, our study highlights the clinical significance of a novel M2TS in GC associated with a severely immunosuppressive immune phenotype in the local, regional, and systemic TME. The collection of genes representing immunosuppressive functions of macrophages directly implicates a specific phenotype of macrophages in poor prognosis, compared to previous studies that may include a spectrum of macrophage functions. We propose M2TS as a promising and versatile immune biomarker predictive of GC patient outcomes across TNM stages that can be obtained from specimens already collected during diagnosis and staging of GC. High M2TS expression can be evaluated by next-generation sequencing of biopsy specimens obtained from the primary tumor or transcriptomic evaluation of “liquid biopsies” of blood and peritoneal fluid and enrich novel therapeutic interventions for M2 targets.

4. Materials and Methods

4.1. The Cancer Genome Atlas (TCGA) Stomach Cancer Dataset Analysis

Gene expression profiles for primary gastric adenocarcinomas were obtained from the TCGA stomach cohort and analyzed using the University of California Santa Cruz (UCSC) Xena visualization web tool (https://xena.ucsc.edu, accessed on 15 August 2021). [63]. We applied filters to the dataset to exclude low sample size (defined as less than five entries), “discrepancy”, or “unknown entries” before analysis.

4.2. Prospective Cohort of Peritoneal Samples

Ascites or peritoneal washing samples were prospectively collected from 28 patients undergoing diagnostic laparoscopy or paracentesis (diagnostic or therapeutic) for biopsy-proven gastric adenocarcinoma (stage I–IV) with or without peritoneal metastases. Inclusion criteria were an age greater than 18 years old and known diagnosis of gastric cancer. The exclusion criterion was the inability to give consent. Gross peritoneal disease was neither considered inclusion nor exclusion criteria. During diagnostic laparoscopy, peritoneal specimens were collected after lavage with ~1000 mL of normal saline with laparoscopic access. For GC patients with peritoneal carcinomatosis and malignant ascites, up to 5 L of the discarded ascites collected during a paracentesis was obtained. The first 80 mL–160 mL of the specimens was sent to pathology for routine cytologic evaluation. The remaining samples were immediately placed on wet ice for single-cell processing. The fluid was spun down, and the cell pellet was collected and resuspended in phosphate-buffered saline (PBS, pH 7.4). The cell count was obtained and prepared for single-cell RNA sequencing (scRNA-seq) using the Chromium Single-Cell 3′ Gene Expression System from 10X Genomics (Pleasanton, CA, USA).

4.3. Single-Cell RNA Sequencing

Single cell whole transcriptome profiling of peritoneal cells was performed using the Chromium Single-Cell 3′ Gene Expression system from 10X Genomics. Single cells were resuspended in PBS buffer at 106 cells/mL and loaded onto Chromium chips. Single-cell capturing, barcoding, and cDNA library preparation were performed using the Chromium Single-Cell 3′ Library & Gel Bead Kit v2 (10X Genomics, Pleasanton, CA, USA) per manufacturer protocol. The final sequencing libraries were checked for quality on Agilent 4200 Tapestation System (Santa Clara, CA, USA) and quantified by fluorometry staining (QuBit) assay. Libraries were sequenced on a HiSeq4000 (Illumina, San Diego, CA, USA) at a depth of ~50,000 reads per cell. The scRNA-seq was analyzed using standard Seurat v3 [64] integration workflow. Top 2000 variated features were selected to find anchors between pairs of datasets. The integrated dataset was dimension-reduced and visualized using the Uniform Manifold Approximation and Projection (UMAP) with top 30 principal components. All cells are clustered using the original Louvain algorithm. Dot plots, violin plots, and heatmaps were generated using the R Seurat package (version 5). The scRNA-seq data are available at Gene Expression Omnibus (GEO), GSE228598.

4.4. Single-Cell Type Identification

We performed a two-layer analysis to identify single cells from the peritoneal biospecimen that were macrophages. First, we used well-established macrophage markers (CD68+), then performed gene clustering analysis to determine differential gene clusters within the macrophages that differentiate M1 (CCL19+CCR7+), M2 (CD68+CD163+), and others that did not fall into the M1 and M2 clusters. Finally, we investigated the survival differences between patients whose peritoneal cells overexpressed M2TS and those who did not.

4.5. Statistical Analysis

Histological subtypes and signature expressions were evaluated using ANOVA or t-test where appropriate. We defined p < 0.05 as significant. Each transcriptional signature was quantified as a composite total expression of total gene expression within the signature. Peritoneal samples were stratified into high (≥39.23 counts per 10K (CP10K)) or low (less than 39.23 CP10K) M2TS expression of these selected genes based on total expression of transcriptional signatures. The cutoff point (39.23 CP10K) was determined by the lowest p-value in the log-ranking test using CutoffFinder (http://molpath.charite.de/cutoff, accessed on 10 July 2022) [65], a systematic optimization method for biomarker cutoff determination. Comparisons of clinicopathologic characteristics between patient groups (M2TS High vs. M2TS Low) were analyzed using Fisher’s exact test for categorical variables, and Wilcoxon test for continuous variables. For both TCGA and the scRNA-seq analysis, we used a log-rank test to compare Kaplan–Meier curves for OS and the disease-free interval (DFI), comparing the highest and lowest quartiles of transcriptional signature expression in the TCGA analysis. Univariate Cox regression analysis was performed to determine significant factors for survival. Based on the univariate analysis result, we used the significant factor M2TS signature and microsatellite status for the multivariate Cox regression analysis model. The factors of resection status, stage, and differentiation which were close to significant (p ≤ 0.1) or significant (p < 0.05) on univariate were included in the multivariate model.

5. Conclusions

Macrophages and T-lymphocytes each perform important interactions and functions in the GC TME. This study has demonstrated that a highly immunosuppressive phenotype of macrophages, defined by high expression of the combination of genes, predicts poor outcomes when present in both primary GC and the peritoneum of GC patients. While understanding the proportions of each cell type is important, a deeper understanding of the functional phenotype of the cell populations present is critical to be able to potentially design therapies for the most influential cell types or predict the biology of the disease or response to therapy.

Supplementary Materials

The following supporting information can be downloaded at: https://www.mdpi.com/article/10.3390/ijms25074117/s1.

Author Contributions

Concept and design: K.M.S. and Y.W. Collection and assembly of data: K.M.S., A.Y., Z.Z., R.R.M., K.M.M., H.H. and Y.W. Data analysis and interpretation: K.M.S., H.L., K.M.M., H.H., Z.Z., I.B.P., D.V.H., H.H., Y.F. and Y.W. Manuscript writing: K.M.S., H.L., Y.-C.Y. and Y.W. Final approval of manuscript: Y.W. All authors are accountable for all aspects of this work. All authors have read and agreed to the published version of the manuscript.

Funding

This work was supported by the DOD Idea Award under grant W81XWH-19-1-0225.

Institutional Review Board Statement

All procedures were performed according to the principles expressed in the Declaration of Helsinki. All procedures followed were in accordance with the ethical standards of the responsible committee on human experimentation (institutional and national) and with the Helsinki Declaration of 1964 and later versions. Peritoneal fluid samples were collected after patients signed a written informed consent approved by the City of Hope Institutional Review Board (IRB) under protocols 19127 (approved on 15 April 2019) and 18209 (approved on 10 July 2018).

Informed Consent Statement

Informed consent was obtained from all subjects involved in the study.

Data Availability Statement

The data accessed and utilized from primary gastric cancer samples is available from The Cancer Genome Atlas Project. The single-cell RNA sequencing data supporting the conclusion of this article are available in the Gene Expression Omnibus Repository, GSE228598.

Acknowledgments

The authors acknowledge the members of Bioinformatics Core, the leadership, and staff of the City of Hope Center for Informatics for POSEIDON (Precision Oncology Software Environment Interoperable Data Ontologies Network) data exploration, visualization, and analysis; for access to the HPRCC (High Performance Research Compute Center) resource; and for TBI (Translational Bioinformatics) support and training. The authors also acknowledge the Fong and Woo labs members and Supriya Deshpande, for their contributions.

Conflicts of Interest

Von Hoff—Employment at McKesson; Stock and other ownership interests in Medtronic, CerRx, SynRevRx, United Healthcare, Anthem Inc., Stromatis Pharma, Systems Oncology, Stingray Therapeutics, FORMA Therapeutics, Orpheus Bioscience, AADi, and Origin Commercial Advisors; Consulting or advisory role at DNAtrix, Imaging Endpoints, Immodulon Therapeutics, Senhwa Bioscience, Tolero Pharmaceuticals, Alpha Cancer Technologies, CanBas, Lixte Biotechnology, Oncolyze, RenovoRx, TD2, Aptose Bioscience, CV6 Therapeutics, EMD Serono, Fujifilm, Phosplatin Therapeutics, SOTIO, Synergene, Geistlich Pharma, HUYA Bioscience International, Immunophotonics, Genzada Pharmaceuticals, L.E.A.F. Pharmaceuticals, Oncology Venture, Verily, Athenex, Novita Pharmaceuticals, Victus Therapeutics, Codiak Bioscience, Agenus, RadImmune, Samumed, BioXCel Therapeutics, Bryologyx, Sirnaomics, AiMed, Corcept Therapeutics, Erimos Pharmaceuticals, Gimbal, Pfizer, GiraFPharma, Axis Therapeutics, ImmuneOncia, Orphagen Pharmaceuticals, Viracta Pharmaceuticals, AlaMab Therapeutics, Avesta76 Therapeutics, NeoTx, Xerient, Decoy Biosystems, Noxxon Pharma, Reflexion Medical, Reglagene, Lycia Therapeutics, NGM Biopharmaceuticals, Coordination pharmaceuticals, EXACT Therapeutics, Nirogy Therapeutics, Seattle Genetics, Agastiya Biotech, Amunix, Atalion Therapeutics, Cytocom, GlaxoSmithKline, ImaginAb, Signablok, SonaCare Medical, Caribou Bioscience, Xenter, Compass Therapeutics, Vivacitas Oncology, Sumitomo Dainippon Pharma Oncology, OnQuality Pharmaceuticals, Sellas Life Sciences, Catamaran Bio, and Thirona Bioscience; Research funding from Lilly, Genentech, Celgene, Incyte, Merrimack, Plexxikon, Minneamrita Therapeutics, Abbvie, Aduro Biotech, Cleave Bioscience, CytRx Corporation, Daiichi Sankyo, Deciphera, Endocyte, Exelixis, Five Prime Therapeutics, Gilead Sciences, Merck, Pfizer, Pharmacyclics, Phoenix Biotech, Samumed, Strategia, and Halozyme. Fong—Paid scientific consultant for Medtronics, Johnson & Johnson, and Imugene; Receives royalties for inventions from Merck and Imugene. Woo—Scientific advisor for Imugene and J&J Ethicon. All other authors have no competing interests.

References

  1. Ferlay, J.; Ervik, M.; Lam, F.; Laversanne, M.; Colombet, M.; Mery, L.; Piñeros, M.; Znaor, A.; Soerjomataram, I.; Bray, F. Global Cancer Observatory: Cancer Today (Version 1.1); International Agency for Research on Cancer: Lyon, France, 2024; Available online: https://gco.iarc.who.int/today (accessed on 14 March 2024).
  2. Thrift, A.P.; El-Serag, H.B. Burden of Gastric Cancer. Clin. Gastroenterol. Hepatol. Off. Clin. Pract. J. Am. Gastroenterol. Assoc. 2020, 18, 534–542. [Google Scholar] [CrossRef] [PubMed]
  3. Sato, Y.; Wada, I.; Odaira, K.; Hosoi, A.; Kobayashi, Y.; Nagaoka, K.; Karasaki, T.; Matsushita, H.; Yagi, K.; Yamashita, H.; et al. Integrative immunogenomic analysis of gastric cancer dictates novel immunological classification and the functional status of tumor-infiltrating cells. Clin. Transl. Immunol. 2020, 9, e1194. [Google Scholar] [CrossRef]
  4. Shitara, K.; Van Cutsem, E.; Bang, Y.J.; Fuchs, C.; Wyrwicz, L.; Lee, K.W.; Kudaba, I.; Garrido, M.; Chung, H.C.; Lee, J.; et al. Efficacy and Safety of Pembrolizumab or Pembrolizumab Plus Chemotherapy vs Chemotherapy Alone for Patients with First-line, Advanced Gastric Cancer: The KEYNOTE-062 Phase 3 Randomized Clinical Trial. JAMA Oncol. 2020, 6, 1571–1580. [Google Scholar] [CrossRef]
  5. Janjigian, Y.Y.; Kawazoe, A.; Yañez, P.; Li, N.; Lonardi, S.; Kolesnik, O.; Barajas, O.; Bai, Y.; Shen, L.; Tang, Y.; et al. The KEYNOTE-811 trial of dual PD-1 and HER2 blockade in HER2-positive gastric cancer. Nature 2021, 600, 727–730. [Google Scholar] [CrossRef] [PubMed]
  6. Fuchs, C.S.; Doi, T.; Jang, R.W.; Muro, K.; Satoh, T.; Machado, M.; Sun, W.; Jalal, S.I.; Shah, M.A.; Metges, J.P.; et al. Safety and Efficacy of Pembrolizumab Monotherapy in Patients with Previously Treated Advanced Gastric and Gastroesophageal Junction Cancer: Phase 2 Clinical KEYNOTE-059 Trial. JAMA Oncol. 2018, 4, e180013. [Google Scholar] [CrossRef]
  7. Jiang, H.; Shi, Z.; Wang, P.; Wang, C.; Yang, L.; Du, G.; Zhang, H.; Shi, B.; Jia, J.; Li, Q.; et al. Claudin18.2-Specific Chimeric Antigen Receptor Engineered T Cells for the Treatment of Gastric Cancer. J. Natl. Cancer Inst. 2019, 111, 409–418. [Google Scholar] [CrossRef] [PubMed]
  8. Sugawara, K.; Iwai, M.; Yajima, S.; Tanaka, M.; Yanagihara, K.; Seto, Y.; Todo, T. Efficacy of a Third-Generation Oncolytic Herpes Virus G47Δ in Advanced Stage Models of Human Gastric Cancer. Mol. Ther. Oncolytics 2020, 17, 205–215. [Google Scholar] [CrossRef]
  9. Zeng, D.; Zhou, R.; Yu, Y.; Luo, Y.; Zhang, J.; Sun, H.; Bin, J.; Liao, Y.; Rao, J.; Zhang, Y.; et al. Gene expression profiles for a prognostic immunoscore in gastric cancer. Br. J. Surg. 2018, 105, 1338–1348. [Google Scholar] [CrossRef]
  10. Kim, T.S.; da Silva, E.; Coit, D.G.; Tang, L.H. Intratumoral Immune Response to Gastric Cancer Varies by Molecular and Histologic Subtype. Am. J. Surg. Pathol. 2019, 43, 851–860. [Google Scholar] [CrossRef]
  11. Wu, M.; Wang, Y.; Liu, H.; Song, J.; Ding, J. Genomic analysis and clinical implications of immune cell infiltration in gastric cancer. Biosci. Rep. 2020, 40, BSR20193308. [Google Scholar] [CrossRef]
  12. Zhang, H.; Wang, X.; Shen, Z.; Xu, J.; Qin, J.; Sun, Y. Infiltration of diametrically polarized macrophages predicts overall survival of patients with gastric cancer after surgical resection. Gastric Cancer Off. J. Int. Gastric Cancer Assoc. Jpn. Gastric Cancer Assoc. 2015, 18, 740–750. [Google Scholar] [CrossRef] [PubMed]
  13. Yamaguchi, T.; Fushida, S.; Yamamoto, Y.; Tsukada, T.; Kinoshita, J.; Oyama, K.; Miyashita, T.; Tajima, H.; Ninomiya, I.; Munesue, S.; et al. Tumor-associated macrophages of the M2 phenotype contribute to progression in gastric cancer with peritoneal dissemination. Gastric Cancer Off. J. Int. Gastric Cancer Assoc. Jpn. Gastric Cancer Assoc. 2016, 19, 1052–1065. [Google Scholar] [CrossRef] [PubMed]
  14. Yin, S.; Huang, J.; Li, Z.; Zhang, J.; Luo, J.; Lu, C.; Xu, H.; Xu, H. The Prognostic and Clinicopathological Significance of Tumor-Associated Macrophages in Patients with Gastric Cancer: A Meta-Analysis. PLoS ONE 2017, 12, e0170042. [Google Scholar] [CrossRef] [PubMed]
  15. Huang, X.; Pan, Y.; Ma, J.; Kang, Z.; Xu, X.; Zhu, Y.; Chen, J.; Zhang, W.; Chang, W.; Zhu, J. Prognostic significance of the infiltration of CD163(+) macrophages combined with CD66b(+) neutrophils in gastric cancer. Cancer Med. 2018, 7, 1731–1741. [Google Scholar] [CrossRef] [PubMed]
  16. Sakamoto, S.; Kagawa, S.; Kuwada, K.; Ito, A.; Kajioka, H.; Kakiuchi, Y.; Watanabe, M.; Kagawa, T.; Yoshida, R.; Kikuchi, S.; et al. Intraperitoneal cancer-immune microenvironment promotes peritoneal dissemination of gastric cancer. Oncoimmunology 2019, 8, e1671760. [Google Scholar] [CrossRef] [PubMed]
  17. Boutilier, A.J.; Elsawa, S.F. Macrophage Polarization States in the Tumor Microenvironment. Int. J. Mol. Sci. 2021, 22, 6995. [Google Scholar] [CrossRef] [PubMed]
  18. Murray, P.J. Macrophage Polarization. Annu. Rev. Physiol. 2017, 79, 541–566. [Google Scholar] [CrossRef] [PubMed]
  19. Guerriero, J.L. Macrophages: The Road Less Traveled, Changing Anticancer Therapy. Trends Mol. Med. 2018, 24, 472–489. [Google Scholar] [CrossRef]
  20. Barros, M.H.; Hauck, F.; Dreyer, J.H.; Kempkes, B.; Niedobitek, G. Macrophage polarisation: An immunohistochemical approach for identifying M1 and M2 macrophages. PLoS ONE 2013, 8, e80908. [Google Scholar] [CrossRef] [PubMed]
  21. Murray, P.J.; Allen, J.E.; Biswas, S.K.; Fisher, E.A.; Gilroy, D.W.; Goerdt, S.; Gordon, S.; Hamilton, J.A.; Ivashkiv, L.B.; Lawrence, T.; et al. Macrophage activation and polarization: Nomenclature and experimental guidelines. Immunity 2014, 41, 14–20. [Google Scholar] [CrossRef]
  22. Martinez, F.O.; Gordon, S.; Locati, M.; Mantovani, A. Transcriptional Profiling of the Human Monocyte-to-Macrophage Differentiation and Polarization: New Molecules and Patterns of Gene Expression. J. Immunol. 2006, 177, 7303–7311. [Google Scholar] [CrossRef] [PubMed]
  23. Orecchioni, M.; Ghosheh, Y.; Pramod, A.B.; Ley, K. Macrophage Polarization: Different Gene Signatures in M1(LPS+) vs. Classically and M2(LPS−) vs. Alternatively Activated Macrophages. Front. Immunol. 2019, 10, 1084. [Google Scholar] [CrossRef] [PubMed]
  24. Badylak, S.F.; Valentin, J.E.; Ravindra, A.K.; McCabe, G.P.; Stewart-Akers, A.M. Macrophage phenotype as a determinant of biologic scaffold remodeling. Tissue Eng. Part A 2008, 14, 1835–1842. [Google Scholar] [CrossRef] [PubMed]
  25. Buscher, K.; Ehinger, E.; Gupta, P.; Pramod, A.B.; Wolf, D.; Tweet, G.; Pan, C.; Mills, C.D.; Lusis, A.J.; Ley, K. Natural variation of macrophage activation as disease-relevant phenotype predictive of inflammation and cancer survival. Nat. Commun. 2017, 8, 16041. [Google Scholar] [CrossRef] [PubMed]
  26. Gu, Q.; Zhou, S.; Chen, C.; Wang, Z.; Xu, W.; Zhang, J.; Wei, S.; Yang, J.; Chen, H. CCL19: A novel prognostic chemokine modulates the tumor immune microenvironment and outcomes of cancers. Aging 2023, 15, 12369–12387. [Google Scholar] [CrossRef] [PubMed]
  27. Correale, P.; Rotundo, M.S.; Botta, C.; Del Vecchio, M.T.; Ginanneschi, C.; Licchetta, A.; Conca, R.; Apollinari, S.; De Luca, F.; Tassone, P.; et al. Tumor infiltration by T lymphocytes expressing chemokine receptor 7 (CCR7) is predictive of favorable outcome in patients with advanced colorectal carcinoma. Clin. Cancer Res. Off. J. Am. Assoc. Cancer Res. 2012, 18, 850–857. [Google Scholar] [CrossRef] [PubMed]
  28. Zhang, H.; Wang, Y.; Zhao, Y.; Liu, T.; Wang, Z.; Zhang, N.; Dai, Z.; Wu, W.; Cao, H.; Feng, S.; et al. PTX3 mediates the infiltration, migration, and inflammation-resolving-polarization of macrophages in glioblastoma. CNS Neurosci. Ther. 2022, 28, 1748–1766. [Google Scholar] [CrossRef] [PubMed]
  29. Rőszer, T. Understanding the Mysterious M2 Macrophage through Activation Markers and Effector Mechanisms. Mediat. Inflamm. 2015, 2015, 816460. [Google Scholar] [CrossRef] [PubMed]
  30. Väyrynen, J.P.; Haruki, K.; Lau, M.C.; Väyrynen, S.A.; Zhong, R.; Dias Costa, A.; Borowsky, J.; Zhao, M.; Fujiyoshi, K.; Arima, K.; et al. The Prognostic Role of Macrophage Polarization in the Colorectal Cancer Microenvironment. Cancer Immunol. Res. 2021, 9, 8–19. [Google Scholar] [CrossRef]
  31. Li, Y.; Shen, Z.; Chai, Z.; Zhan, Y.; Zhang, Y.; Liu, Z.; Liu, Y.; Li, Z.; Lin, M.; Zhang, Z.; et al. Targeting MS4A4A on tumour-associated macrophages restores CD8+ T-cell-mediated antitumour immunity. Gut 2023, 72, 2307–2320. [Google Scholar] [CrossRef]
  32. Sanyal, R.; Polyak, M.J.; Zuccolo, J.; Puri, M.; Deng, L.; Roberts, L.; Zuba, A.; Storek, J.; Luider, J.M.; Sundberg, E.M.; et al. MS4A4A: A novel cell surface marker for M2 macrophages and plasma cells. Immunol. Cell Biol. 2017, 95, 611–619. [Google Scholar] [CrossRef] [PubMed]
  33. Yang, P.; Qin, H.; Li, Y.; Xiao, A.; Zheng, E.; Zeng, H.; Su, C.; Luo, X.; Lu, Q.; Liao, M.; et al. CD36-mediated metabolic crosstalk between tumor cells and macrophages affects liver metastasis. Nat. Commun. 2022, 13, 5782. [Google Scholar] [CrossRef] [PubMed]
  34. Su, P.; Wang, Q.; Bi, E.; Ma, X.; Liu, L.; Yang, M.; Qian, J.; Yi, Q. Enhanced Lipid Accumulation and Metabolism Are Required for the Differentiation and Activation of Tumor-Associated Macrophages. Cancer Res. 2020, 80, 1438–1450. [Google Scholar] [CrossRef] [PubMed]
  35. Su, C.; Jia, S.; Ma, Z.; Zhang, H.; Wei, L.; Liu, H. HMGB1 Promotes Lymphangiogenesis through the Activation of RAGE on M2 Macrophages in Laryngeal Squamous Cell Carcinoma. Dis. Markers 2022, 2022, 4487435. [Google Scholar] [CrossRef] [PubMed]
  36. Wu, Y.; Yang, S.; Ma, J.; Chen, Z.; Song, G.; Rao, D.; Cheng, Y.; Huang, S.; Liu, Y.; Jiang, S.; et al. Spatiotemporal Immune Landscape of Colorectal Cancer Liver Metastasis at Single-Cell Level. Cancer Discov. 2022, 12, 134–153. [Google Scholar] [CrossRef] [PubMed]
  37. Korbecki, J.; Grochans, S.; Gutowska, I.; Barczak, K.; Baranowska-Bosiacka, I. CC Chemokines in a Tumor: A Review of Pro-Cancer and Anti-Cancer Properties of Receptors CCR5, CCR6, CCR7, CCR8, CCR9, and CCR10 Ligands. Int. J. Mol. Sci. 2020, 21, 7619. [Google Scholar] [CrossRef] [PubMed]
  38. Kamat, K.; Krishnan, V.; Dorigo, O. Macrophage-derived CCL23 upregulates expression of T-cell exhaustion markers in ovarian cancer. Br. J. Cancer 2022, 127, 1026–1033. [Google Scholar] [CrossRef] [PubMed]
  39. Krishnan, V.; Tallapragada, S.; Schaar, B.; Kamat, K.; Chanana, A.M.; Zhang, Y.; Patel, S.; Parkash, V.; Rinker-Schaeffer, C.; Folkins, A.K.; et al. Omental macrophages secrete chemokine ligands that promote ovarian cancer colonization of the omentum via CCR1. Commun. Biol. 2020, 3, 524. [Google Scholar] [CrossRef] [PubMed]
  40. Yuan, X.; Li, Y.; Zhang, A.Z.; Jiang, C.H.; Li, F.P.; Xie, Y.F.; Li, J.F.; Liang, W.H.; Zhang, H.J.; Liu, C.X.; et al. Tumor-associated macrophage polarization promotes the progression of esophageal carcinoma. Aging 2020, 13, 2049–2072. [Google Scholar] [CrossRef]
  41. Yan, J.; Kong, L.Y.; Hu, J.; Gabrusiewicz, K.; Dibra, D.; Xia, X.; Heimberger, A.B.; Li, S. FGL2 as a Multimodality Regulator of Tumor-Mediated Immune Suppression and Therapeutic Target in Gliomas. J. Natl. Cancer Inst. 2015, 107, djv137. [Google Scholar] [CrossRef]
  42. Ajani, J.A.; D’Amico, T.A.; Bentrem, D.J.; Chao, J.; Cooke, D.; Corvera, C.; Das, P.; Enzinger, P.C.; Enzler, T.; Fanta, P.; et al. Gastric Cancer, Version 2.2022, NCCN Clinical Practice Guidelines in Oncology. J. Natl. Compr. Cancer Netw. JNCCN 2022, 20, 167–192. [Google Scholar] [CrossRef] [PubMed]
  43. Zhang, X.; Liu, H.; Zhang, J.; Wang, Z.; Yang, S.; Liu, D.; Liu, J.; Li, Y.; Fu, X.; Zhang, X. Fibronectin-1: A Predictive Immunotherapy Response Biomarker for Muscle-Invasive Bladder Cancer. Arch. Esp. Urol. 2023, 76, 70–83. [Google Scholar] [CrossRef] [PubMed]
  44. Cancer Genome Atlas Research Network. Comprehensive molecular characterization of gastric adenocarcinoma. Nature 2014, 513, 202–209. [Google Scholar] [CrossRef] [PubMed]
  45. Sohn, B.H.; Hwang, J.E.; Jang, H.J.; Lee, H.S.; Oh, S.C.; Shim, J.J.; Lee, K.W.; Kim, E.H.; Yim, S.Y.; Lee, S.H.; et al. Clinical Significance of Four Molecular Subtypes of Gastric Cancer Identified by the Cancer Genome Atlas Project. Clin. Cancer Res. Off. J. Am. Assoc. Cancer Res. 2017, 23, 4441–4449. [Google Scholar] [CrossRef]
  46. Wu, M.H.; Lee, W.J.; Hua, K.T.; Kuo, M.L.; Lin, M.T. Macrophage Infiltration Induces Gastric Cancer Invasiveness by Activating the β-Catenin Pathway. PLoS ONE 2015, 10, e0134122. [Google Scholar] [CrossRef] [PubMed]
  47. Park, J.Y.; Sung, J.Y.; Lee, J.; Park, Y.K.; Kim, Y.W.; Kim, G.Y.; Won, K.Y.; Lim, S.J. Polarized CD163+ tumor-associated macrophages are associated with increased angiogenesis and CXCL12 expression in gastric cancer. Clin. Res. Hepatol. Gastroenterol. 2016, 40, 357–365. [Google Scholar] [CrossRef] [PubMed]
  48. Seo, Y.D.; Jiang, X.; Sullivan, K.M.; Jalikis, F.G.; Smythe, K.S.; Abbasi, A.; Vignali, M.; Park, J.O.; Daniel, S.K.; Pollack, S.M.; et al. Mobilization of CD8(+) T Cells via CXCR4 Blockade Facilitates PD-1 Checkpoint Therapy in Human Pancreatic Cancer. Clin. Cancer Res. Off. J. Am. Assoc. Cancer Res. 2019, 25, 3934–3945. [Google Scholar] [CrossRef] [PubMed]
  49. Wang, L.-X.; Zhang, S.-X.; Wu, H.-J.; Rong, X.-L.; Guo, J. M2b macrophage polarization and its roles in diseases. J. Leukoc. Biol. 2019, 106, 345–358. [Google Scholar] [CrossRef] [PubMed]
  50. Wang, R.; Dang, M.; Harada, K.; Han, G.; Wang, F.; Pool Pizzi, M.; Zhao, M.; Tatlonghari, G.; Zhang, S.; Hao, D.; et al. Single-cell dissection of intratumoral heterogeneity and lineage diversity in metastatic gastric adenocarcinoma. Nat. Med. 2021, 27, 141–151. [Google Scholar] [CrossRef] [PubMed]
  51. Wang, R.; Song, S.; Harada, K.; Ghazanfari Amlashi, F.; Badgwell, B.; Pizzi, M.P.; Xu, Y.; Zhao, W.; Dong, X.; Jin, J.; et al. Multiplex profiling of peritoneal metastases from gastric adenocarcinoma identified novel targets and molecular subtypes that predict treatment response. Gut 2020, 69, 18–31. [Google Scholar] [CrossRef]
  52. Pyonteck, S.M.; Akkari, L.; Schuhmacher, A.J.; Bowman, R.L.; Sevenich, L.; Quail, D.F.; Olson, O.C.; Quick, M.L.; Huse, J.T.; Teijeiro, V.; et al. CSF-1R inhibition alters macrophage polarization and blocks glioma progression. Nat. Med. 2013, 19, 1264–1272. [Google Scholar] [CrossRef]
  53. Zhu, Y.; Yang, J.; Xu, D.; Gao, X.-M.; Zhang, Z.; Hsu, J.L.; Li, C.-W.; Lim, S.-O.; Sheng, Y.-Y.; Zhang, Y.; et al. Disruption of tumour-associated macrophage trafficking by the osteopontin-induced colony-stimulating factor-1 signalling sensitises hepatocellular carcinoma to anti-PD-L1 blockade. Gut 2019, 68, 1653–1666. [Google Scholar] [CrossRef]
  54. Fujiwara, T.; Yakoub, M.A.; Chandler, A.; Christ, A.B.; Yang, G.; Ouerfelli, O.; Rajasekhar, V.K.; Yoshida, A.; Kondo, H.; Hata, T.; et al. CSF1/CSF1R Signaling Inhibitor Pexidartinib (PLX3397) Reprograms Tumor-Associated Macrophages and Stimulates T-cell Infiltration in the Sarcoma Microenvironment. Mol. Cancer Ther. 2021, 20, 1388–1399. [Google Scholar] [CrossRef]
  55. Tap, W.D.; Gelderblom, H.; Palmerini, E.; Desai, J.; Bauer, S.; Blay, J.Y.; Alcindor, T.; Ganjoo, K.; Martín-Broto, J.; Ryan, C.W.; et al. Pexidartinib versus placebo for advanced tenosynovial giant cell tumour (ENLIVEN): A randomised phase 3 trial. Lancet 2019, 394, 478–487. [Google Scholar] [CrossRef]
  56. Weiss, S.A.; Djureinovic, D.; Jessel, S.; Krykbaeva, I.; Zhang, L.; Jilaveanu, L.; Ralabate, A.; Johnson, B.; Levit, N.S.; Anderson, G.; et al. A Phase I Study of APX005M and Cabiralizumab with or without Nivolumab in Patients with Melanoma, Kidney Cancer, or Non-Small Cell Lung Cancer Resistant to Anti-PD-1/PD-L1. Clin. Cancer Res. Off. J. Am. Assoc. Cancer Res. 2021, 27, 4757–4767. [Google Scholar] [CrossRef]
  57. Pienta, K.J.; Machiels, J.-P.; Schrijvers, D.; Alekseev, B.; Shkolnik, M.; Crabb, S.J.; Li, S.; Seetharam, S.; Puchalski, T.A.; Takimoto, C.; et al. Phase 2 study of carlumab (CNTO 888), a human monoclonal antibody against CC-chemokine ligand 2 (CCL2), in metastatic castration-resistant prostate cancer. Investig. New Drugs 2013, 31, 760–768. [Google Scholar] [CrossRef]
  58. Advani, R.; Flinn, I.; Popplewell, L.; Forero, A.; Bartlett, N.L.; Ghosh, N.; Kline, J.; Roschewski, M.; LaCasce, A.; Collins, G.P.; et al. CD47 Blockade by Hu5F9-G4 and Rituximab in Non-Hodgkin’s Lymphoma. N. Engl. J. Med. 2018, 379, 1711–1721. [Google Scholar] [CrossRef]
  59. Sikic, B.I.; Lakhani, N.; Patnaik, A.; Shah, S.A.; Chandana, S.R.; Rasco, D.; Colevas, A.D.; O’Rourke, T.; Narayanan, S.; Papadopoulos, K.; et al. First-in-Human, First-in-Class Phase I Trial of the Anti-CD47 Antibody Hu5F9-G4 in Patients With Advanced Cancers. J. Clin. Oncol. 2019, 37, 946–953. [Google Scholar] [CrossRef]
  60. Oyarce, C.; Vizcaino-Castro, A.; Chen, S.; Boerma, A.; Daemen, T. Re-polarization of immunosuppressive macrophages to tumor-cytotoxic macrophages by repurposed metabolic drugs. Oncoimmunology 2021, 10, 1898753. [Google Scholar] [CrossRef]
  61. Nishida-Aoki, N.; Gujral, T.S. Polypharmacologic Reprogramming of Tumor-Associated Macrophages toward an Inflammatory Phenotype. Cancer Res. 2022, 82, 433–446. [Google Scholar] [CrossRef]
  62. Jaynes, J.M.; Sable, R.; Ronzetti, M.; Bautista, W.; Knotts, Z.; Abisoye-Ogunniyan, A.; Li, D.; Calvo, R.; Dashnyam, M.; Singh, A.; et al. Mannose receptor (CD206) activation in tumor-associated macrophages enhances adaptive and innate antitumor immune responses. Sci. Transl. Med. 2020, 12, eaax6337. [Google Scholar] [CrossRef]
  63. Goldman, M.J.; Craft, B.; Hastie, M.; Repečka, K.; McDade, F.; Kamath, A.; Banerjee, A.; Luo, Y.; Rogers, D.; Brooks, A.N.; et al. Visualizing and interpreting cancer genomics data via the Xena platform. Nat. Biotechnol. 2020, 38, 675–678. [Google Scholar] [CrossRef]
  64. Stuart, T.; Butler, A.; Hoffman, P.; Hafemeister, C.; Papalexi, E.; Mauck, W.M., 3rd; Hao, Y.; Stoeckius, M.; Smibert, P.; Satija, R. Comprehensive Integration of Single-Cell Data. Cell 2019, 177, 1888–1902.e1821. [Google Scholar] [CrossRef]
  65. Budczies, J.; Klauschen, F.; Sinn, B.V.; Győrffy, B.; Schmitt, W.D.; Darb-Esfahani, S.; Denkert, C. Cutoff Finder: A comprehensive and straightforward Web application enabling rapid biomarker cutoff optimization. PLoS ONE 2012, 7, e51862. [Google Scholar] [CrossRef]
Figure 1. Association of M2-defining macrophage gene expression with histologic subtype and pTMN stage. (A) Histologic subtypes for intestinal adenocarcinomas, diffuse adenocarcinoma, mucinous adenocarcinoma, and signet ring cell adenocarcinoma are associated with M2-defining signatures. One-way ANOVA, p < 0.001. (B) Within each histologic subtype, M2-defining macrophage signature expression is significantly greater than both M1-defining and T-cell cytolytic signature expression. t-test for each comparison, * p < 0.05. (C) Greater M2-defining macrophage expression is associated with more advanced stages. t-test, p = 0.02. M2TS, M2 transcriptomic signature. NOS type, not otherwise specified type. TNM, tumor node metastasis. M1TS, M1 transcriptomic signature. CTLTS, cytotoxic T-lymphocyte transcriptomic signature.
Ijms 25 04117 g001
Figure 2. M2-defining macrophage, but not M1-defining or T-cell cytolytic, signature is associated with survival. The highest quintile of M2-defining macrophage signature expression is associated with worse OS (p = 0.03) and DFI (p = 0.05). High levels of M1-macrophage and T-cell cytolytic signature expression were not associated with OS or DFI (p > 0.05). OS, overall survival. DFI, disease free interval. M2TS, M2 transcriptomic signature. M1TS, M1 transcriptomic signature. CTLTS, cytotoxic T-lymphocyte transcriptomic signature.
Ijms 25 04117 g002
Figure 3. M2-defining signature is expressed in the M2 macrophage cell cluster on single-cell analysis of peritoneal fluid samples and is associated with survival in peritoneal fluid samples. (A) UMAP plot displays the cells with higher M2-defining signature expression as purple dot, which is primarily seen in the M2 macrophage cells (CD68+CD163+). (B) The expression profile of the M2-defining macrophage signature is plotted on the y-axis (log scale) using the single-cell RNA seq expression per a single sample. Each dot represents one single-cell M2-defining signature expression level. Cells tend to cluster in subtypes of M2 macrophages of varying expression of the M2-defining macrophage signature. (C) High (n = 13) and low (n = 15) cohorts can be defined from our entire cohort. (D) High expression of M2-defining macrophage gene signature in M2 defined cells within peritoneal samples is associated with worse overall survival (p = 0.018). UMAP, unform manifold approximation and projection.
Ijms 25 04117 g003
Table 1. Clinicopathologic characteristics by M2TS expression levels.
M2TS Expressionp-Value
Low
n = 15 (%)
High
n = 13 (%)
Age (years)≤406 (40.0)1 (7.7)0.086
>40 and ≤654 (26.7)8 (61.5)
>655 (33.3)4 (30.8)
Age (years)Mean ± SD51.7 ± 20.260.7 ± 13.60.184
GenderFemale9 (60.0)4 (33.3)0.322
Male6 (40.0)8 (66.7)
EthnicityAsian5 (33.3)4 (30.8)0.288
Black1 (6.7)0 (0.0)
Hispanic6 (40.0)3 (23.1)
Non-Hispanic White2 (13.3)6 (46.2)
Other1 (6.7)0 (0.0)
CytologyNegative6 (40.0)4 (30.8)0.91
Positive9 (60.0)9 (69.2)
Lauren ClassificationDiffuse11 (73.3)10 (76.9)1.0
Intestinal4 (26.7)3 (23.1)
DifferentiationModerately0 (0.0)2 (15.4)0.144
Poorly15 (100.0)10 (76.9)
Well to moderately0 (0.0)1 (7.7)
Signet Ring CellAbsent5 (33.3)8 (61.5)0.266
Present10 (66.7)5 (38.5)
Microsatellite StatusMSI high1 (6.7)0 (0.0)0.55
MSS12 (80.0)12 (92.3)
Unknown2 (13.3)1 (7.7)
PD-L1Negative4 (26.7)5 (38.5)0.52
Positive10 (66.7)6 (46.2)
Unknown1 (6.7)2 (15.4)
StageI–III2 (13.3)2 (15.4)1.0
IV13 (86.7)11 (84.6)
Serum Albumin<3 g/dL4 (26.7)5 (38.5)0.794
≥3 g/dL11 (73.3)8 (61.5)
M2TS, M2 transcriptomic signature. SD, standard deviation. MSI, microsatellite instable. MSS, microsatellite stable.
Table 2. Univariate Cox regression analysis of survival in the peritoneal fluid cohort.
Patients (%)HR (95% CI, p-Value)
M2TS ExpressionLow15 (53.6)ref
High13 (46.4)3.14 (1.17–8.46, 0.02)
Age (years)≤407 (25.0)ref
>40 and ≤6512 (42.9)3.67 (0.79–17.05, 0.097)
>659 (32.1)2.51 (0.50–12.53, 0.26)
Age (years)Mean ± SD55.9 ± 17.71.01 (0.99–1.04, 0.33)
GenderFemale13 (48.1)ref
Male14 (51.9)0.96 (0.36–2.57, 0.93)
EthnicityAsian9 (32.1)ref
Black1 (3.6)3.21 (0.35–29.23, 0.30)
Hispanic9 (32.1)0.93 (0.25–3.49, 0.92)
Non-Hispanic White8 (28.6)1.76 (0.53–5.79, 0.35)
Other1 (3.6)0.00 (0.00–Inf, 1.0)
ResectionNo17 (60.7)ref
Yes11 (39.3)2.31 (0.89–6.02, 0.09)
StageI-III4 (14.3)ref
IV24 (85.7)5.53 (0.69–44.07, 0.106)
Lauren ClassificationDiffuse21 (75.0)ref
Intestinal7 (25.0)1.53 (0.56–4.18, 0.40)
DifferentiationModerately2 (7.1)ref
Poorly25 (89.3)0.23 (0.05–1.09, 0.06)
Well to moderately1 (3.6)NA
Microsatellite StatusMSS24 (85.7)ref
MSI high1 (3.6)15.04 (1.34–169.06, 0.028)
Unknown3 (10.7)2.36 (0.66–8.50, 0.19)
HR, hazard ratio. CI, confidence interval. M2TS, M2 transcriptional signature. Ref, reference value. SD, standard deviation. MSS, microsatellite stable. MSI, microsatellite instable. Bolded p-value indicates statistical significance (p < 0.05).
Table 3. Multivariate Cox regression analysis of survival from the peritoneal fluid cohort.
Patients (%)HR (95% CI, p-Value)
M2TS ExpressionLow15 (53.6)ref
High13 (46.4)6.58 (1.68–25.79, 0.007)
ResectionNo17 (60.7)ref
Yes11 (39.3)2.30 (0.67–7.98, 0.19)
StageI-III4 (14.3)ref
IV24 (85.7)14.71 (1.11–194.42, 0.041)
DifferentiationModerately2 (7.1)ref
Poorly25 (89.3)0.98 (0.16–6.11, 0.98)
Well to moderately1 (3.6)4 × 10⁹ (0.00–Inf, 1.000)
Microsatellite StatusMSS24 (85.7)ref
MSI high1 (3.6)145.33 (6.55–3225.37, 0.002)
Unknown3 (10.7)3.67 (0.74–18.18, i)
HR, hazard ratio. CI, confidence interval. M2TS, M2 transcriptional signature. Ref, reference value. MSS, microsatellite stable. MSI, microsatellite instable. Bolded p-value indicates statistical significance (p < 0.05).
Disclaimer/Publisher’s Note: The statements, opinions and data contained in all publications are solely those of the individual author(s) and contributor(s) and not of MDPI and/or the editor(s). MDPI and/or the editor(s) disclaim responsibility for any injury to people or property resulting from any ideas, methods, instructions or products referred to in the content.

