
Estrogen α and β Receptor Expression in the Various Regions of Resected Glioblastoma Multiforme Tumors and in an In Vitro Model

 , , , , , , and
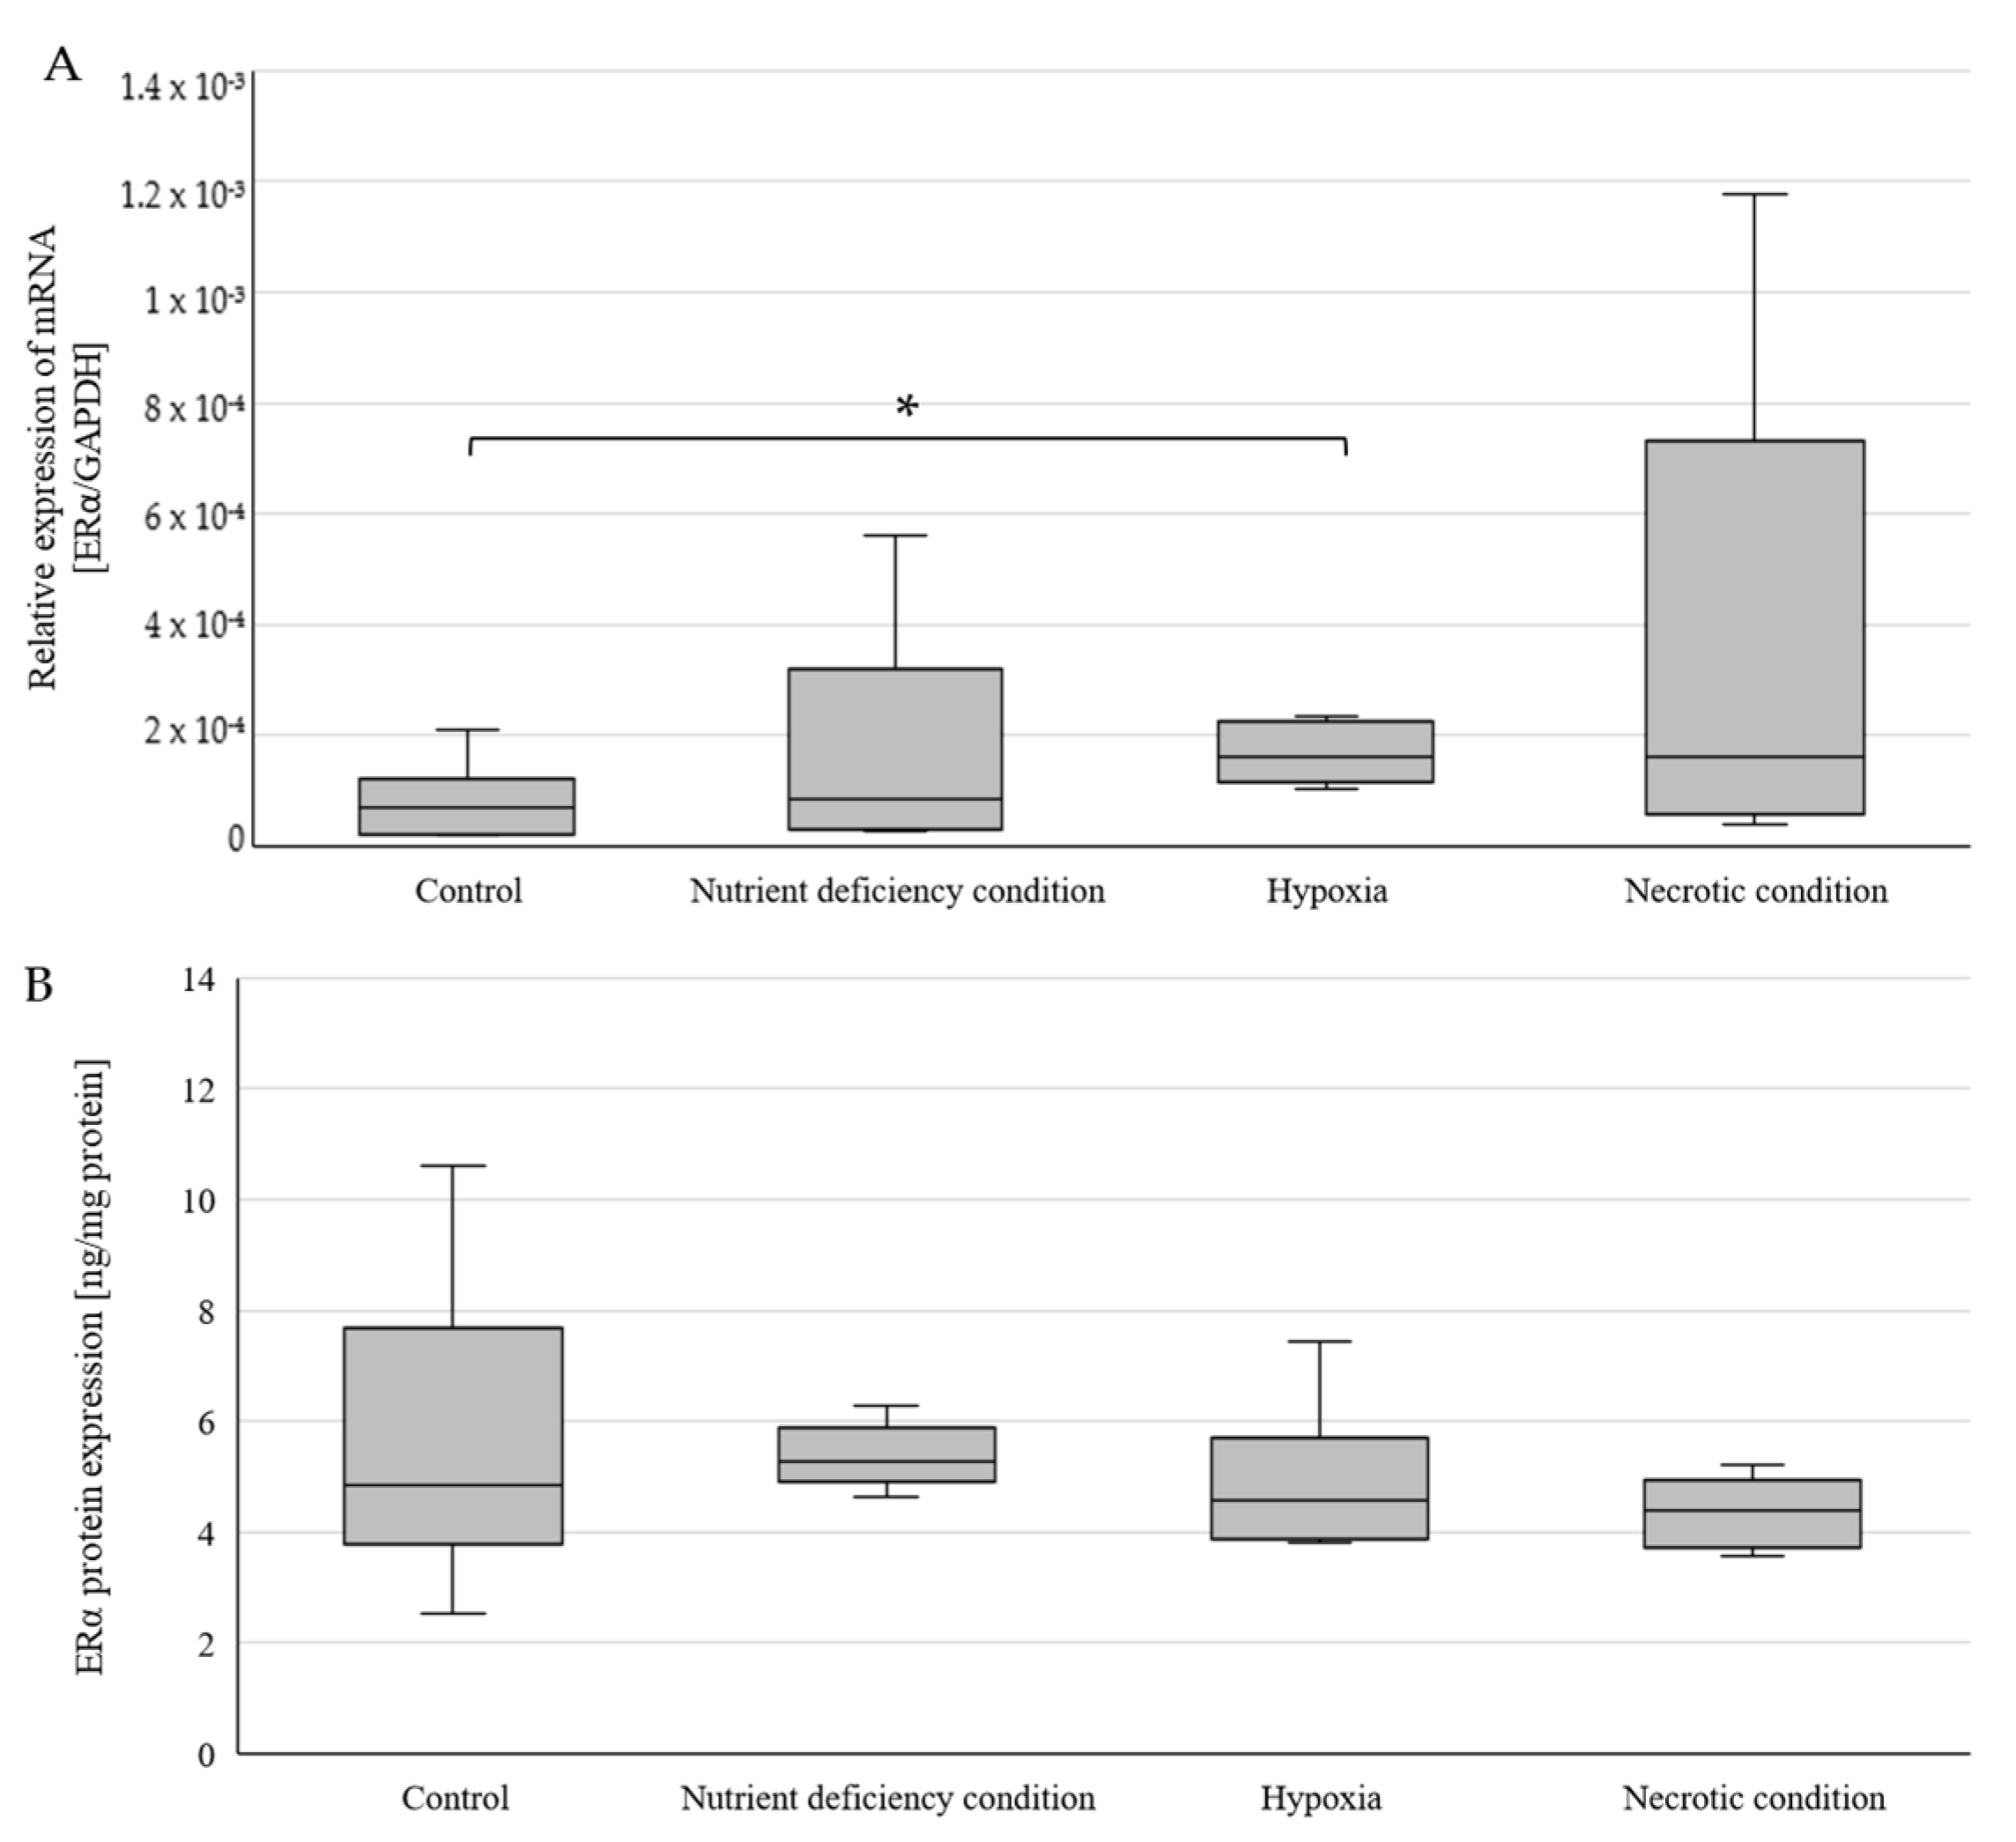
Abstract
1. Introduction
2. Results
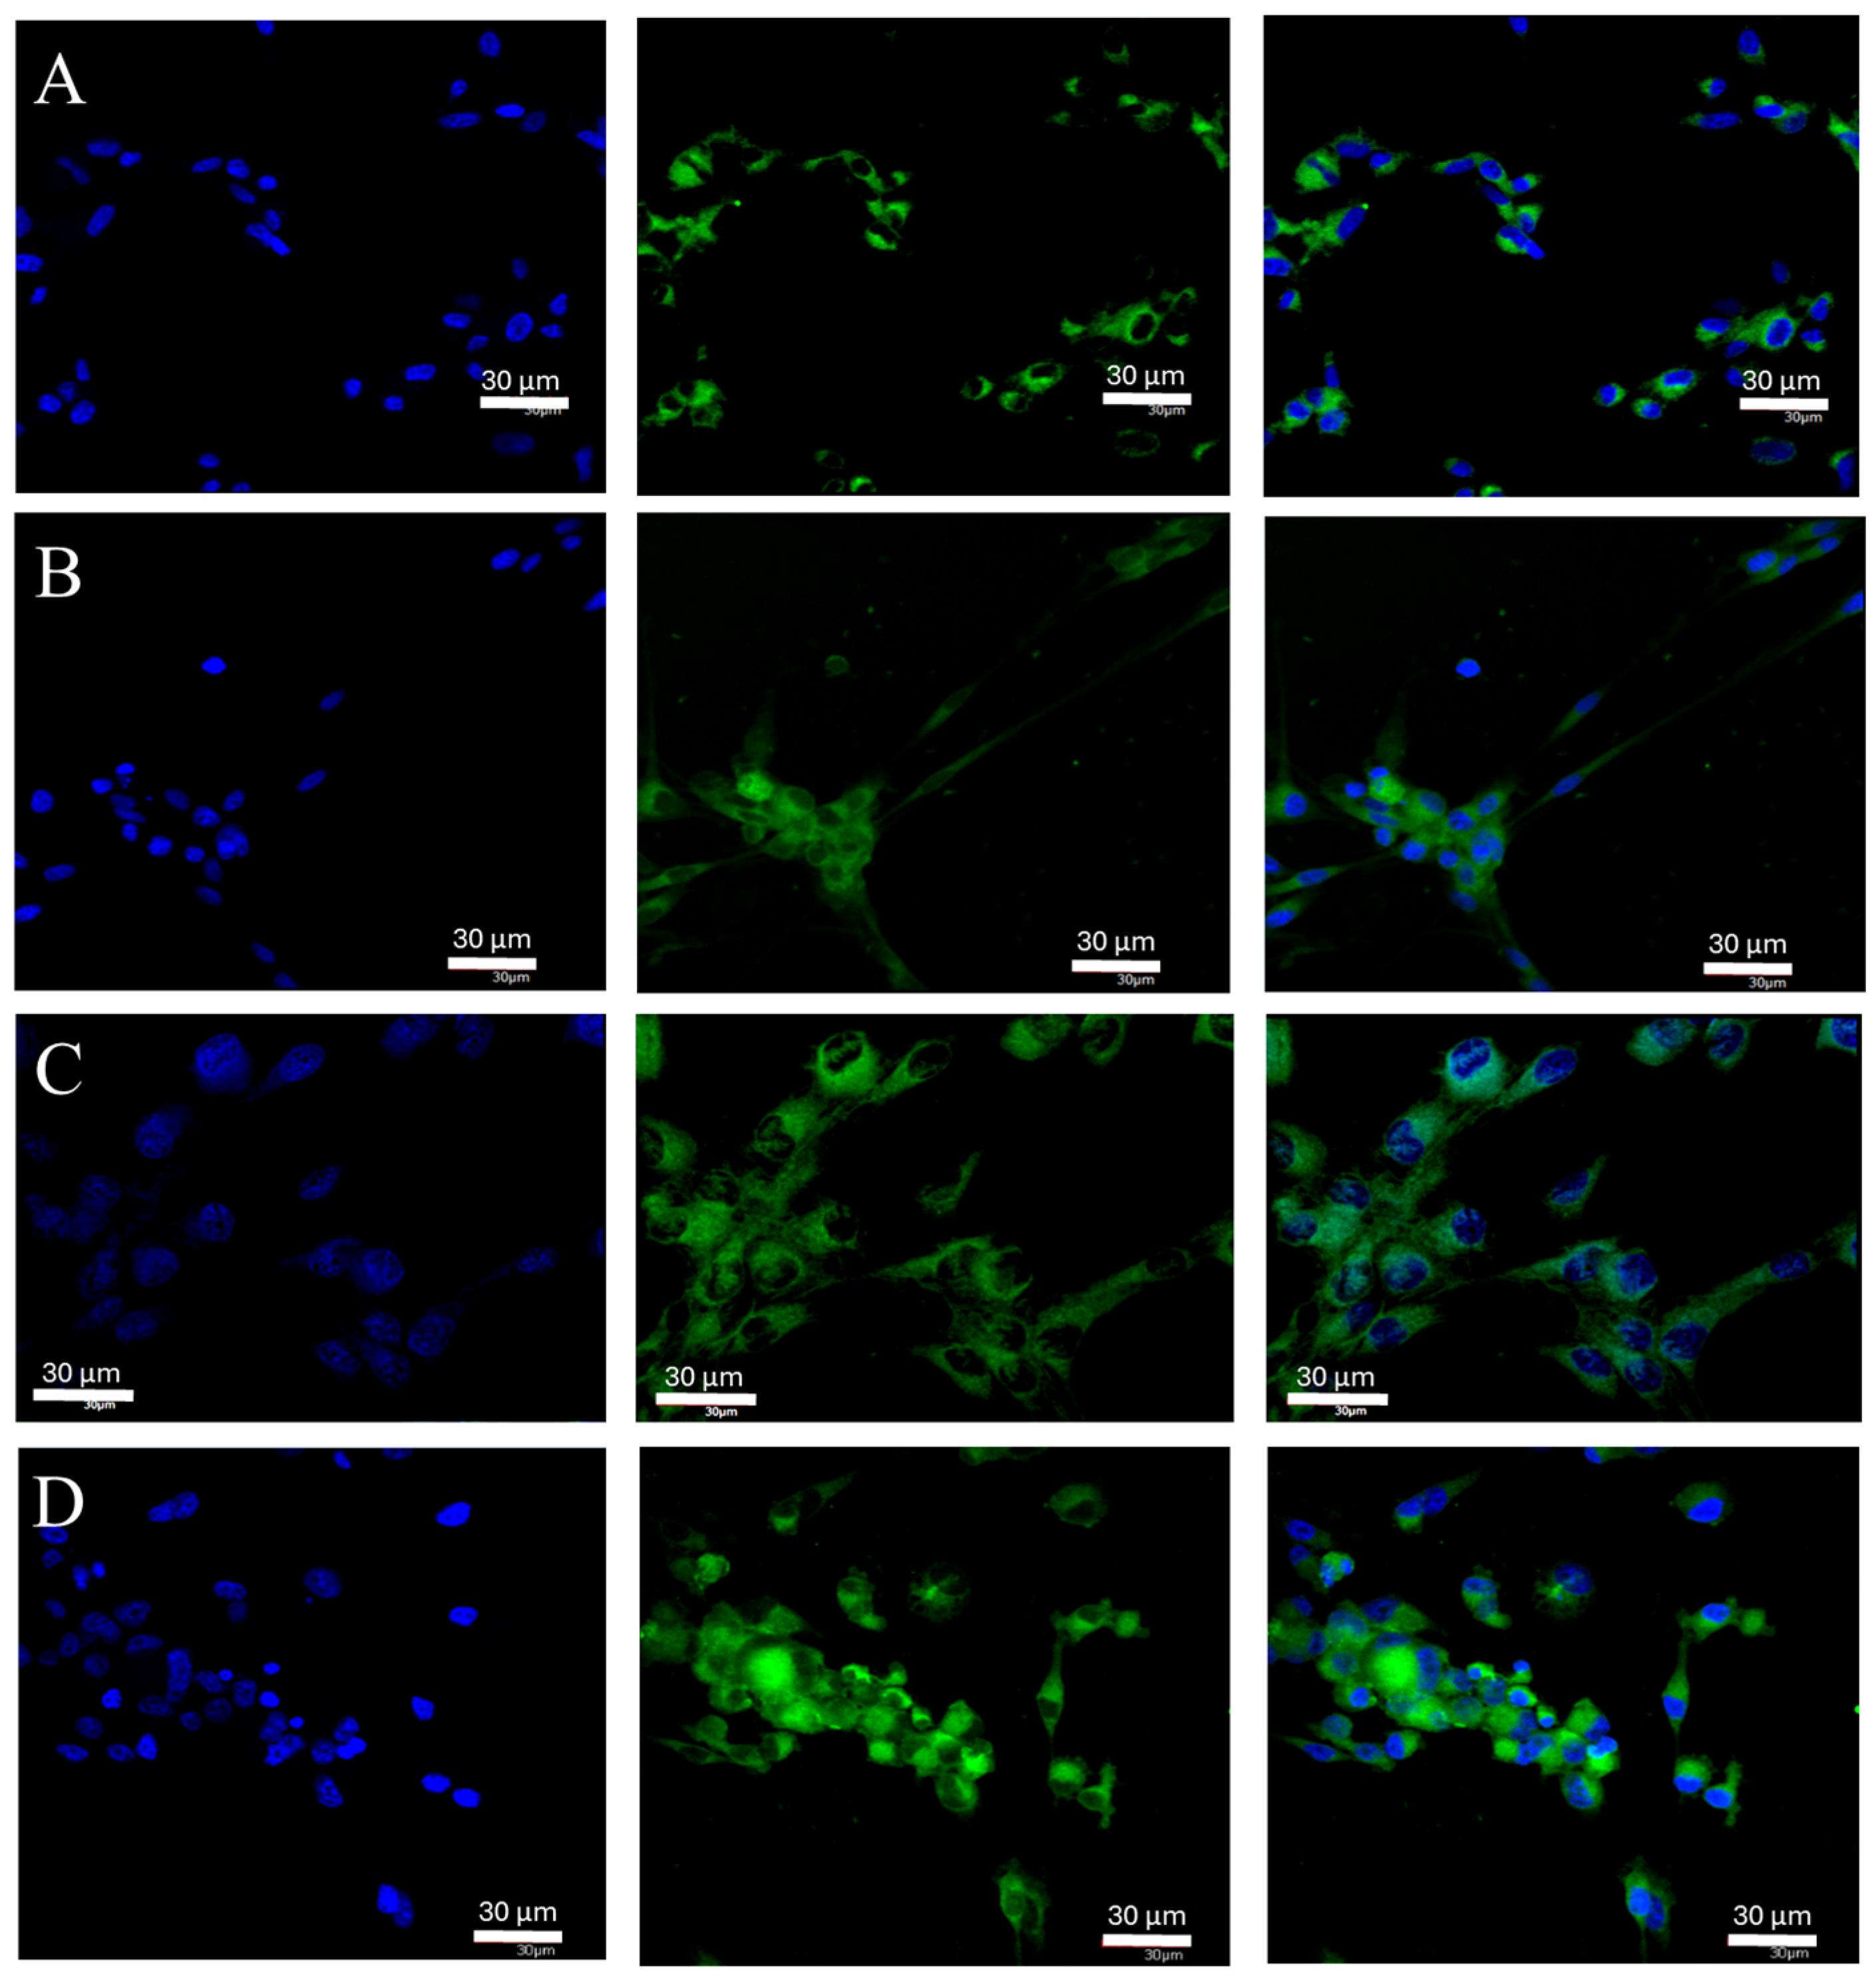
2.1. Changes in ERα Gene and Protein Expression in U87 Line Cells Cultured under Different Test Conditions
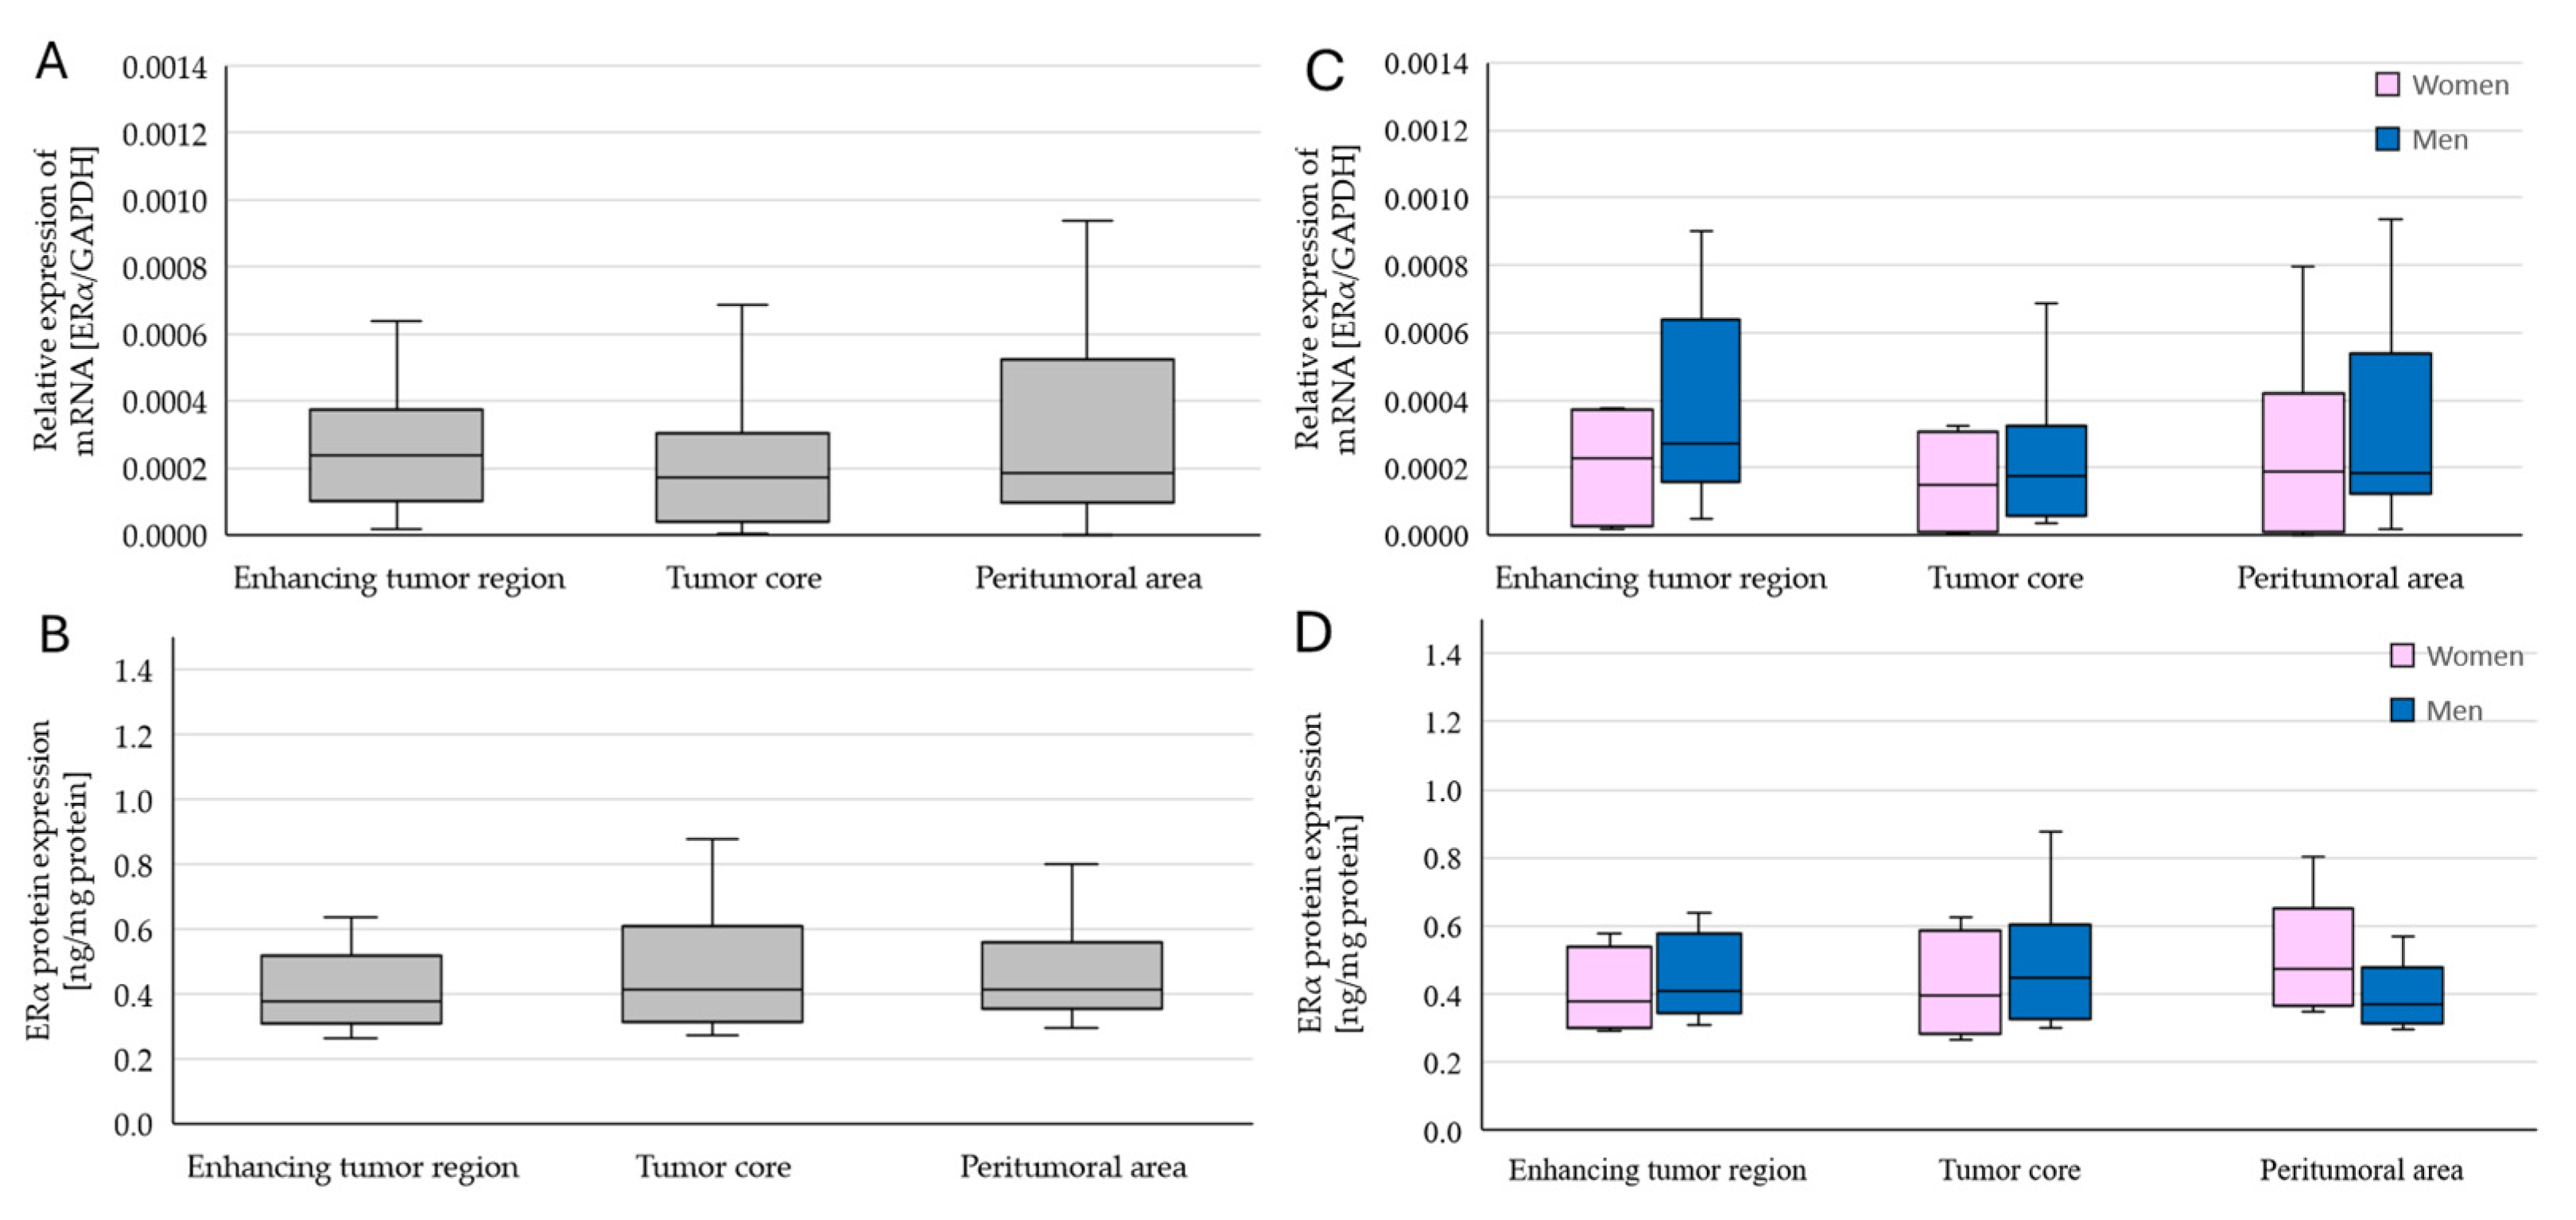
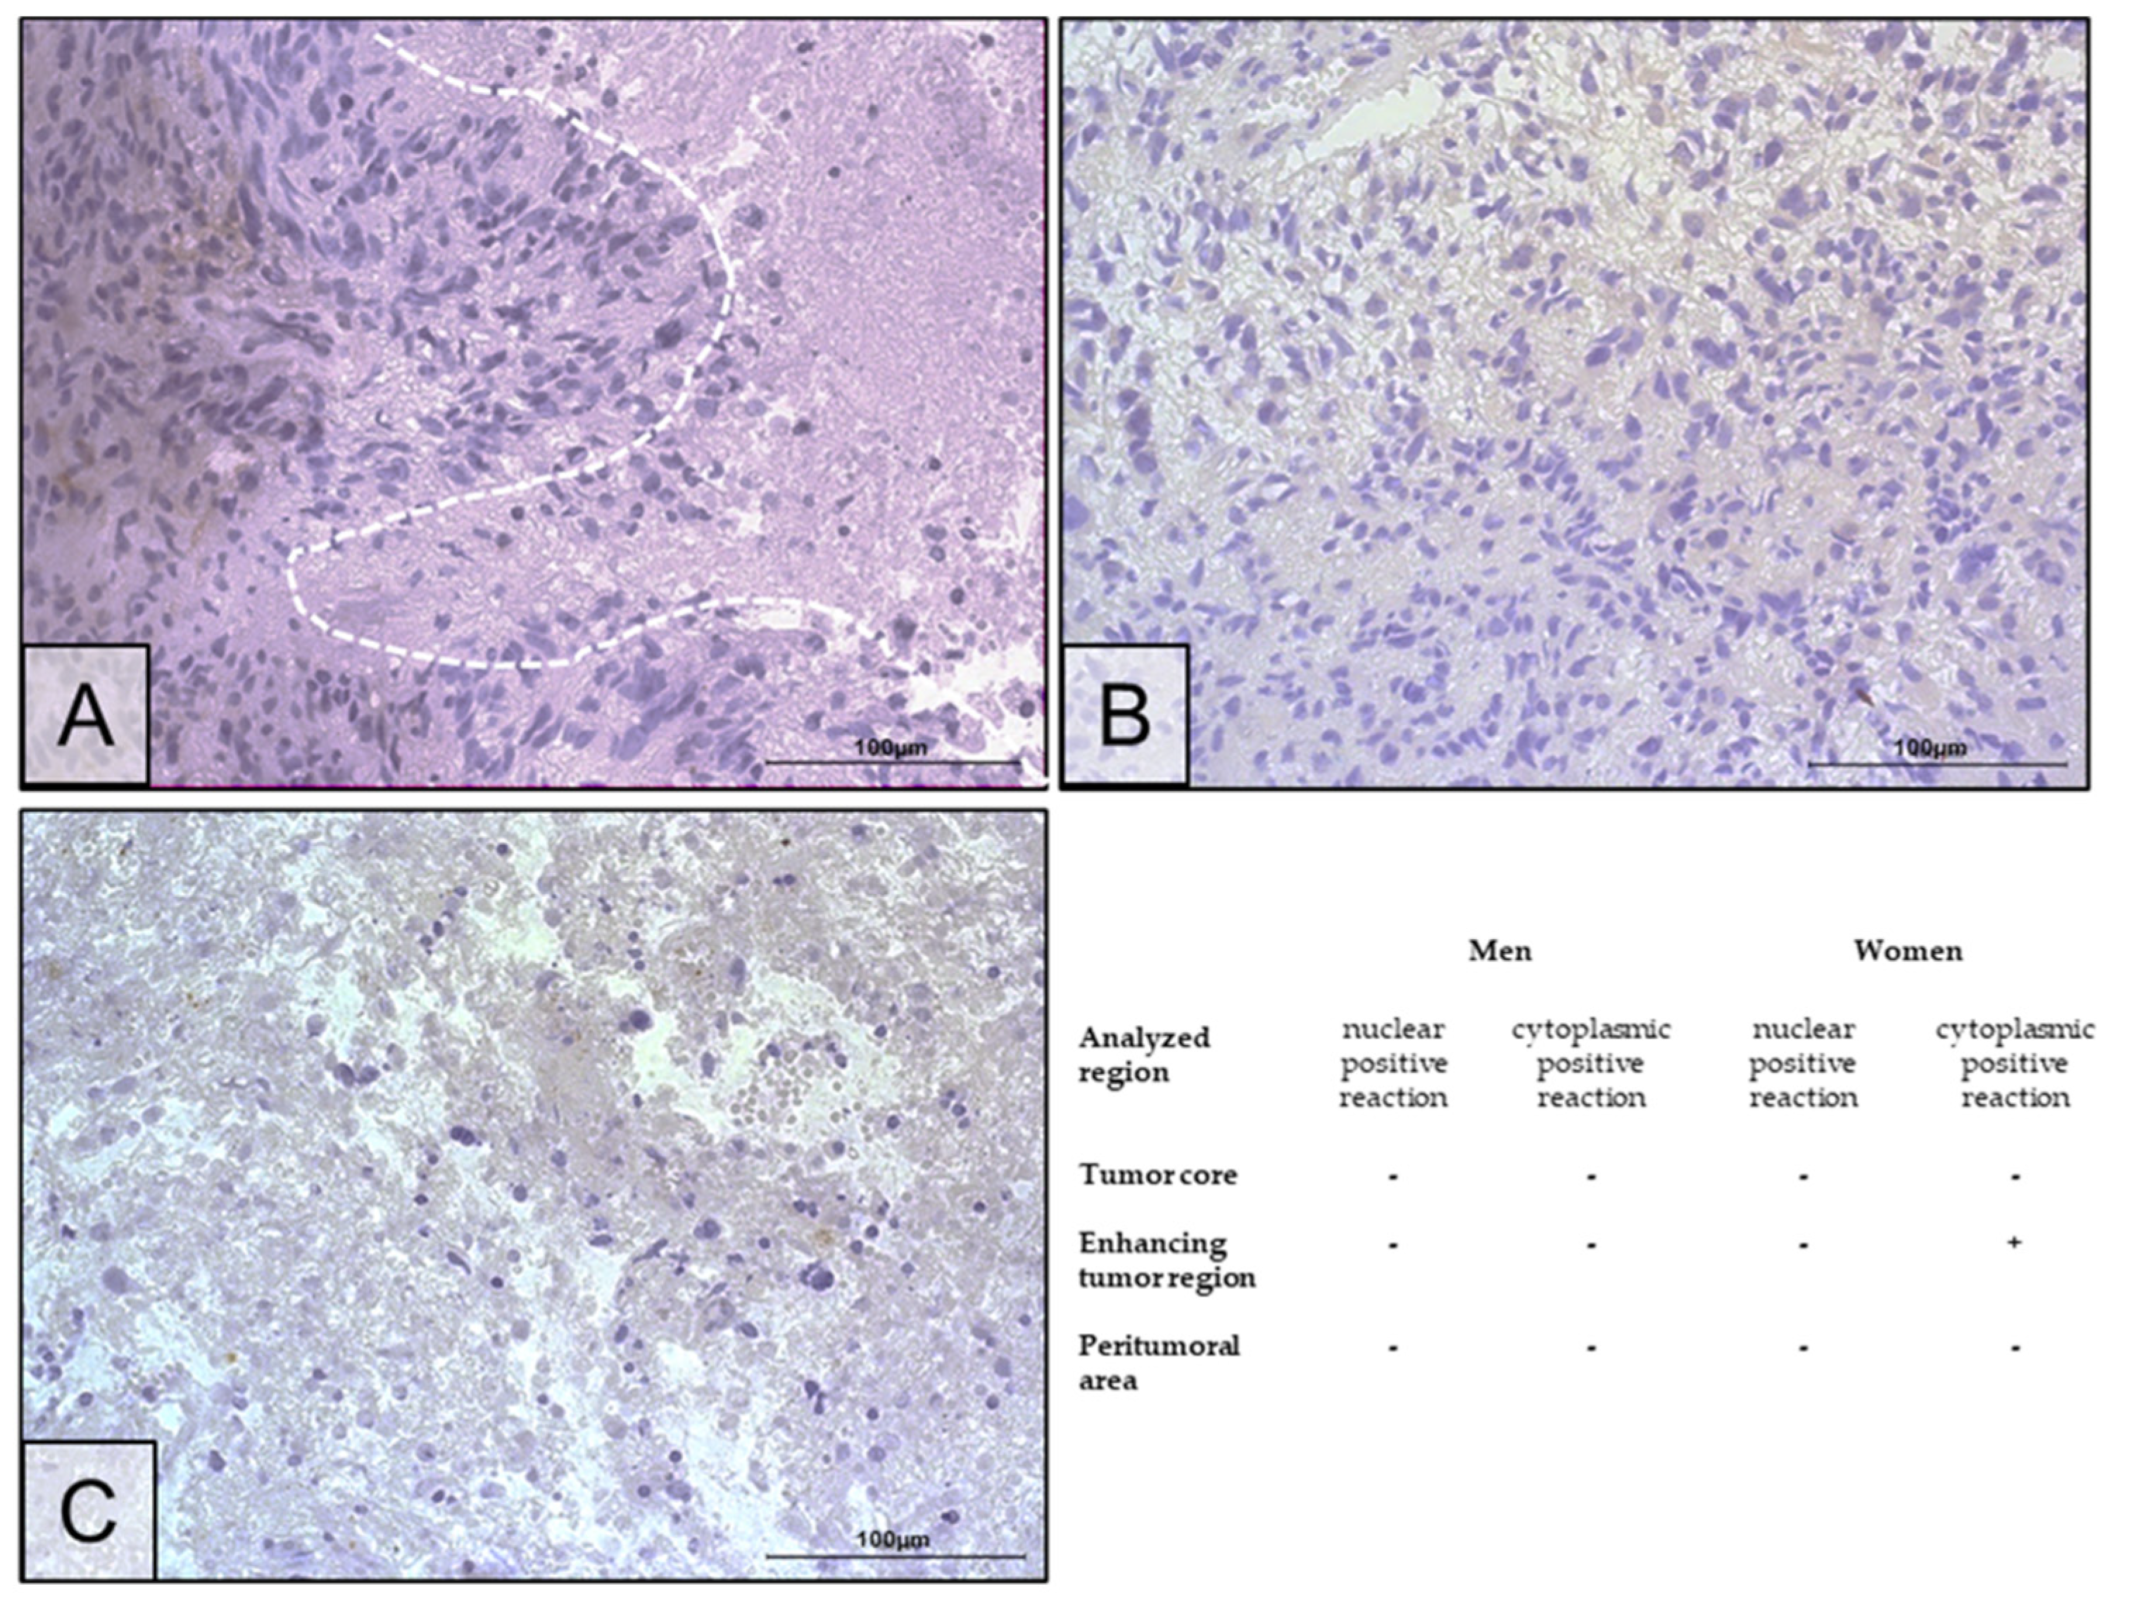
2.2. Changes in ERα Gene and Protein Expression in Individual GBM Tumoral Areas Obtained from Patients
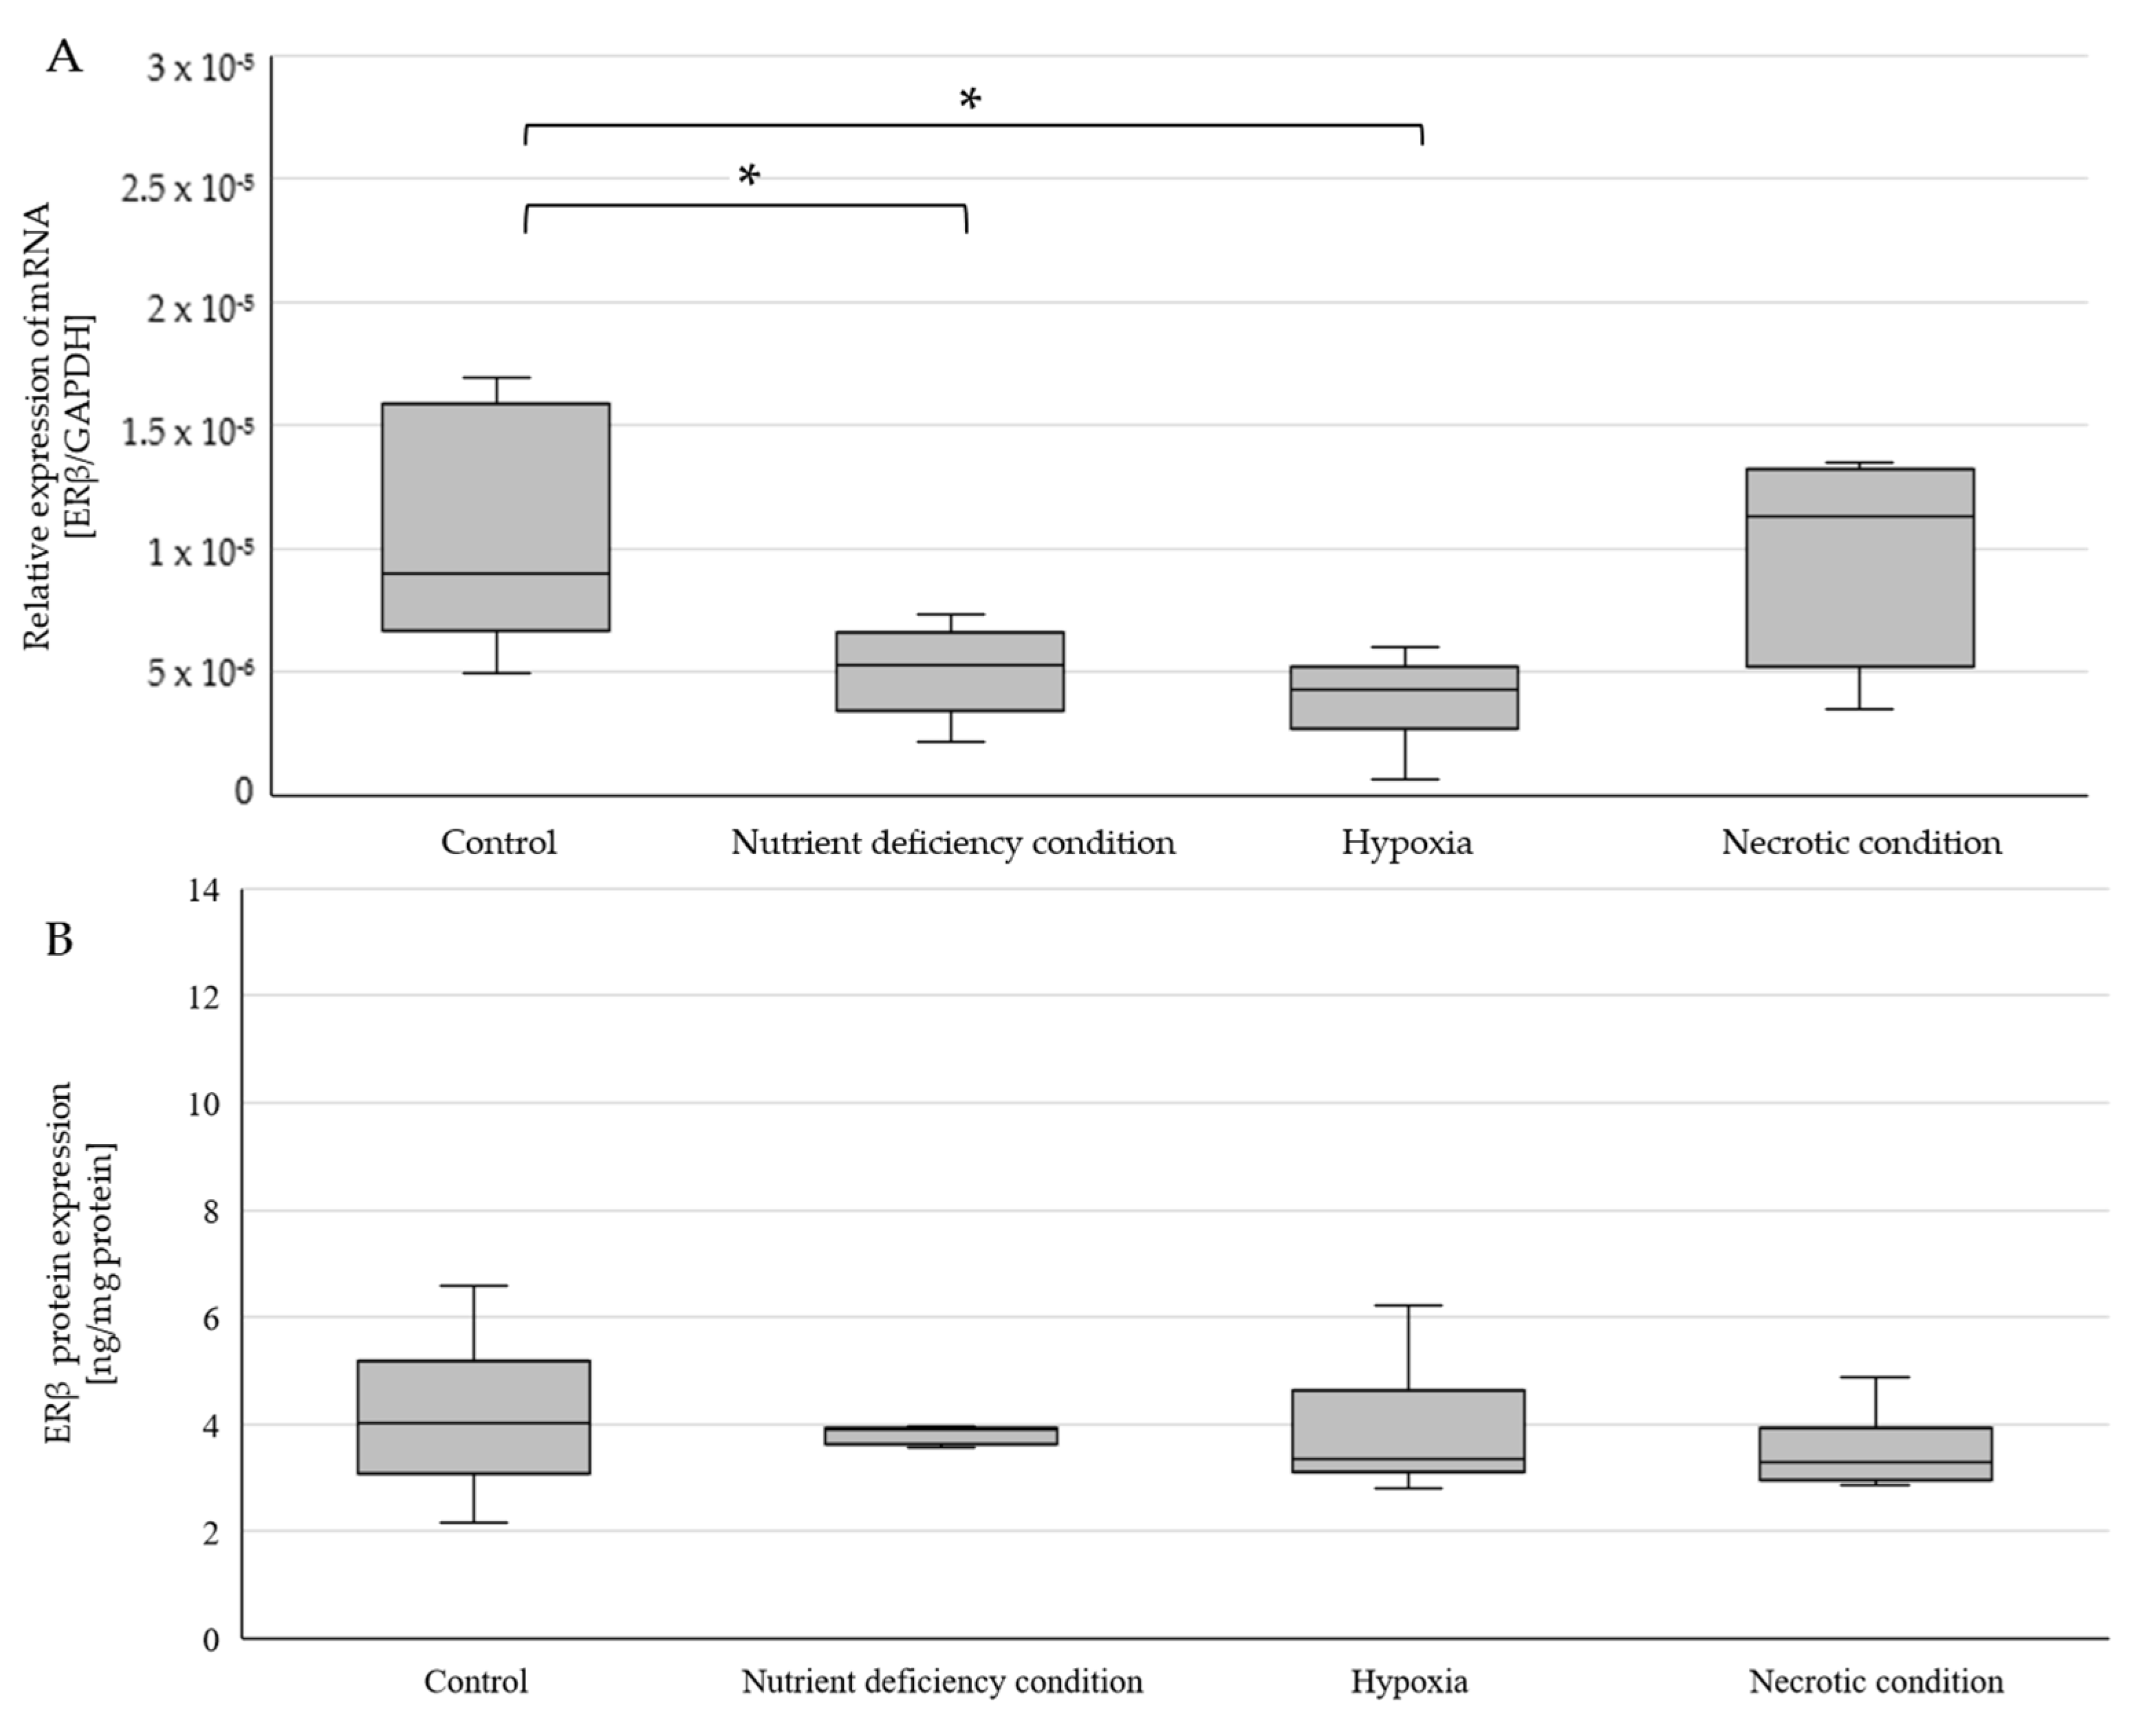
2.3. Changes in ERβ Gene and Protein Expression in U87 Line Cells Cultured under Different Test Conditions
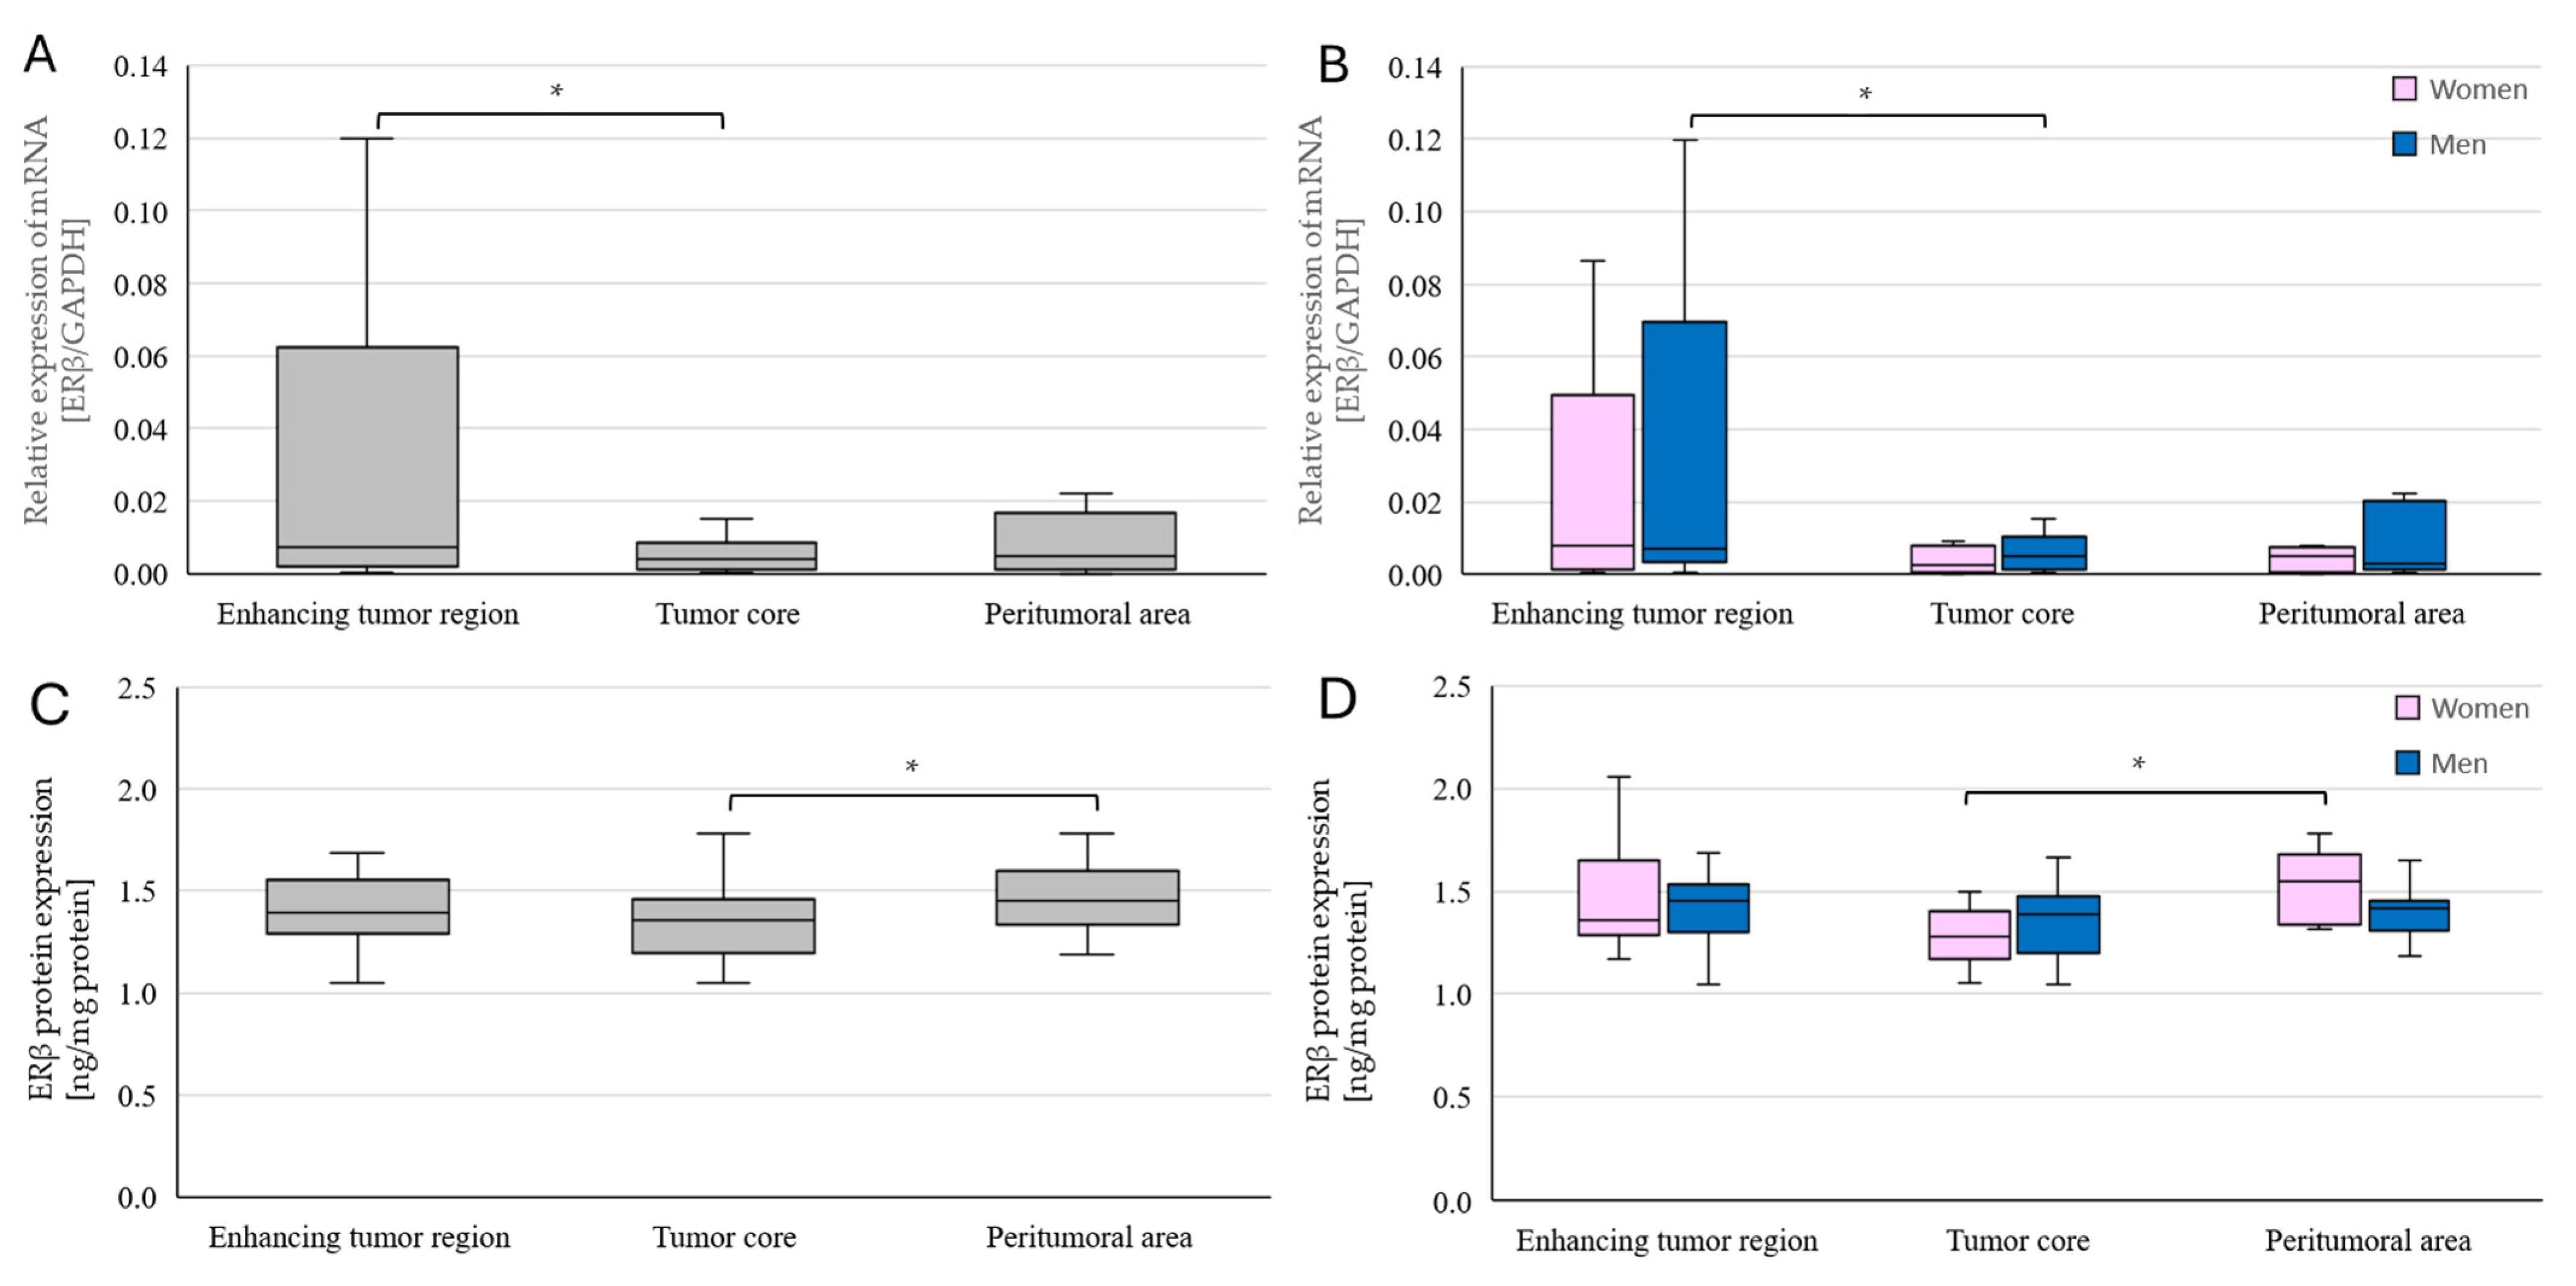
2.4. Changes in ERβ Gene and Protein Expression in Individual GBM Tumoral Areas Obtained from Patients
3. Discussion
3.1. Estrogen Receptor α in an In Vitro Model
3.2. Estrogen Receptor α in Tumors Taken from Patients
3.3. Estrogen Receptor β in a Model and In Vitro
3.4. Estrogen Receptor β in Tumors Taken from Patients
4. Materials and Methods
4.1. In Vitro Model: Cell Culture
4.2. Model of Tumoral Areas of Patients’ GBM Tumors
4.3. Quantitative Real-Time Polymerase Chain Reaction (qRT-PCR)
4.4. Enzyme-Linked Immunosorbent Assay (ELISA)
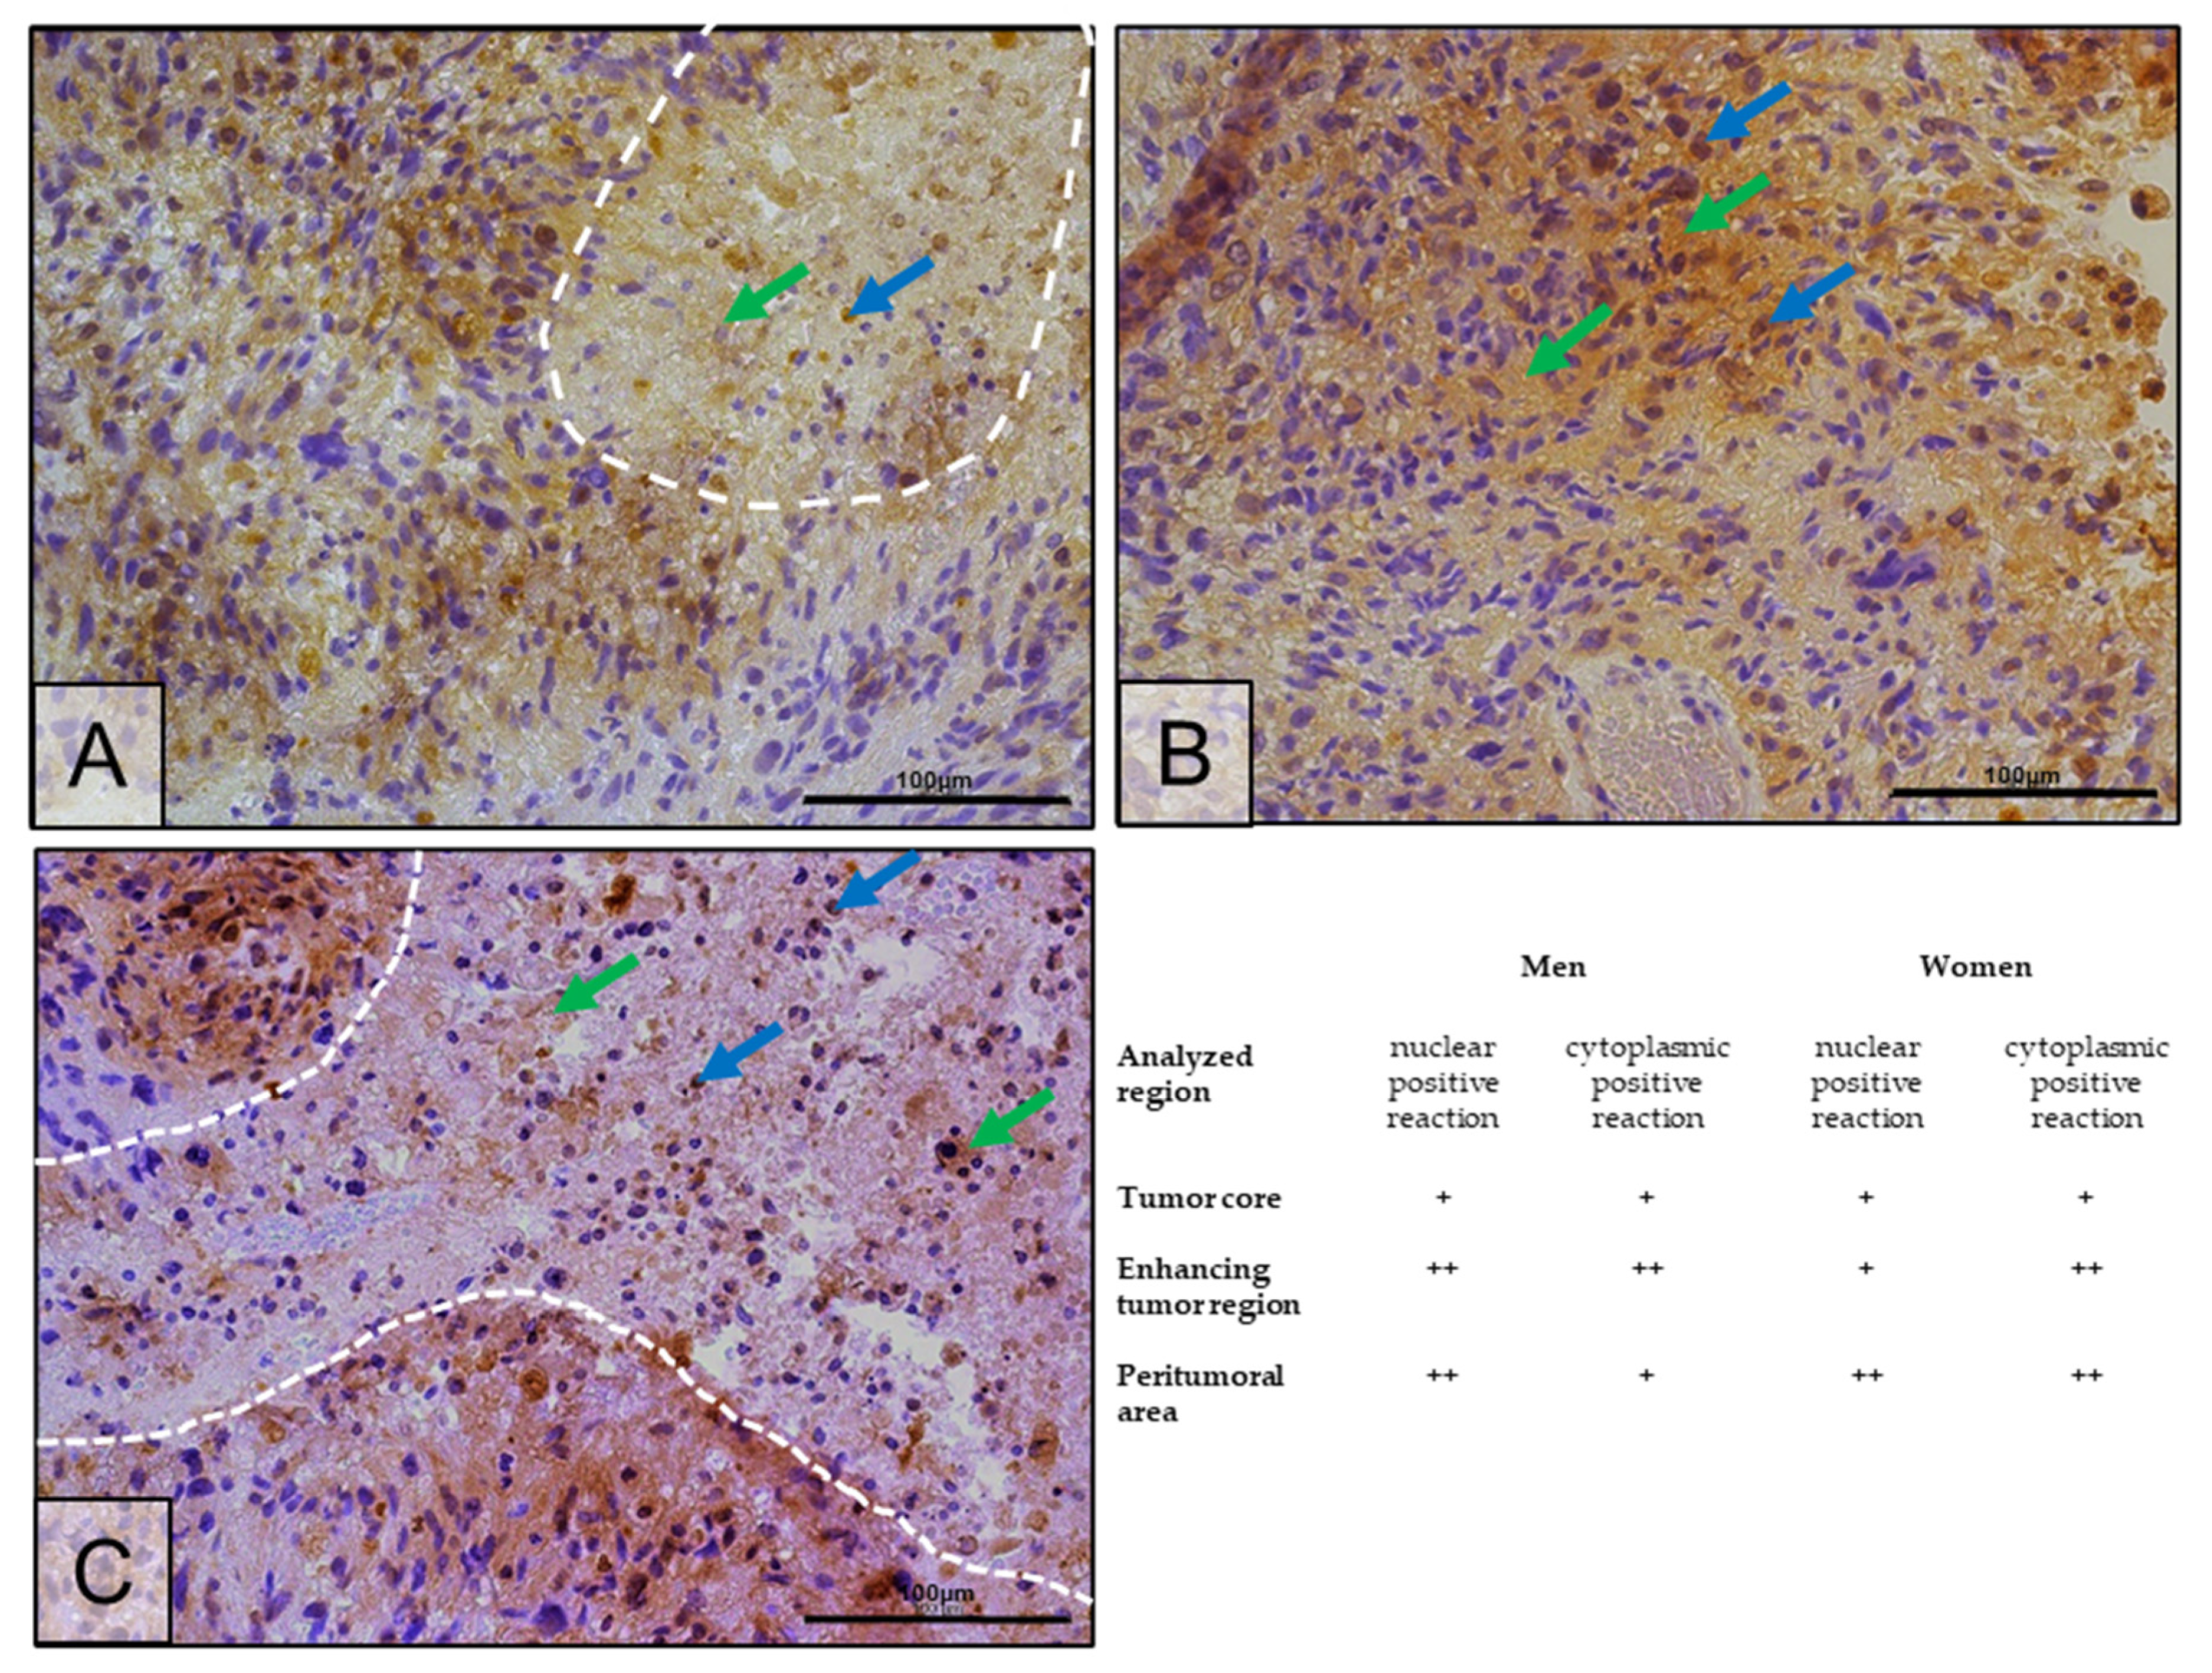
4.5. Immunohistochemistry
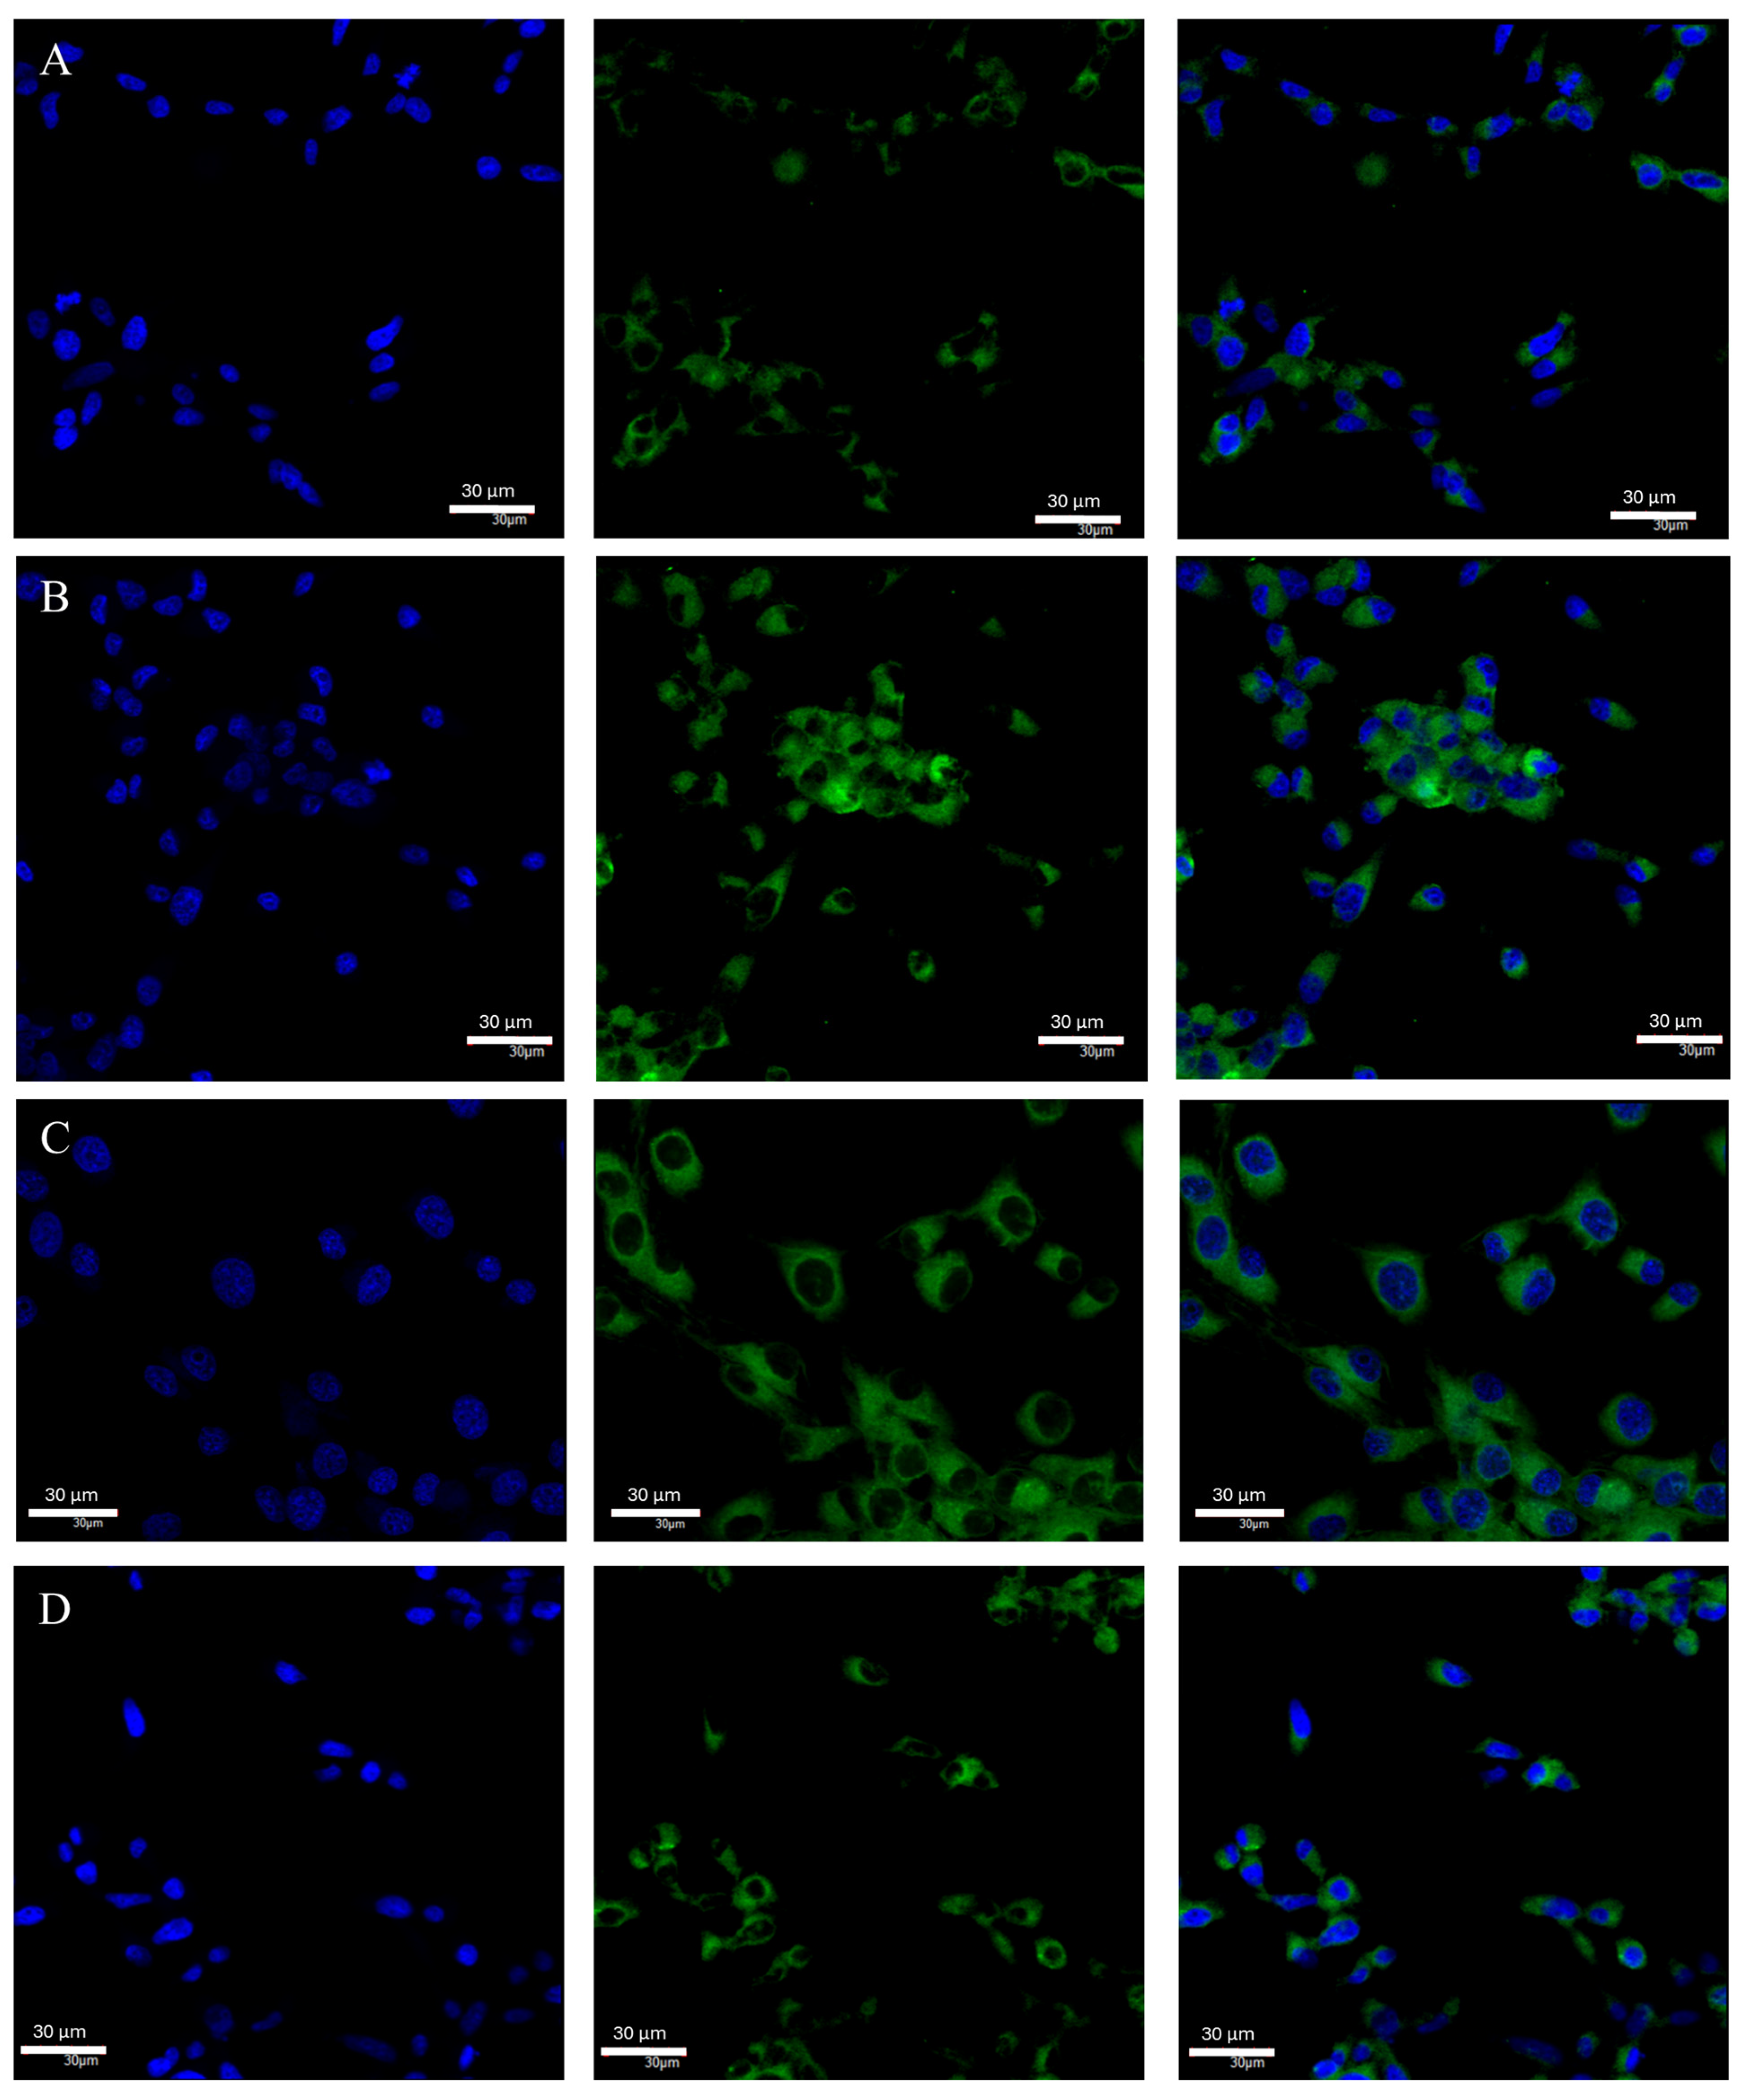
4.6. Confocal Microscopy
4.7. Statistical Analysis
5. Conclusions
Research Limitations
Author Contributions
Funding
Institutional Review Board Statement
Informed Consent Statement
Conflicts of Interest
References
- Ostrom, Q.T.; Price, M.; Neff, C.; Cioffi, G.; Waite, K.A.; Kruchko, C.; Barnholtz-Sloan, J.S. CBTRUS Statistical Report: Primary Brain and Other Central Nervous System Tumors Diagnosed in the United States in 2016–2020. Neuro-Oncol. 2023, 25 (Suppl. S4), iv1–iv99. [Google Scholar] [CrossRef] [PubMed]
- Ostrom, Q.T.; Gittleman, H.; Liao, P.; Vecchione-Koval, T.; Wolinsky, Y.; Kruchko, C.; Barnholtz-Sloan, J.S. CBTRUS Statistical Report: Primary brain and other central nervous system tumors diagnosed in the United States in 2010–2014. Neuro-Oncol. 2017, 19, 1–88. [Google Scholar] [CrossRef] [PubMed]
- Ostrom, Q.T.; Gittleman, H.; Farah, P.; Ondracek, A.; Chen, Y.; Wolinsky, Y.; Stroup, N.E.; Kruchko, C.; Barnholtz-Sloan, J.S. CBTRUS Statistical Report: Primary Brain and Central Nervous System Tumors Diagnosed in the United States in 2006–2010. Neuro-Oncol. 2013, 15 (Suppl. S2), ii1–ii56. [Google Scholar] [CrossRef] [PubMed]
- Koshy, M.; Villano, J.L.; Dolecek, T.A.; Howard, A.; Mahmood, U.; Chmura, S.J.; Weichselbaum, R.R.; McCarthy, B.J. Improved survival time trends for glioblastoma using the SEER 17 population-based registries. J. Neuro-Oncol. 2012, 107, 207–212. [Google Scholar] [CrossRef] [PubMed]
- Tran, B.; Rosenthal, M. Survival comparison between glioblastoma multiforme and other incurable cancers. J. Clin. Neurosci. 2010, 17, 417–421. [Google Scholar] [CrossRef] [PubMed]
- Paolillo, M.; Comincini, S.; Schinelli, S. In Vitro Glioblastoma Models: A Journey into the Third Dimension. Cancers 2021, 13, 2449. [Google Scholar] [CrossRef] [PubMed]
- Stupp, R.; Mason, W.P.; van den Bent, M.J.; Weller, M.; Fisher, B.; Taphoorn, M.J.B.; Belanger, K.; Brandes, A.A.; Marosi, C.; Bogdahn, U.; et al. Radiotherapy plus Concomitant and Adjuvant Temozolomide for Glioblastoma. N. Engl. J. Med. 2005, 352, 987–996. [Google Scholar] [CrossRef] [PubMed]
- Patel, A.P.; Tirosh, I.; Trombetta, J.J.; Shalek, A.K.; Gillespie, S.M.; Wakimoto, H.; Cahill, D.P.; Nahed, B.V.; Curry, W.T.; Martuza, R.L.; et al. Single-cell RNA-seq highlights intratumoral heterogeneity in primary glioblastoma. Science 2014, 344, 1396–1401. [Google Scholar] [CrossRef] [PubMed]
- Hambardzumyan, D.; Bergers, G. Glioblastoma: Defining Tumor Niches. Trends Cancer 2015, 1, 252–265. [Google Scholar] [CrossRef] [PubMed]
- Lathia, J.D.; Mack, S.C.; Mulkearns-Hubert, E.E.; Valentim, C.L.; Rich, J.N. Cancer stem cells in glioblastoma. Genes Dev. 2015, 29, 1203. [Google Scholar] [CrossRef] [PubMed]
- Gigineishvili, D.; Shengelia, N.; Shalashvili, G.; Rohrmann, S.; Tsiskaridze, A.; Shakarishvili, R. Primary brain tumour epidemiology in Georgia: First-year results of a population-based study. J. Neuro-Oncol. 2013, 112, 241–246. [Google Scholar] [CrossRef]
- Dubrow, R.; Darefsky, A.S. Demographic variation in incidence of adult glioma by subtype, United States, 1992-2007. BMC Cancer 2011, 11, 325. [Google Scholar] [CrossRef] [PubMed]
- Kabat, G.C.; Park, Y.; Hollenbeck, A.R.; Schatzkin, A.; Rohan, T.E. Reproductive factors and exogenous hormone use and risk of adult glioma in women in the NIH-AARP Diet and Health Study. Int. J. Cancer 2011, 128, 944–950. [Google Scholar] [CrossRef] [PubMed]
- Michaud, D.S.; Gallo, V.; Schlehofer, B.; Tjønneland, A.; Olsen, A.; Overvad, K.; Dahm, C.C.; Kaaks, R.; Lukanova, A.; Boeing, H.; et al. Reproductive Factors and Exogenous Hormone Use in Relation to Risk of Glioma and Meningioma in a Large European Cohort Study. Cancer Epidemiol. Biomark. Prev. 2010, 19, 2562–2569. [Google Scholar] [CrossRef] [PubMed]
- Kabat, G.C.; Etgen, A.M.; Rohan, T.E. Do Steroid Hormones Play a Role in the Etiology of Glioma? Cancer Epidemiol. Biomark. Prev. 2010, 19, 2421–2427. [Google Scholar] [CrossRef] [PubMed]
- Huang, K.; Whelan, E.A.; Ruder, A.M.; Ward, E.M.; Deddens, J.A.; Davis-King, K.E.; Carreón, T.; Waters, M.A.; Butler, M.A.; Calvert, G.M.; et al. Reproductive Factors and Risk of Glioma in Women. Cancer Epidemiol. Biomark. Prev. 2004, 13, 1583–1588. [Google Scholar] [CrossRef]
- Welboren, W.-J.; Sweep, F.C.G.J.; Span, P.N.; Stunnenberg, H.G. Genomic actions of estrogen receptor α: What are the targets and how are they regulated? Endocr. Relat. Cancer 2009, 16, 1073–1089. [Google Scholar] [CrossRef] [PubMed]
- Enmark, E.; Pelto-Huikko, M.; Grandien, K.; Lagercrantz, S.; Lagercrantz, J.; Fried, G.; Nordenskjöld, M.; Gustafsson, J.-A. Human Estrogen Receptor β-Gene Structure, Chromosomal Localization, and Expression Pattern1. J. Clin. Endocrinol. Metab. 1997, 82, 4258–4265. [Google Scholar] [CrossRef]
- Menasce, L.; White, G.; Harrison, C.; Boyle, J. Localization of the Estrogen Receptor Locus (ESR) to Chromosome 6q25.1 by FISH and a Simple Post-FISH Banding Technique. Genomics 1993, 17, 263–265. [Google Scholar] [CrossRef] [PubMed]
- Ponglikitmongkol, M.; Green, S.; Chambon, P. Genomic organization of the human oestrogen receptor gene. EMBO J. 1988, 7, 3385–3388. [Google Scholar] [CrossRef] [PubMed]
- Greene, G.L.; Gilna, P.; Waterfield, M.; Baker, A.; Hort, Y.; Shine, J. Sequence and Expression of Human Estrogen Receptor Complementary DNA. Science 1986, 231, 1150–1154. [Google Scholar] [CrossRef] [PubMed]
- Zhao, C.; Dahlman-Wright, K.; Gustafsson, J. Estrogen Signaling via Estrogen Receptor β. J. Biol. Chem. 2010, 285, 39575–39579. [Google Scholar] [CrossRef] [PubMed]
- Jia, M.; Dahlman-Wright, K.; Gustafsson, J.Å. Estrogen receptor alpha and beta in health and disease. Best Pract. Res. Clin. Endocrinol. Metab. 2015, 29, 557–568. [Google Scholar] [CrossRef] [PubMed]
- Paterni, I.; Granchi, C.; Katzenellenbogen, J.A.; Minutolo, F. Estrogen receptors alpha (ERα) and beta (ERβ): Subtype-selective ligands and clinical potential. Steroids 2014, 90, 13–29. [Google Scholar] [CrossRef] [PubMed]
- Arnone, A.A.; Cline, J.M.; Soto-Pantoja, D.R.; Cook, K.L. Investigating the role of endogenous estrogens, hormone replacement therapy, and blockade of estrogen receptor-α activity on breast metabolic signaling. Breast Cancer Res. Treat. 2021, 190, 53. [Google Scholar] [CrossRef] [PubMed]
- Ignatiadis, M.; Sotiriou, C. Luminal breast cancer: From biology to treatment. Nat. Rev. Clin. Oncol. 2013, 10, 494–506. [Google Scholar] [CrossRef] [PubMed]
- Osborne, C.K. Tamoxifen in the Treatment of Breast Cancer. N. Engl. J. Med. 1998, 339, 1609–1618. [Google Scholar] [CrossRef] [PubMed]
- Johnston, S.J.; Cheung, K.L. Fulvestrant—A Novel Endocrine Therapy for Breast Cancer. Curr. Med. Chem. 2010, 17, 902–914. [Google Scholar] [CrossRef] [PubMed]
- Mishra, S.; Tai, Q.; Gu, X.; Schmitz, J.; Poullard, A.; Fajardo, R.J.; Mahalingam, D.; Chen, X.; Zhu, X.; Sun, L.-Z. Estrogen and estrogen receptor alpha promotes malignancy and osteoblastic tumorigenesis in prostate cancer. Oncotarget 2015, 6, 44388–44402. [Google Scholar] [CrossRef] [PubMed]
- Grimm, M.; Biegner, T.; Teriete, P.; Hoefert, S.; Krimmel, M.; Munz, A.; Reinert, S. Estrogen and Progesterone hormone receptor expression in oral cavity cancer. Oral Med. Pathol. 2016, 21, e554–e558. [Google Scholar] [CrossRef] [PubMed][Green Version]
- Huang, X.; Wang, X.; Shang, J.; Zhaang, Z.; Cui, B.; Lin, Y.; Yang, Y.; Song, Y.; Yu, S.; Xia, J. Estrogen related receptor alpha triggers the migration and invasion of endometrial cancer cells via up regulation of TGFB1. Cell Adhes. Migr. 2018, 12, 538–547. [Google Scholar] [CrossRef] [PubMed]
- Zhao, Y.; Li, Z. Interplay of estrogen receptors and FOXA factors in the liver cancer. Mol. Cell. Endocrinol. 2015, 418, 334–339. [Google Scholar] [CrossRef] [PubMed]
- Chan, K.K.L.; Wei, N.B.; Liu, S.S.; Xiao-Yun, L.M.; Cheung, A.N.; Ngan, H.Y.S. Estrogen Receptor Subtypes in Ovarian Cancer. Obstet. Gynecol. 2008, 111, 144–151. [Google Scholar] [CrossRef] [PubMed]
- Halon, A.; Nowak-Markwitz, E.; Maciejczyk, A.; Pudelko, M.; Gansukh, T.; Györffy, B.; Donizy, P.; Murawa, D.; Matkowski, R.; Spaczynski, M.; et al. Loss of Estrogen Receptor Beta Expression Correlates with Shorter Overall Survival and Lack of Clinical Response to Chemotherapy in Ovarian Cancer Patients. Anticancer Res. 2011, 31, 711–718. [Google Scholar] [PubMed]
- De Stefano, I.; Zannoni, G.F.; Prisco, M.G.; Fagotti, A.; Tortorella, L.; Vizzielli, G.; Mencaglia, L.; Scambia, G.; Gallo, D. Cytoplasmic expression of estrogen receptor beta (ERβ) predicts poor clinical outcome in advanced serous ovarian cancer. Gynecol. Oncol. 2011, 122, 573–579. [Google Scholar] [CrossRef] [PubMed]
- Zhao, C.; Lam, E.W.-F.; Sunters, A.; Enmark, E.; De Bella, M.T.; Coombes, R.C.; Gustafsson, J.; Dahlman-Wright, K. Expression of estrogen receptor β isoforms in normal breast epithelial cells and breast cancer: Regulation by methylation. Oncogene 2003, 22, 7600–7606. [Google Scholar] [CrossRef] [PubMed]
- Cotrim, C.Z.; Fabris, V.; Doria, M.L.; Lindberg, K.; Gustafsson, J.; Amado, F.; Lanari, C.; Helguero, L.A. Estrogen receptor beta growth-inhibitory effects are repressed through activation of MAPK and PI3K signalling in mammary epithelial and breast cancer cells. Oncogene 2012, 32, 2390–2402. [Google Scholar] [CrossRef] [PubMed]
- Treeck, O.; Juhasz-Boess, I.; Lattrich, C.; Horn, F.; Goerse, R.; Ortmann, O. Effects of exon-deleted estrogen receptor β transcript variants on growth, apoptosis and gene expression of human breast cancer cell lines. Breast Cancer Res Treat. 2008, 110, 507–520. [Google Scholar] [CrossRef] [PubMed]
- Nojima, D.; Li, L.-C.; Dharia, A.; Perinchery, G.; Ribeiro-Filho, L.; Yen, T.S.; Dahiya, R. CpG Hypermethylation of the Promoter Region Inactivates the Estrogen Receptor-Gene in Patients with Prostate Carcinoma. Cancer 2001, 92, 2076–2083. [Google Scholar] [CrossRef] [PubMed]
- Edvardsson, K.; Ström, A.; Jonsson, P.; Gustafsson, J.-Å.; Williams, C. Estrogen Receptor β Induces Antiinflammatory and Antitumorigenic Networks in Colon Cancer Cells. Mol. Endocrinol. 2011, 25, 969–979. [Google Scholar] [CrossRef] [PubMed]
- Yague, J.G.; Lavaque, E.; Carretero, J.; Azcoitia, I.; Garcia-Segura, L.M. Aromatase, the enzyme responsible for estrogen biosynthesis, is expressed by human and rat glioblastomas. Neurosci. Lett. 2004, 368, 279–284. [Google Scholar] [CrossRef] [PubMed]
- Hui, A.-M.; Zhang, W.; Chen, W.; Xi, D.; Purow, B.; Friedman, G.C.; Fine, H.A. Agents with Selective Estrogen Receptor (ER) Modulator Activity Induce Apoptosis In vitro and In vivo in ER-Negative Glioma Cells. Cancer Res 2004, 64, 9115–9123. [Google Scholar] [CrossRef] [PubMed][Green Version]
- Sareddy, G.R.; Nair, B.C.; Gonugunta, V.K.; Zhang, Q.-G.; Brenner, A.; Brann, D.W.; Tekmal, R.R.; Vadlamudi, R.K. Therapeutic significance of estrogen receptor β agonists in gliomas. Mol. Cancer Ther. 2012, 11, 1174–1182. [Google Scholar] [CrossRef] [PubMed]
- González-Arenas, A.; De la Fuente-Granada, M.; Camacho-Arroyo, I.; Zamora-Sánchez, C.J.; Piña-Medina, A.G.; Segura-Uribe, J.; Guerra-Araiza, C. Tibolone Effects on Human Glioblastoma Cell Lines. Arch. Med. Res. 2019, 50, 187–196. [Google Scholar] [CrossRef] [PubMed]
- Hönikl, L.S.; Lämmer, F.; Gempt, J.; Meyer, B.; Schlegel, J.; Delbridge, C. High expression of estrogen receptor alpha and aromatase in glial tumor cells is associated with gender-independent survival benefits in glioblastoma patients. J. Neuro-Oncol. 2020, 147, 567. [Google Scholar] [CrossRef] [PubMed]
- Hernández-Vega, A.M.; Camacho-Arroyo, I. Crosstalk between 17β-Estradiol and TGF-β Signaling Modulates Glioblastoma Progression. Brain Sci. 2021, 11, 564. [Google Scholar] [CrossRef] [PubMed]
- Hernández-Vega, A.M.; Del Moral-Morales, A.; Zamora-Sánchez, C.J.; Piña-Medina, A.G.; González-Arenas, A.; Camacho-Arroyo, I. Estradiol Induces Epithelial to Mesenchymal Transition of Human Glioblastoma Cells. Cells 2020, 9, 1930. [Google Scholar] [CrossRef]
- González-Arenas, A.; Hansberg-Pastor, V.; Hernández-Hernández, O.T.; González-García, T.K.; Henderson-Villalpando, J.; Lemus-Hernández, D.; Cruz-Barrios, A.; Rivas-Suárez, M.; Camacho-Arroyo, I. Estradiol increases cell growth in human astrocytoma cell lines through ERα activation and its interaction with SRC-1 and SRC-3 coactivators. Biochim. Biophys. Acta (BBA) Mol. Cell Res. 2012, 1823, 379–386. [Google Scholar] [CrossRef] [PubMed]
- Qu, C.; Ma, J.; Zhang, Y.; Han, C.; Huang, L.; Shen, L.; Li, H.; Wang, X.; Liu, J.; Zou, W. Estrogen receptor variant ER-α36 promotes tamoxifen agonist activity in glioblastoma cells. Cancer Sci. 2018, 110, 221. [Google Scholar] [CrossRef] [PubMed]
- Liu, Y.; Huang, L.; Guan, X.; Li, H.; Zhang, Q.-Q.; Han, C.; Wang, Y.-J.; Wang, C.; Zhang, Y.; Qu, C.; et al. ER-α36, a novel variant of ERα, is involved in the regulation of Tamoxifen-sensitivity of glioblastoma cells. Steroids 2016, 111, 127–133. [Google Scholar] [CrossRef] [PubMed]
- Ikeda, K.; Horie-Inoue, K.; Inoue, S. Identification of estrogen-responsive genes based on the DNA binding properties of estrogen receptors using high-throughput sequencing technology. Acta Pharmacol. Sin. 2015, 36, 24–31. [Google Scholar] [CrossRef] [PubMed]
- Habib, P.; Dang, J.; Slowik, A.; Victor, M.; Beyer, C. Hypoxia-Induced Gene Expression of Aquaporin-4, Cyclooxygenase-2 and Hypoxia-Inducible Factor 1α in Rat Cortical Astroglia Is Inhibited by 17β-Estradiol and Progesterone. Neuroendocrinology 2014, 99, 156–167. [Google Scholar] [CrossRef]
- Kim, M.; Neinast, M.D.; Frank, A.P.; Sun, K.; Park, J.; Zehr, J.A.; Vishvanath, L.; Morselli, E.; Amelotte, M.; Palmer, B.F.; et al. ERα upregulates Phd3 to ameliorate HIF-1 induced fibrosis and inflammation in adipose tissue. Mol. Metab. 2014, 3, 642. [Google Scholar] [CrossRef] [PubMed]
- Jiménez, J.M.D.; Arellano, A.C.; Santerre, A.; Suárez, S.O.; Sánchez, H.S.; Romero, I.F.; López-Elizalde, R.; Venegas, M.A.; Netel, B.; de la Torre Valdovinos, B.; et al. Aromatase and estrogen receptor alpha mRNA expression as prognostic biomarkers in patients with astrocytomas. J. Neuro-Oncol. 2014, 119, 275–284. [Google Scholar] [CrossRef] [PubMed]
- Liu, C.; Zhang, Y.; Zhang, K.; Bian, C.; Zhao, Y.; Zhang, J. Expression of estrogen receptors, androgen receptor and steroid receptor coactivator-3 is negatively correlated to the differentiation of astrocytic tumors. Cancer Epidemiol. 2014, 38, 291–297. [Google Scholar] [CrossRef] [PubMed]
- Paterni, I.; Bertini, S.; Granchi, C.; Tuccinardi, T.; Macchia, M.; Martinelli, A.; Caligiuri, I.; Toffoli, G.; Rizzolio, F.; Carlson, K.E.; et al. Highly Selective Salicylketoxime-Based Estrogen Receptor β Agonists Display Antiproliferative Activities in a Glioma Model. J. Med. Chem. 2015, 58, 1184. [Google Scholar] [CrossRef] [PubMed]
- Cao, L.; Qu, D.; Wang, H.; Zhang, S.; Jia, C.; Shi, Z.; Wang, Z.; Zhang, J.; Ma, J. Toosendanin Exerts an Anti-Cancer Effect in Glioblastoma by Inducing Estrogen Receptor β- and p53-Mediated Apoptosis. Int. J. Mol. Sci. 2016, 17, 1928. [Google Scholar] [CrossRef] [PubMed]
- Wan, S.; Jiang, J.; Zheng, C.; Wang, N.; Zhai, X.; Fei, X.; Wu, R.; Jiang, X. Estrogen nuclear receptors affect cell migration by altering sublocalization of AQP2 in glioma cell lines. Cell Death Discov. 2018, 4, 49. [Google Scholar] [CrossRef] [PubMed]
- Liu, X.; Wang, L.; Chen, J.; Ling, Q.; Wang, H.; Li, S.; Li, L.; Yang, S.; Xia, M.; Jing, L. Estrogen receptor β agonist enhances temozolomide sensitivity of glioma cells by inhibiting PI3K/AKT/mTOR pathway. Mol. Med. Rep. 2015, 11, 1516–1522. [Google Scholar] [CrossRef] [PubMed]
- Kim, J.-H.; Jeong, I.-Y.; Lim, Y.-H.; Lee, Y.-H.; Shin, S.-Y. Estrogen receptor β stimulates Egr-1 transcription via MEK1/Erk/Elk-1 cascade in C6 glioma cells. BMB Rep. 2011, 44, 452–457. [Google Scholar] [CrossRef] [PubMed]
- Li, W.; Winters, A.; Poteet, E.; Ryou, M.-G.; Lin, S.; Hao, S.; Wu, Z.; Yuan, F.; Hatanpaa, K.J.; Simpkins, J.W.; et al. Involvement of estrogen receptor β5 in the progression of glioma. Brain Res. 2013, 1503, 97–107. [Google Scholar] [CrossRef] [PubMed][Green Version]
- Attwood, K.M.; Robichaud, A.; Westhaver, L.P.; Castle, E.L.; Brandman, D.M.; Balgi, A.D.; Roberge, M.; Colp, P.; Croul, S.; Kim, I.; et al. Raloxifene prevents stress granule dissolution, impairs translational control and promotes cell death during hypoxia in glioblastoma cells. Cell Death Dis. 2020, 11, 989. [Google Scholar] [CrossRef] [PubMed]
- Batistatou, A.; Stefanou, D.; Goussia, A.; Arkoumani, E.; Papavassiliou, A.G.; Agnantis, N.J. Estrogen receptor beta (ER?) is expressed in brain astrocytic tumors and declines with dedifferentiation of the neoplasm. J. Cancer Res. Clin. Oncol. 2004, 130, 405–410. [Google Scholar] [CrossRef] [PubMed]
- Batistatou, A.; Kyzas, P.A.; Goussia, A.; Arkoumani, E.; Voulgaris, S.; Polyzoidis, K.; Agnantis, N.J.; Stefanou, D. Estrogen receptor beta (ERβ) protein expression correlates with BAG-1 and prognosis in brain glial tumours. J. Neuro-Oncol. 2005, 77, 17–23. [Google Scholar] [CrossRef] [PubMed]
- Shafiei, M.; Mafi, A.; Nilipour, Y.; Sourati, A.; Sasanpour, P.; Tabatabaeefar, M. Estrogen Receptor Expression in Glial Tumors of Iranian Patients: A Single Center Experience. Iran. J. Pathol. 2020, 15, 7–12. [Google Scholar] [CrossRef] [PubMed]
- Liu, J.; Sareddy, G.R.; Zhou, M.; Viswanadhapalli, S.; Li, X.; Lai, Z.; Tekmal, R.R.; Brenner, A.J.; Vadlamudi, R.K. Differential Effects of Estrogen Receptor β Isoforms on Glioblastoma Progression. Cancer Res 2018, 78, 3176–3189. [Google Scholar] [CrossRef] [PubMed]
- Pratap, U.P.; Sareddy, G.R.; Liu, Z.; Venkata, P.P.; Liu, J.; Tang, W.; Altwegg, K.A.; Ebrahimi, B.; Li, X.; Tekmal, R.R.; et al. Histone deacetylase inhibitors enhance estrogen receptor beta expression and augment agonist-mediated tumor suppression in glioblastoma. Neuro-Oncol. Adv. 2021, 3, vdab099. [Google Scholar] [CrossRef] [PubMed]
- Kefalopoulou, Z.; Tzelepi, V.; Zolota, V.; Grivas, P.D.; Christopoulos, C.; Kalofonos, H.; Maraziotis, T.; Sotiropoulou-Bonikou, G. Prognostic value of novel biomarkers in astrocytic brain tumors: Nuclear receptor co-regulators AIB1, TIF2, and PELP1 are associated with high tumor grade and worse patient prognosis. J. Neuro-Oncol. 2012, 106, 23–31. [Google Scholar] [CrossRef] [PubMed]
- Simińska, D.; Korbecki, J.; Kojder, K.; Jeżewski, D.; Tarnowski, M.; Tomasiak, P.; Piotrowska, K.; Masztalewicz, M.; Kolasa, A.; Chlubek, D.; et al. Androgen Receptor Expression in the Various Regions of Resected Glioblastoma Multiforme Tumors and in an In Vitro Model. Int. J. Mol. Sci. 2022, 23, 13004. [Google Scholar] [CrossRef] [PubMed]
- Scherer, H.J. A critical review: The pathology of cerebral gliomas. J. Neurol. Psychiatry 1940, 3, 147–177. [Google Scholar] [CrossRef] [PubMed]


Disclaimer/Publisher’s Note: The statements, opinions and data contained in all publications are solely those of the individual author(s) and contributor(s) and not of MDPI and/or the editor(s). MDPI and/or the editor(s) disclaim responsibility for any injury to people or property resulting from any ideas, methods, instructions or products referred to in the content. |
© 2024 by the authors. Licensee MDPI, Basel, Switzerland. This article is an open access article distributed under the terms and conditions of the Creative Commons Attribution (CC BY) license (https://creativecommons.org/licenses/by/4.0/).
Share and Cite
Simińska, D.; Kojder, K.; Jeżewski, D.; Tarnowski, M.; Tomasiak, P.; Piotrowska, K.; Kolasa, A.; Patrycja, K.; Chlubek, D.; Baranowska-Bosiacka, I. Estrogen α and β Receptor Expression in the Various Regions of Resected Glioblastoma Multiforme Tumors and in an In Vitro Model. Int. J. Mol. Sci. 2024, 25, 4130. https://doi.org/10.3390/ijms25074130
Simińska D, Kojder K, Jeżewski D, Tarnowski M, Tomasiak P, Piotrowska K, Kolasa A, Patrycja K, Chlubek D, Baranowska-Bosiacka I. Estrogen α and β Receptor Expression in the Various Regions of Resected Glioblastoma Multiforme Tumors and in an In Vitro Model. International Journal of Molecular Sciences. 2024; 25(7):4130. https://doi.org/10.3390/ijms25074130
Chicago/Turabian StyleSimińska, Donata, Klaudyna Kojder, Dariusz Jeżewski, Maciej Tarnowski, Patrycja Tomasiak, Katarzyna Piotrowska, Agnieszka Kolasa, Kapczuk Patrycja, Dariusz Chlubek, and Irena Baranowska-Bosiacka. 2024. "Estrogen α and β Receptor Expression in the Various Regions of Resected Glioblastoma Multiforme Tumors and in an In Vitro Model" International Journal of Molecular Sciences 25, no. 7: 4130. https://doi.org/10.3390/ijms25074130
APA StyleSimińska, D., Kojder, K., Jeżewski, D., Tarnowski, M., Tomasiak, P., Piotrowska, K., Kolasa, A., Patrycja, K., Chlubek, D., & Baranowska-Bosiacka, I. (2024). Estrogen α and β Receptor Expression in the Various Regions of Resected Glioblastoma Multiforme Tumors and in an In Vitro Model. International Journal of Molecular Sciences, 25(7), 4130. https://doi.org/10.3390/ijms25074130