
Cellular Imaging and Time-Domain FLIM Studies of Meso-Tetraphenylporphine Disulfonate as a Photosensitising Agent in 2D and 3D Models


 , and
, and 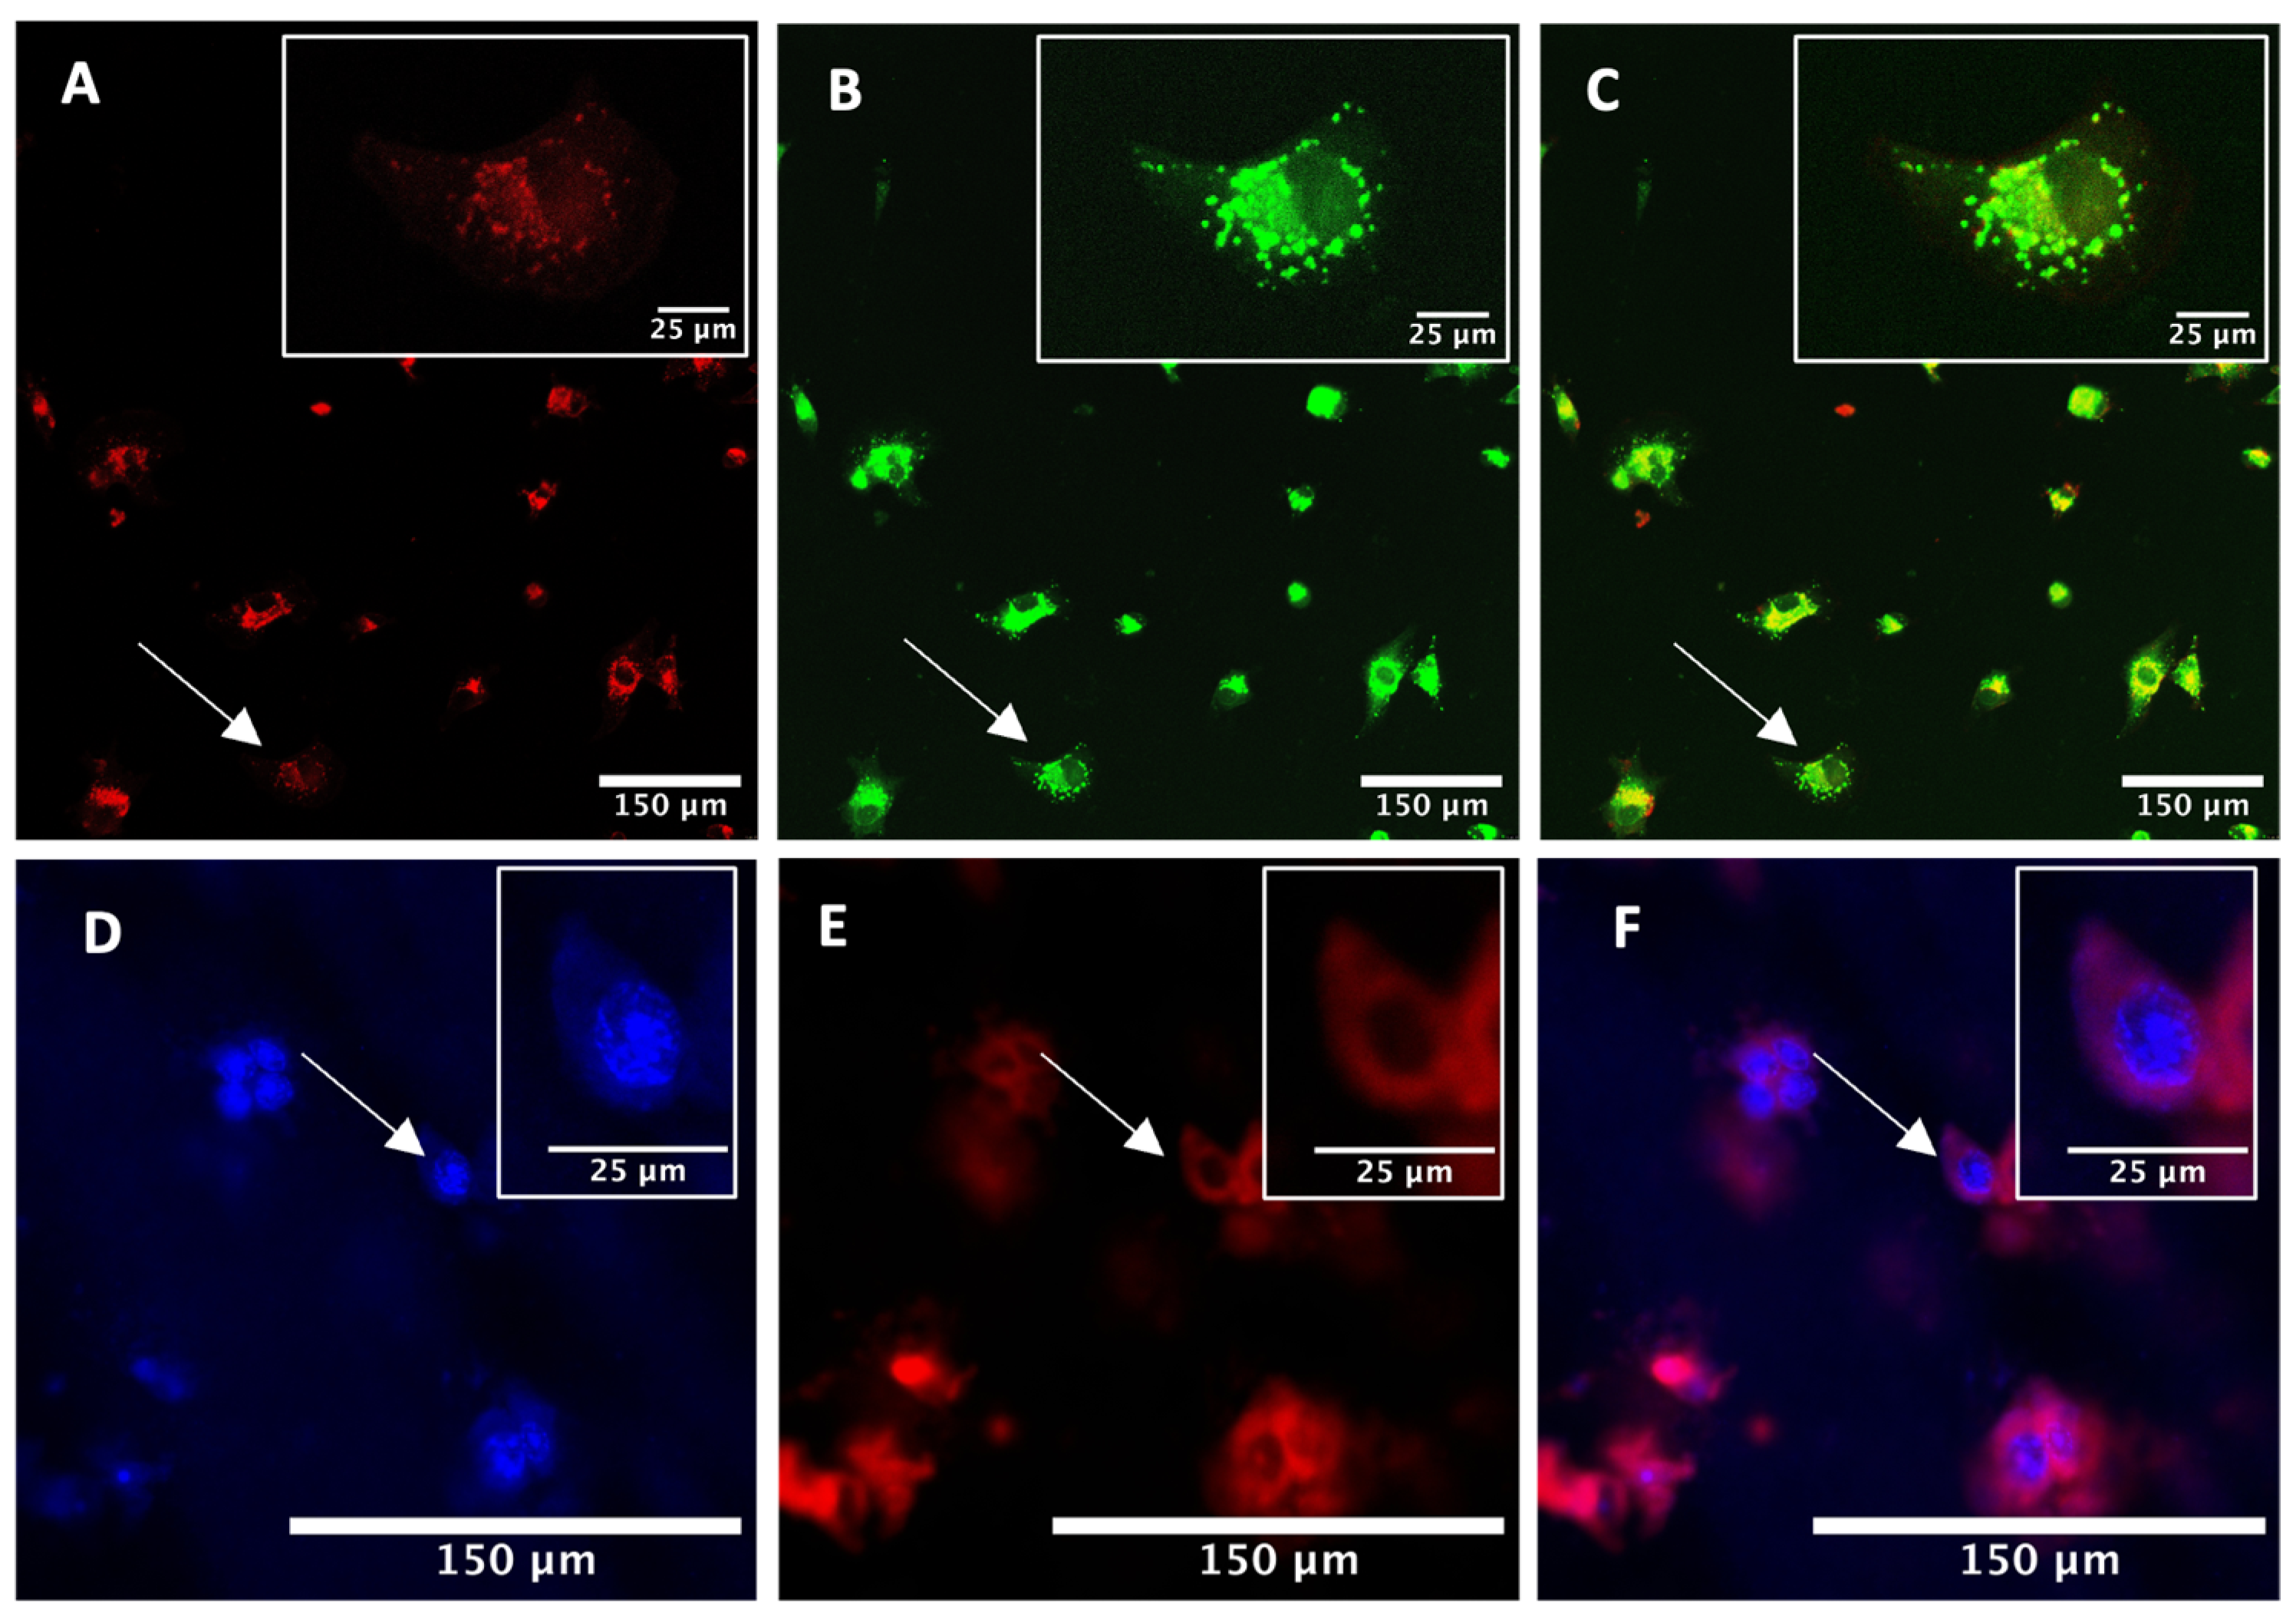
Abstract
1. Introduction
2. Results
2.1. Intracellular Uptake and Localisation of TPPS2a
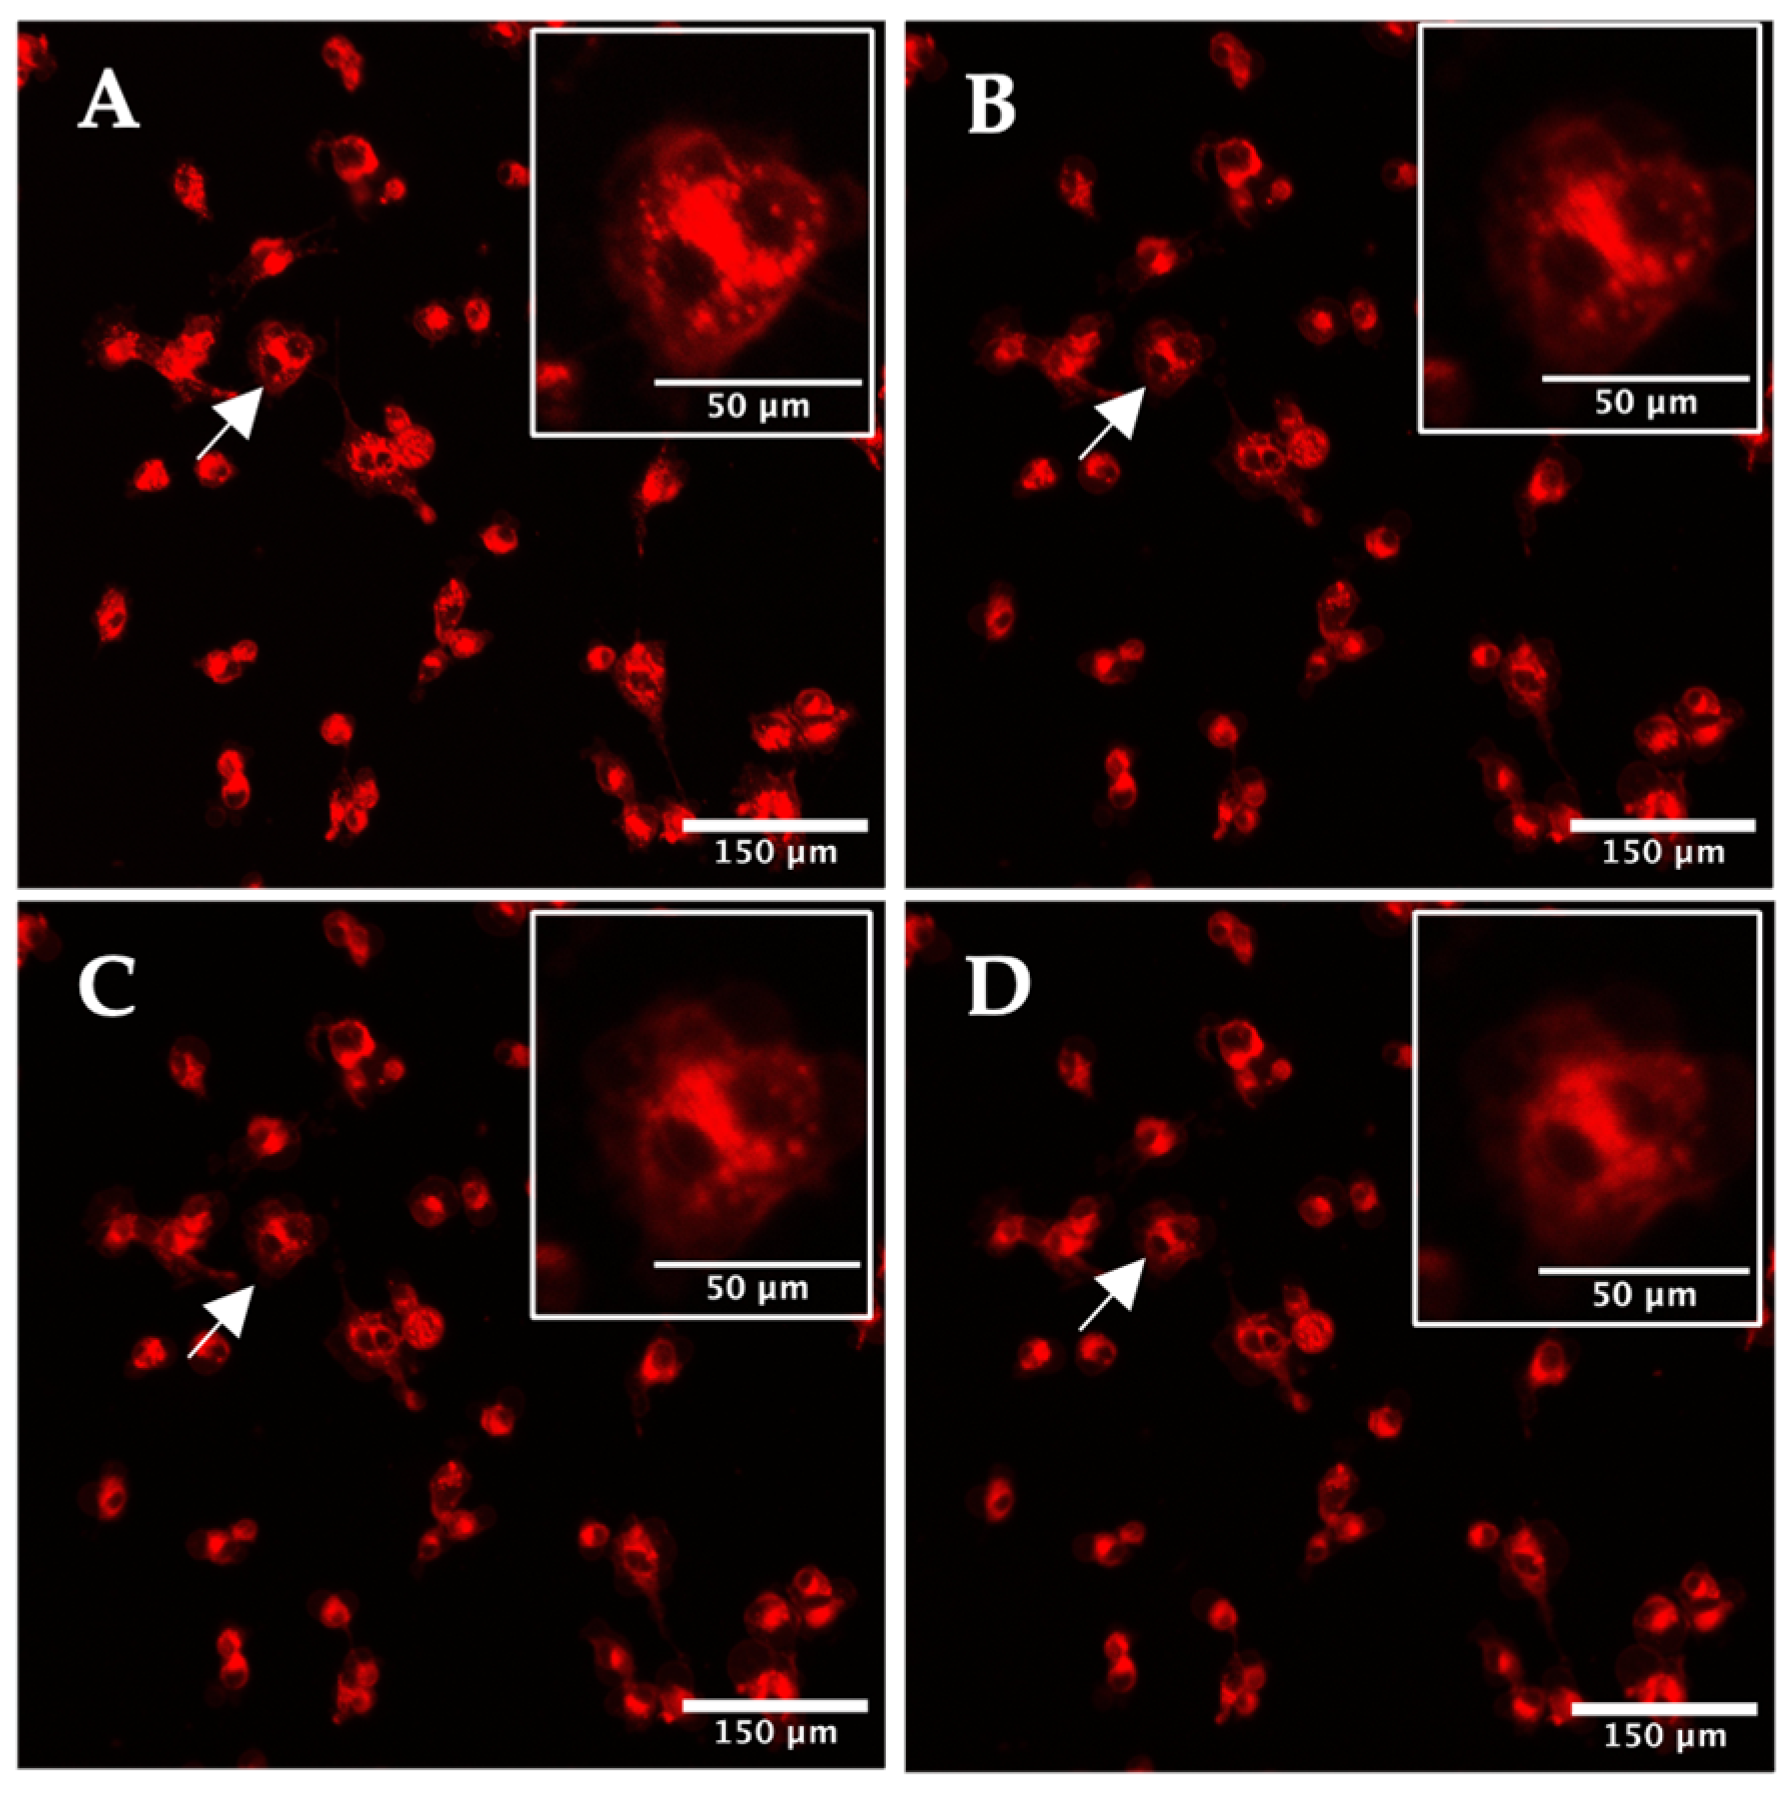
2.2. Real-Time Imaging of the Photodynamic Action of TPPS2a
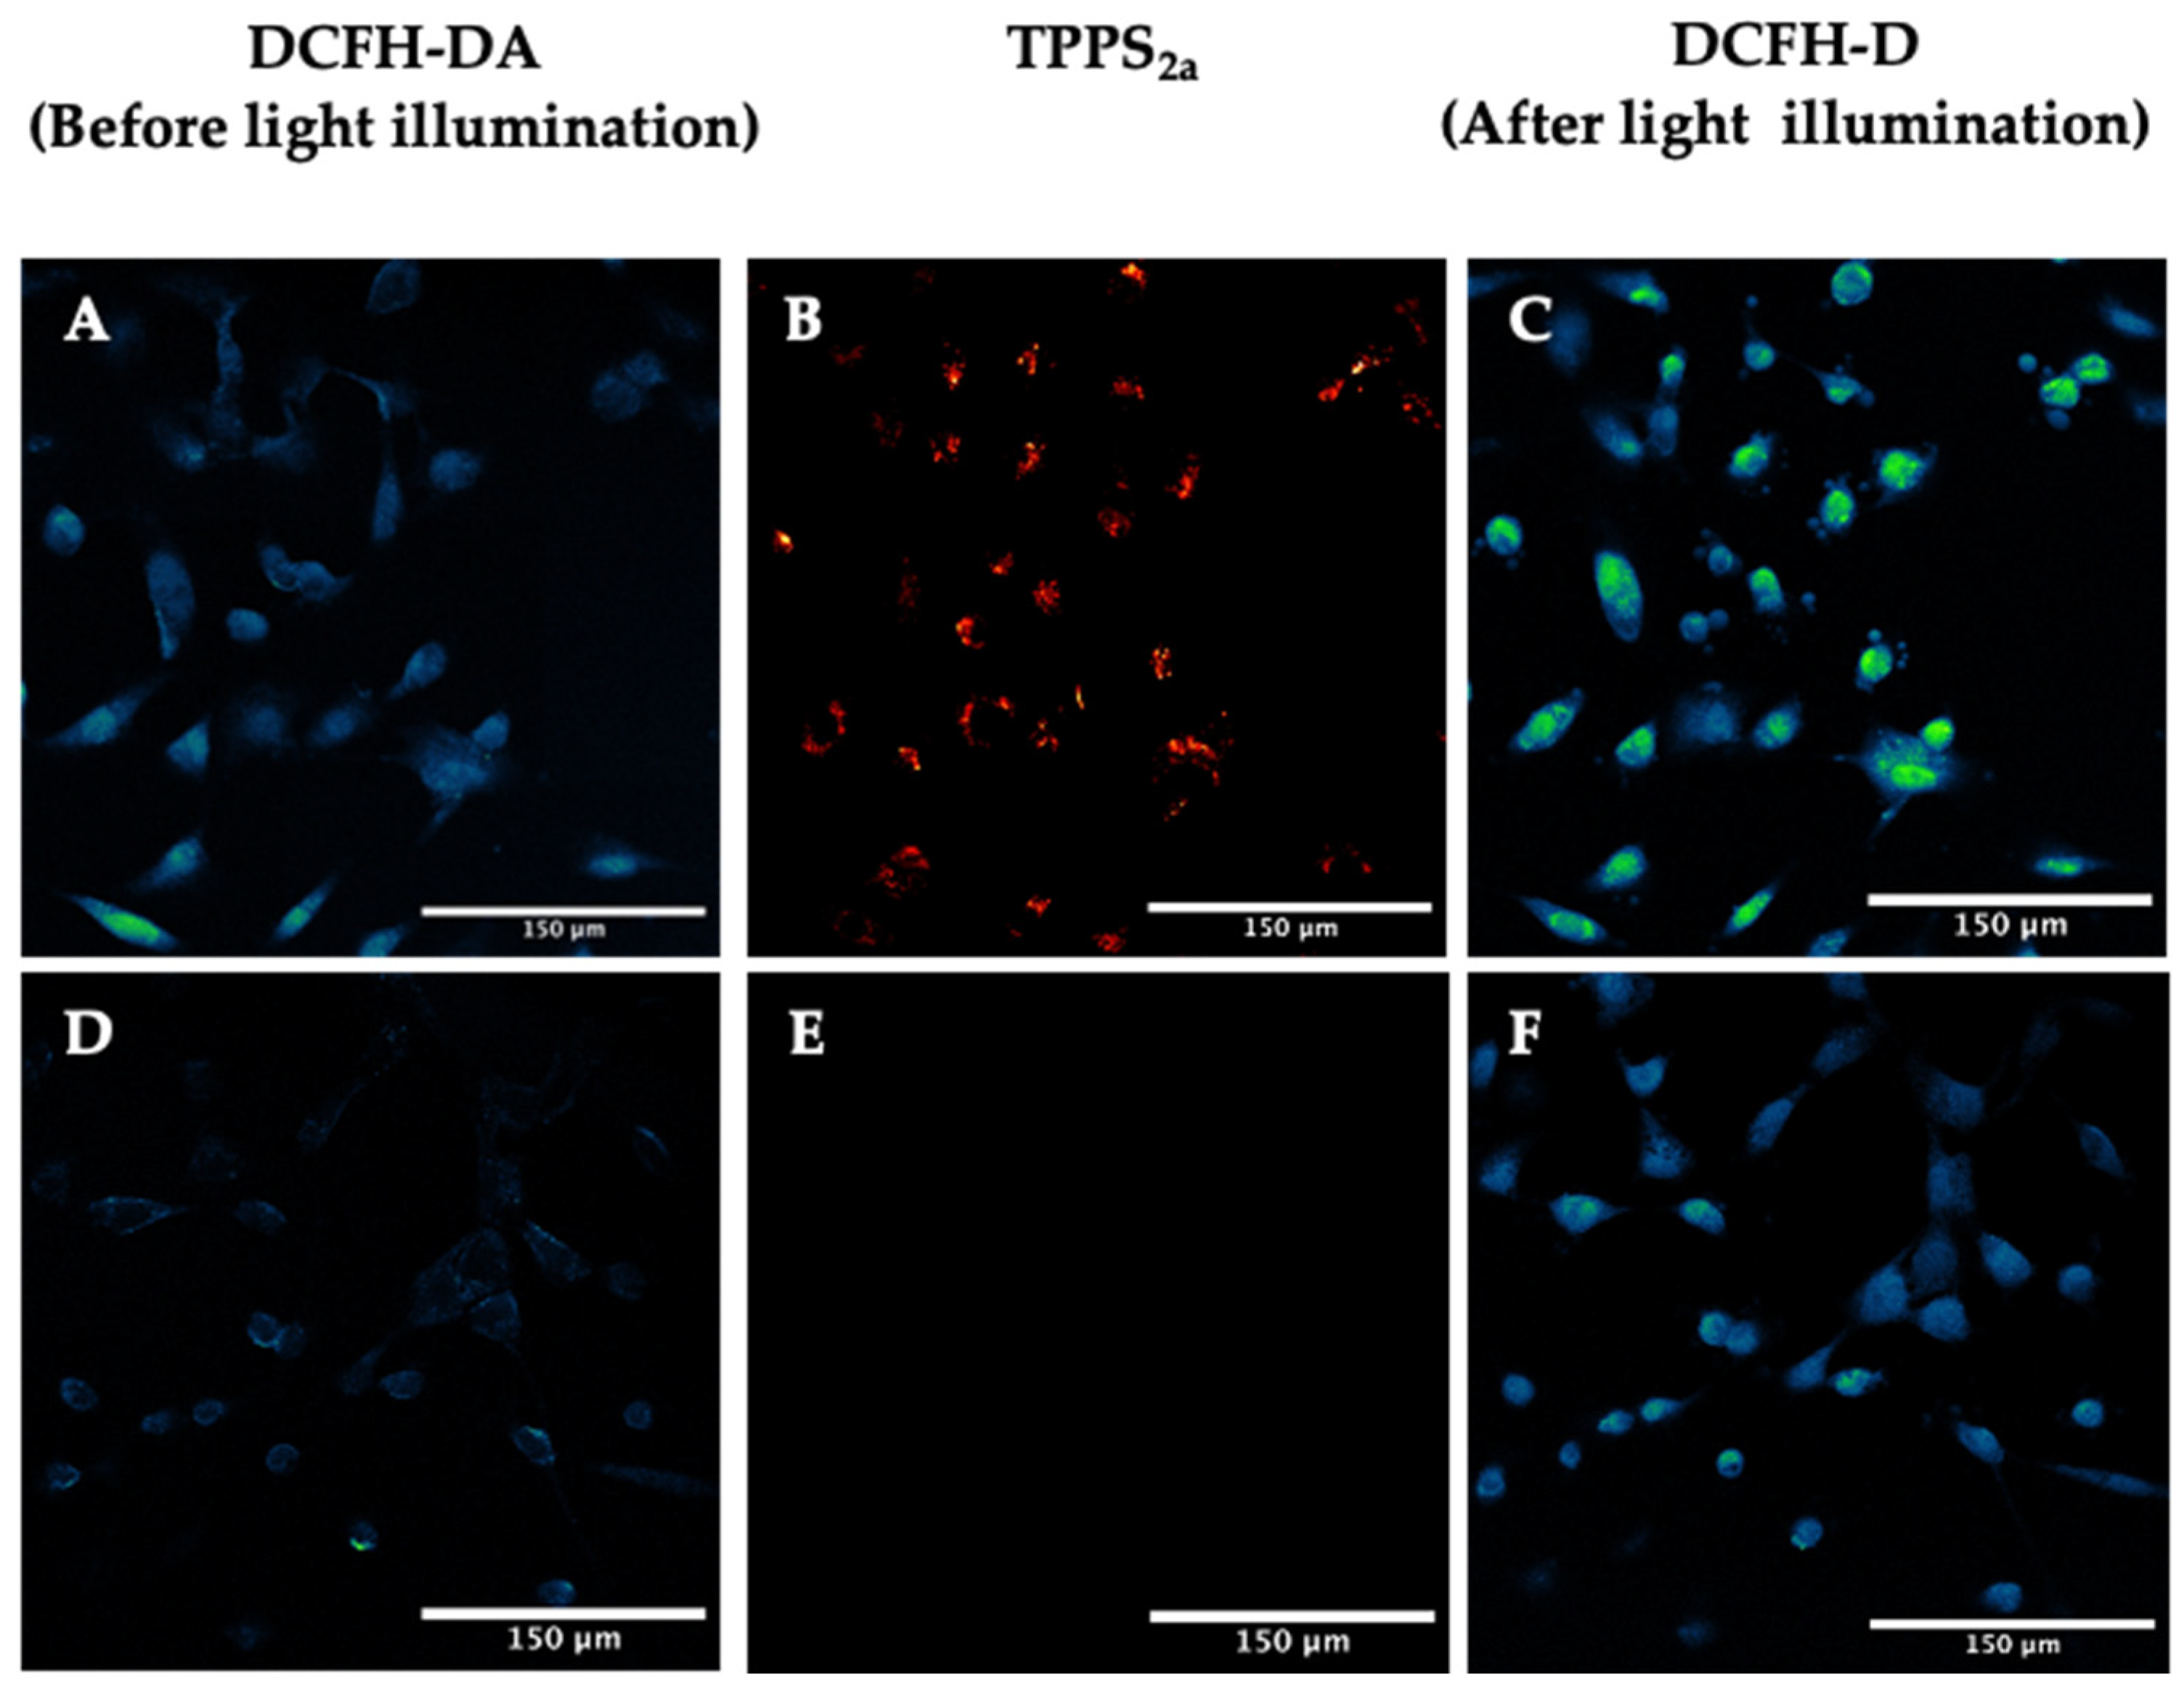
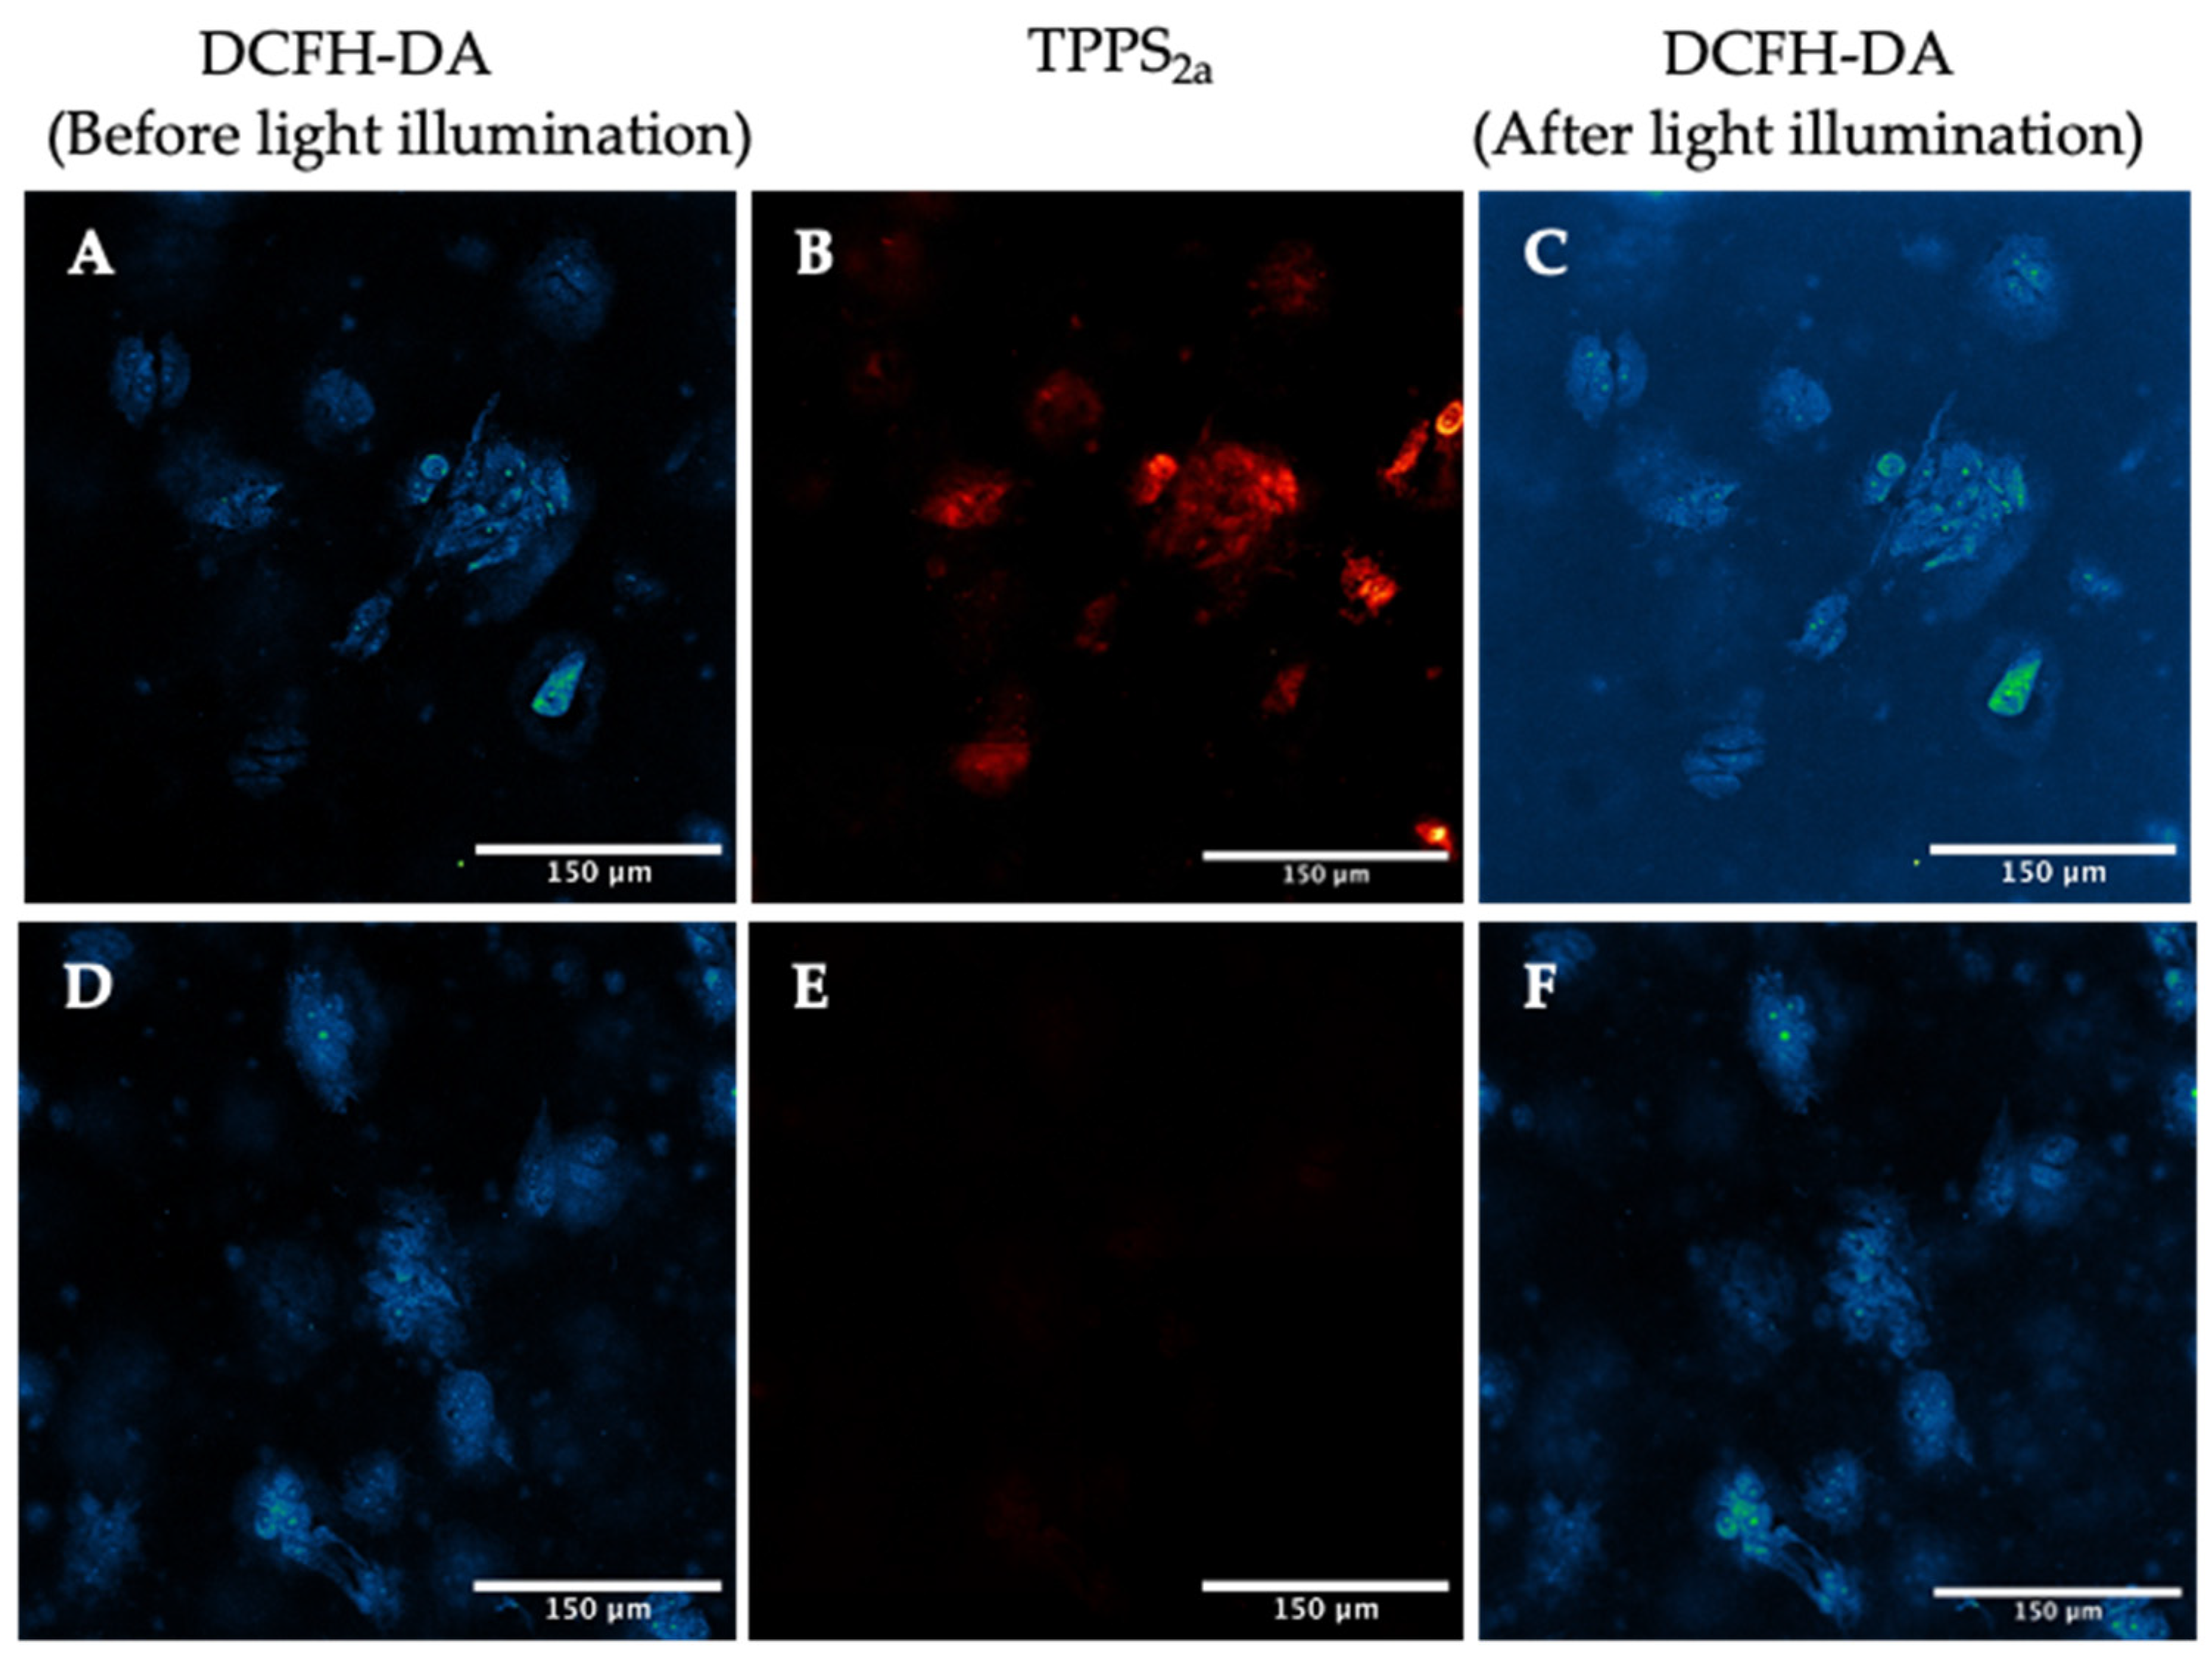
2.3. Detection of Reactive Oxygen Species Generation in 2D and 3D Cancer Models
2.3.1. Dichlorofluorescein Diacetate (DCFH-DA) Assay
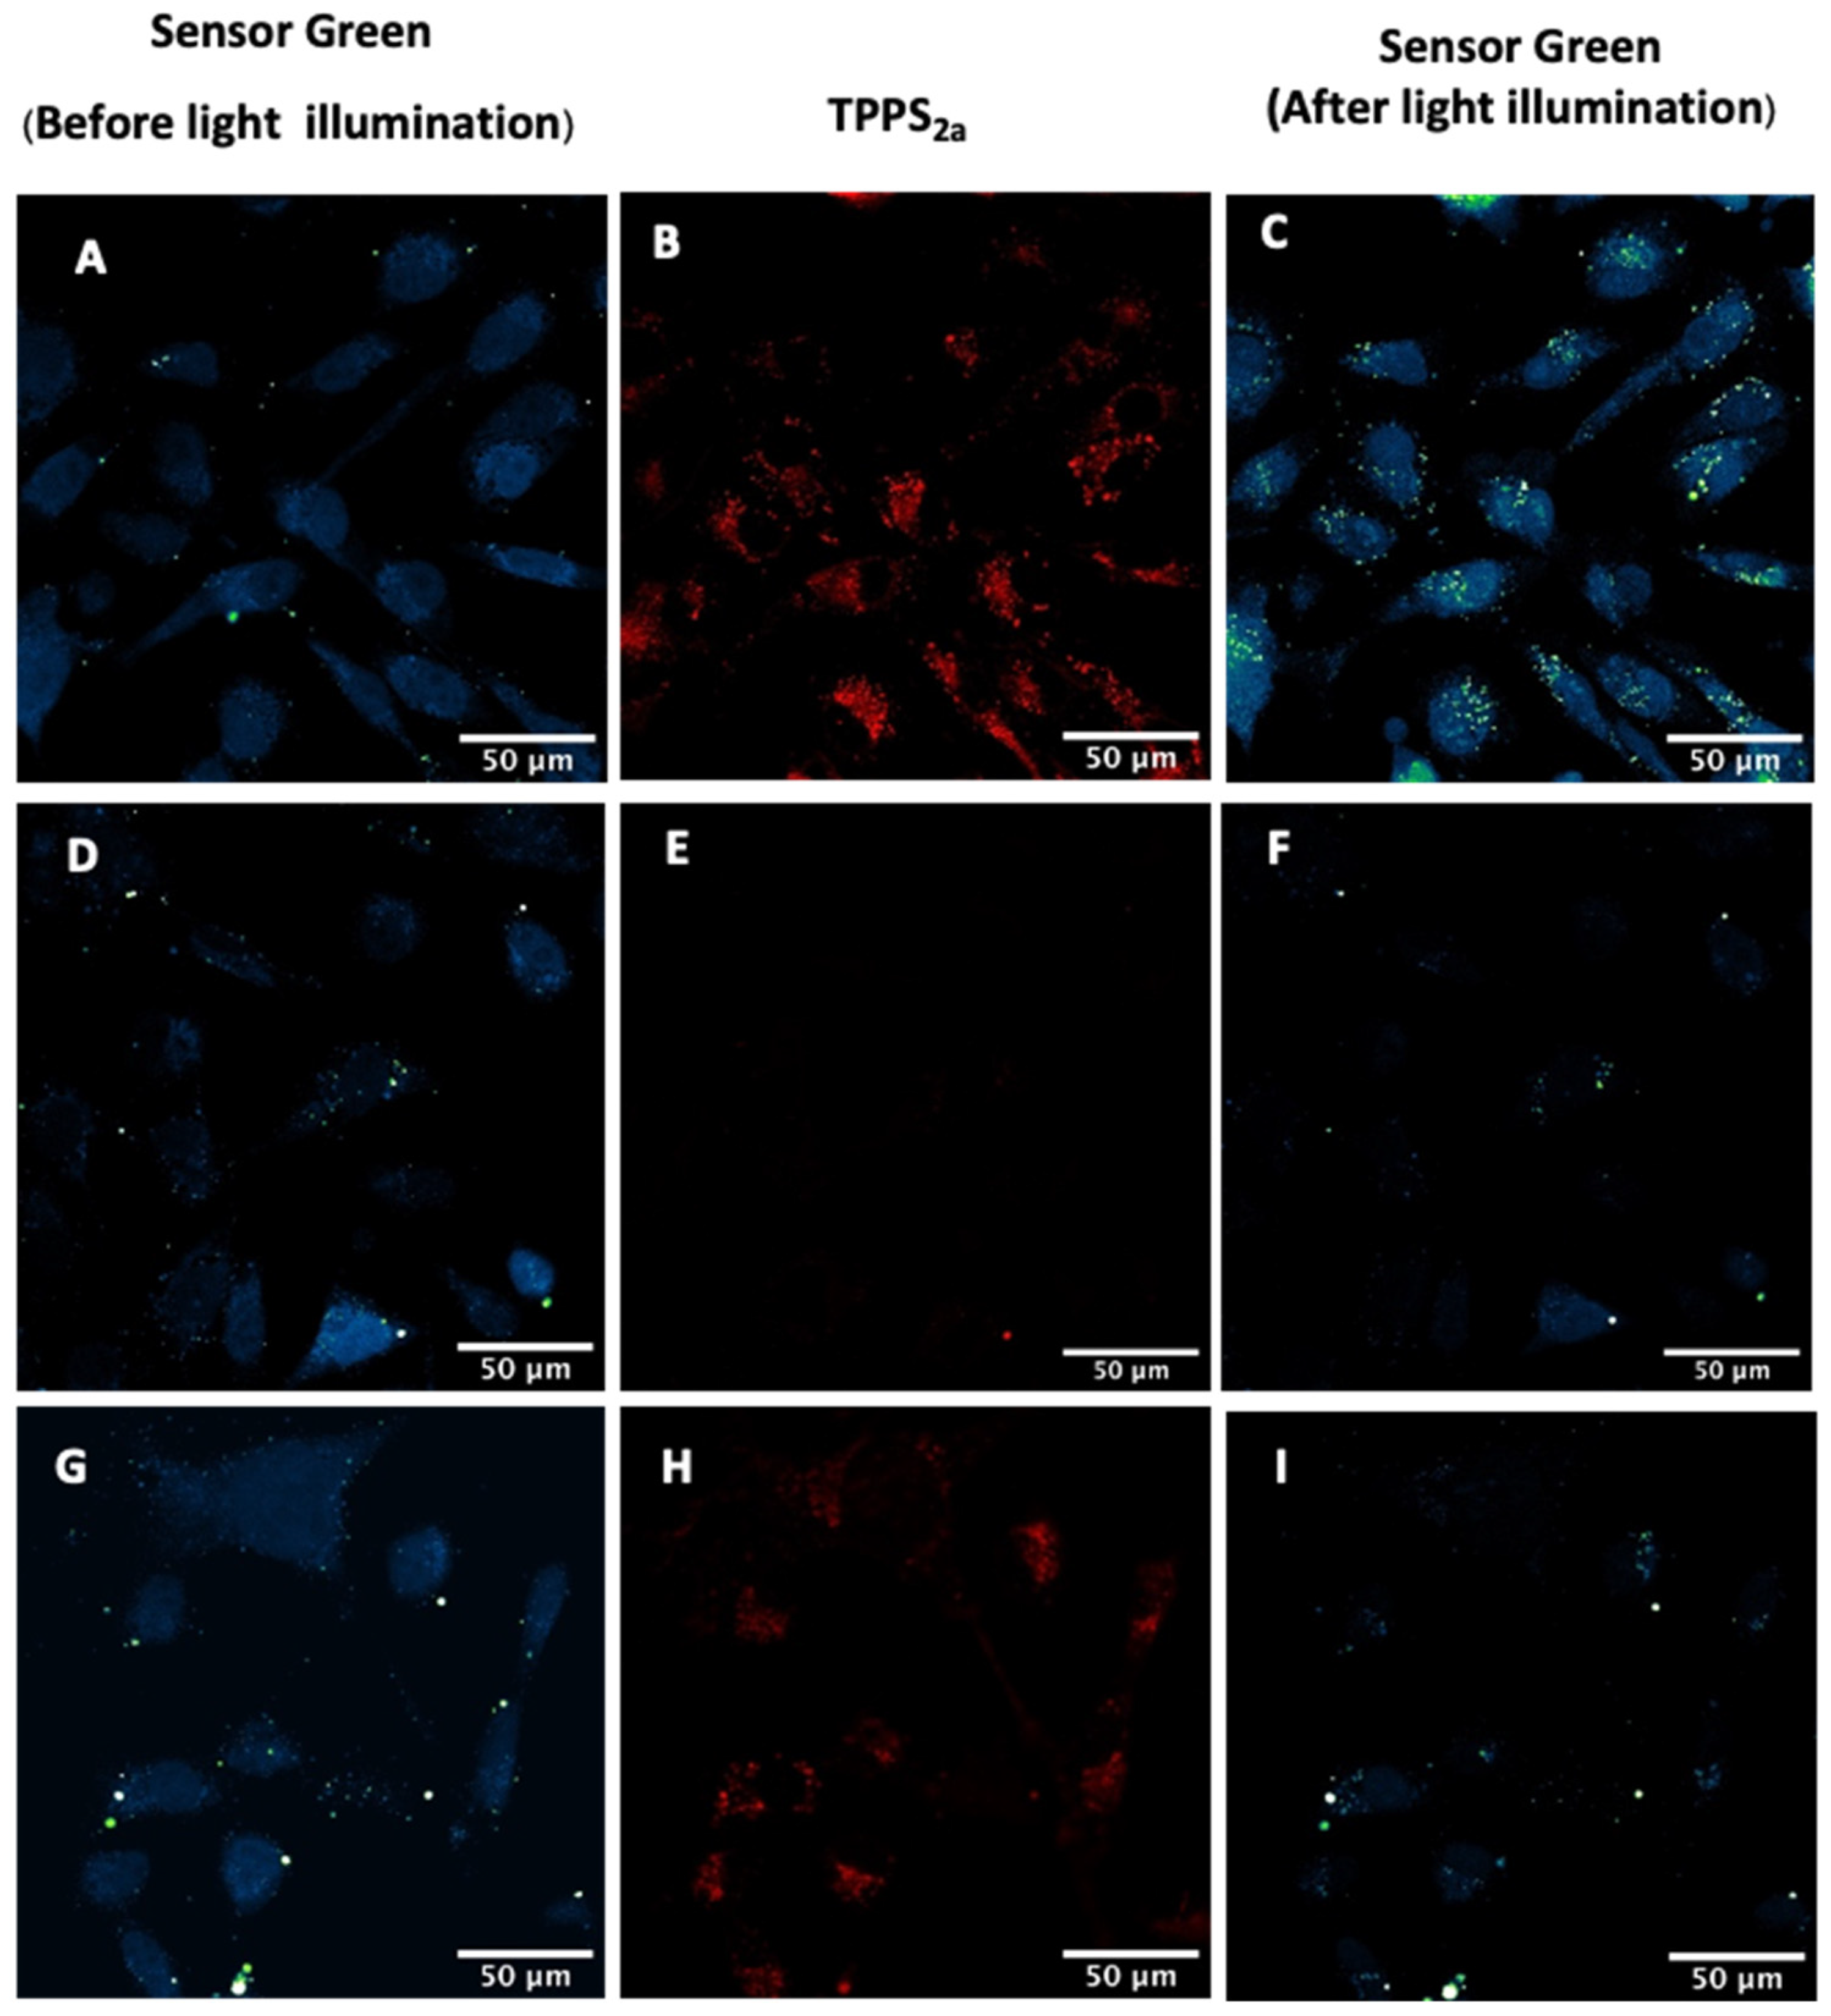
2.3.2. Detection of Singlet Oxygen Generation
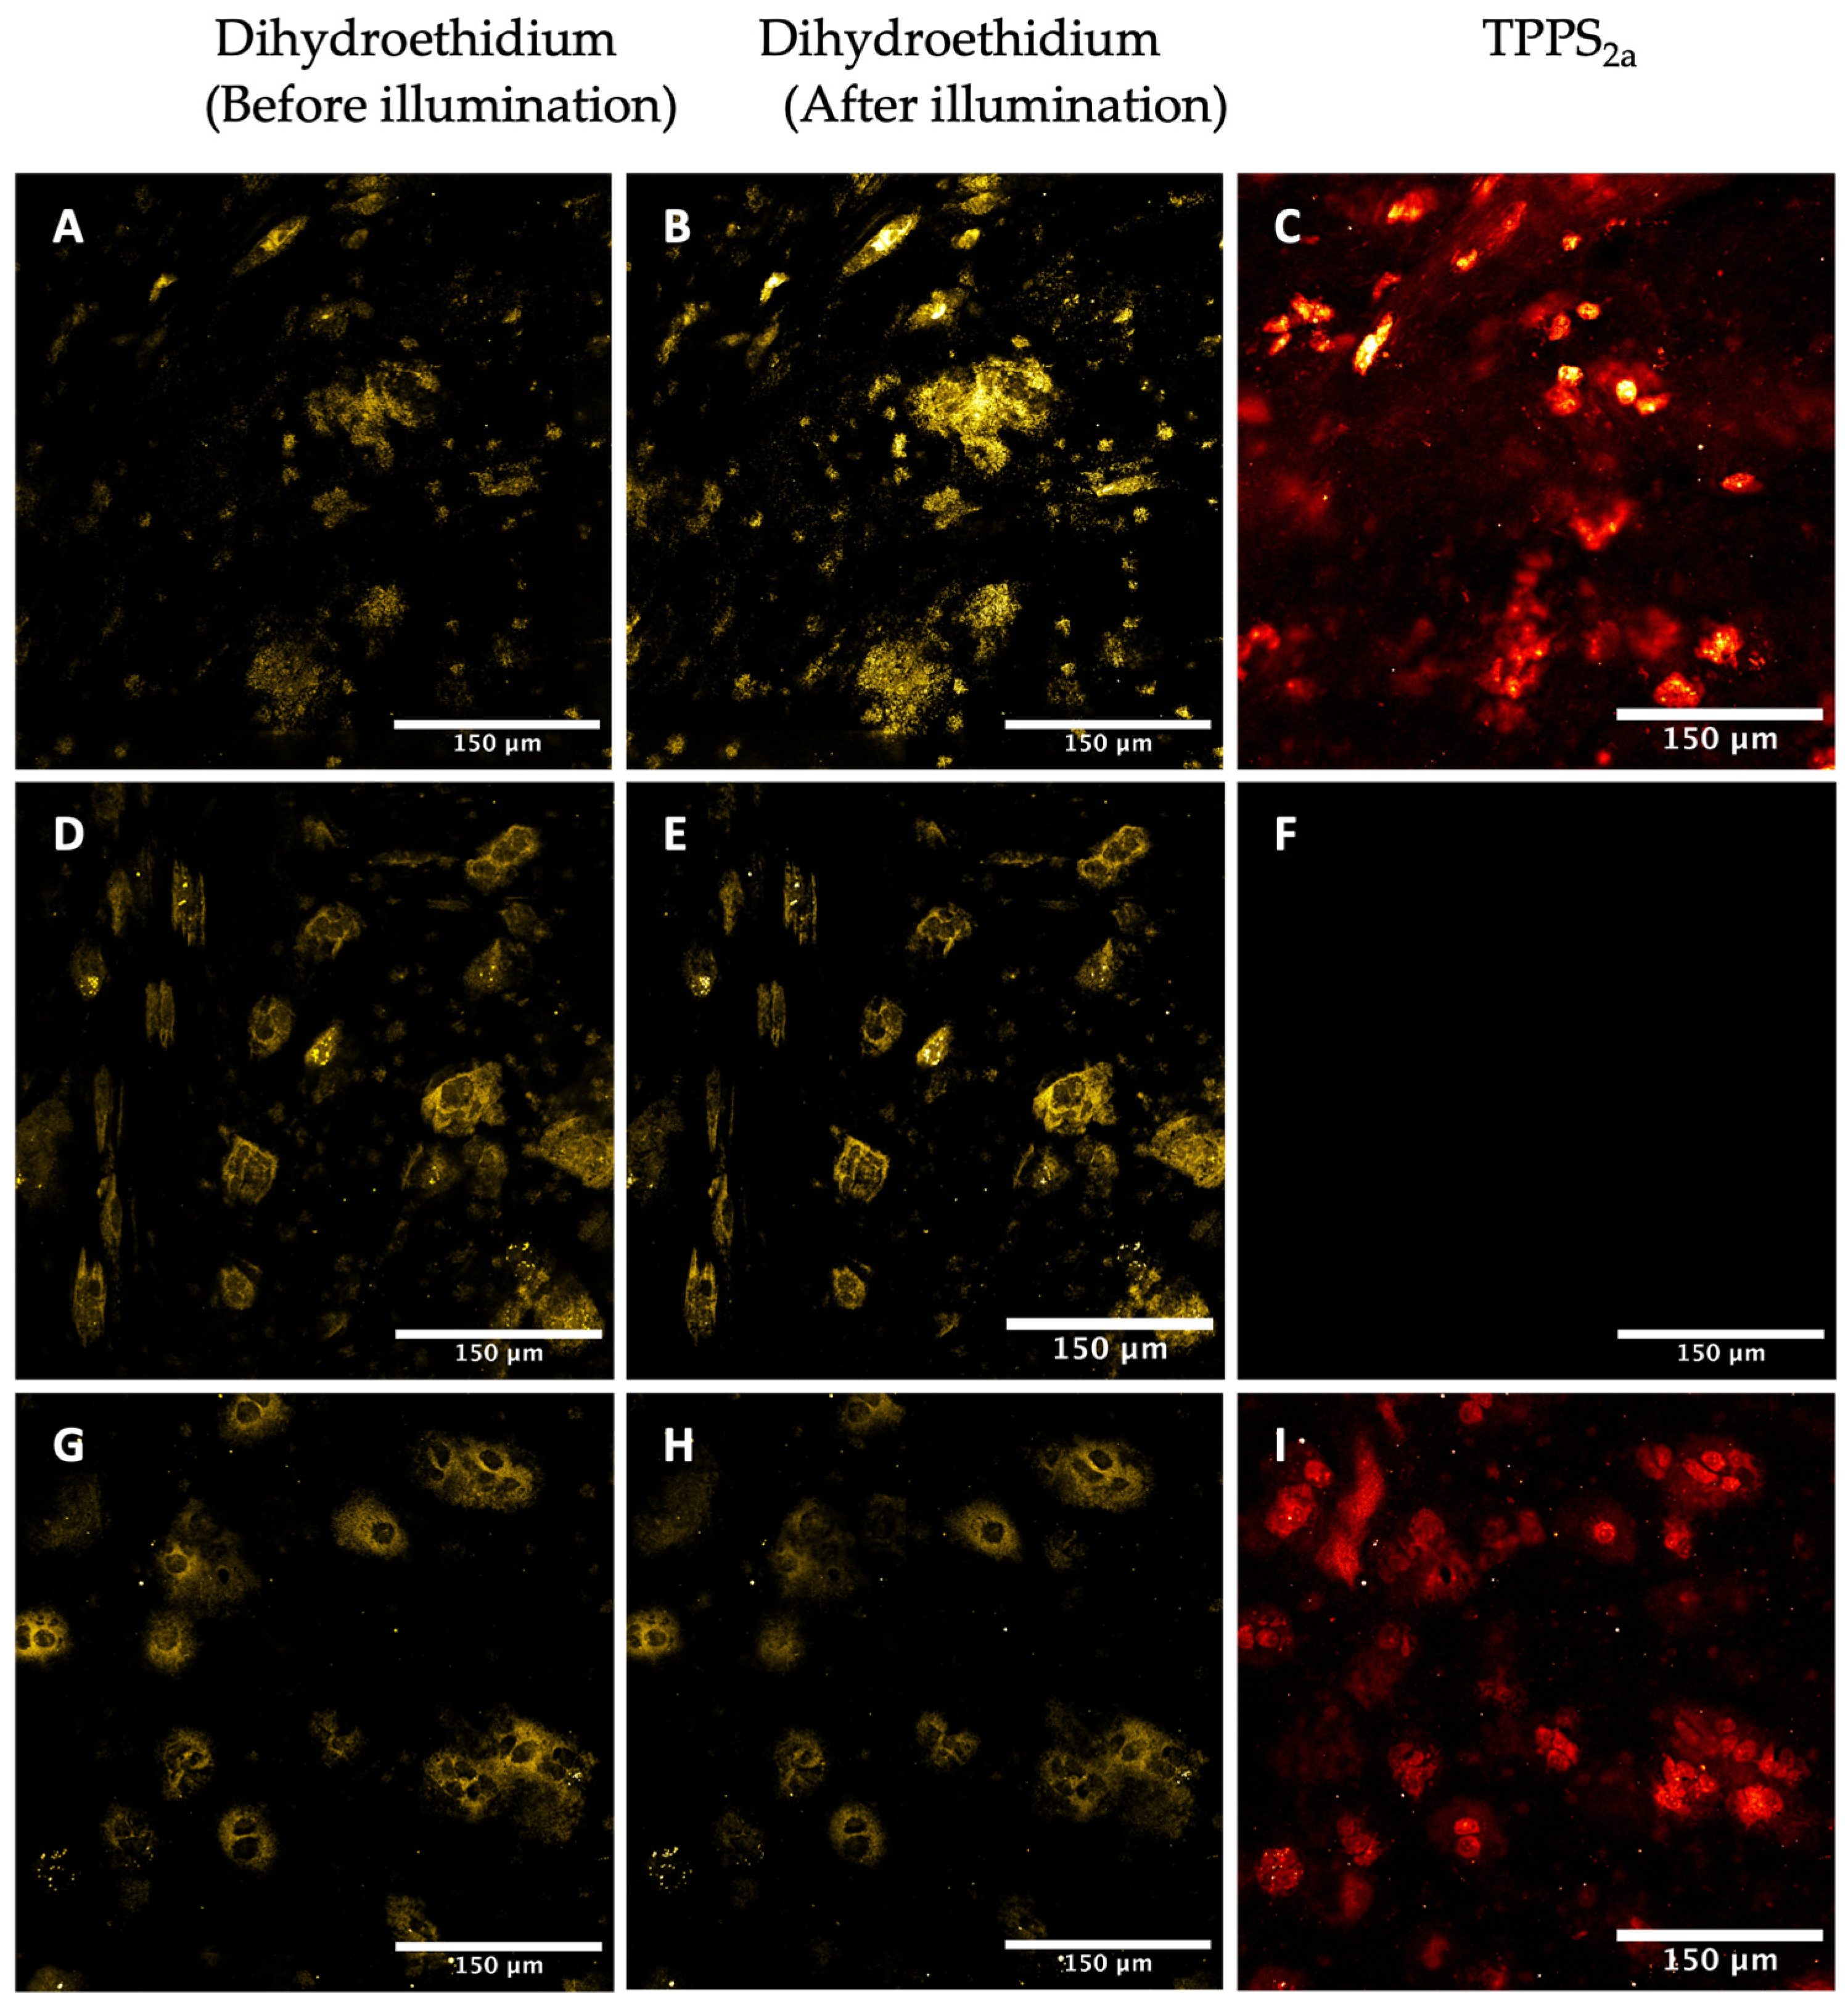
2.3.3. Detection of Superoxide
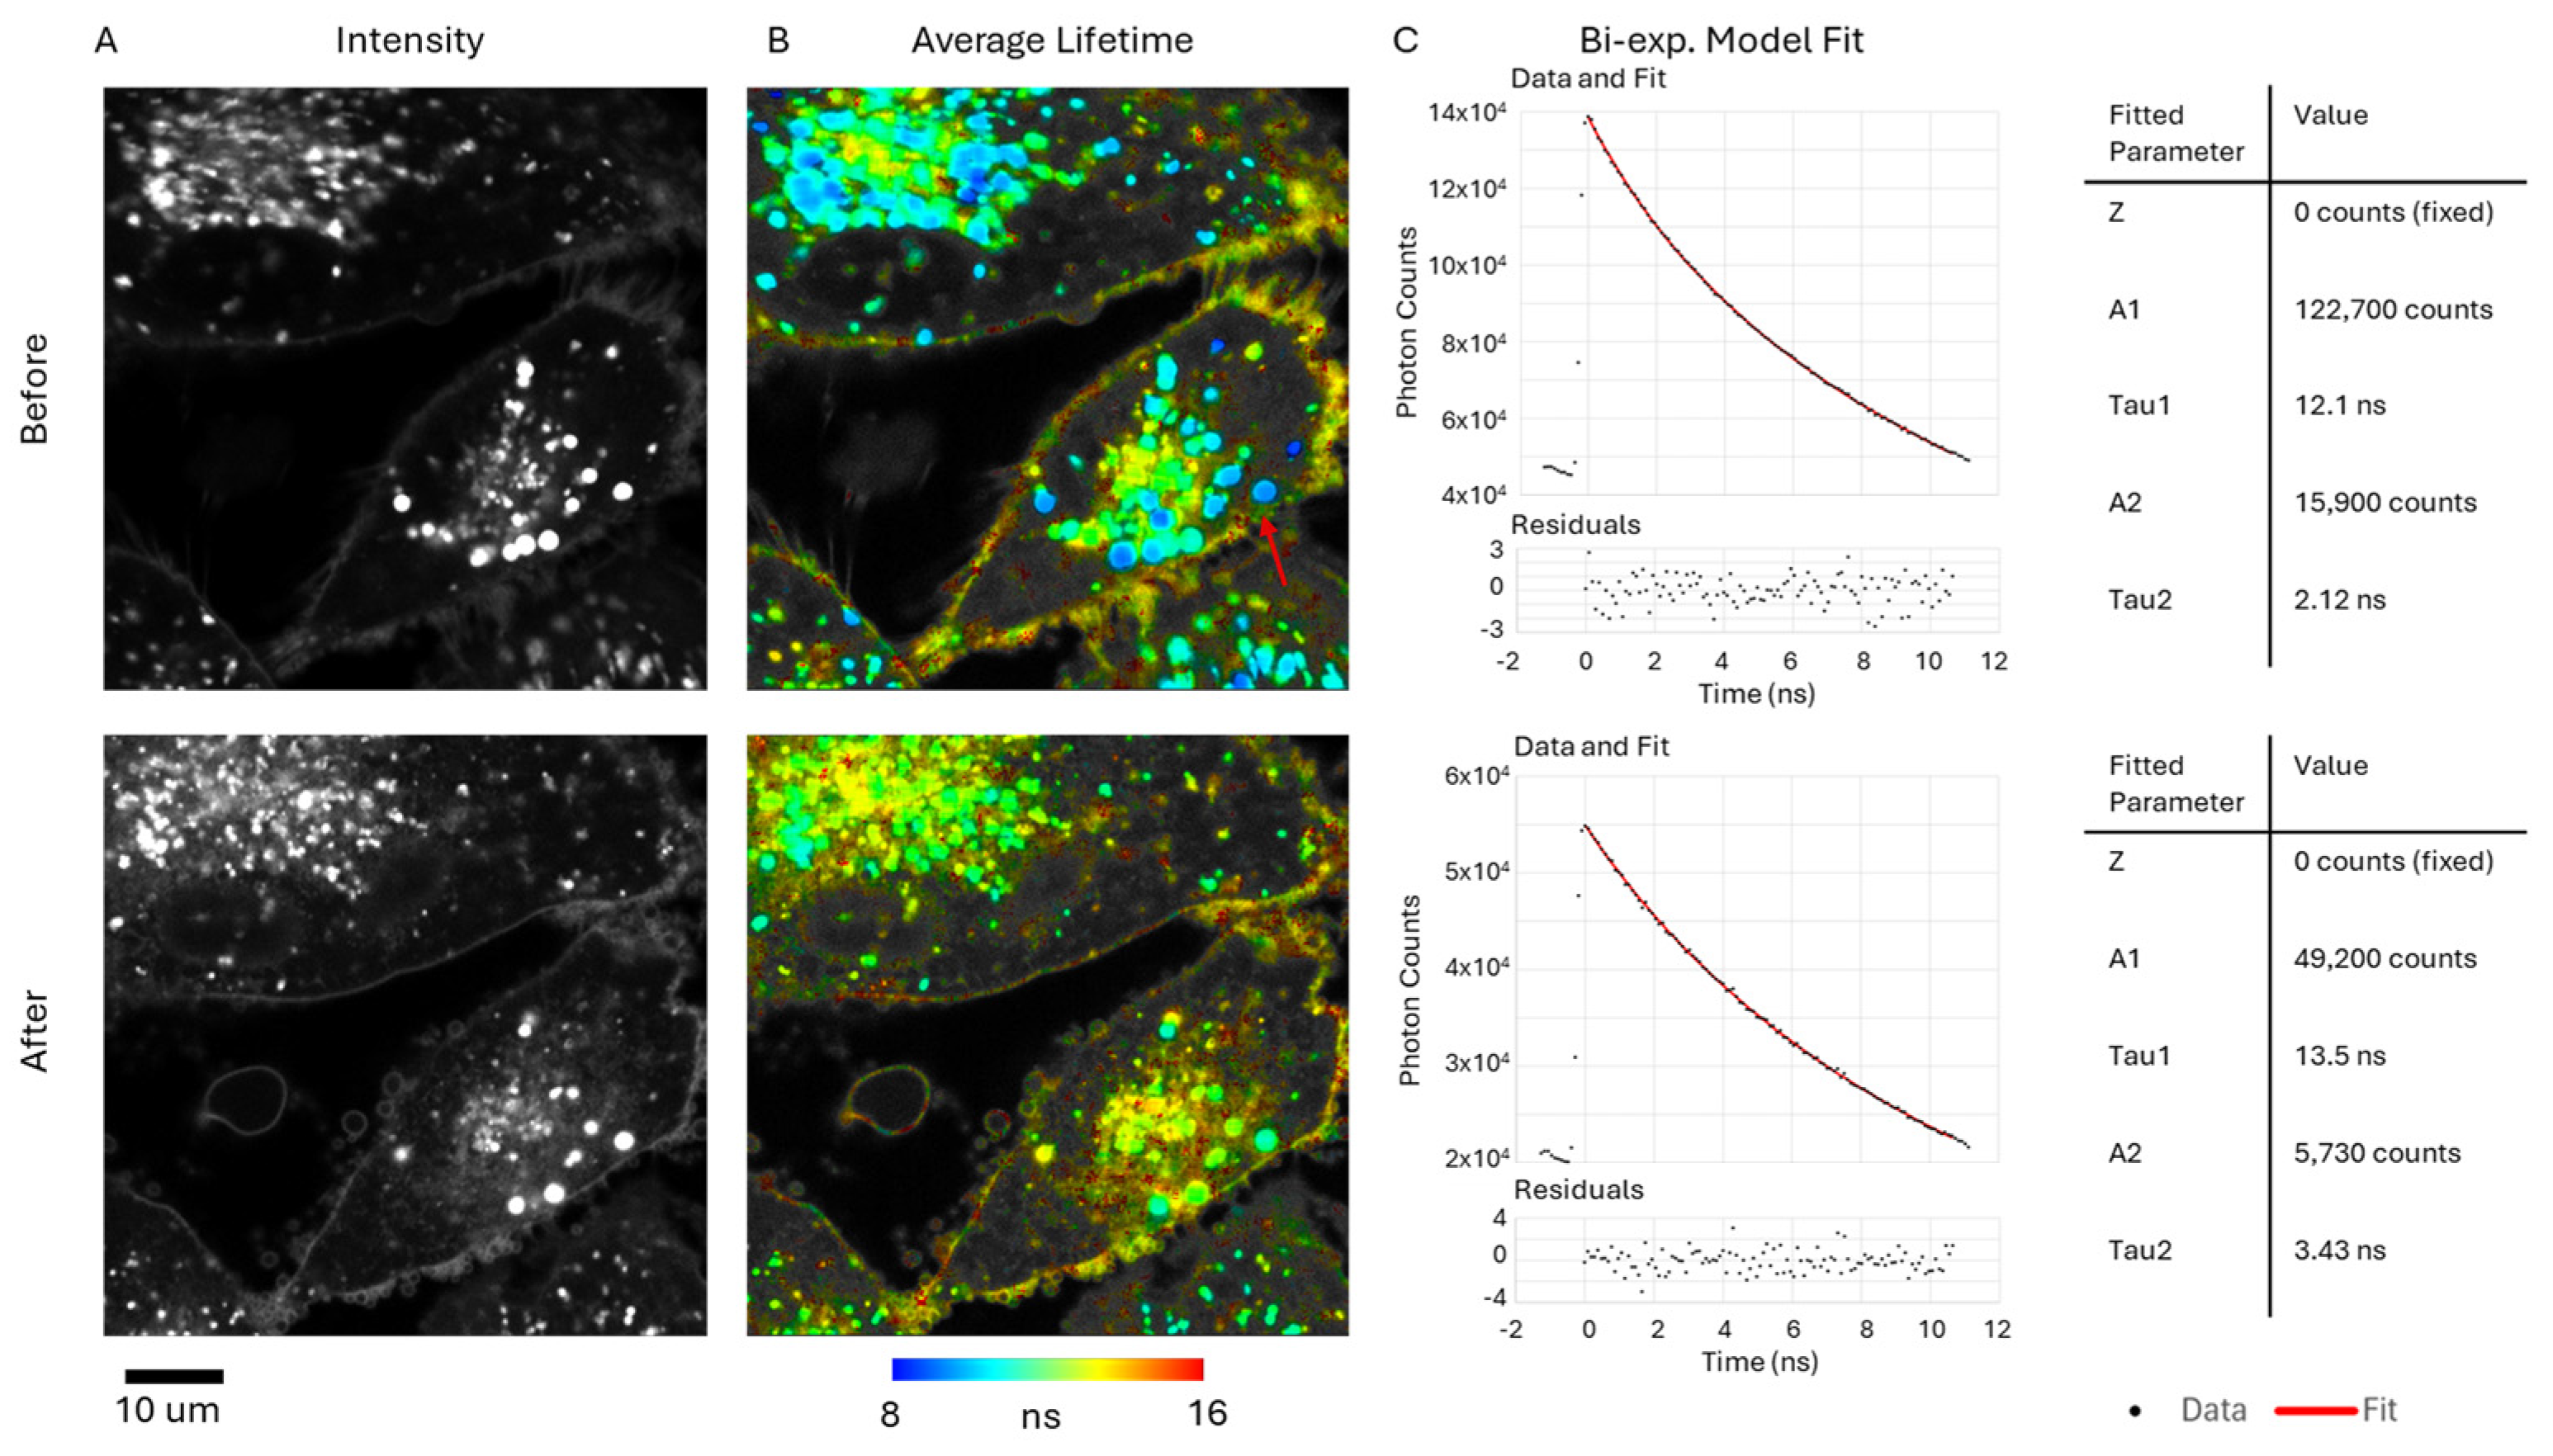
2.4. FLIM Studies
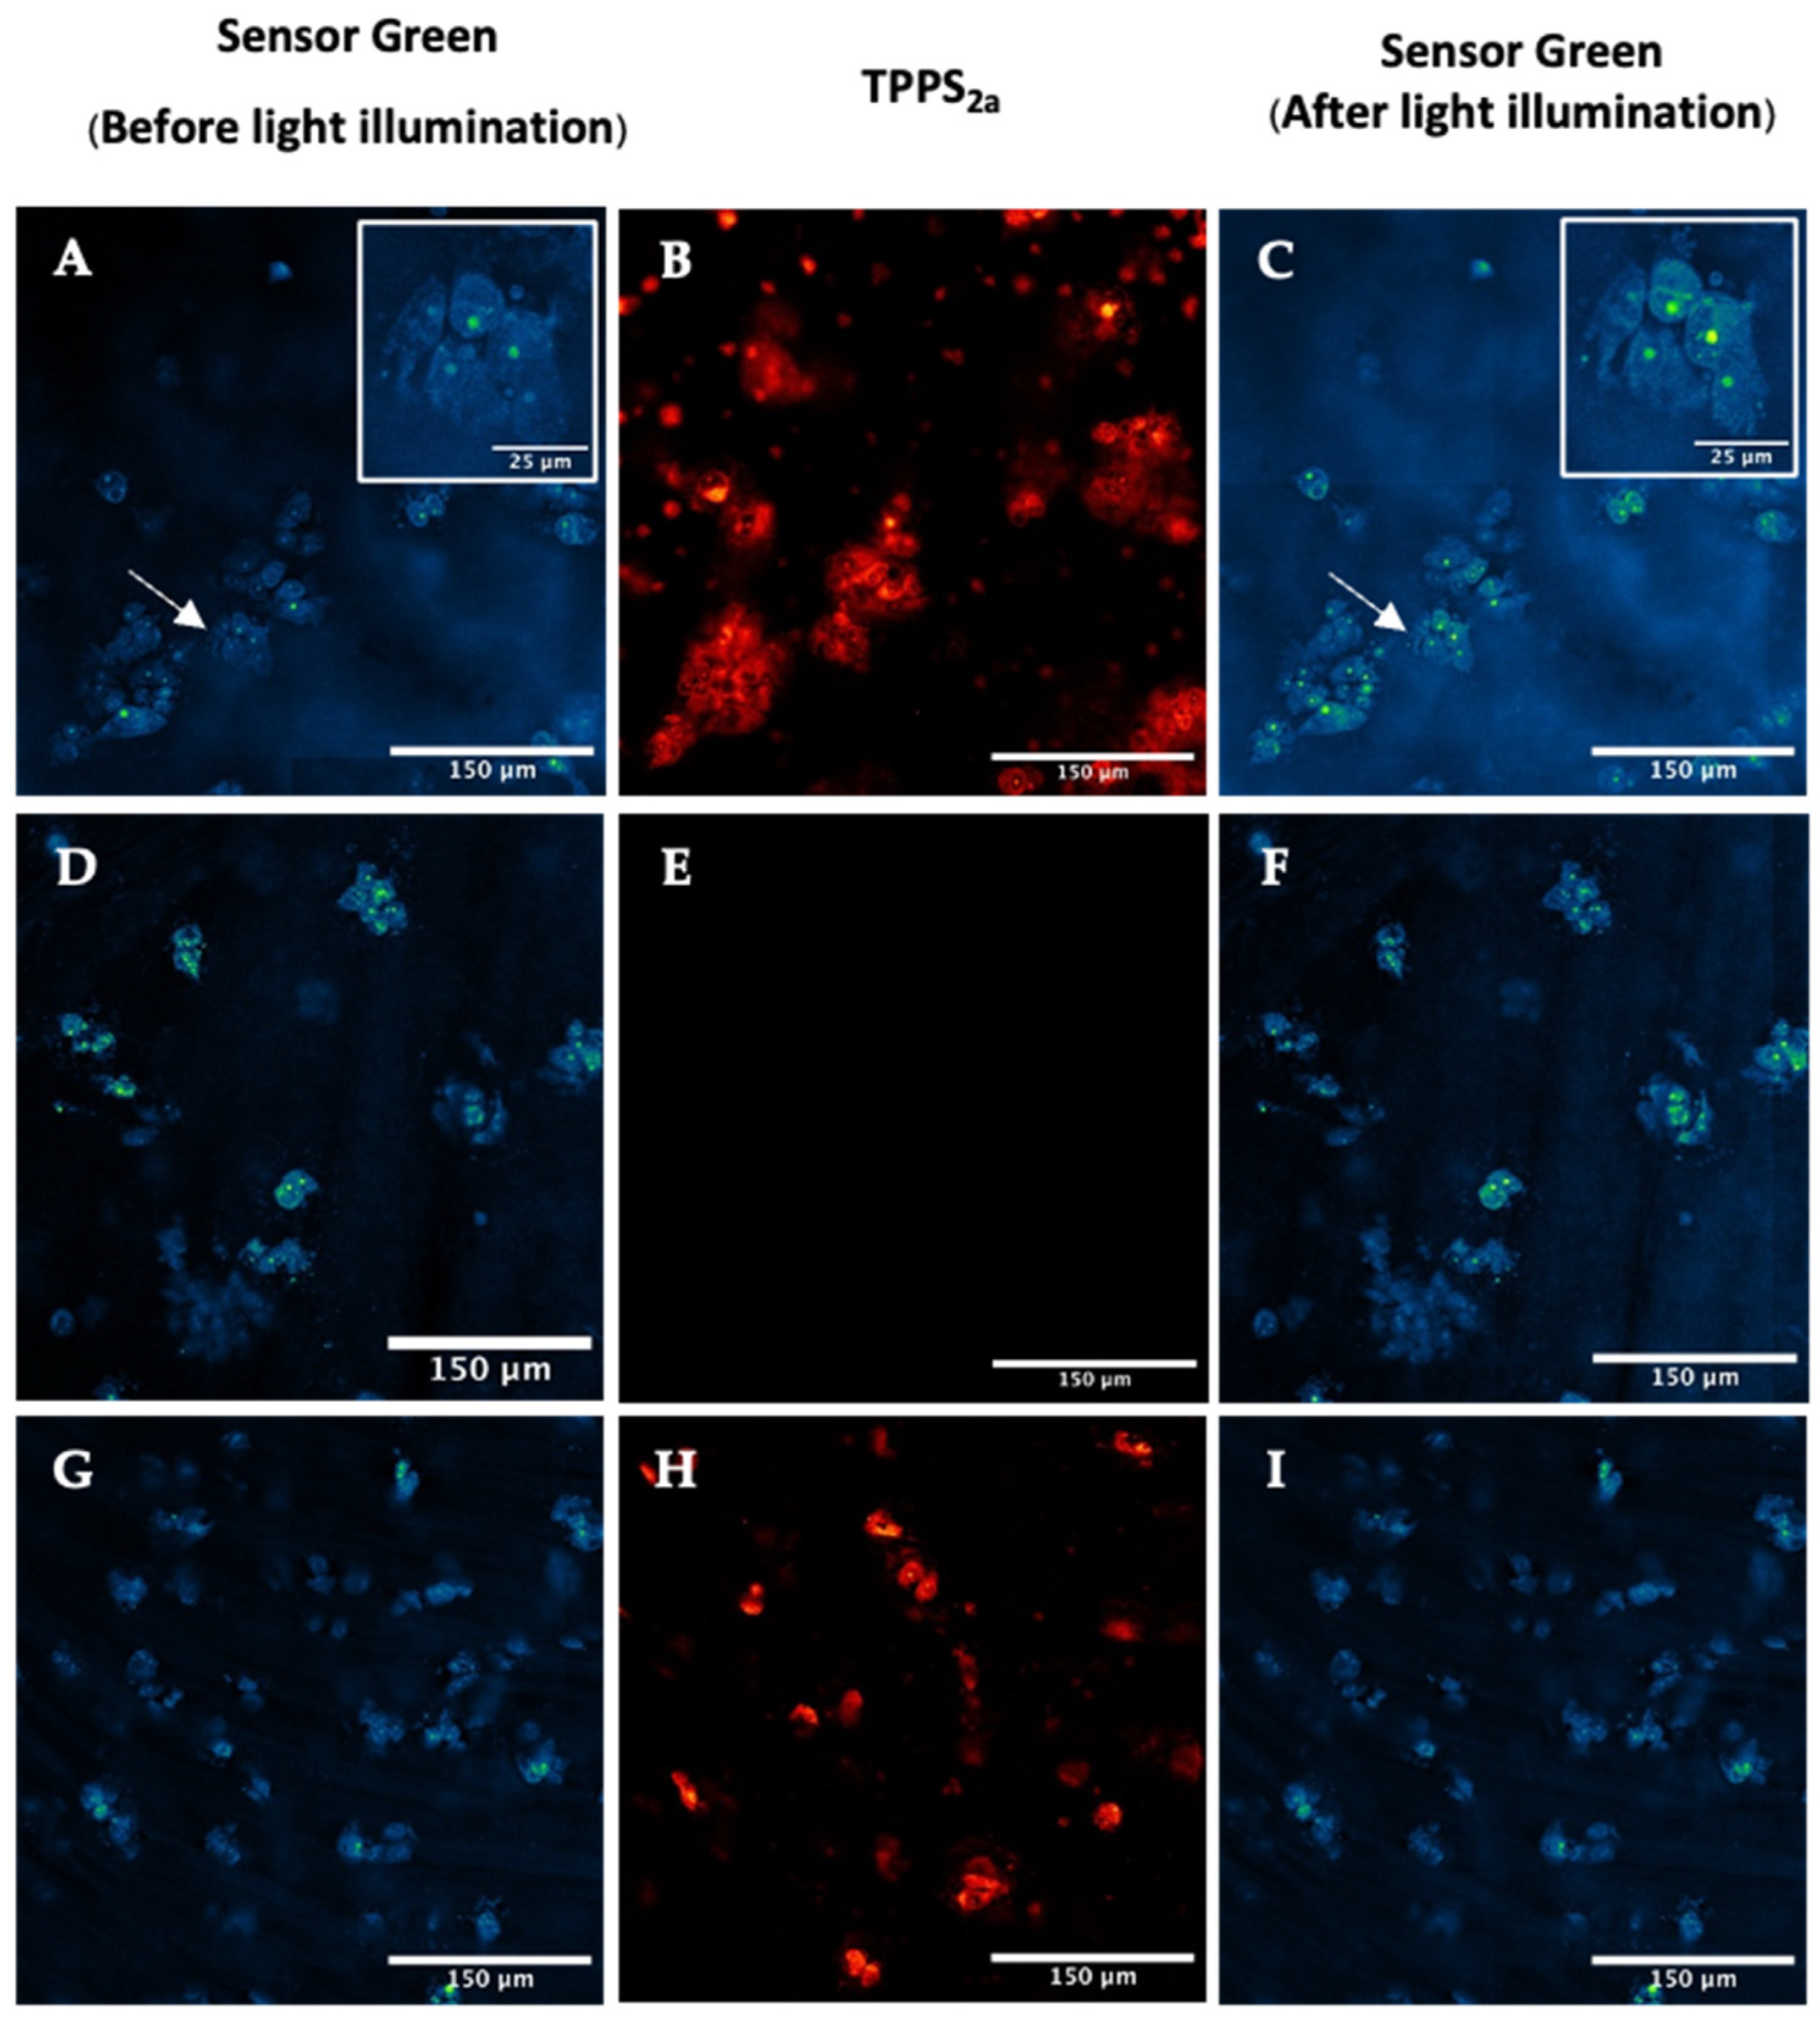
2.5. Singlet Oxygen Detection in 3D Culture
3. Discussion
3.1. Intracellular Fluorescence Dynamics of TPPS2a in HEY Cells and ROS Detection
3.2. FLIM and Singlet Oxygen Detection
4. Materials and Methods
4.1. Cell Culture
4.2. Manufacture of 3D Cancer Constructs
4.3. Confocal Microscopy and Cell Preparation
Intracellular Uptake and Localisation
4.4. Detection and Inhibition of Reactive Oxygen Species (ROS) Generation
4.5. Fluorescence Lifetime Imaging Microscopy (FLIM) and Cell Preparation
4.6. Singlet Oxygen Measurement
4.7. Image Analysis
4.8. Statistical Analysis
5. Conclusions
Supplementary Materials
Author Contributions
Funding
Institutional Review Board Statement
Informed Consent Statement
Data Availability Statement
Acknowledgments
Conflicts of Interest
References
- Dolmans, D.E.J.G.J.; Fukumura, D.; Jain, R.K. Photodynamic therapy for cancer. Nat. Rev. Cancer 2003, 3, 380–387. [Google Scholar] [CrossRef] [PubMed]
- Brown, S.B.; Brown, E.A.; Walker, I. The present and future role of photodynamic therapy in cancer treatment. Lancet Oncol. 2004, 5, 497–508. [Google Scholar] [CrossRef]
- Agostinis, P.; Berg, K.; Cengel, K.A.; Foster, T.H.; Girotti, A.W.; Gollnick, S.O.; Hahn, S.M.; Hamblin, M.R.; Juzeniene, A.; Kessel, D.; et al. Photodynamic therapy of cancer: An update. CA Cancer J. Clin. 2011, 61, 250–281. [Google Scholar] [CrossRef] [PubMed]
- van Straten, D.; Mashayekhi, V.; de Bruijn, H.; Oliveira, S.; Robinson, D. Oncologic Photodynamic Therapy: Basic Principles, Current Clinical Status and Future Directions. Cancers 2017, 9, 19. [Google Scholar] [CrossRef] [PubMed]
- Dos Santos, A.F.; De Almeida, D.R.Q.; Terra, L.F.; Baptista, M.S.; Labriola, L. Photodynamic therapy in cancer treatment—An update review. J. Cancer Metastasis Treat. 2019, 5, 25. [Google Scholar] [CrossRef]
- Mohammad-Hadi, L.; MacRobert, A.J.; Loizidou, M.; Yaghini, E. Photodynamic therapy in 3D cancer models and the utilisation of nanodelivery systems. Nanoscale 2018, 10, 1570–1581. [Google Scholar] [CrossRef] [PubMed]
- Selbo, P.K.; Weyergang, A.; Høgset, A.; Norum, O.-J.; Berstad, M.B.; Vikdal, M.; Berg, K. Photochemical internalization provides time- and space-controlled endolysosomal escape of therapeutic molecules. J. Control. Release 2010, 148, 2–12. [Google Scholar] [CrossRef]
- Martinez de Pinillos Bayona, A.; Moore, C.M.; Loizidou, M.; MacRobert, A.J.; Woodhams, J.H. Enhancing the efficacy of cytotoxic agents for cancer therapy using photochemical internalisation. Int. J. Cancer 2016, 138, 1049–1057. [Google Scholar] [CrossRef] [PubMed]
- Yaghini, E.; Dondi, R.; Edler, K.J.; Loizidou, M.; MacRobert, A.J.; Eggleston, I.M. Codelivery of a cytotoxin and photosensitiser via a liposomal nanocarrier: A novel strategy for light-triggered cytosolic release. Nanoscale 2018, 10, 20366–20376. [Google Scholar] [CrossRef]
- Norum, O.J.; Fremstedal, A.S.V.; Weyergang, A.; Golab, J.; Berg, K. Photochemical delivery of bleomycin induces T-cell activation of importance for curative effect and systemic anti-tumor immunity. J. Control. Release 2017, 268, 120–127. [Google Scholar] [CrossRef]
- Yaghini, E.; Dondi, R.; Tewari, K.M.; Loizidou, M.; Eggleston, I.M.; MacRobert, A.J. Endolysosomal targeting of a clinical chlorin photosensitiser for light-triggered delivery of nano-sized medicines. Sci. Rep. 2017, 7, 6059. [Google Scholar] [CrossRef]
- Dondi, R.; Yaghini, E.; Tewari, K.M.; Wang, L.; Giuntini, F.; Loizidou, M.; MacRobert, A.J.; Eggleston, I.M. Flexible synthesis of cationic peptide-porphyrin derivatives for light-triggered drug delivery and photodynamic therapy. Org. Biomol. Chem. 2016, 14, 11488–11501. [Google Scholar] [CrossRef] [PubMed]
- Sultan, A.A.; Jerjes, W.; Berg, K.; Høgset, A.; A Mosse, C.; Hamoudi, R.; Hamdoon, Z.; Simeon, C.; Carnell, D.; Forster, M.; et al. Disulfonated tetraphenyl chlorin (TPCS2a)-induced photochemical internalisation of bleomycin in patients with solid malignancies: A phase 1, dose-escalation, first-in-man trial. Lancet Oncol. 2016, 17, 1217–1229. [Google Scholar] [CrossRef] [PubMed]
- Trojan, J.; Hoffmeister, A.; Neu, B.; Kasper, S.; Dechêne, A.; Jürgensen, C.; Schirra, J.; Jakobs, R.; Palmer, D.; Selbo, P.K.; et al. Photochemical Internalization of Gemcitabine Is Safe and Effective in Locally Advanced Inoperable Cholangiocarcinoma. Oncologist 2022, 27, e430–e433. [Google Scholar] [CrossRef] [PubMed]
- Ferlay, J.; Soerjomataram, I.; Dikshit, R.; Eser, S.; Mathers, C.; Rebelo, M.; Parkin, D.M.; Forman, D.; Bray, F. Cancer incidence and mortality worldwide: Sources, methods and major patterns in GLOBOCAN 2012. Int. J. Cancer 2015, 136, E359–E386. [Google Scholar] [CrossRef]
- Cancer Research UK. Ovarian Cancer Statistics. 2020. Available online: https://www.cancerresearchuk.org/health-professional/cancer-statistics/statistics-by-cancer-type/ovarian-cancer#heading-Zero (accessed on 12 October 2023).
- Jelovac, D.; Armstrong, D.K. Recent progress in the diagnosis and treatment of ovarian cancer. CA Cancer J. Clin. 2011, 61, 183–203. [Google Scholar] [CrossRef] [PubMed]
- Griffiths, C. Intensive Surgical and Chemotherapeutic Management of Advanced Ovarian Cancer. Surg. Clin. N. Am. 1978, 58, 131–142. [Google Scholar] [CrossRef]
- Lheureux, S.; Gourley, C.; Vergote, I.; Oza, A.M. Epithelial ovarian cancer. Lancet 2019, 393, 1240–1253. [Google Scholar] [CrossRef] [PubMed]
- Nath, S.; Saad, M.A.; Pigula, M.; Swain, J.W.R.; Hasan, T. Photoimmunotherapy of Ovarian Cancer: A Unique Niche in the Management of Advanced Disease. Cancers 2019, 11, 1887. [Google Scholar] [CrossRef] [PubMed]
- Mroz, P.; Bhaumik, J.; Dogutan, D.K.; Aly, Z.; Kamal, Z.; Khalid, L.; Kee, H.L.; Bocian, D.F.; Holten, D.; Lindsey, J.S.; et al. Imidazole metalloporphyrins as photosensitizers for photodynamic therapy: Role of molecular charge, central metal and hydroxyl radical production. Cancer Lett. 2009, 282, 63–76. [Google Scholar] [CrossRef] [PubMed]
- Rezende, L.G.; Tasso, T.T.; Candido, P.H.S.; Baptista, M.S. Assessing Photosensitized Membrane Damage: Available Tools and Comprehensive Mechanisms. Photochem. Photobiol. 2022, 98, 572–590. [Google Scholar] [CrossRef]
- Berg, K.; Western, A.; Bommer, J.C.; Moan, J. Intracellular localization of sulfonated meso-tetraphenylporphines in a human carcinoma cell line. Photochem. Photobiol. 1990, 52, 481–487. [Google Scholar] [CrossRef] [PubMed]
- Berg, K.; Moan, J. Lysosomes as photochemical targets. Int. J. Cancer 1994, 59, 814–822. [Google Scholar] [CrossRef] [PubMed]
- Berg, K.; Nordstrand, S.; Selbo, P.K.; Tran, D.T.T.; Angell-Petersen, E.; Høgset, A. Disulfonated tetraphenyl chlorin (TPCS2a), a novel photosensitizer developed for clinical utilization of photochemical internalization. Photochem. Photobiol. Sci. 2011, 10, 1637–1651. [Google Scholar] [CrossRef]
- Hadi, L.M.; Yaghini, E.; Stamati, K.; Loizidou, M.; MacRobert, A.J. Therapeutic enhancement of a cytotoxic agent using photochemical internalisation in 3D compressed collagen constructs of ovarian cancer. Acta Biomater. 2018, 81, 80–92. [Google Scholar] [CrossRef] [PubMed]
- Mohammad Hadi, L.; Stamati, K.; Yaghini, E.; MacRobert, A.J.; Loizidou, M. Treatment of 3D In Vitro Tumoroids of Ovarian Cancer Using Photochemical Internalisation as a Drug Delivery Method. Biomedicines 2023, 11, 572. [Google Scholar] [CrossRef] [PubMed]
- Berezin, M.Y.; Achilefu, S. Fluorescence lifetime measurements and biological imaging. Chem. Rev. 2010, 110, 2641–2684. [Google Scholar] [CrossRef]
- Lilletvedt, M.; Tønnesen, H.H.; Høgset, A.; Nardo, L.; Kristensen, S. Physicochemical characterization of the photosensitizers TPCS 2aand TPPS2a 1. Spectroscopic evaluation of drug—Solvent interactions. Pharmazie 2010, 65, 588–595. [Google Scholar] [CrossRef]
- Lilletvedt, M.; Kristensen, S.; Tønnesen, H.H.; Høgset, A.; Nardo, L. Time-domain evaluation of drug–solvent interactions of the photosensitizers TPCS2a and TPPS2a as part of physicochemical characterization. J. Photochem. Photobiol. A Chem. 2010, 214, 40–47. [Google Scholar] [CrossRef]
- Nardo, L.; Kristensen, S.; Tønnesen, H.H.; Høgset, A.; Lilletvedt, M. Solubilization of the photosensitizers TPCS2a and TPPS 2a in aqueous media evaluated by time-resolved fluorescence analysis. Pharmazie 2012, 67, 598–600. [Google Scholar] [CrossRef]
- Nyga, A.; Cheema, U.; Loizidou, M. 3D tumour models: Novel in vitro approaches to cancer studies. J. Cell Commun. Signal. 2011, 5, 239–248. [Google Scholar] [CrossRef]
- Nyga, A.; Loizidou, M.; Emberton, M.; Cheema, U. A novel tissue engineered three-dimensional in vitro colorectal cancer model. Acta Biomater. 2013, 9, 7917–7926. [Google Scholar] [CrossRef]
- Liu, Y.; Mohri, Z.; Alsheikh, W.; Cheema, U. The Role of Biomimetic Hypoxia on Cancer Cell Behaviour in 3D Models: A Systematic Review. Cancers 2021, 13, 1334. [Google Scholar] [CrossRef] [PubMed]
- Pape, J.; Micalet, A.; Alsheikh, W.; Ezbakh, N.; Virjee, R.-I.; Al Hosni, R.; Moeendarbary, E.; Cheema, U. Biophysical Parameters Can Induce Epithelial-to-Mesenchymal Phenotypic and Genotypic Changes in HT-29 Cells: A Preliminary Study. Int. J. Mol. Sci. 2023, 24, 3956. [Google Scholar] [CrossRef] [PubMed]
- Schweitzer, C.; Schmidt, R. Physical mechanisms of generation and deactivation of singlet oxygen. Chem. Rev. 2003, 103, 1685–1757. [Google Scholar] [CrossRef] [PubMed]
- Šošić, L.; Selbo, P.K.; Kotkowska, Z.K.; Kündig, T.M.; Høgset, A.; Johansen, P. Photochemical internalization: Light paves way for new cancer chemotherapies and vaccines. Cancers 2020, 12, 165. [Google Scholar] [CrossRef] [PubMed]
- Longva, A.S.; Berg, K.; Weyergang, A. Light-enhanced VEGF121/rGel induce immunogenic cell death and increase the antitumor activity of αCTLA4 treatment. Front. Immunol. 2023, 14, 1278000. [Google Scholar] [CrossRef]
- Berstad, M.B.; Weyergang, A.; Berg, K. Photochemical internalization (PCI) of HER2-targeted toxins: Synergy is dependent on the treatment sequence. Biochim. Biophys. Acta Gen. Subj. 2012, 1820, 1849–1858. [Google Scholar] [CrossRef] [PubMed]
- Cuccato, N.; Nardo, L.; Kristensen, S.; Hjorth Tønnesen, H.; Lilletvedt Tovsen, M. Solubilization of the chlorin TPCS 2a in the presence of Pluronic ® F127/Tween 80 mixtures. Pharm. Dev. Technol. 2019, 24, 513–520. [Google Scholar] [CrossRef]
- Tsubone, T.M.; Zhang, Z.; Goyal, R.; Santacruz, C.; Martins, W.K.; Kohn, J.; Baptista, M.S. Porphyrin-Loaded TyroSpheres for the Intracellular Delivery of Drugs and Photoinduced Oxidant Species. Mol. Pharm. 2020, 17, 2911–2924. [Google Scholar] [CrossRef]
- Luo, Z.; Li, M.; Zhou, M.; Li, H.; Chen, Y.; Ren, X.; Dai, Y. O2-evolving and ROS-activable nanoparticles for treatment of multi-drug resistant Cancer by combination of photodynamic therapy and chemotherapy. Nanomedicine 2019, 19, 49–57. [Google Scholar] [CrossRef] [PubMed]
- Suzuki, I.L.; de Araujo, M.M.; Bagnato, V.S.; Bentley, M.V.L.B. TNFα siRNA delivery by nanoparticles and photochemical internalization for psoriasis topical therapy. J. Control. Release 2021, 338, 316–329. [Google Scholar] [CrossRef] [PubMed]
- Dikalov, S.I.; Li, W.; Mehranpour, P.; Wang, S.S.; Zafari, A.M. Production of extracellular superoxide by human lymphoblast cell lines: Comparison of electron spin resonance techniques and cytochrome C reduction assay. Biochem. Pharmacol. 2007, 73, 972–980. [Google Scholar] [CrossRef] [PubMed]
- Bacellar, I.O.L.; Baptista, M.S. Mechanisms of Photosensitized Lipid Oxidation and Membrane Permeabilization. ACS Omega 2019, 4, 21636–21646. [Google Scholar] [CrossRef] [PubMed]
- Kessel, D.; Thompson, P.; Saatio, K.; Nantwi, K.D. Tumor localization and photosensitization by sulfonated derivatives of tetraphenylporphine. Photochem. Photobiol. 1987, 45, 787–790. [Google Scholar] [CrossRef] [PubMed]
- Rubires, R.; Crusats, J.; El-Hachemi, Z.; Jaramillo, T.; López, M.; Valls, E.; Farrera, J.-A.; Ribó, J.M. Self-assembly in water of the sodium salts of meso-sulfonatophenyl substituted porphyrins. New J. Chem. 1999, 23, 189–198. [Google Scholar] [CrossRef]
- Lambert, C.R.; Reddi, E.; Spikes, J.D.; Rodgers, M.A.; Jori, G. The effects of porphyrin structure and aggregation state on photosensitized processes in aqueous and micellar media. Photochem. Photobiol. 1986, 44, 595–601. [Google Scholar] [CrossRef]
- Wang, J.T.W.; Berg, K.; Høgset, A.; Bown, S.G.; MacRobert, A.J. Photophysical and photobiological properties of a sulfonated chlorin photosensitiser TPCS2a for photochemical internalisation (PCI). Photochem. Photobiol. Sci. 2013, 12, 519–526. [Google Scholar] [CrossRef]
- Mezghrani, B.; Ali, L.M.A.; Cubedo, N.; Rossel, M.; Hesemann, P.; Durand, J.-O.; Bettache, N. Periodic mesoporous ionosilica nanoparticles for dual cancer therapy: Two-photon excitation siRNA gene silencing in cells and photodynamic therapy in zebrafish embryos. Int. J. Pharm. 2023, 641, 123083. [Google Scholar] [CrossRef]
- Schneckenburger, H.; Gschwend, M.H.; Sailer, R.; Rück, A.; Strauβ, W.S.L. Time-resolved pH-dependent fluorescence of hydrophilic porphyrins in solution and in cultivated cells. J. Photochem. Photobiol. B 1995, 27, 251–255. [Google Scholar] [CrossRef]
- Jiménez-Banzo, A.; Sagristà, M.L.; Mora, M.; Nonell, S. Kinetics of singlet oxygen photosensitization in human skin fibroblasts. Free Radic. Biol. Med. 2008, 44, 1926–1934. [Google Scholar] [CrossRef]
- Harriman, A.; Richoux, M.C. Luminescence of porphyrins and metalloporphyrins VIII: Luminescence and hydrogen photogeneration from porphyrin conjugate diacids. J. Photochem. 1984, 27, 205–214. [Google Scholar] [CrossRef]
- Lilletvedt, M.; Tønnesen, H.H.; Høgset, A.; Sande, S.A.; Kristensen, S. Evaluation of physicochemical properties and aggregation of the photosensitizers TPCS2a and TPPS2a in aqueous media. Pharmazie 2011, 66, 325–333. [Google Scholar] [CrossRef]
- Čunderlíková, B.; Bjørklund, E.G.; Pettersen, E.O.; Moan, J. pH-Dependent Spectral Properties of HpIX, TPPS2a, mTHPP and mTHPC. Photochem. Photobiol. 2007, 74, 246–252. [Google Scholar] [CrossRef]
- Hackbarth, S.; Schlothauer, J.; Preuss, A.; Röder, B. New insights to primary photodynamic effects--Singlet oxygen kinetics in living cells. J. Photochem. Photobiol. B 2010, 98, 173–179. [Google Scholar] [CrossRef] [PubMed]
- Alemany-Ribes, M.; García-Díaz, M.; Busom, M.; Nonell, S.; Semino, C.E. Toward a 3D Cellular Model for Studying In Vitro the Outcome of Photodynamic Treatments: Accounting for the Effects of Tissue Complexity. Tissue Eng. Part A 2013, 19, 1665–1674. [Google Scholar] [CrossRef]
- Kořínek, M.; Dědic, R.; Molnár, A.; Hála, J. The Influence of Human Serum Albumin on The Photogeneration of Singlet Oxygen by meso-Tetra(4-Sulfonatophenyl)Porphyrin. An Infrared Phosphorescence Study. J. Fluoresc. 2006, 16, 355–359. [Google Scholar] [CrossRef] [PubMed]
- Vyklický, V.; Dědic, R.; Curkaniuk, N.; Hála, J. Spectral- and time-resolved phosphorescence of photosensitizers and singlet oxygen: From in vitro towards in vivo. J. Lumin. 2013, 143, 729–733. [Google Scholar] [CrossRef]
- Scholz, M.; Biehl, A.L.; Dědic, R.; Hála, J. The singlet-oxygen-sensitized delayed fluorescence in mammalian cells: A time-resolved microscopy approach. Photochem. Photobiol. Sci. 2015, 14, 700–713. [Google Scholar] [CrossRef] [PubMed]
- Barber, P.R.; Ameer-Beg, S.M.; Gilbey, J.; Carlin, L.; Keppler, M.; Ng, T.; Vojnovic, B. Multiphoton time-domain fluorescence lifetime imaging microscopy: Practical application to protein–protein interactions using global analysis. J. R. Soc. Interface 2009, 6, S93–S105. [Google Scholar] [CrossRef]


Disclaimer/Publisher’s Note: The statements, opinions and data contained in all publications are solely those of the individual author(s) and contributor(s) and not of MDPI and/or the editor(s). MDPI and/or the editor(s) disclaim responsibility for any injury to people or property resulting from any ideas, methods, instructions or products referred to in the content. |
© 2024 by the authors. Licensee MDPI, Basel, Switzerland. This article is an open access article distributed under the terms and conditions of the Creative Commons Attribution (CC BY) license (https://creativecommons.org/licenses/by/4.0/).
Share and Cite
Balukova, A.; Bokea, K.; Barber, P.R.; Ameer-Beg, S.M.; MacRobert, A.J.; Yaghini, E. Cellular Imaging and Time-Domain FLIM Studies of Meso-Tetraphenylporphine Disulfonate as a Photosensitising Agent in 2D and 3D Models. Int. J. Mol. Sci. 2024, 25, 4222. https://doi.org/10.3390/ijms25084222
Balukova A, Bokea K, Barber PR, Ameer-Beg SM, MacRobert AJ, Yaghini E. Cellular Imaging and Time-Domain FLIM Studies of Meso-Tetraphenylporphine Disulfonate as a Photosensitising Agent in 2D and 3D Models. International Journal of Molecular Sciences. 2024; 25(8):4222. https://doi.org/10.3390/ijms25084222
Chicago/Turabian StyleBalukova, Andrea, Kalliopi Bokea, Paul R. Barber, Simon M. Ameer-Beg, Alexander J. MacRobert, and Elnaz Yaghini. 2024. "Cellular Imaging and Time-Domain FLIM Studies of Meso-Tetraphenylporphine Disulfonate as a Photosensitising Agent in 2D and 3D Models" International Journal of Molecular Sciences 25, no. 8: 4222. https://doi.org/10.3390/ijms25084222
APA StyleBalukova, A., Bokea, K., Barber, P. R., Ameer-Beg, S. M., MacRobert, A. J., & Yaghini, E. (2024). Cellular Imaging and Time-Domain FLIM Studies of Meso-Tetraphenylporphine Disulfonate as a Photosensitising Agent in 2D and 3D Models. International Journal of Molecular Sciences, 25(8), 4222. https://doi.org/10.3390/ijms25084222