

Diagnostic and Prognostic Value of Circulating DNA Fragments in Glioblastoma Multiforme Patients

 , , ,
, , ,
Abstract
1. Introduction
2. Results
2.1. Study Population
2.2. Study White Blood Cell Count-Derived Inflammation Indices
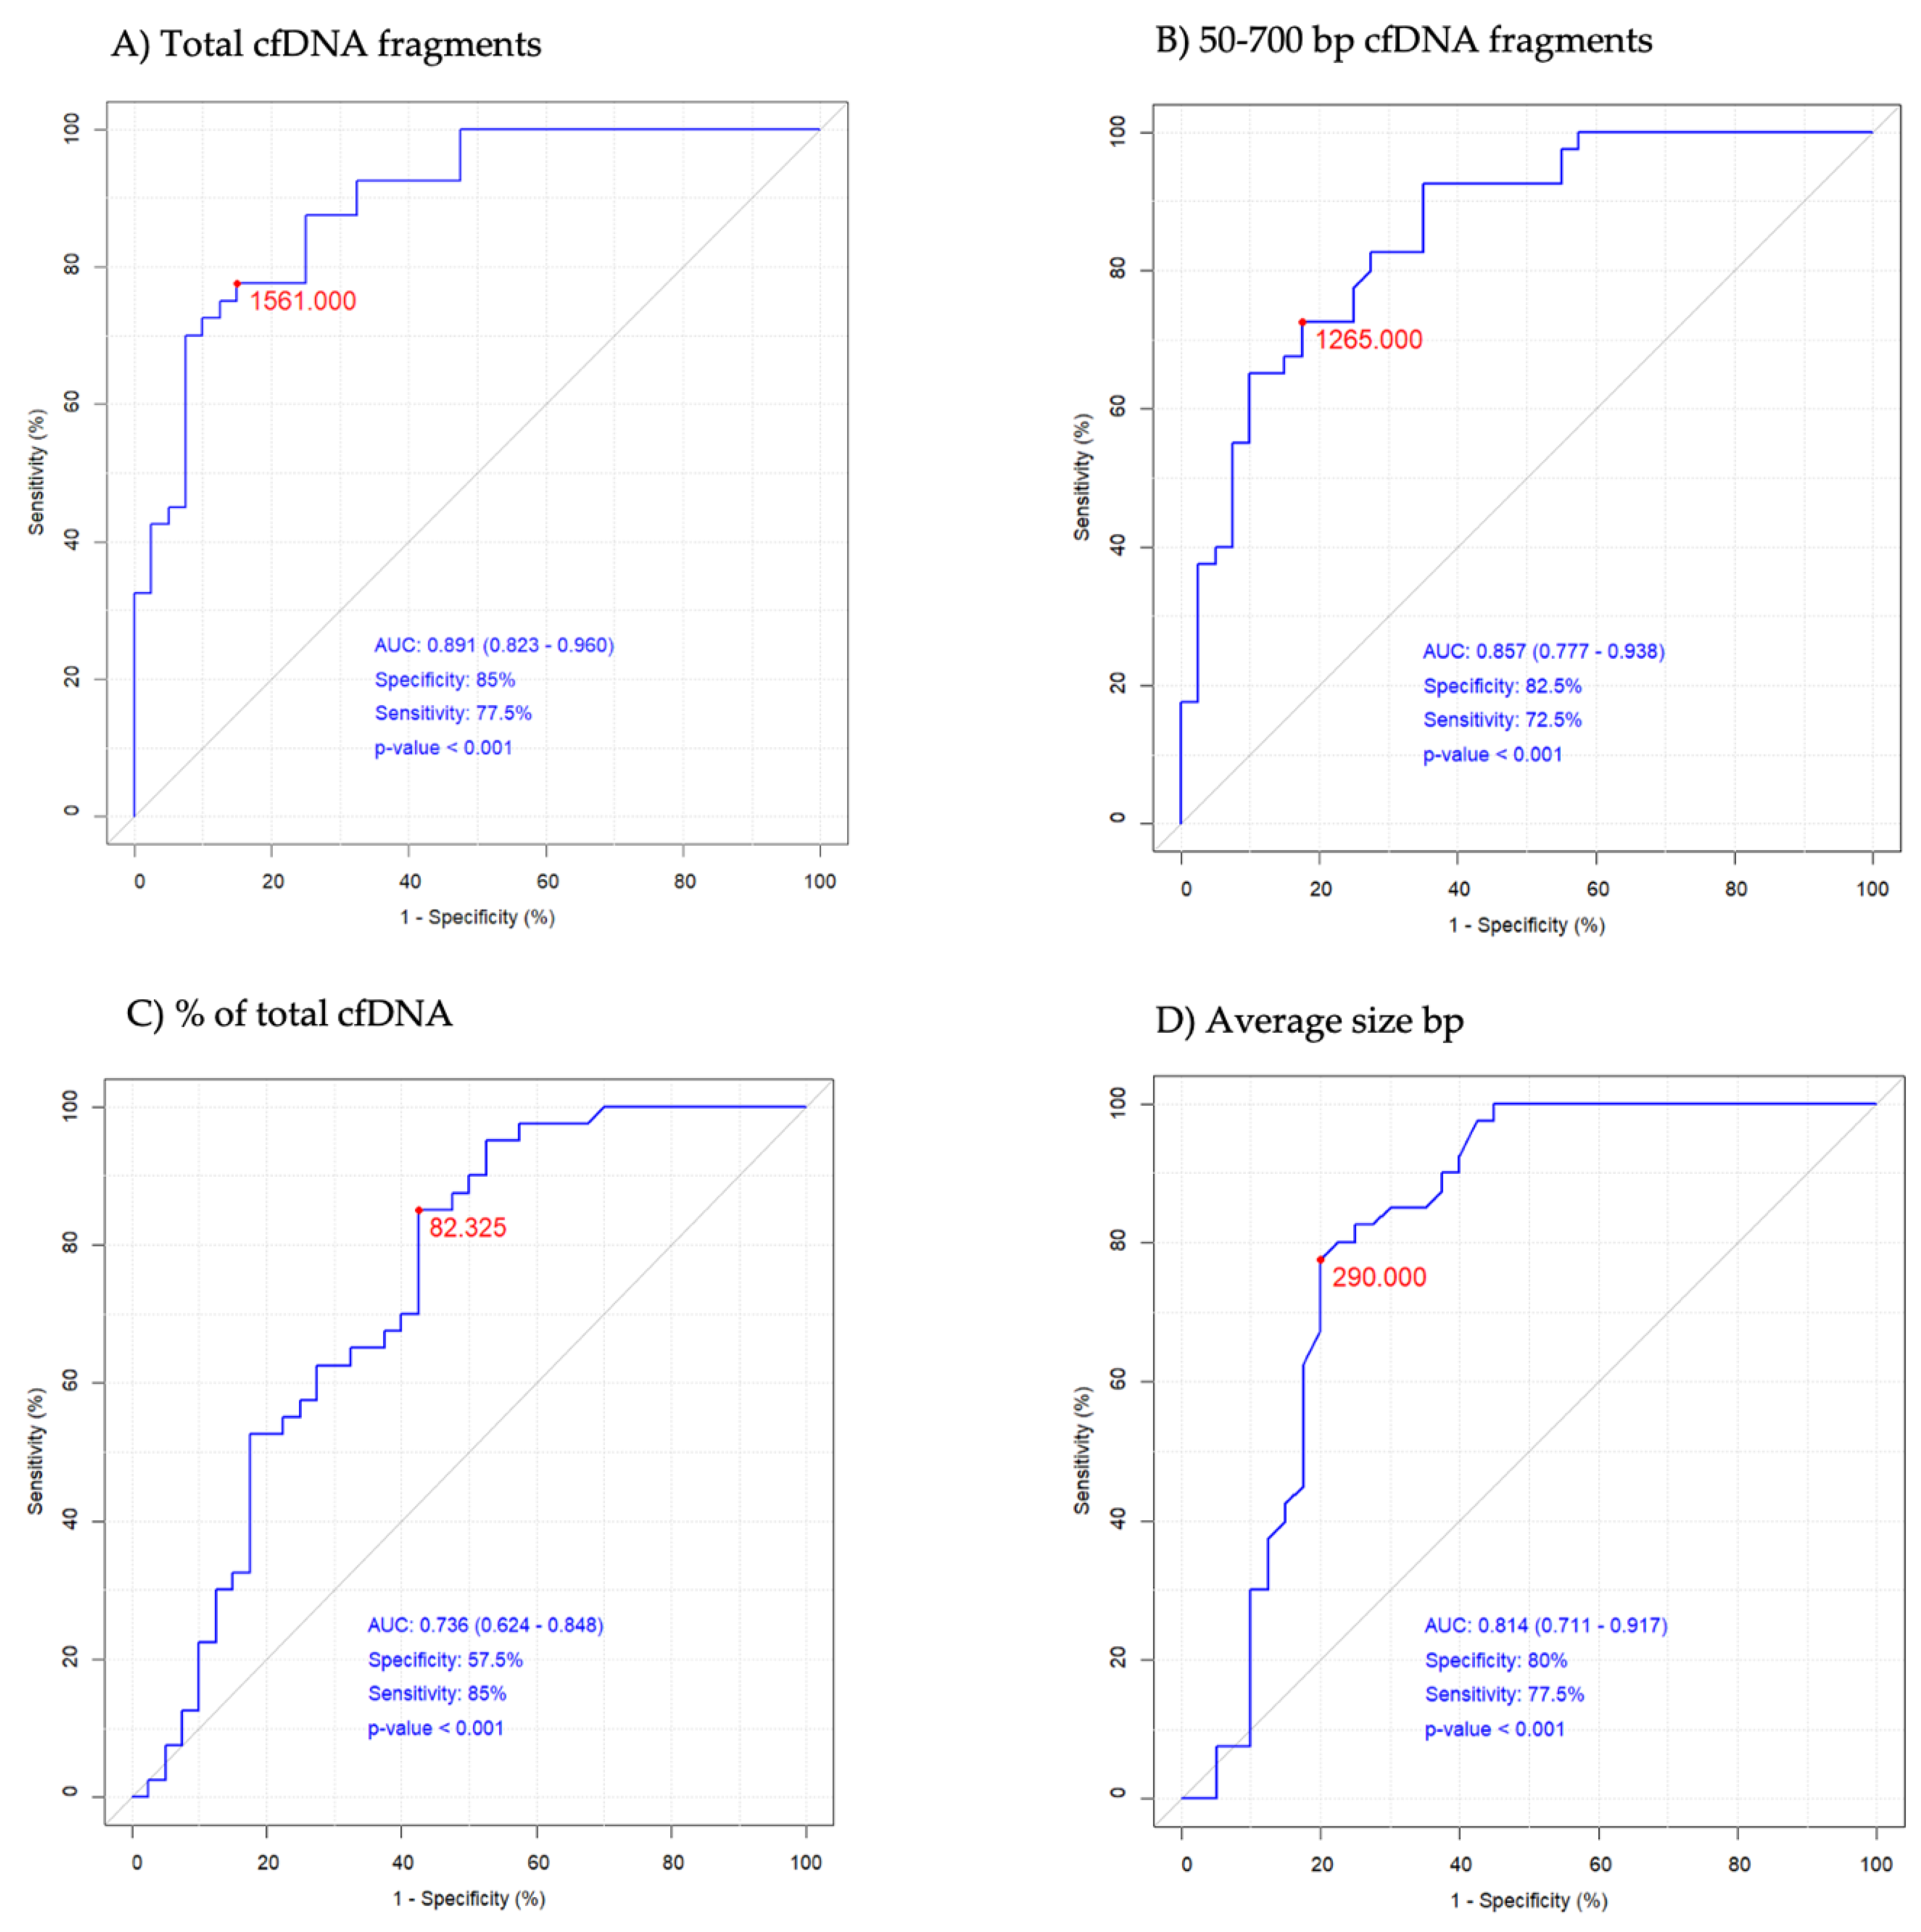
2.3. DNA Analysis
3. Discussion
4. Materials and Methods
4.1. Study Population
4.2. Clinical Assessment
4.3. Blood Samples Collection
4.4. White Blood Cell Count-Derived Inflammation Indices
4.5. DNA Analysis
4.6. Statistical Analysis
Author Contributions
Funding
Institutional Review Board Statement
Informed Consent Statement
Data Availability Statement
Conflicts of Interest
References
- Jarmuzek, P.; Kot, M.; Defort, P.; Stawicki, J.; Komorzycka, J.; Nowak, K.; Tylutka, A.; Zembron-Lacny, A. Prognostic values of combined ratios of white blood cells in glioblastoma: A retrospective study. J. Clin. Med. 2022, 11, 3397. [Google Scholar] [CrossRef] [PubMed]
- Laperriere, N.; Weller, M.; Stupp, R.; Perry, J.R.; Brandes, A.A.; Wick, W.; van den Bent, M.J. Optimal management of elderly patients with glioblastoma. Cancer. Treat. Rev. 2013, 39, 350–357. [Google Scholar] [CrossRef]
- Arakawa, Y.; Mineharu, Y.; Uto, M.; Mizowaki, T. Optimal managements of elderly patients with glioblastoma. Jpn. J. Clin. Oncol. 2022, 52, 833–842. [Google Scholar] [CrossRef] [PubMed]
- Poland Life Expectancy 1950-2024. Available online: https://www.macrotrends.net/countries/POL/poland/life-expectancy (accessed on 27 January 2024).
- Ouchi, Y.; Rakugi, H.; Arai, H.; Akishita, M.; Ito, H.; Toba, K.; Kai, I. Joint Committee of Japan Gerontological Society (JGLS) and Japan Geriatrics Society (JGS) on the definition and classification of the elderly. Redefining the elderly as aged 75 years and older: Proposal from the Joint Committee of Japan Gerontological Society and the Japan Geriatrics Society. Geriatr. Gerontol. Int. 2017, 17, 1045–1047. [Google Scholar] [CrossRef]
- Singh, S.; Bajorek, B. Defining ‘elderly’ in clinical practice guidelines for pharmacotherapy. Pharm. Pract. 2014, 12, 489. [Google Scholar] [CrossRef] [PubMed]
- Kefayat, A.; Amouheidari, A.; Ghahremani, F.; Alirezaei, Z. Diagnostic and prognostic value of stem cell factor plasma level in glioblastoma multiforme patients. Cancer. Med. 2021, 10, 5154–5162. [Google Scholar] [CrossRef] [PubMed]
- Stupp, R.; Brada, M.; van den Bent, M.J.; Tonn, J.C.; Pentheroudakis, G.; ESMO Guidelines Working Group. High-grade glioma: ESMO Clinical Practice Guidelines for diagnosis, treatment and follow-up. Ann. Oncol. 2014, 25 (Suppl. 3), iii93–iii101. [Google Scholar] [CrossRef]
- Müller Bark, J.; Kulasinghe, A.; Chua, B.; Day, B.W.; Punyadeera, C. Circulating biomarkers in patients with glioblastoma. Br. J. Cancer. 2020, 122, 295–305. [Google Scholar] [CrossRef]
- Wang, J.; Bettegowda, C. Applications of DNA-based liquid biopsy for central nervous system neoplasms. J. Mol. Diagn. 2017, 19, 24–34. [Google Scholar] [CrossRef]
- Friedmann-Morvinski, D. Glioblastoma heterogeneity and cancer cell plasticity. Crit. Rev. Oncog. 2014, 19, 327–336. [Google Scholar] [CrossRef]
- Palande, V.; Raviv Shay, D.; Frenkel-Morgenstern, M. Detection of cell-Free DNA in blood plasma samples of cancer patients. J. Vis. Exp. 2020, 9, e61449. [Google Scholar] [CrossRef]
- McMahon, J.T.; Studer, M.; Ulrich, B.; Revuelta Barbero, J.M.; Pradilla, I.; Palacios-Ariza, M.A.; Pradilla, G. Circulating tumor DNA in adults with glioma: A systematic review and meta-Analysis of Biomarker Performance. Neurosurgery 2022, 91, 231–238. [Google Scholar] [CrossRef]
- Murao, A.; Aziz, M.; Wang, H.; Brenner, M.; Wang, P. Release mechanisms of major DAMPs. Apoptosis 2021, 26, 152–162. [Google Scholar] [CrossRef]
- Pastor, B.; Abraham, J.D.; Pisareva, E.; Sanchez, C.; Kudriavstev, A.; Tanos, R.; Mirandola, A.; Mihalovičová, L.; Pezzella, V.; Adenis, A.; et al. Association of neutrophil extracellular traps with the production of circulating DNA in patients with colorectal cancer. iScience 2022, 25, 103826. [Google Scholar] [CrossRef] [PubMed]
- Addanki, S.; Meas, S.; Sarli, V.N.; Singh, B.; Lucci, A. Applications of circulating tumor cells and circulating tumor DNA in precision oncology for breast cancers. Int. J. Mol. Sci. 2022, 23, 7843. [Google Scholar] [CrossRef]
- Merker, J.D.; Oxnard, G.R.; Compton, C.; Diehn, M.; Hurley, P.; Lazar, A.J.; Lindeman, N.; Lockwood, C.M.; Rai, A.J.; Schilsky, R.L.; et al. Circulating tumor DNA analysis in patients with cancer: American Society of Clinical Oncology and College of American Pathologists Joint Review. Arch. Pathol. Lab. Med. 2018, 142, 1242–1253. [Google Scholar] [CrossRef]
- Kustanovich, A.; Schwartz, R.; Peretz, T.; Grinshpun, A. Life and death of circulating cell-free DNA. Cancer. Biol. Ther. 2019, 20, 1057–1067. [Google Scholar] [CrossRef]
- Thierry, A.R.; Sanchez, C. INSERM. Method for Screening a Subject for a Cancer; European Patent Office. 2017. Available online: www.epo.org (accessed on 20 January 2024).
- Thierry, A.R. Circulating DNA fragmentomics and cancer screening. Cell Genom. 2023, 3, 100242. [Google Scholar] [CrossRef] [PubMed]
- Udomruk, S.; Phanphaisarn, A.; Kanthawang, T.; Sangphukieo, A.; Sutthitthasakul, S.; Tongjai, S.; Teeyakasem, P.; Thongkumkoon, P.; Orrapin, S.; Moonmuang, S.; et al. Characterization of cell-free DNA size distribution in osteosarcoma patients. Clin. Cancer Res. 2023, 29, 2085–2094. [Google Scholar] [CrossRef] [PubMed]
- Senhaji, N.; Squalli Houssaini, A.; Lamrabet, S.; Louati, S.; Bennis, S. Molecular and circulating biomarkers in patients with glioblastoma. Int. J. Mol. Sci. 2022, 23, 7474. [Google Scholar] [CrossRef]
- Cisneros-Villanueva, M.; Hidalgo-Pérez, L.; Rios-Romero, M.; Cedro-Tanda, A.; Ruiz-Villavicencio, C.A.; Page, K.; Hastings, R.; Fernandez-Garcia, D.; Allsopp, R.; Fonseca-Montaño, M.A.; et al. Cell-free DNA analysis in current cancer clinical trials: A review. Br. J. Cancer 2022, 126, 391–400. [Google Scholar] [CrossRef]
- Palande, V.; Siegal, T.; Detroja, R.; Gorohovski, A.; Glass, R.; Flueh, C.; Kanner, A.A.; Laviv, Y.; Har-Nof, S.; Levy-Barda, A.; et al. Detection of gene mutations and gene-gene fusions in circulating cell-free DNA of glioblastoma patients: An avenue for clinically relevant diagnostic analysis. Mol. Oncol. 2022, 16, 2098–2114. [Google Scholar] [CrossRef] [PubMed]
- Jarmuzek, P.; Kozlowska, K.; Defort, P.; Kot, M.; Zembron-Lacny, A. Prognostic values of systemic inflammatory immunological markers in glioblastoma: A systematic review and meta-analysis. Cancers 2023, 15, 3339. [Google Scholar] [CrossRef] [PubMed]
- Luo, H.; He, L.; Zhang, G.; Yu, J.; Chen, Y.; Yin, H.; Goyal, H.; Zhang, G.M.; Xiao, Y.; Gu, C.; et al. Normal reference intervals of neutrophil-to-lymphocyte ratio, platelet-to-lymphocyte ratio, lymphocyte-to-monocyte ratio, and systemic immune inflammation index in healthy adults: A large multi-center study from Western China. Clin. Lab. 2019, 65, 255–265. [Google Scholar] [CrossRef] [PubMed]
- Jarmuzek, P.; Defort, P.; Kot, M.; Wawrzyniak-Gramacka, E.; Morawin, B.; Zembron-Lacny, A. Cytokine profile in development of glioblastoma in relation to healthy individuals. Int. J. Mol. Sci. 2023, 24, 16206. [Google Scholar] [CrossRef] [PubMed]
- Jylhävä, J.; Nevalainen, T.; Marttila, S.; Jylhä, M.; Hervonen, A.; Hurme, M. Characterization of the role of distinct plasma cell-free DNA species in age-associated inflammation and frailty. Aging. Cell 2013, 12, 388–397. [Google Scholar] [CrossRef] [PubMed]
- Han, Q.; Hengpo, L.; Cheng, P.; Yang, H.; Zhao, P. Gross Total vs. Subtotal resection on survival outcomes in elderly patients with high-grade glioma: A systematic review and meta-analysis. Front. Oncol. 2020, 10, 151. [Google Scholar] [CrossRef]
- Stejskal, P.; Goodarzi, H.; Srovnal, J.; Hajdúch, M.; van’t Veer, L.J.; Magbanua, M.J.M. Circulating tumor nucleic acids: Biology, release mechanisms, and clinical relevance. Mol. Cancer 2023, 22, 15. [Google Scholar] [CrossRef] [PubMed]
- Greten, F.R.; Grivennikov, S.I. Inflammation and cancer: Triggers, mechanisms, and consequences. Immunity 2019, 51, 27–41. [Google Scholar] [CrossRef]
- Massara, M.; Persico, P.; Bonavita, O.; Mollica Poeta, V.; Locati, M.; Simonelli, M.; Bonecchi, R. Neutrophils in gliomas. Front. Immunol. 2017, 8, 1349. [Google Scholar] [CrossRef]
- Louis, D.N.; Perry, A.; Reifenberger, G.; von Deimling, A.; Figarella-Branger, D.; Cavenee, W.; Ohgaki, H.; Wiestler, O.D.; Kleihues, P.; Ellison, D.W. The 2016 World Health Organization Classification of Tumors of the Central Nervous System: A summary. Acta Nauropathol. 2016, 131, 803–820. [Google Scholar] [CrossRef]
- Thakkar, J.P.; Dolecek, T.A.; Horbinski, C.; Ostrom, Q.T.; Lightner, D.D.; Barnholtz-Sloan, J.S.; Villano, J.L. Epidemiologic and molecular prognostic review of glioblastoma. Cancer Epidemiol. Biomarkers Prev. 2014, 23, 1985–1996. [Google Scholar] [CrossRef] [PubMed]
- Connolly, I.D.; Li, Y.; Gephart, M.H.; Nagpal, S. The “Liquid Biopsy”: The role of circulating DNA and RNA in central nervous system tumors. Curr. Neurol. Neurosci. Rep. 2016, 16, 25. [Google Scholar] [CrossRef] [PubMed]
- Gao, Q.; Zeng, Q.; Wang, Z.; Li, C.; Xu, Y.; Cui, P.; Zhu, X.; Lu, H.; Wang, G.; Cai, S.; et al. Circulating cell-free DNA for cancer early detection. Innovation 2022, 3, 100259. [Google Scholar] [CrossRef] [PubMed]
- Bagley, S.J.; Nabavizadeh, S.A.; Mays, J.J.; Tillm, J.E.; Ware, J.B.; Levy, S.; Sarchiapone, W.; Hussain, J.; Prior, T.; Guiry, S.; et al. Clinical utility of plasma cell-free DNA in adult patients with newly diagnosed glioblastoma: A pilot prospective study. Clin. Cancer. Res. 2020, 26, 397–407. [Google Scholar] [CrossRef] [PubMed]
- Jones, J.; Nguyen, H.; Drummond, K.; Morokoff, A. Circulating biomarkers for glioma: A review. Neurosurgery 2021, 88, 221–230. [Google Scholar] [CrossRef] [PubMed]
- Mouliere, F.; Rosenfeld, N. Circulating tumor-derived DNA is shorter than somatic DNA in plasma. Proc. Natl. Acad. Sci. USA 2015, 112, 3178–3179. [Google Scholar] [CrossRef] [PubMed]
- Moss, J.; Magenheim, J.; Neiman, D.; Zemmour, H.; Loyfer, N.; Korach, A.; Samet, Y.; Maoz, M.; Druid, H.; Arner, P.; et al. Comprehensive human cell-type methylation atlas reveals origins of circulating cell-free DNA in health and disease. Nat. Commun. 2018, 9, 5068. [Google Scholar] [CrossRef] [PubMed]
- Wawrzyniak-Gramacka, E.; Hertmanowska, N.; Tylutka, A.; Morawin, B.; Wacka, E.; Gutowicz, M.; Zembron-Lacny, A. The association of anti-inflammatory diet ingredients and lifestyle exercise with inflammaging. Nutrients 2021, 13, 3696. [Google Scholar] [CrossRef] [PubMed]
- Louis, D.N.; Perry, A.; Wesseling, P.; Brat, D.J.; Cree, I.A.; Figarella-Branger, D.; Hawkins, C.; Ng, H.K.; Pfister, S.M.; Reifenberger, G.; et al. The 2021 WHO classification of tumors of the central nervous system: A summary. Neuro. Oncol. 2021, 23, 1231–1251. [Google Scholar] [CrossRef] [PubMed]
- Chen, W.J.; He, D.S.; Tang, R.X.; Ren, F.H.; Chen, G. Ki-67 is a valuable prognostic factor in gliomas: Evidence from a systematic review and meta-analysis. Asian. Pac. J. Cancer. Prev. 2015, 16, 411–420. [Google Scholar] [CrossRef]
- R Core Team. R: A language and environment for statistical computing. R Foundation for Statistical Computing, Vienna, Austria. 2022. Available online: https://www.R-project.org/ (accessed on 10 December 2023).


| Variables | Reference Values | HC n = 40 | GBM n = 40 | |||
|---|---|---|---|---|---|---|
| Mean ± SD | Med (IQR 25–75%) | Mean ± SD | Med (IQR 25–75%) | HC vs. GBM p Level | ||
| WBCs (103/µL) | 4.0–10.2 | 5.73 ± 1.55 | 5.50 (4.95–6.34) | 8.47 ± 3.09 | 7.87 (5.83–10.33) | <0.001 |
| Neutrophils (103/µL) | 2.0–6.9 | 2.99 ± 1.06 | 2.88 (2.42–3.39) | 10.69 ± 3.09 | 7.87 (5.85–12.79) | <0.001 |
| Lymphocytes (103/µL) | 0.6–3.4 | 1.94 ± 0.58 | 1.85 (1.68–2.15) | 1.83 ± 1.36 | 1.50 (0.87–2.34) | 0.059 |
| Monocytes (103/µL) | 0.00–0.90 | 0.52 ± 0.12 | 0.53 (0.46–0.58) | 0.73 ± 0.78 | 0.56 (0.37–0.79) | 0.695 |
| Platelets (103/µL) | 140–420 | 227 ± 53 | 223 (198–247) | 216 ± 111 | 206 (136–244) | 0.373 |
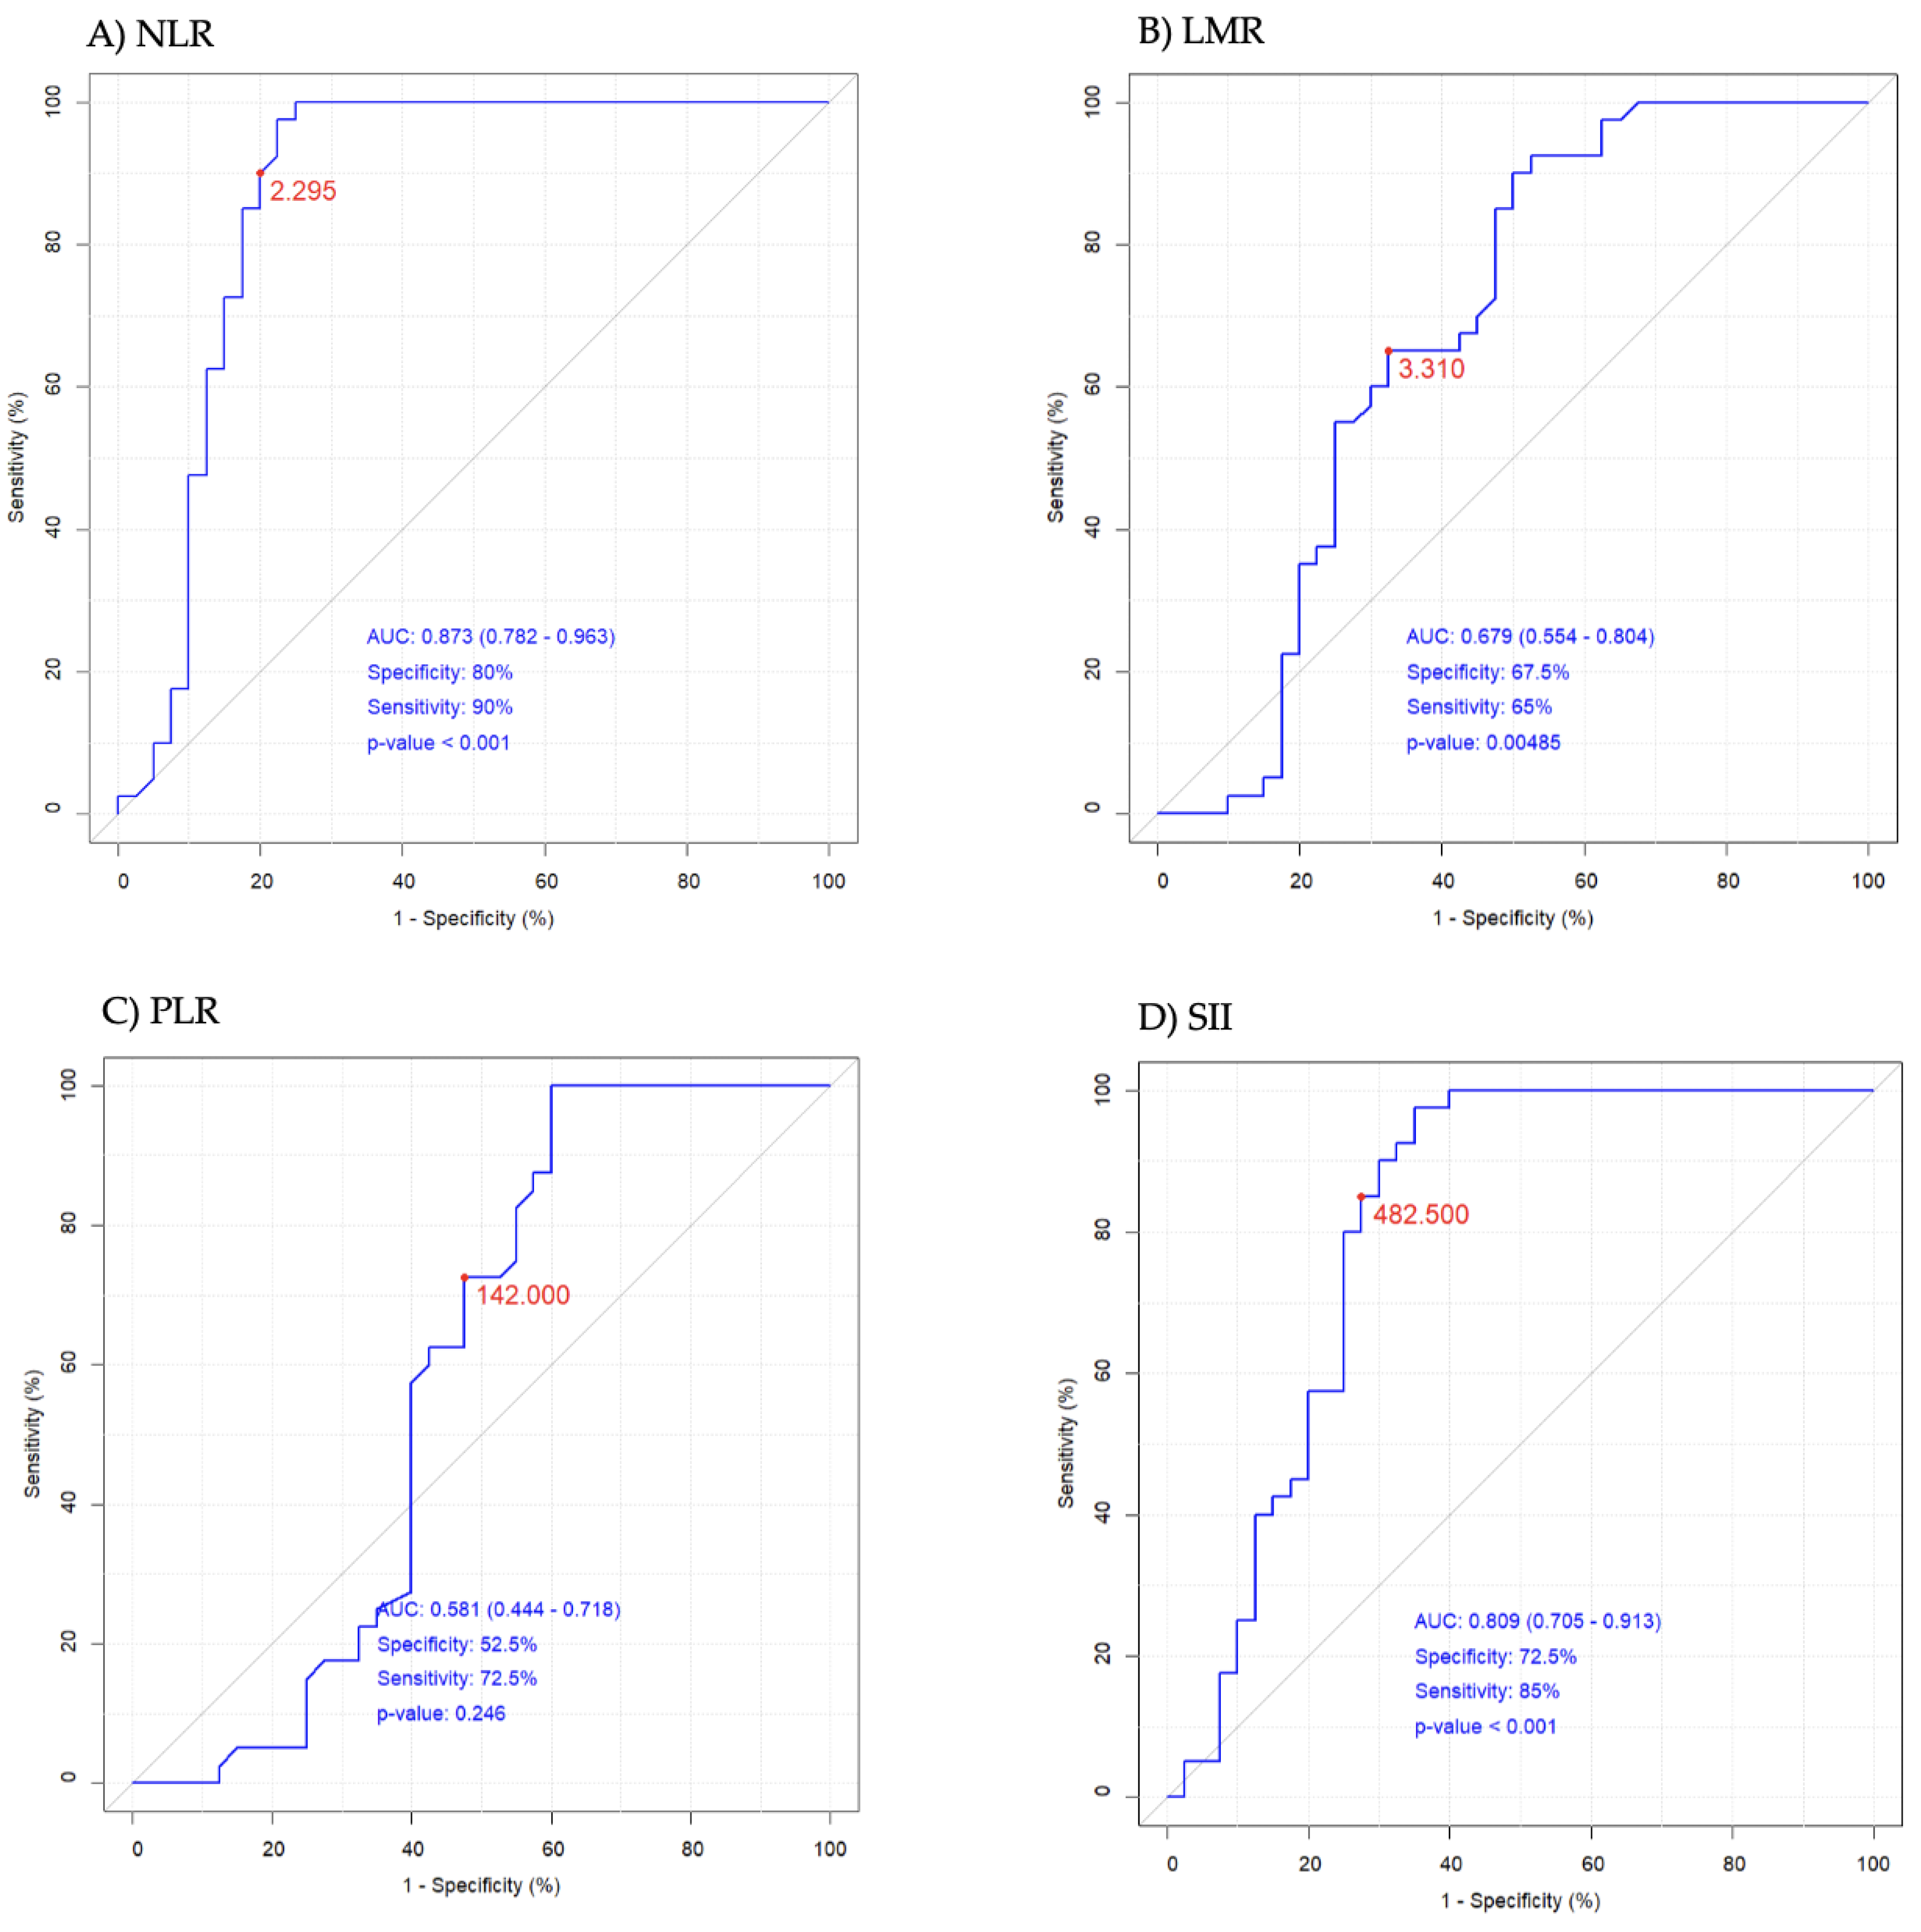
| NLR | 0.87–4.15 | 1.58 ± 0.50 | 1.55 (1.33–1.84) | 8.33 ± 7.30 | 5.71 (3.00–11.81) | <0.001 |
| PLR | 47–198 | 123 ± 34 | 115 (103–154) | 166 ± 112 | 146 (87–207) | 0.085 |
| LMR | 2.45–8.77 | 3.81 ± 1.08 | 3.69 (2.99–4.56) | 4.41 ± 6.44 | 2.69 (1.75–3.71) | <0.001 |
| SII | 142–808 | 366 ± 163 | 338 (260–452) | 1796 ± 1704 | 1243 (447–2558) | <0.001 |
| Variables | HC n = 40 | GBM n = 40 | HC vs. GBM p Level | ||
|---|---|---|---|---|---|
| Mean ± SD | Med (IQR 25–75%) | Mean ± SD | Med (IQR 25–75%) | ||
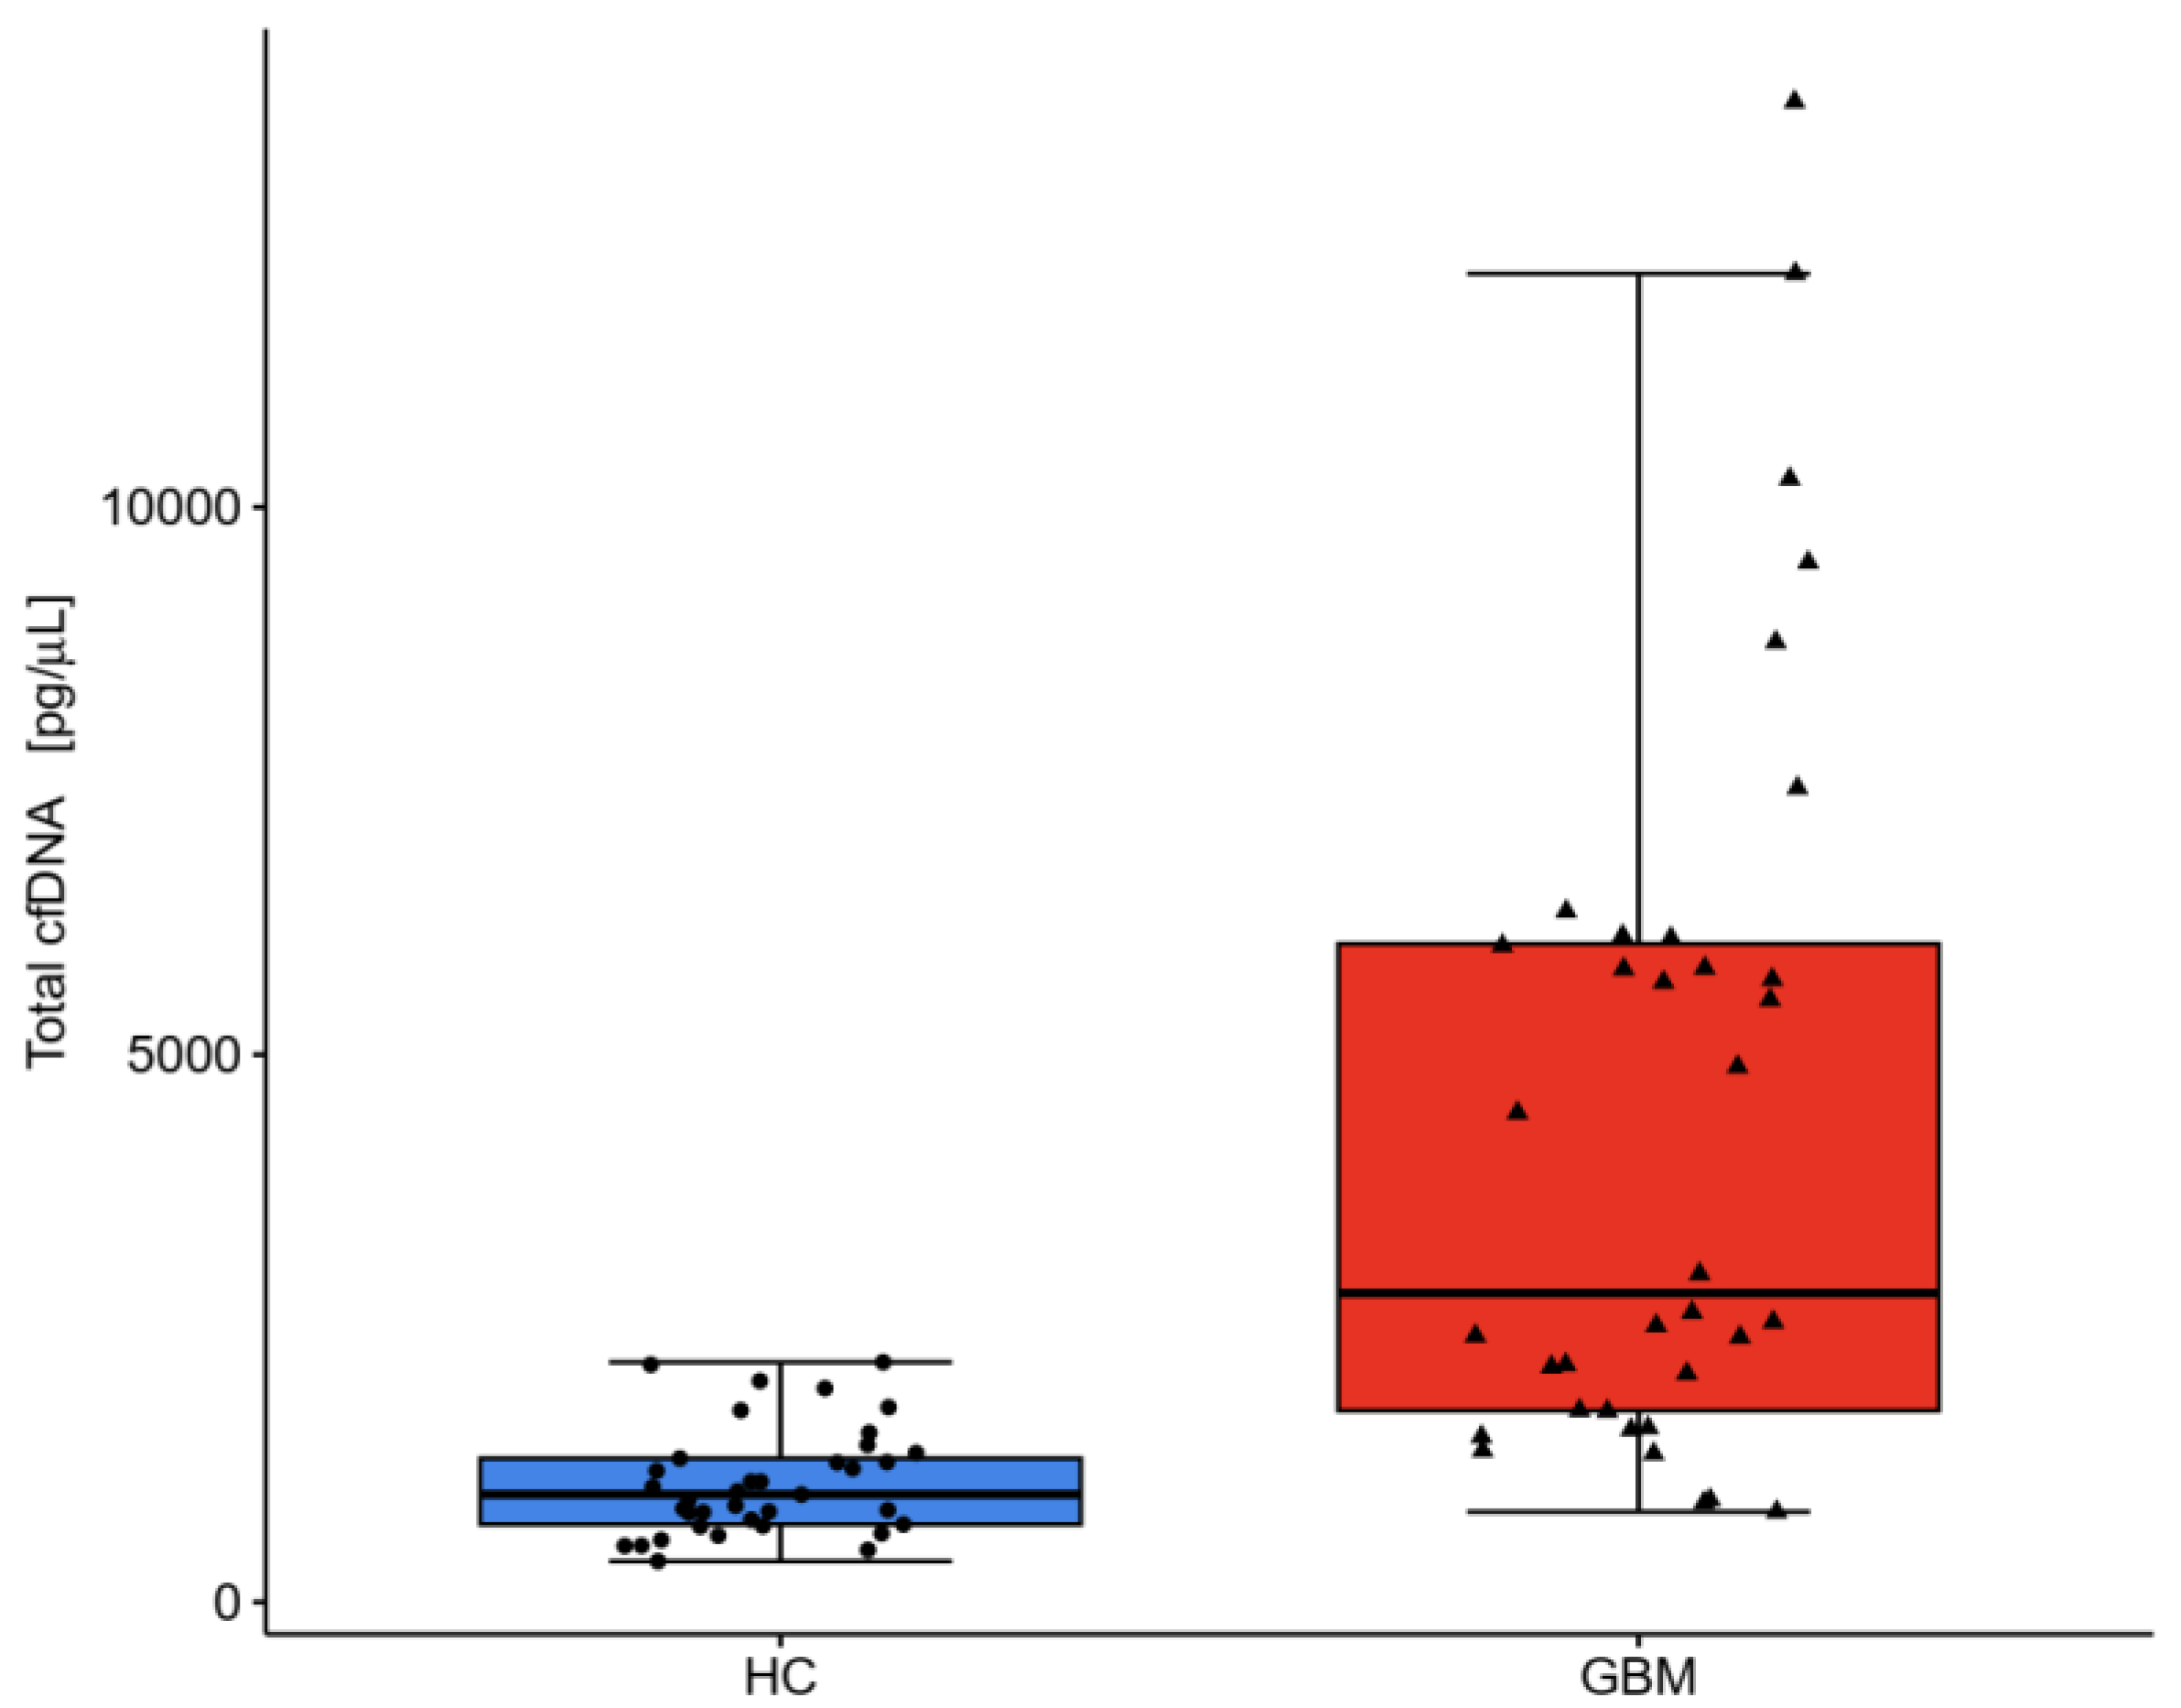
| Total cfDNA pg/μL | 1290 ± 851 | 1032 (741–1463) | 6520 ± 7374 | 4678 (2003–6590) | <0.001 |
| 50–700 bp cfDNA pg/μL | 1131 ± 762 | 870 (649–1375) | 4360 ± 4371 | 2435 (1515–5312) | <0.001 |
| % of total cfDNA | 86.87 ± 5.39 | 87.79 (83.30–91.00) | 74.38 ± 17.92 | 80.32 (67.59–86.60) | <0.001 |
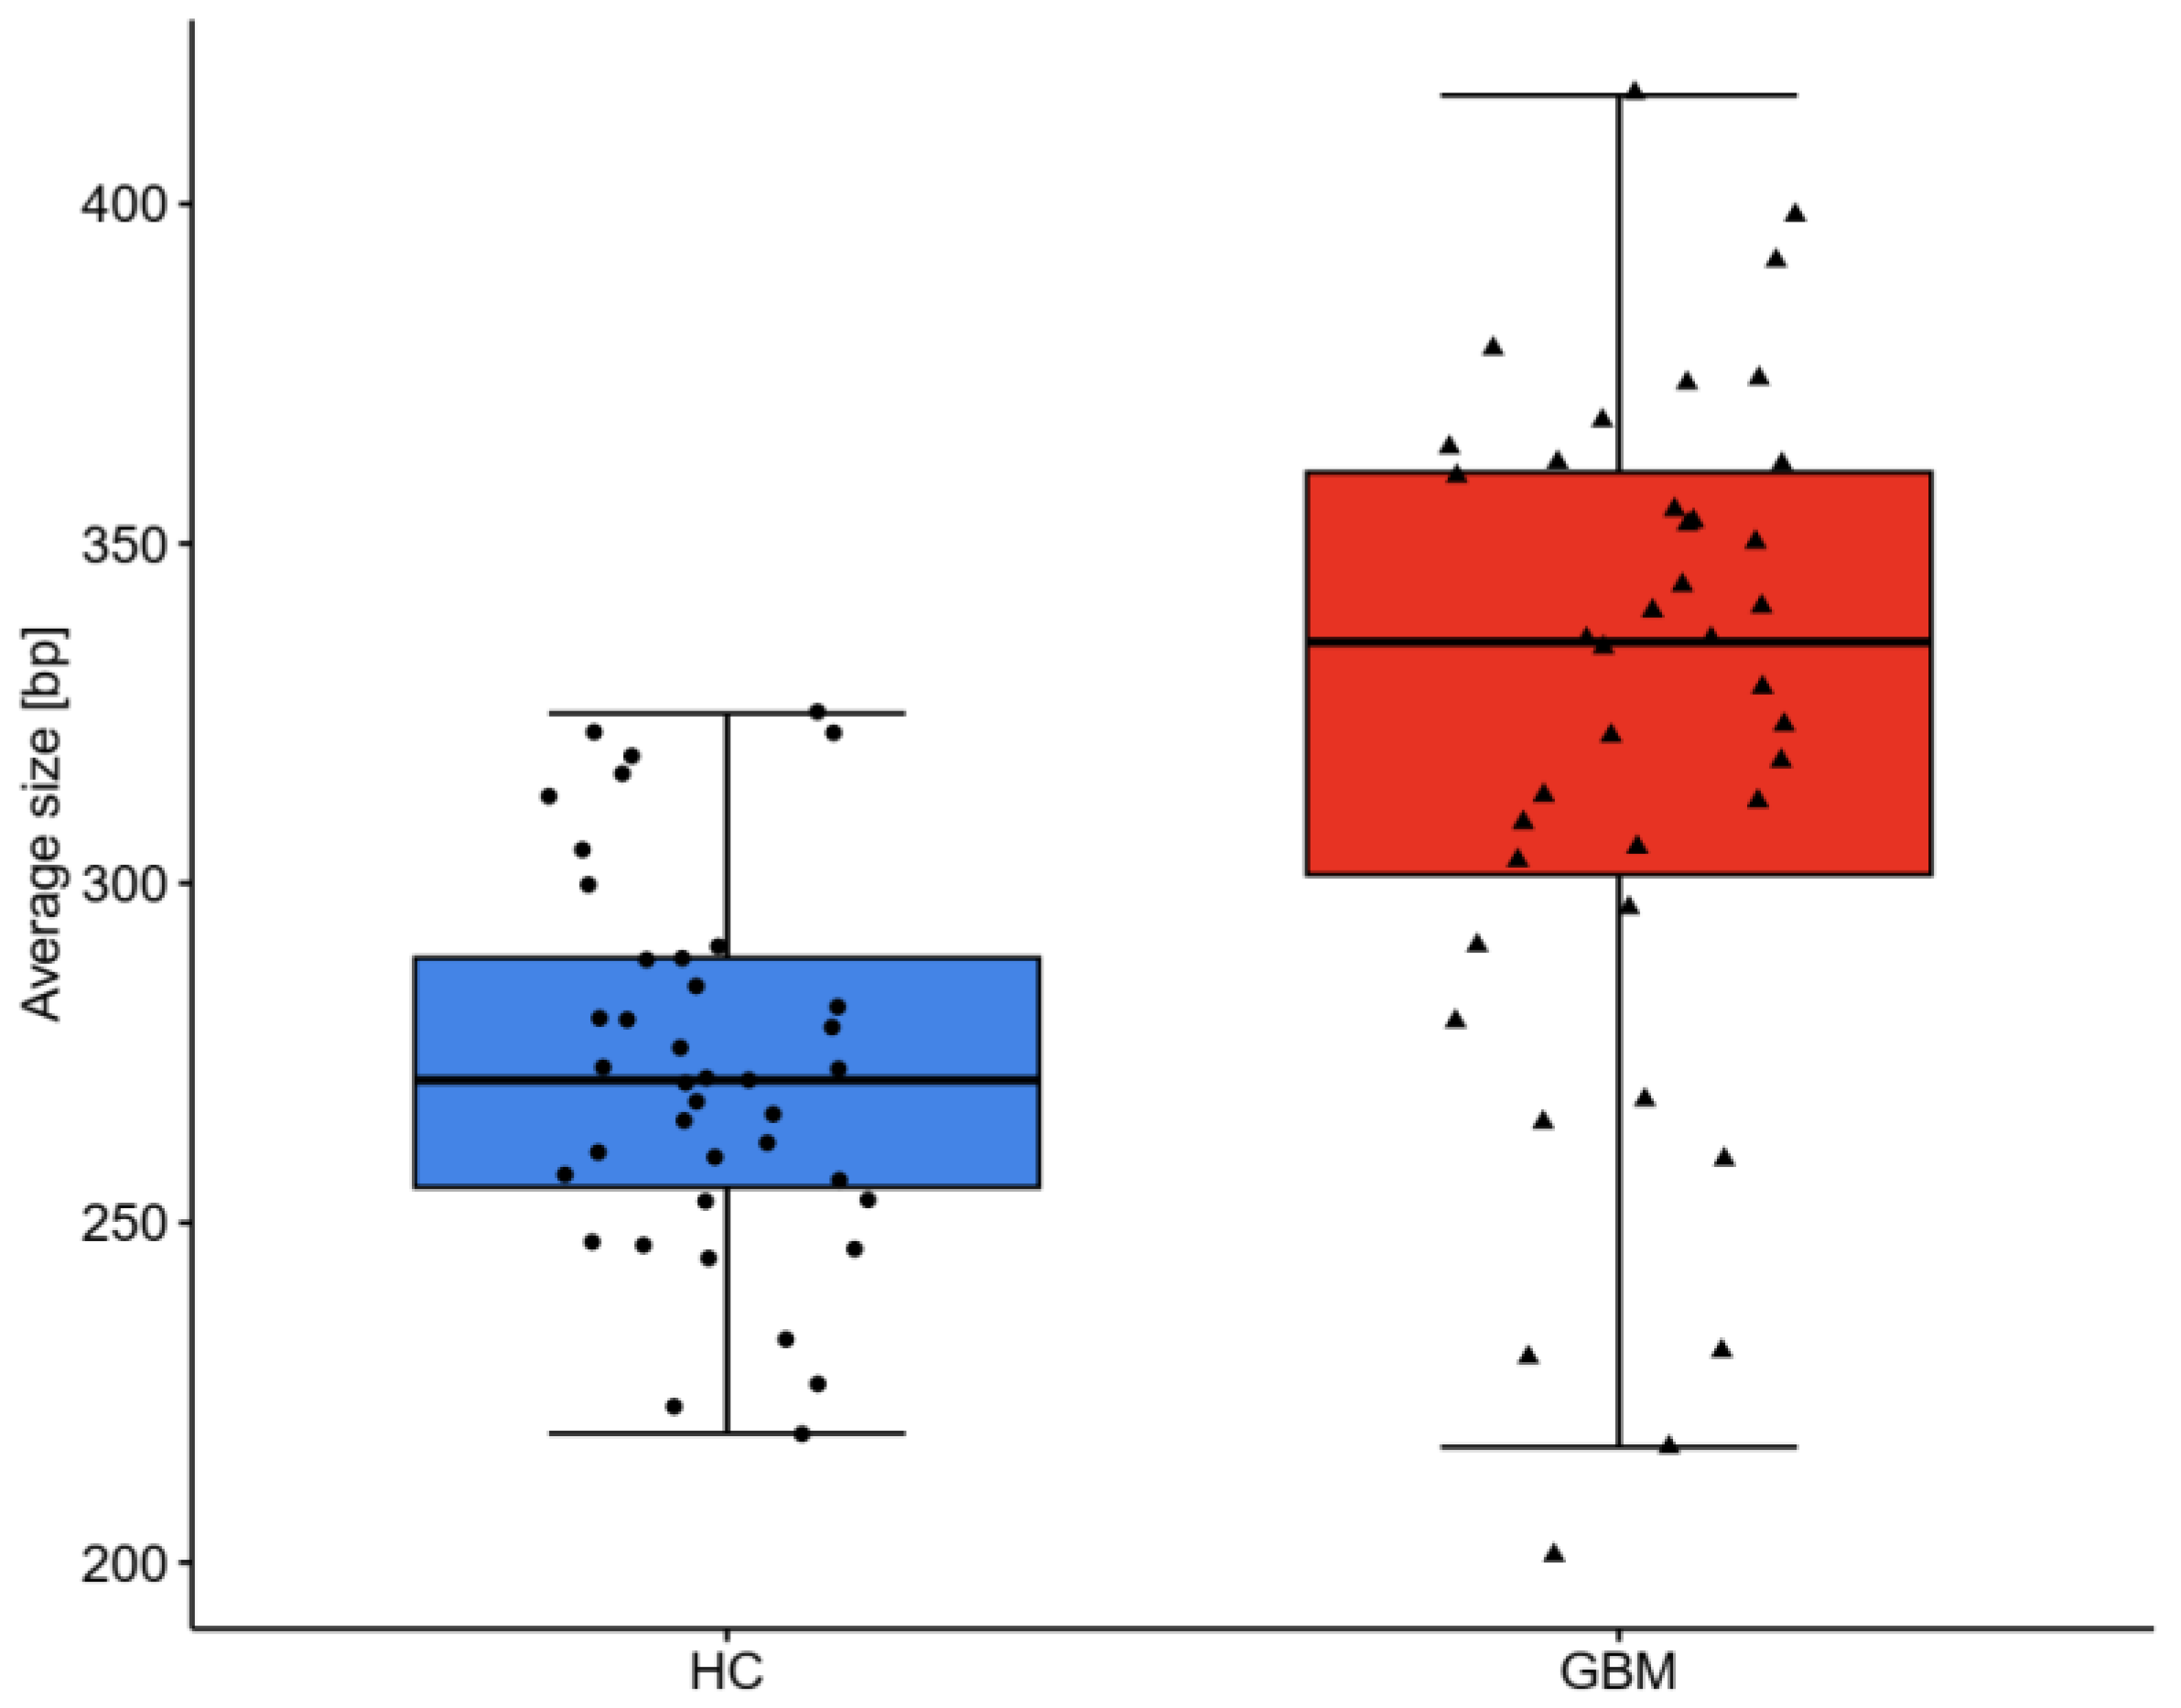
| Average size bp | 272 ± 27 | 271 (255–289) | 324 ± 50 | 336 (301–360) | <0.001 |
| Value | ||
|---|---|---|
| Follow-up period | Mean ± SD (day) | 175.7 ± 133.2 |
| Median (range) | 149.5 (4–570) | |
| Age at operation | Mean ± SD (year) | 65.0 ± 11.3 |
| Median (range) | 63.6 (38–89) | |
| Gender | Females | 24 (60%) |
| Males | 16 (40%) | |
| Hemisphere | Left | 17 (42.5%) |
| Right | 20 (50%) | |
| Midline or bilateral | 3 (7.5%) | |
| Location | Frontal lobe | 13 (32.5%) |
| Temporal lobe | 9 (22.5%) | |
| Parietal lobe | 7 (17.5%) | |
| Occipital lobe | 3 (7.5%) | |
| Subtentorial location | 2 (5%) | |
| Multifocal | 1 (1.5%) | |
| Ki-67 | ≥30% | 26 (65%) |
| <30% | 14 (35%) | |
Disclaimer/Publisher’s Note: The statements, opinions and data contained in all publications are solely those of the individual author(s) and contributor(s) and not of MDPI and/or the editor(s). MDPI and/or the editor(s) disclaim responsibility for any injury to people or property resulting from any ideas, methods, instructions or products referred to in the content. |
© 2024 by the authors. Licensee MDPI, Basel, Switzerland. This article is an open access article distributed under the terms and conditions of the Creative Commons Attribution (CC BY) license (https://creativecommons.org/licenses/by/4.0/).
Share and Cite
Jarmuzek, P.; Wawrzyniak-Gramacka, E.; Morawin, B.; Tylutka, A.; Zembron-Lacny, A. Diagnostic and Prognostic Value of Circulating DNA Fragments in Glioblastoma Multiforme Patients. Int. J. Mol. Sci. 2024, 25, 4221. https://doi.org/10.3390/ijms25084221
Jarmuzek P, Wawrzyniak-Gramacka E, Morawin B, Tylutka A, Zembron-Lacny A. Diagnostic and Prognostic Value of Circulating DNA Fragments in Glioblastoma Multiforme Patients. International Journal of Molecular Sciences. 2024; 25(8):4221. https://doi.org/10.3390/ijms25084221
Chicago/Turabian StyleJarmuzek, Pawel, Edyta Wawrzyniak-Gramacka, Barbara Morawin, Anna Tylutka, and Agnieszka Zembron-Lacny. 2024. "Diagnostic and Prognostic Value of Circulating DNA Fragments in Glioblastoma Multiforme Patients" International Journal of Molecular Sciences 25, no. 8: 4221. https://doi.org/10.3390/ijms25084221
APA StyleJarmuzek, P., Wawrzyniak-Gramacka, E., Morawin, B., Tylutka, A., & Zembron-Lacny, A. (2024). Diagnostic and Prognostic Value of Circulating DNA Fragments in Glioblastoma Multiforme Patients. International Journal of Molecular Sciences, 25(8), 4221. https://doi.org/10.3390/ijms25084221