
TRPC3 Is Downregulated in Primary Hyperparathyroidism
 , and
, and
Abstract
:1. Introduction
2. Materials and Methods
2.1. Samples
2.2. Tissue Treatment
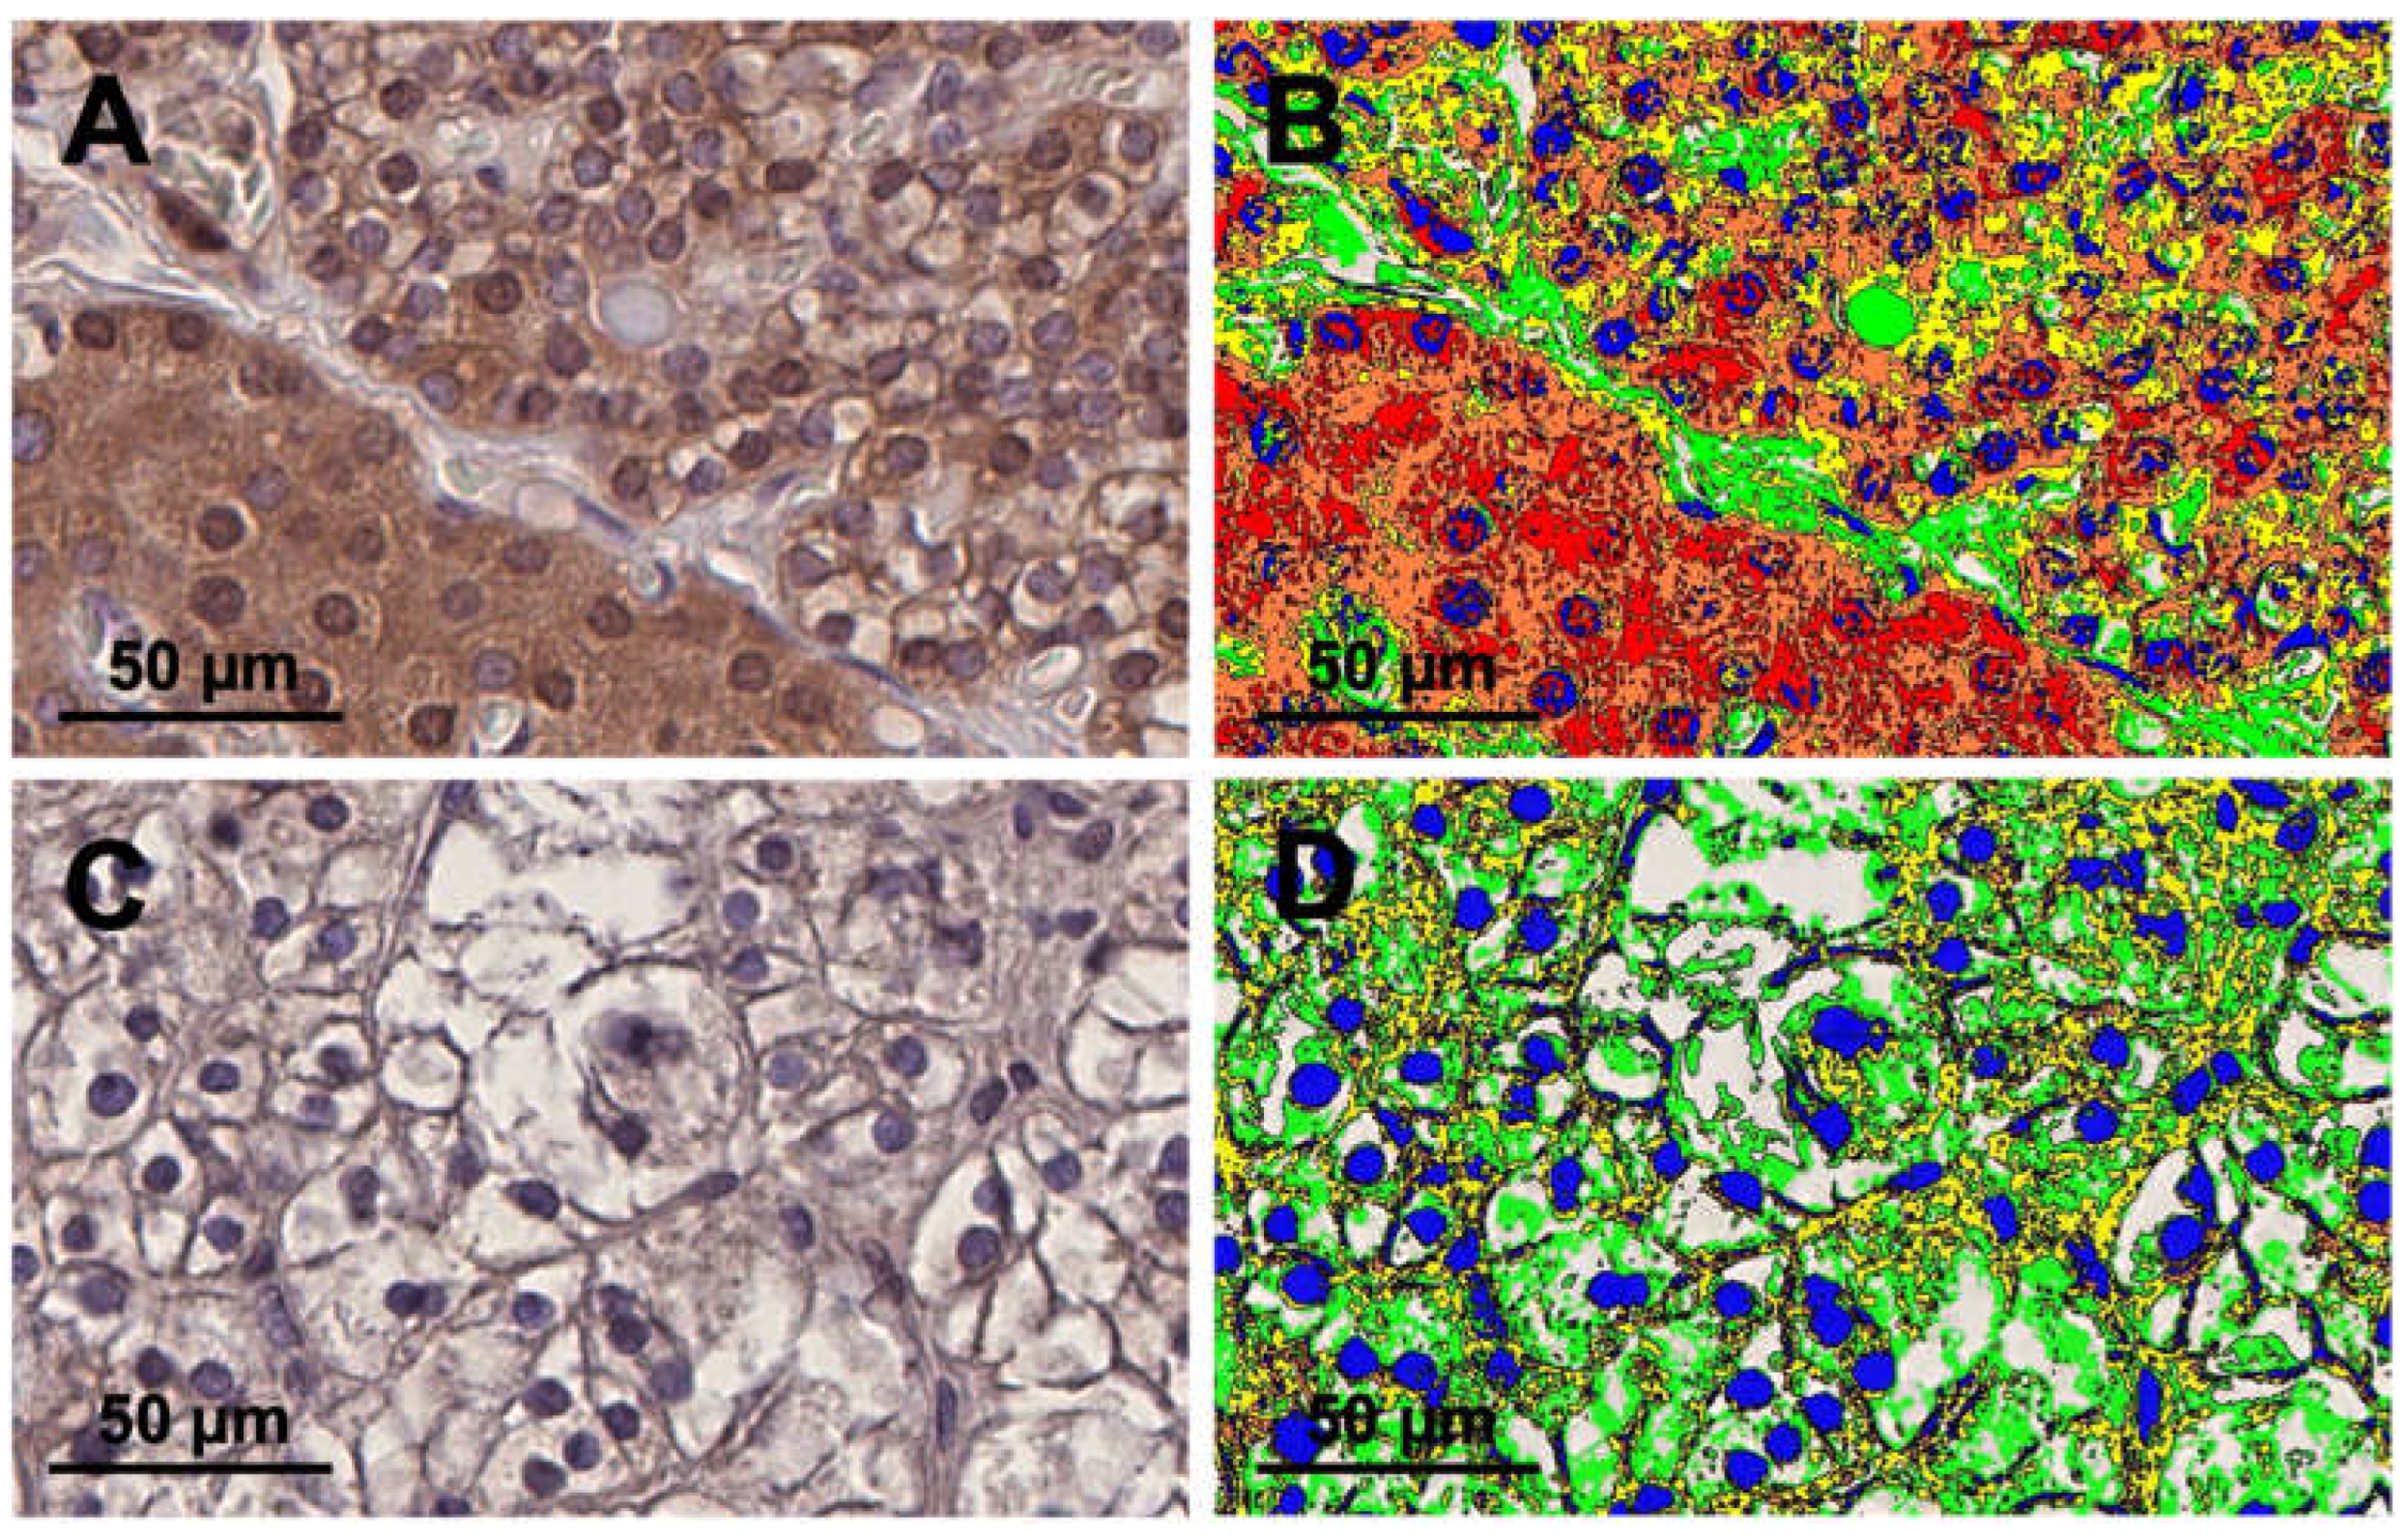
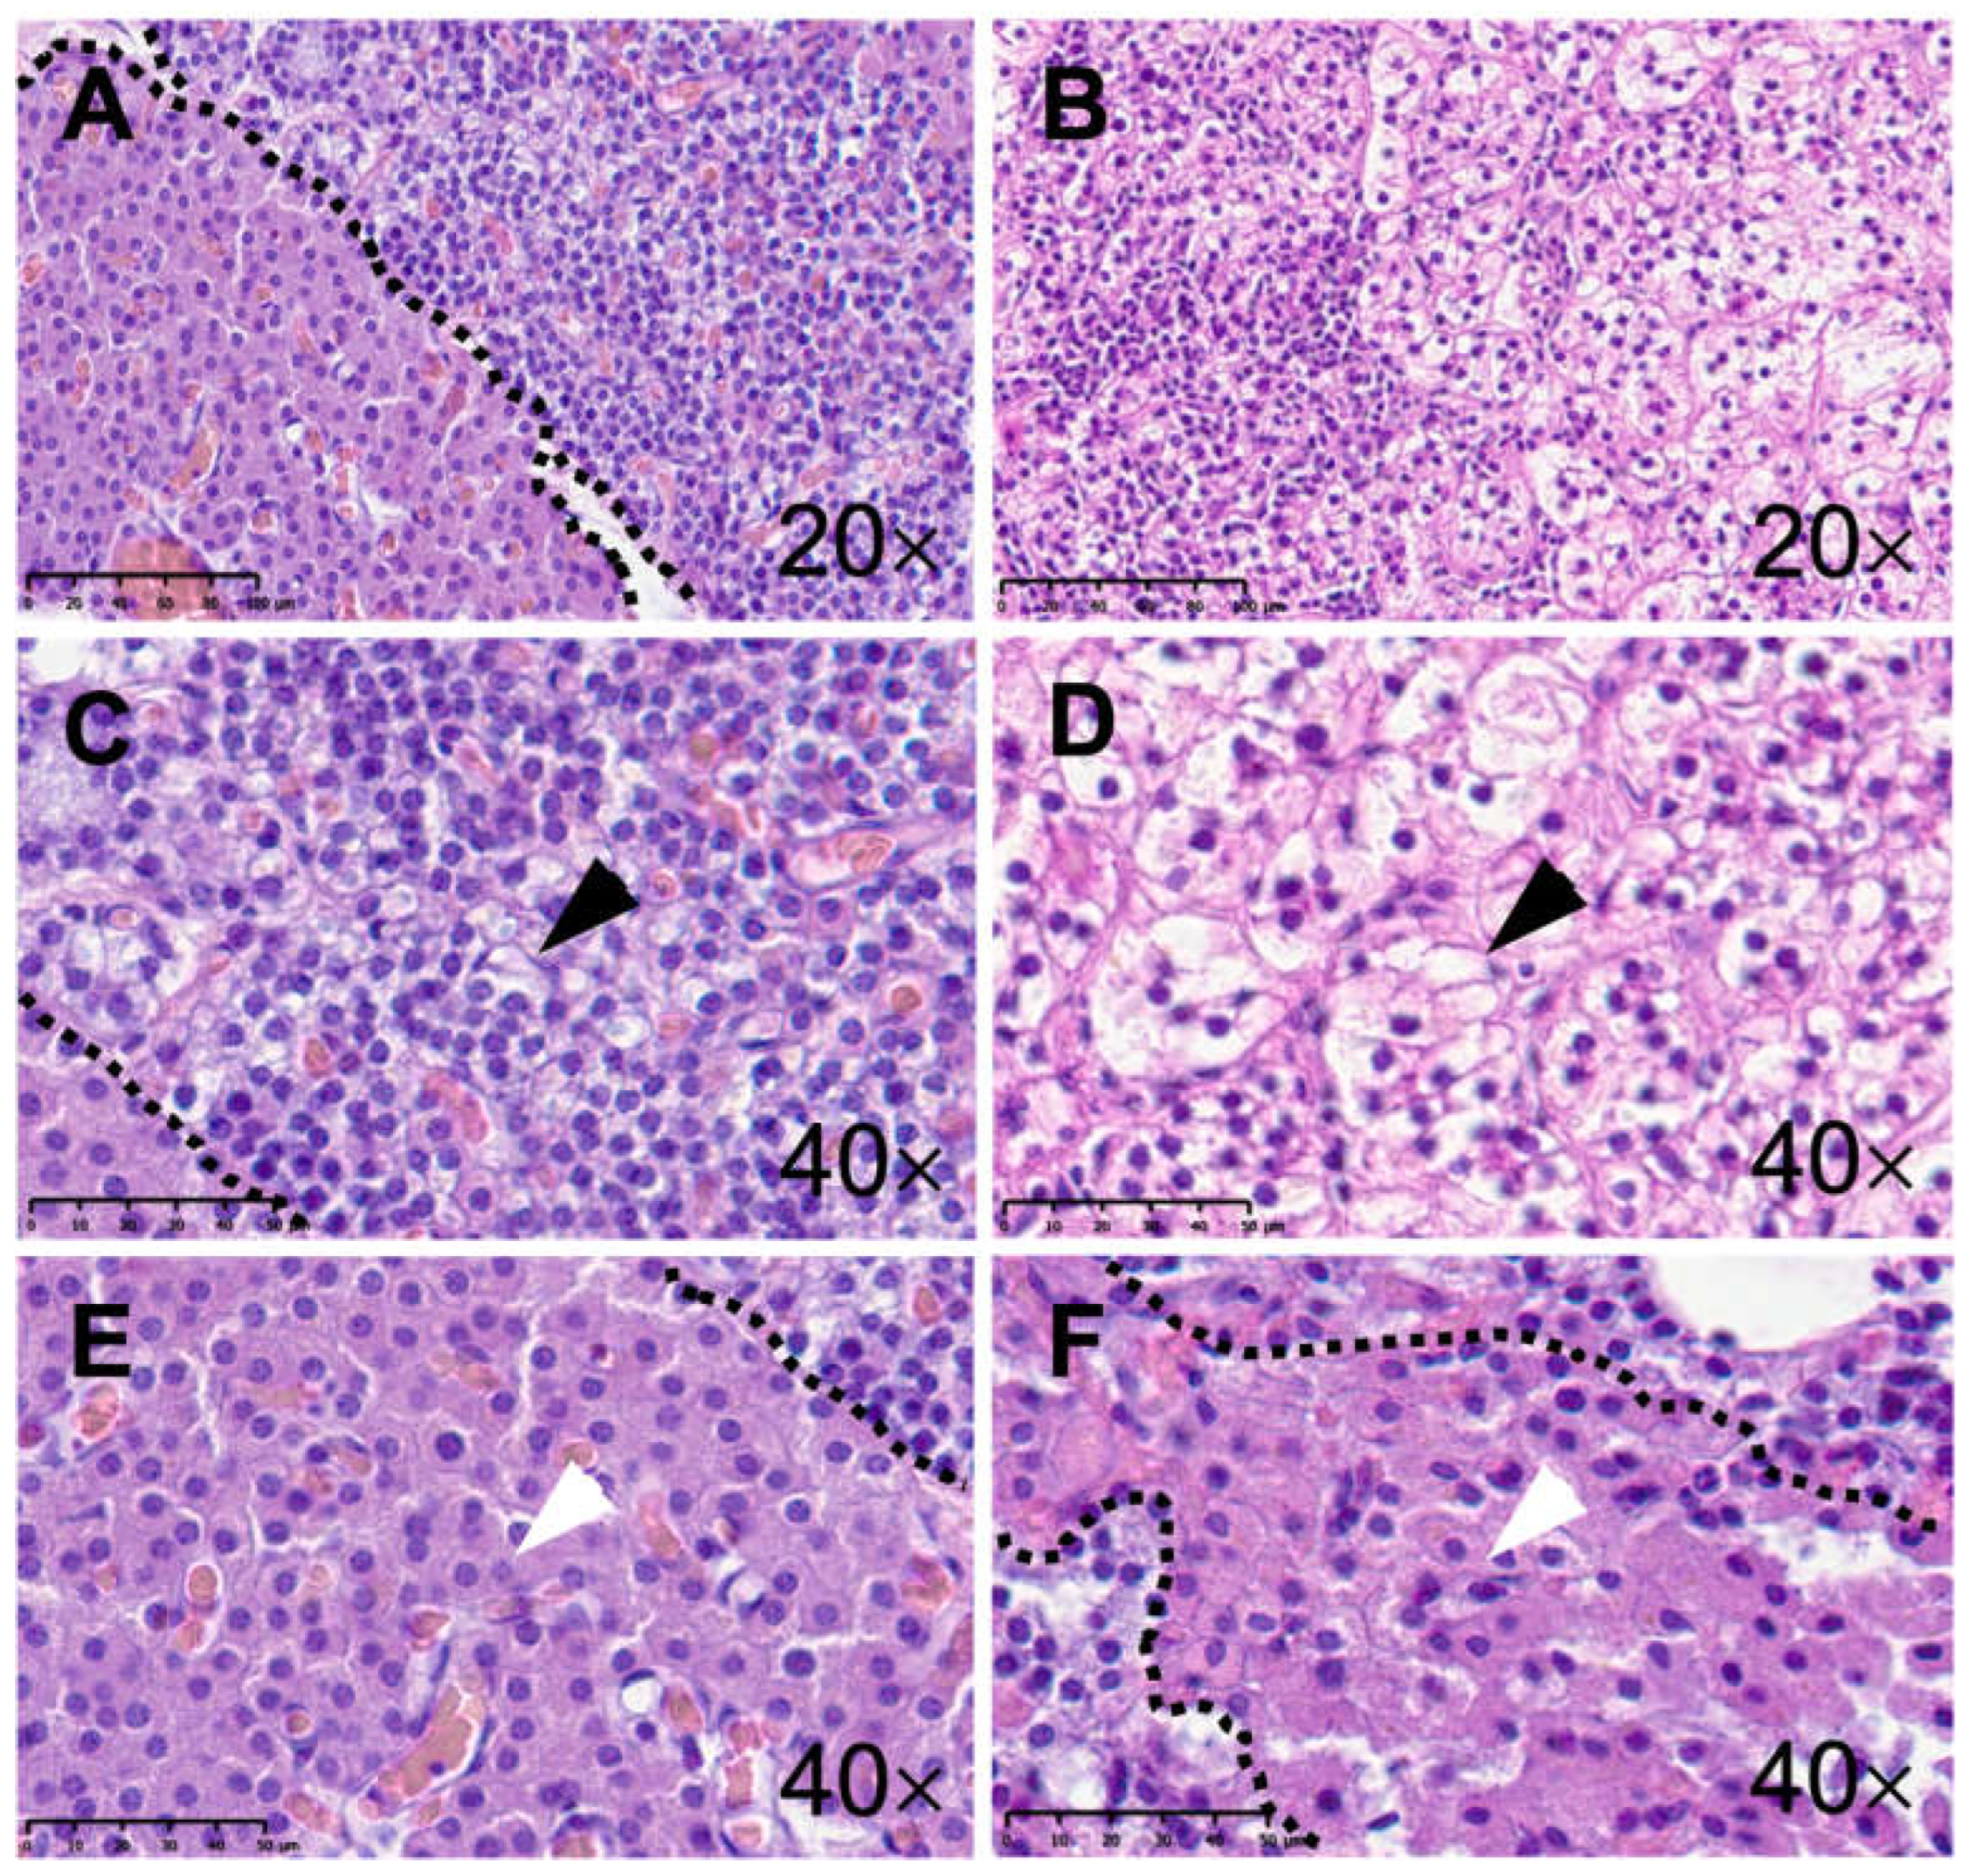
2.3. Histology
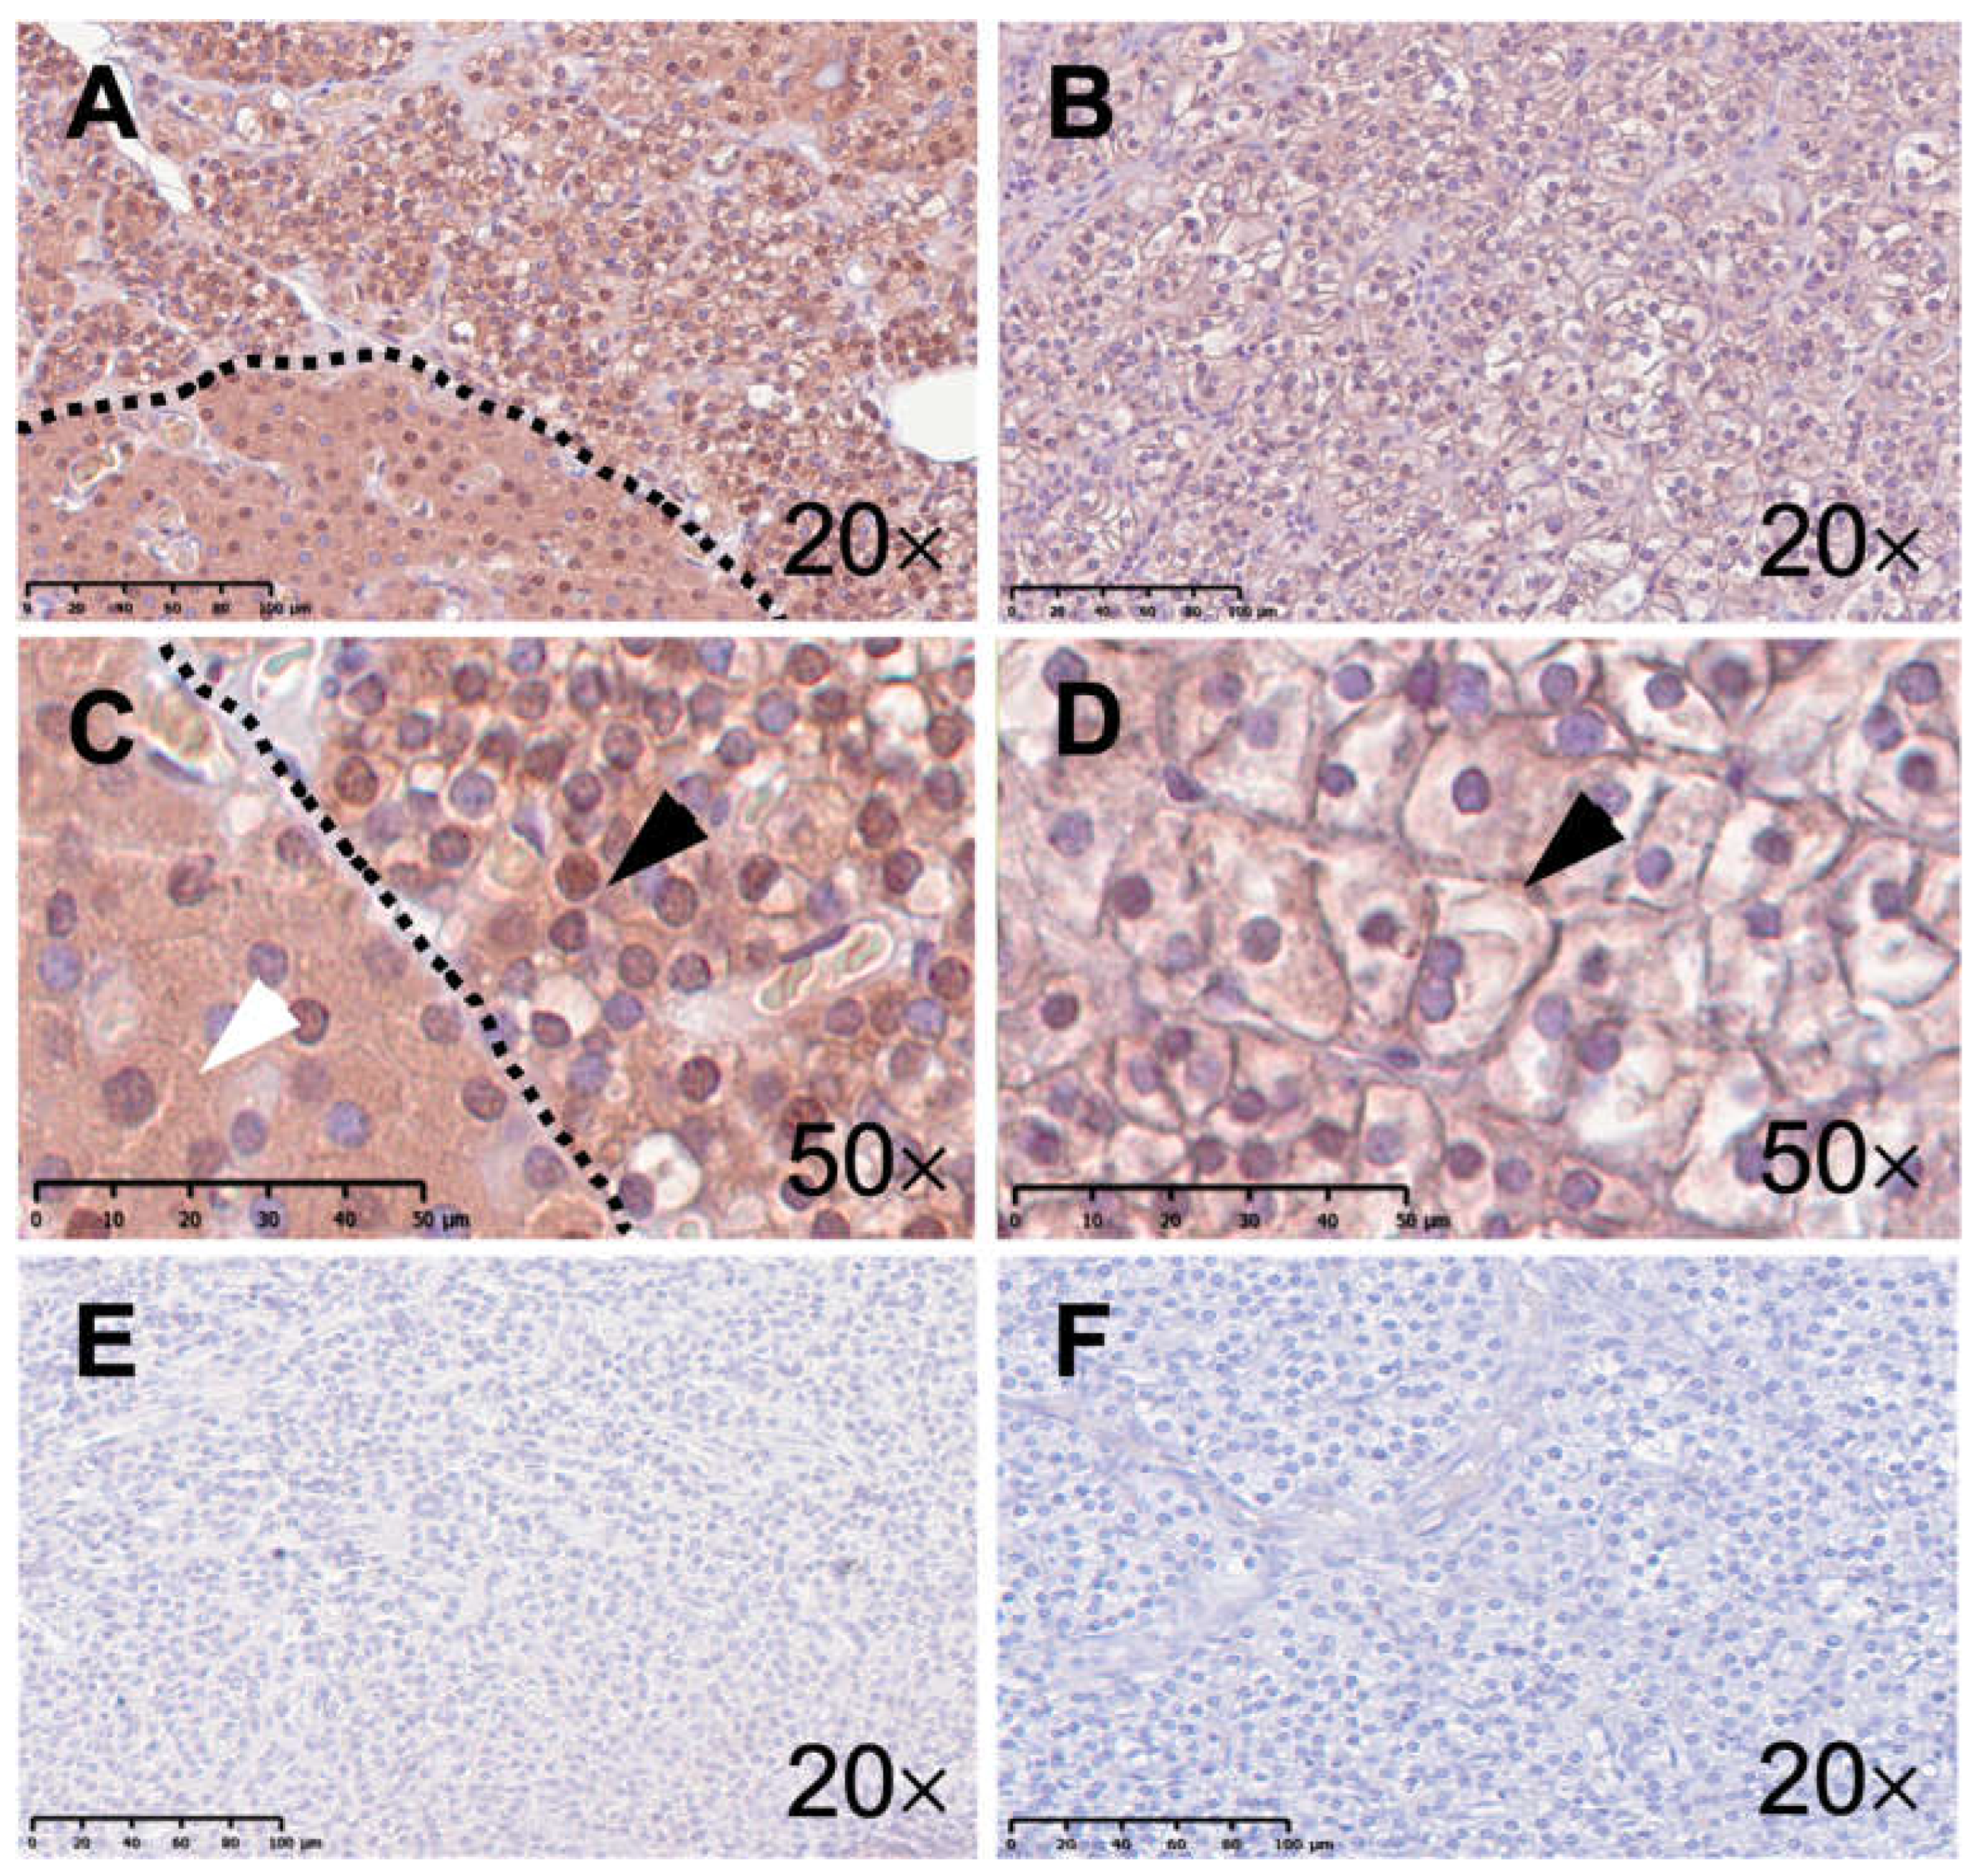
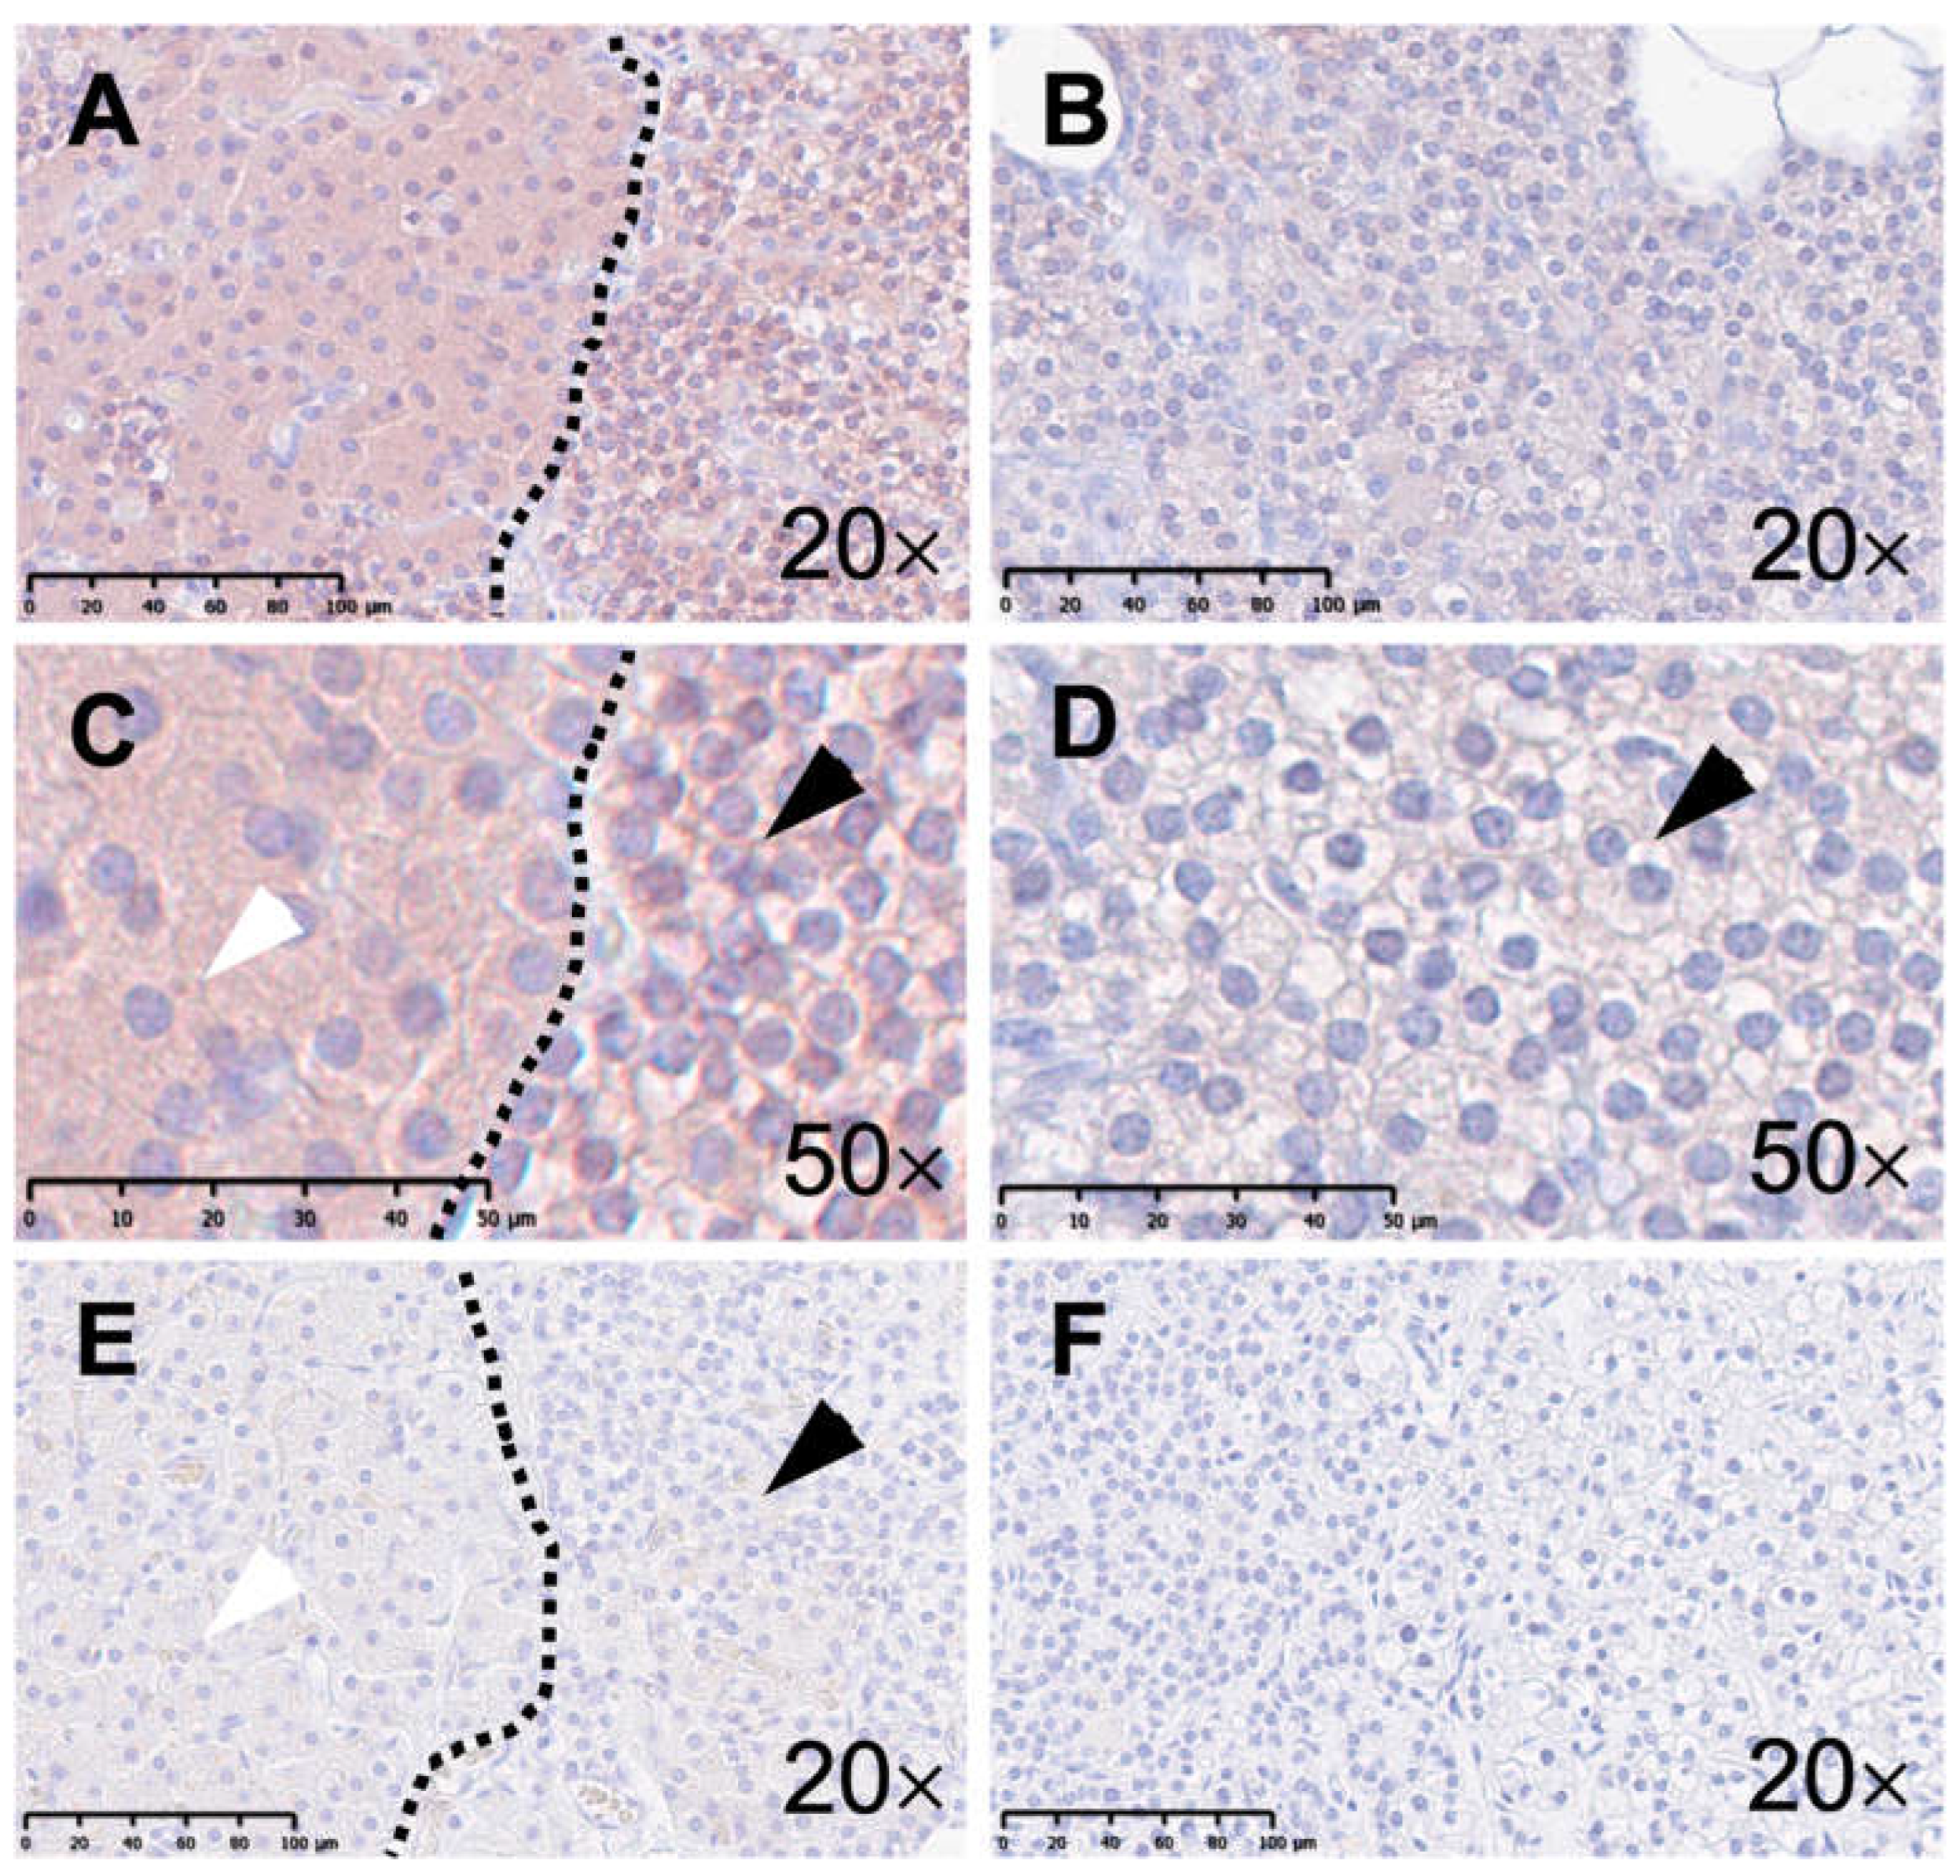
2.4. Evaluation
2.5. Statistical Analysis
3. Results
4. Discussion
5. Conclusions
Author Contributions
Funding
Institutional Review Board Statement
Informed Consent Statement
Data Availability Statement
Conflicts of Interest
References
- Brown, M.B.; Limaiem, F. Histology, Parathyroid Gland. In StatPearls; StatPearls: Treasure Island, FL, USA, 2023. [Google Scholar]
- Onopiuk, M.; Eby, B.; Nesin, V.; Ngo, P.; Lerner, M.; Gorvin, C.M.; Stokes, V.J.; Thakker, R.V.; Brandi, M.L.; Chang, W.; et al. Control of PTH secretion by the TRPC1 ion channel. JCI Insight 2020, 5, e132496. [Google Scholar] [CrossRef] [PubMed]
- Brown, E.M. Role of the calcium-sensing receptor in extracellular calcium homeostasis. Best Pract. Res. Clin. Endocrinol. Metab. 2013, 27, 333–343. [Google Scholar] [CrossRef] [PubMed]
- Minisola, S.; Arnold, A.; Belaya, Z.; Brandi, M.L.; Clarke, B.L.; Hannan, F.M.; Hofbauer, L.C.; Insogna, K.L.; Lacroix, A.; Liberman, U.; et al. Epidemiology, Pathophysiology, and Genetics of Primary Hyperparathyroidism. J. Bone Miner. Res. 2022, 37, 2315–2329. [Google Scholar] [CrossRef] [PubMed]
- Lu, M.; Branstrom, R.; Berglund, E.; Hoog, A.; Bjorklund, P.; Westin, G.; Larsson, C.; Farnebo, L.O.; Forsberg, L. Expression and association of TRPC subtypes with Orai1 and STIM1 in human parathyroid. J. Mol. Endocrinol. 2010, 44, 285–294. [Google Scholar] [CrossRef] [PubMed]
- Barclay, J.W.; Morgan, A.; Burgoyne, R.D. Calcium-dependent regulation of exocytosis. Cell Calcium 2005, 38, 343–353. [Google Scholar] [CrossRef] [PubMed]
- Tanaka, Y.; Funahashi, H.; Imai, T.; Seo, H.; Tominaga, Y.; Takagi, H. Oxyphil cell function in secondary parathyroid hyperplasia. Nephron 1996, 73, 580–586. [Google Scholar] [PubMed]
- Nilsson, I.L.; Yin, L.; Lundgren, E.; Rastad, J.; Ekbom, A. Clinical presentation of primary hyperparathyroidism in Europe--nationwide cohort analysis on mortality from nonmalignant causes. J. Bone Miner. Res. 2002, 17 (Suppl. 2), N68–N74. [Google Scholar] [PubMed]
- Walker, M.D.; Silverberg, S.J. Primary hyperparathyroidism. Nat. Rev. Endocrinol. 2018, 14, 115–125. [Google Scholar] [CrossRef] [PubMed]
- Jha, S.; Simonds, W.F. Molecular and Clinical Spectrum of Primary Hyperparathyroidism. Endocr. Rev. 2023, 44, 779–818. [Google Scholar] [CrossRef] [PubMed]
- Kaneko, Y.; Szallasi, A. Transient receptor potential (TRP) channels: A clinical perspective. Br. J. Pharmacol. 2014, 171, 2474–2507. [Google Scholar] [CrossRef] [PubMed]
- Abramowitz, J.; Birnbaumer, L. Physiology and pathophysiology of canonical transient receptor potential channels. FASEB J. 2009, 23, 297–328. [Google Scholar] [CrossRef] [PubMed]
- Englisch, C.N.; Paulsen, F.; Tschernig, T. TRPC Channels in the Physiology and Pathophysiology of the Renal Tubular System: What Do We Know? Int. J. Mol. Sci. 2022, 24, 181. [Google Scholar] [CrossRef] [PubMed]
- Diebolt, C.M.; Schaudien, D.; Junker, K.; Krasteva-Christ, G.; Tschernig, T.; Englisch, C.N. New insights in the renal distribution profile of TRPC3—Of mice and men. Ann. Anat. 2023, 252, 152192. [Google Scholar] [CrossRef] [PubMed]
- Moe, S.M. Calcium Homeostasis in Health and in Kidney Disease. Compr. Physiol. 2016, 6, 1781–1800. [Google Scholar] [PubMed]
- Kiselyov, K.; Patterson, R.L. The integrative function of TRPC channels. Front. Biosci. (Landmark Ed.) 2009, 14, 45–58. [Google Scholar] [CrossRef] [PubMed]
- Wang, H.; Cheng, X.; Tian, J.; Xiao, Y.; Tian, T.; Xu, F.; Hong, X.; Zhu, M.X. TRPC channels: Structure, function, regulation and recent advances in small molecular probes. Pharmacol. Ther. 2020, 209, 107497. [Google Scholar] [CrossRef] [PubMed]
- Eder, P.; Groschner, K. TRPC3/6/7: Topical aspects of biophysics and pathophysiology. Channels 2008, 2, 94–99. [Google Scholar] [CrossRef] [PubMed]
- Tang, Q.; Guo, W.; Zheng, L.; Wu, J.X.; Liu, M.; Zhou, X.; Zhang, X.; Chen, L. Structure of the receptor-activated human TRPC6 and TRPC3 ion channels. Cell Res. 2018, 28, 746–755. [Google Scholar] [CrossRef]
- Hendy, G.N.; Canaff, L.; Cole, D.E. The CASR gene: Alternative splicing and transcriptional control, and calcium-sensing receptor (CaSR) protein: Structure and ligand binding sites. Best Pract. Res. Clin. Endocrinol. Metab. 2013, 27, 285–301. [Google Scholar] [CrossRef] [PubMed]
- Xia, W.; Wang, Q.; Lin, S.; Wang, Y.; Zhang, J.; Wang, H.; Yang, X.; Hu, Y.; Liang, H.; Lu, Y.; et al. A high-salt diet promotes hypertrophic scarring through TRPC3-mediated mitochondrial Ca(2+) homeostasis dysfunction. Heliyon 2023, 9, e18629. [Google Scholar] [CrossRef]
- Feng, S.; Li, H.; Tai, Y.; Huang, J.; Su, Y.; Abramowitz, J.; Zhu, M.X.; Birnbaumer, L.; Wang, Y. Canonical transient receptor potential 3 channels regulate mitochondrial calcium uptake. Proc. Natl. Acad. Sci. USA 2013, 110, 11011–11016. [Google Scholar] [CrossRef] [PubMed]
- Harper, M.T.; Londono, J.E.; Quick, K.; Londono, J.C.; Flockerzi, V.; Philipp, S.E.; Birnbaumer, L.; Freichel, M.; Poole, A.W. Transient receptor potential channels function as a coincidence signal detector mediating phosphatidylserine exposure. Sci. Signal 2013, 6, ra50. [Google Scholar] [CrossRef] [PubMed]
- Kistler, A.D.; Singh, G.; Altintas, M.M.; Yu, H.; Fernandez, I.C.; Gu, C.; Wilson, C.; Srivastava, S.K.; Dietrich, A.; Walz, K.; et al. Transient receptor potential channel 6 (TRPC6) protects podocytes during complement-mediated glomerular disease. J. Biol. Chem. 2013, 288, 36598–36609. [Google Scholar] [CrossRef]
- Nakhoul, N.L.; Tu, C.L.; Brown, K.L.; Islam, M.T.; Hodges, A.G.; Abdulnour-Nakhoul, S.M. Calcium-sensing receptor deletion in the mouse esophagus alters barrier function. Am. J. Physiol. Gastrointest. Liver Physiol. 2020, 318, G144–G161. [Google Scholar] [CrossRef] [PubMed]
- Ram, S.; Vizcarra, P.; Whalen, P.; Deng, S.; Painter, C.L.; Jackson-Fisher, A.; Pirie-Shepherd, S.; Xia, X.; Powell, E.L. Pixelwise H-score: A novel digital image analysis-based metric to quantify membrane biomarker expression from immunohistochemistry images. PLoS ONE 2021, 16, e0245638. [Google Scholar] [CrossRef] [PubMed]
- Magaki, S.; Hojat, S.A.; Wei, B.; So, A.; Yong, W.H. An Introduction to the Performance of Immunohistochemistry. Methods Mol. Biol. 2019, 1897, 289–298. [Google Scholar] [PubMed]
- Pillai-Kastoori, L.; Schutz-Geschwender, A.R.; Harford, J.A. A systematic approach to quantitative Western blot analysis. Anal. Biochem. 2020, 593, 113608. [Google Scholar] [CrossRef] [PubMed]
- Taylor, S.C.; Posch, A. The design of a quantitative western blot experiment. Biomed. Res. Int. 2014, 2014, 361590. [Google Scholar] [CrossRef] [PubMed]
- Lang, H.B.; Xie, R.X.; Huang, M.L.; Fang, L.Y.; Tang, Y.B.; Zhang, F. The Effect and Mechanism of TRPC1, 3, and 6 on the Proliferation, Migration, and Lumen Formation of Retinal Vascular Endothelial Cells Induced by High Glucose. Ophthalmic Res. 2020, 63, 284–294. [Google Scholar] [CrossRef]
- Du, Y.; Fu, J.; Yao, L.; Qiao, L.; Liu, N.; Xing, Y.; Xue, X. Altered expression of PPAR-gamma and TRPC in neonatal rats with persistent pulmonary hypertension. Mol. Med. Rep. 2017, 16, 1117–1124. [Google Scholar] [CrossRef] [PubMed]
- Uhlen, M.; Fagerberg, L.; Hallstrom, B.M.; Lindskog, C.; Oksvold, P.; Mardinoglu, A.; Sivertsson, A.; Kampf, C.; Sjostedt, E.; Asplund, A.; et al. Proteomics. Tissue-based map of the human proteome. Science 2015, 347, 1260419. [Google Scholar] [CrossRef] [PubMed]
- Available online: https://www.proteinatlas.org/ENSG00000138741-TRPC3/tissue/parathyroid+gland (accessed on 1 March 2024).
- Agarwal, S.; Kardam, S.; Chatterjee, P.; Kumar, C.; Boruah, M.; Sharma, M.C.; Tabin, M.; Ramakrishnan, L. CaSR expression in normal parathyroid and PHPT: New insights into pathogenesis from an autopsy-based study. J. Endocrinol. Investig. 2022, 45, 337–346. [Google Scholar] [CrossRef]
- Sengul Aycicek, G.; Aydogan, B.I.; Sahin, M.; Cansiz Ersoz, C.; Sak, S.D.; Baskal, N. Clinical Impact of p27(Kip1) and CaSR Expression on Primary Hyperparathyroidism. Endocr. Pathol. 2018, 29, 250–258. [Google Scholar] [CrossRef] [PubMed]
- Worth, A.L.; Ayrapetyan, M.; Maygarden, S.J.; Li, Z.; Wu, Z.; Agala, C.B.; Kim, L.T. Expression of the Calcium-Sensing Receptor on Normal and Abnormal Parathyroid and Thyroid Tissue. J. Surg. Res. 2024, 293, 618–624. [Google Scholar] [CrossRef] [PubMed]
- Kawata, T.; Imanishi, Y.; Kobayashi, K.; Kenko, T.; Wada, M.; Ishimura, E.; Miki, T.; Nagano, N.; Inaba, M.; Arnold, A.; et al. Relationship between parathyroid calcium-sensing receptor expression and potency of the calcimimetic, cinacalcet, in suppressing parathyroid hormone secretion in an in vivo murine model of primary hyperparathyroidism. Eur. J. Endocrinol. 2005, 153, 587–594. [Google Scholar] [CrossRef] [PubMed]


| Tissue | Age | Sex | Surgery Indication/Pathology |
|---|---|---|---|
| Healthy | 23 | Female | Hashimoto Thyroiditis (Lymphofollicular Hyperplasia) |
| Healthy | 68 | Female | Struma Nodosa (Follicular Lymphocytic Thyroiditis) |
| Healthy | 37 | Female | Unspecified Thyroid Pathology |
| Healthy | 65 | Male | Struma Multinodosa |
| pHPT | 48 | Female | Nodular Hyperplasia of Parathyroid Gland |
| pHPT | 47 | Female | Mild diffuse Hyperplasia of Parathyroid Gland |
| pHPT | 63 | Female | Parathyroid Adenoma |
| pHPT | 53 | Female | Nodular Hyperplasia of Parathyroid Gland |
Disclaimer/Publisher’s Note: The statements, opinions and data contained in all publications are solely those of the individual author(s) and contributor(s) and not of MDPI and/or the editor(s). MDPI and/or the editor(s) disclaim responsibility for any injury to people or property resulting from any ideas, methods, instructions or products referred to in the content. |
© 2024 by the authors. Licensee MDPI, Basel, Switzerland. This article is an open access article distributed under the terms and conditions of the Creative Commons Attribution (CC BY) license (https://creativecommons.org/licenses/by/4.0/).
Share and Cite
Kirstein, E.; Schaudien, D.; Wagner, M.; Diebolt, C.M.; Bozzato, A.; Tschernig, T.; Englisch, C.N. TRPC3 Is Downregulated in Primary Hyperparathyroidism. Int. J. Mol. Sci. 2024, 25, 4392. https://doi.org/10.3390/ijms25084392
Kirstein E, Schaudien D, Wagner M, Diebolt CM, Bozzato A, Tschernig T, Englisch CN. TRPC3 Is Downregulated in Primary Hyperparathyroidism. International Journal of Molecular Sciences. 2024; 25(8):4392. https://doi.org/10.3390/ijms25084392
Chicago/Turabian StyleKirstein, Emilie, Dirk Schaudien, Mathias Wagner, Coline M. Diebolt, Alessandro Bozzato, Thomas Tschernig, and Colya N. Englisch. 2024. "TRPC3 Is Downregulated in Primary Hyperparathyroidism" International Journal of Molecular Sciences 25, no. 8: 4392. https://doi.org/10.3390/ijms25084392