


Development of an Innovative Biosensor Based on Graphene/PEDOT/Tyrosinase for the Detection of Phenolic Compounds in River Waters


Abstract
:1. Introduction
2. Results and Discussion
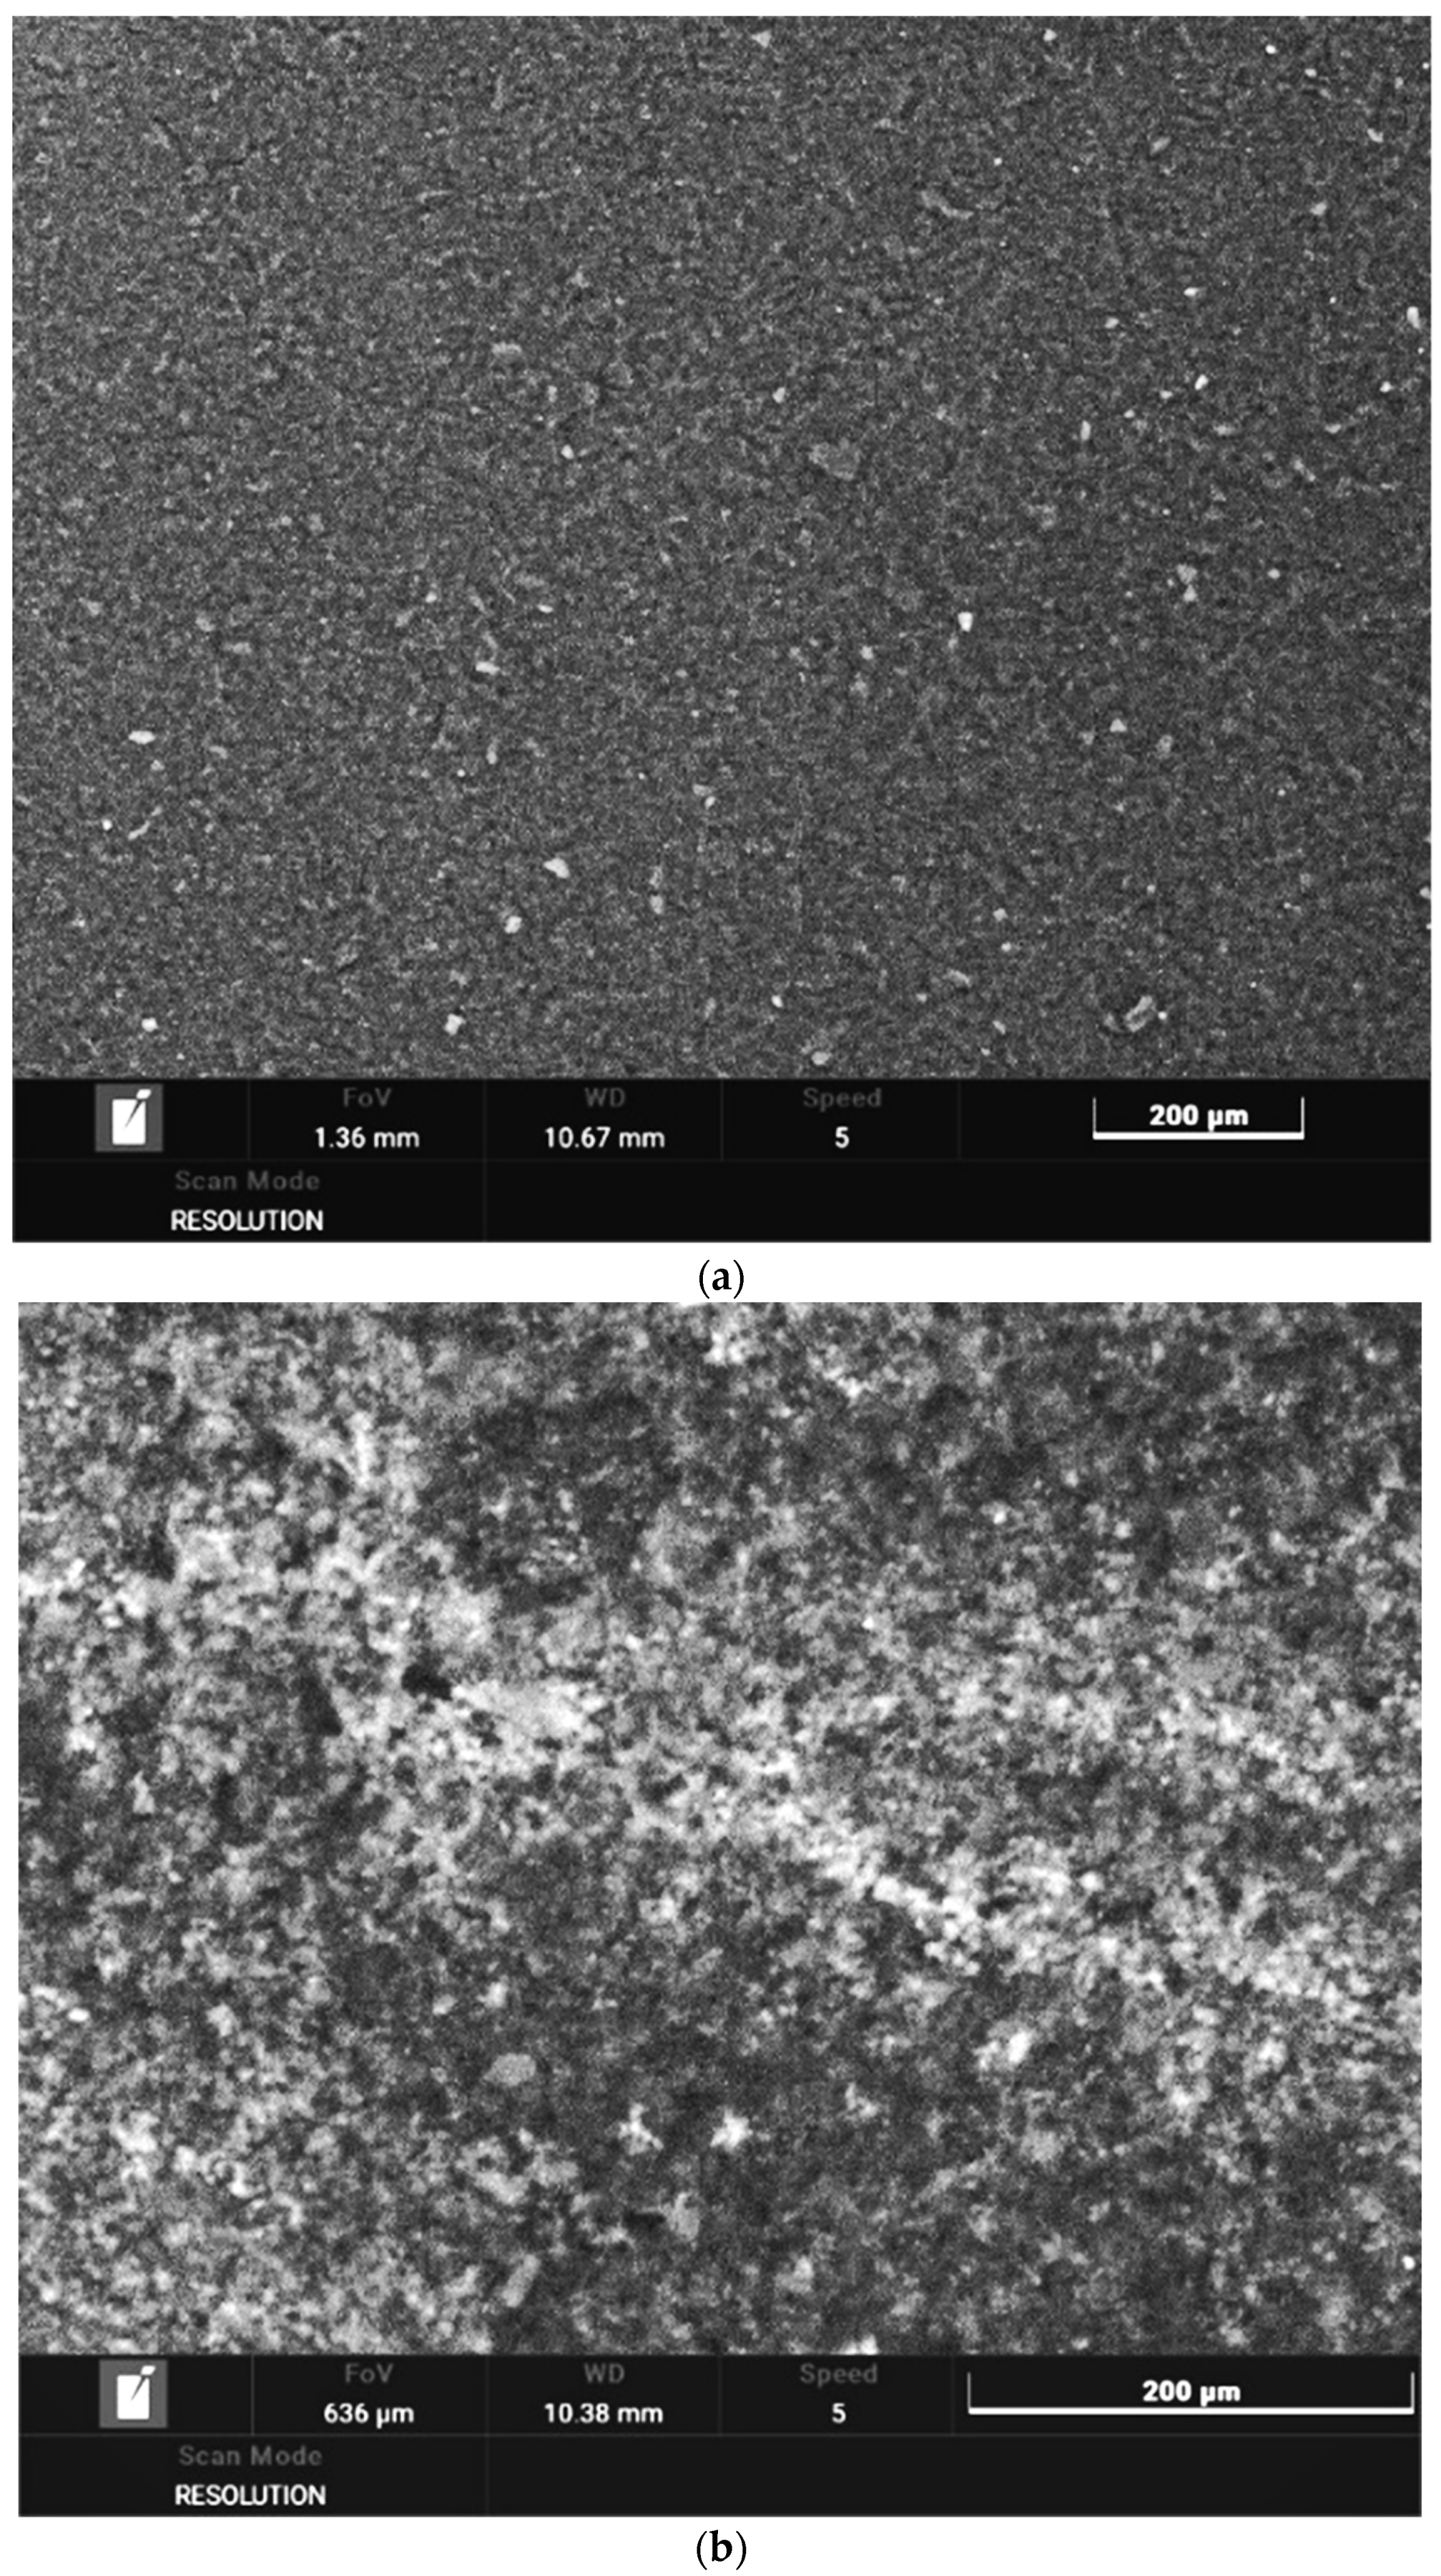
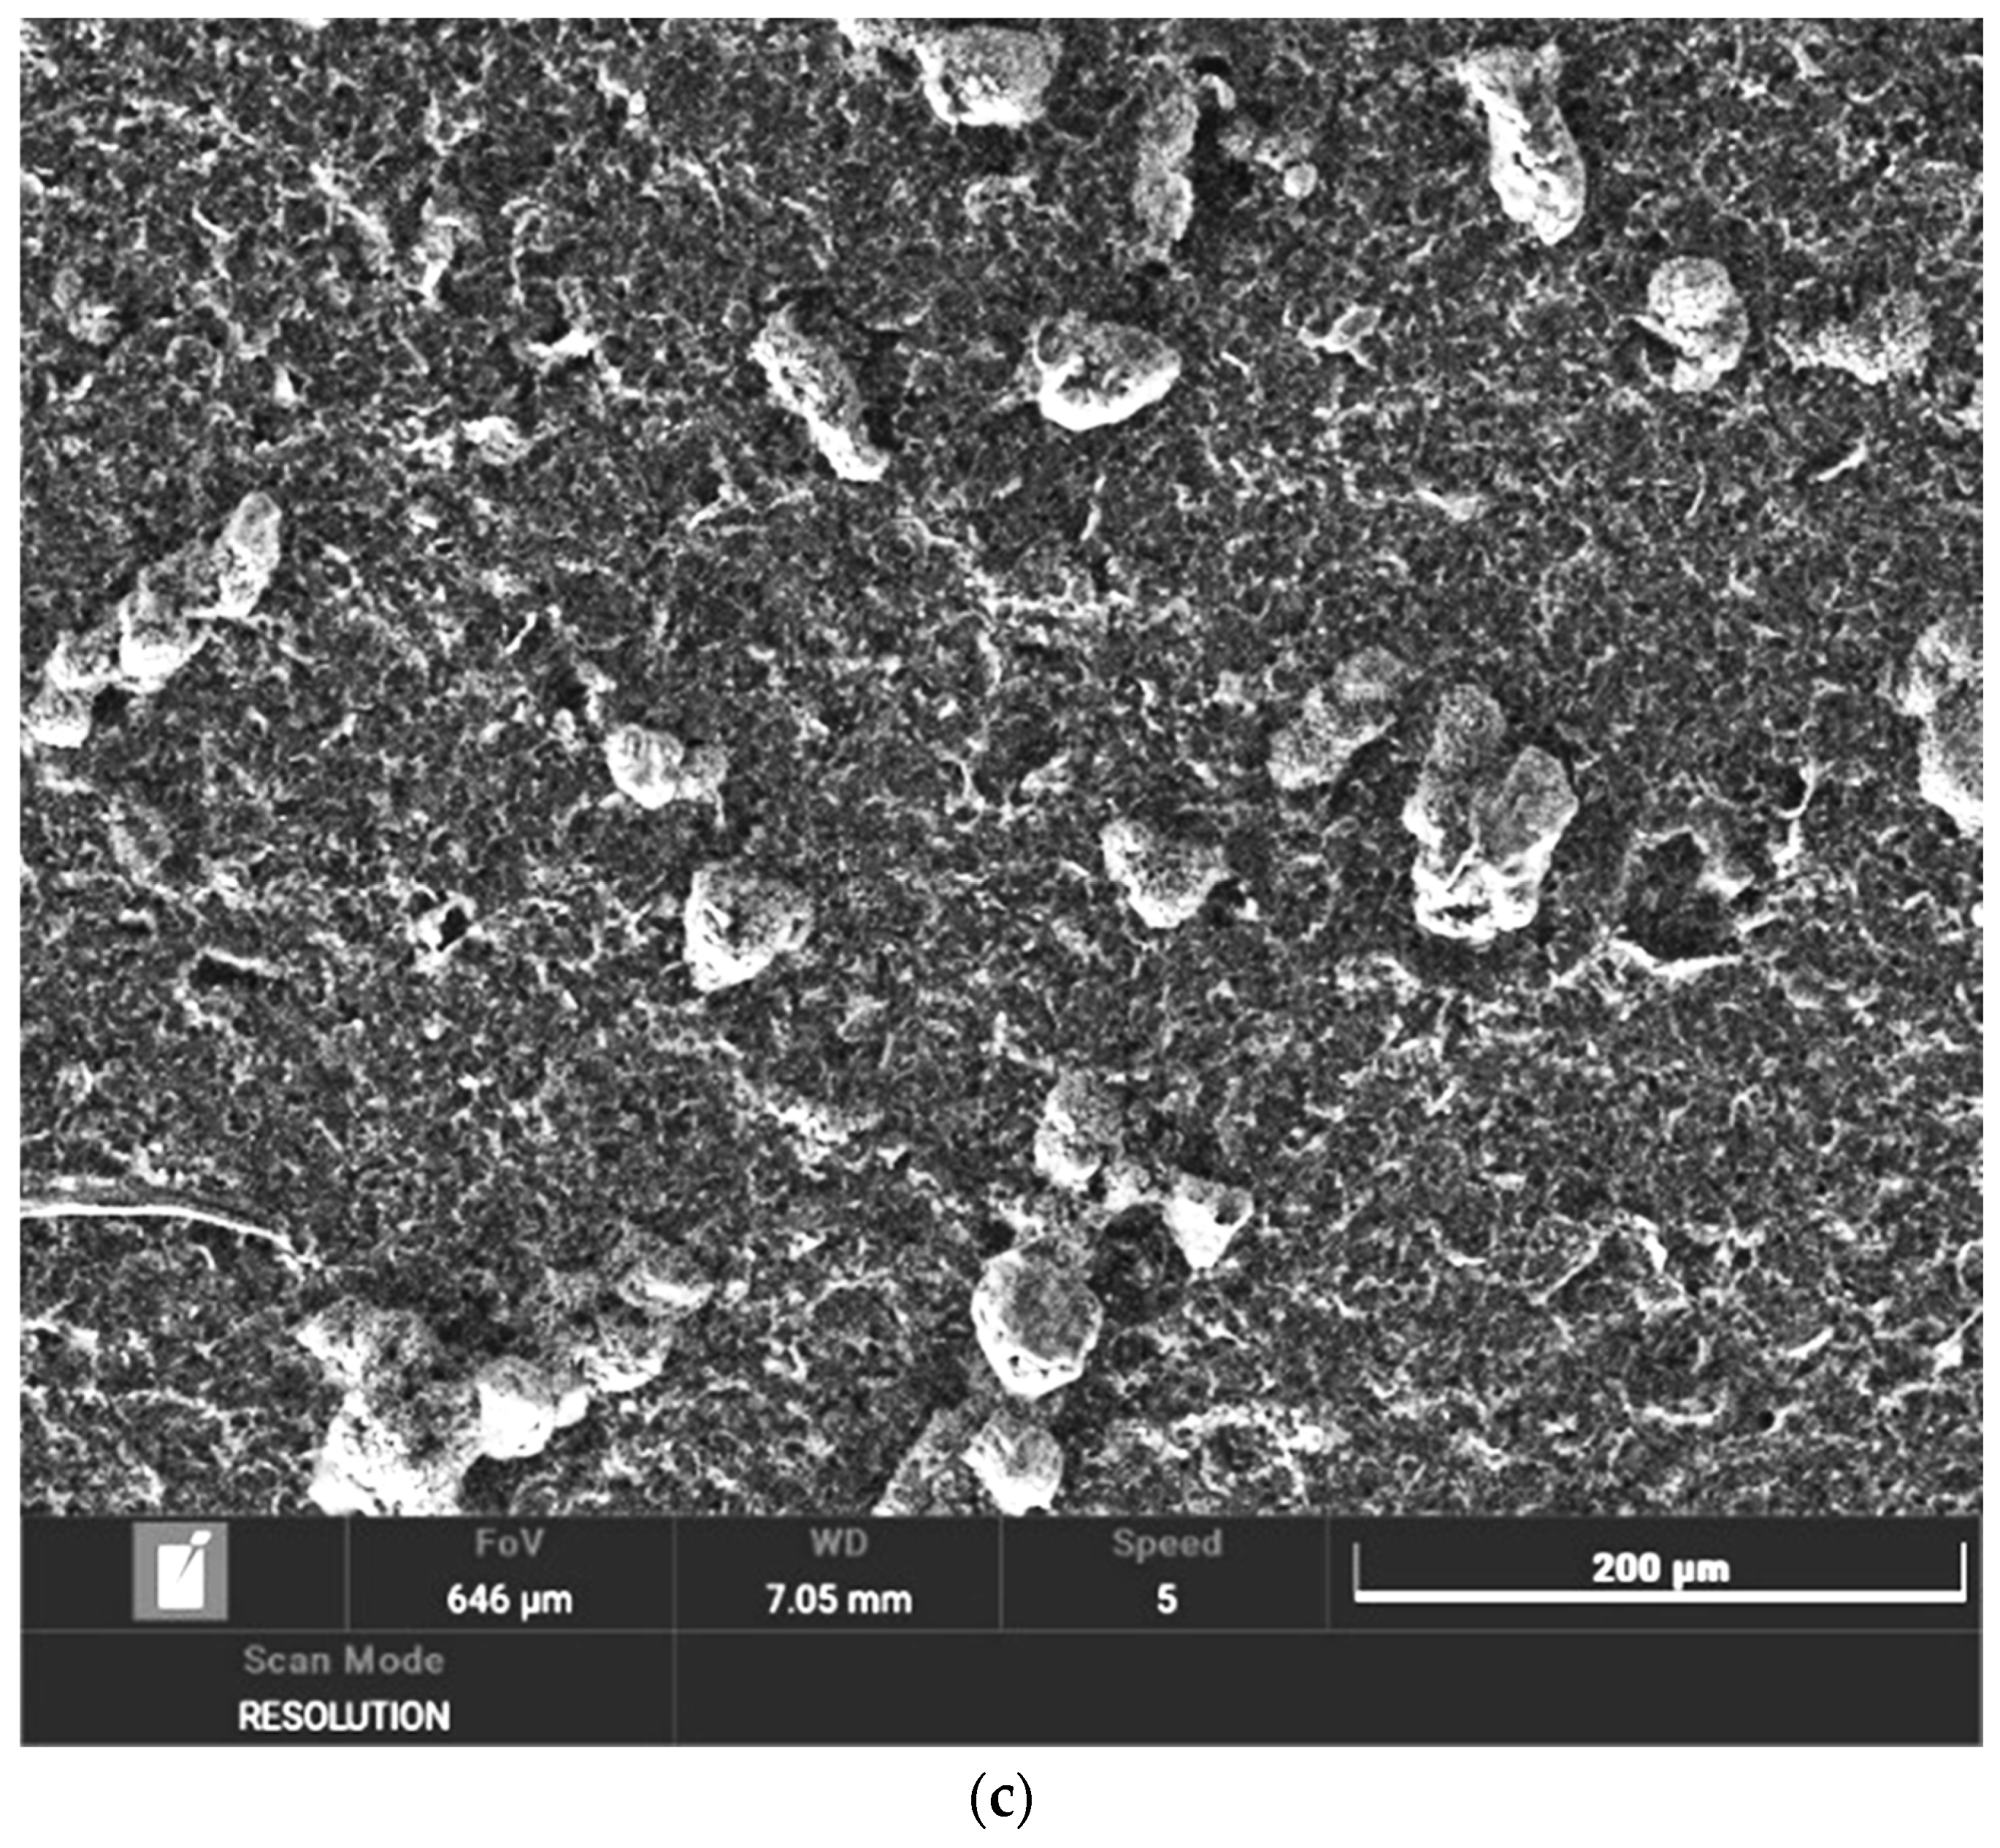
2.1. Surface Morphological Characterizations of SPE/GPH/PEDOT/Ty
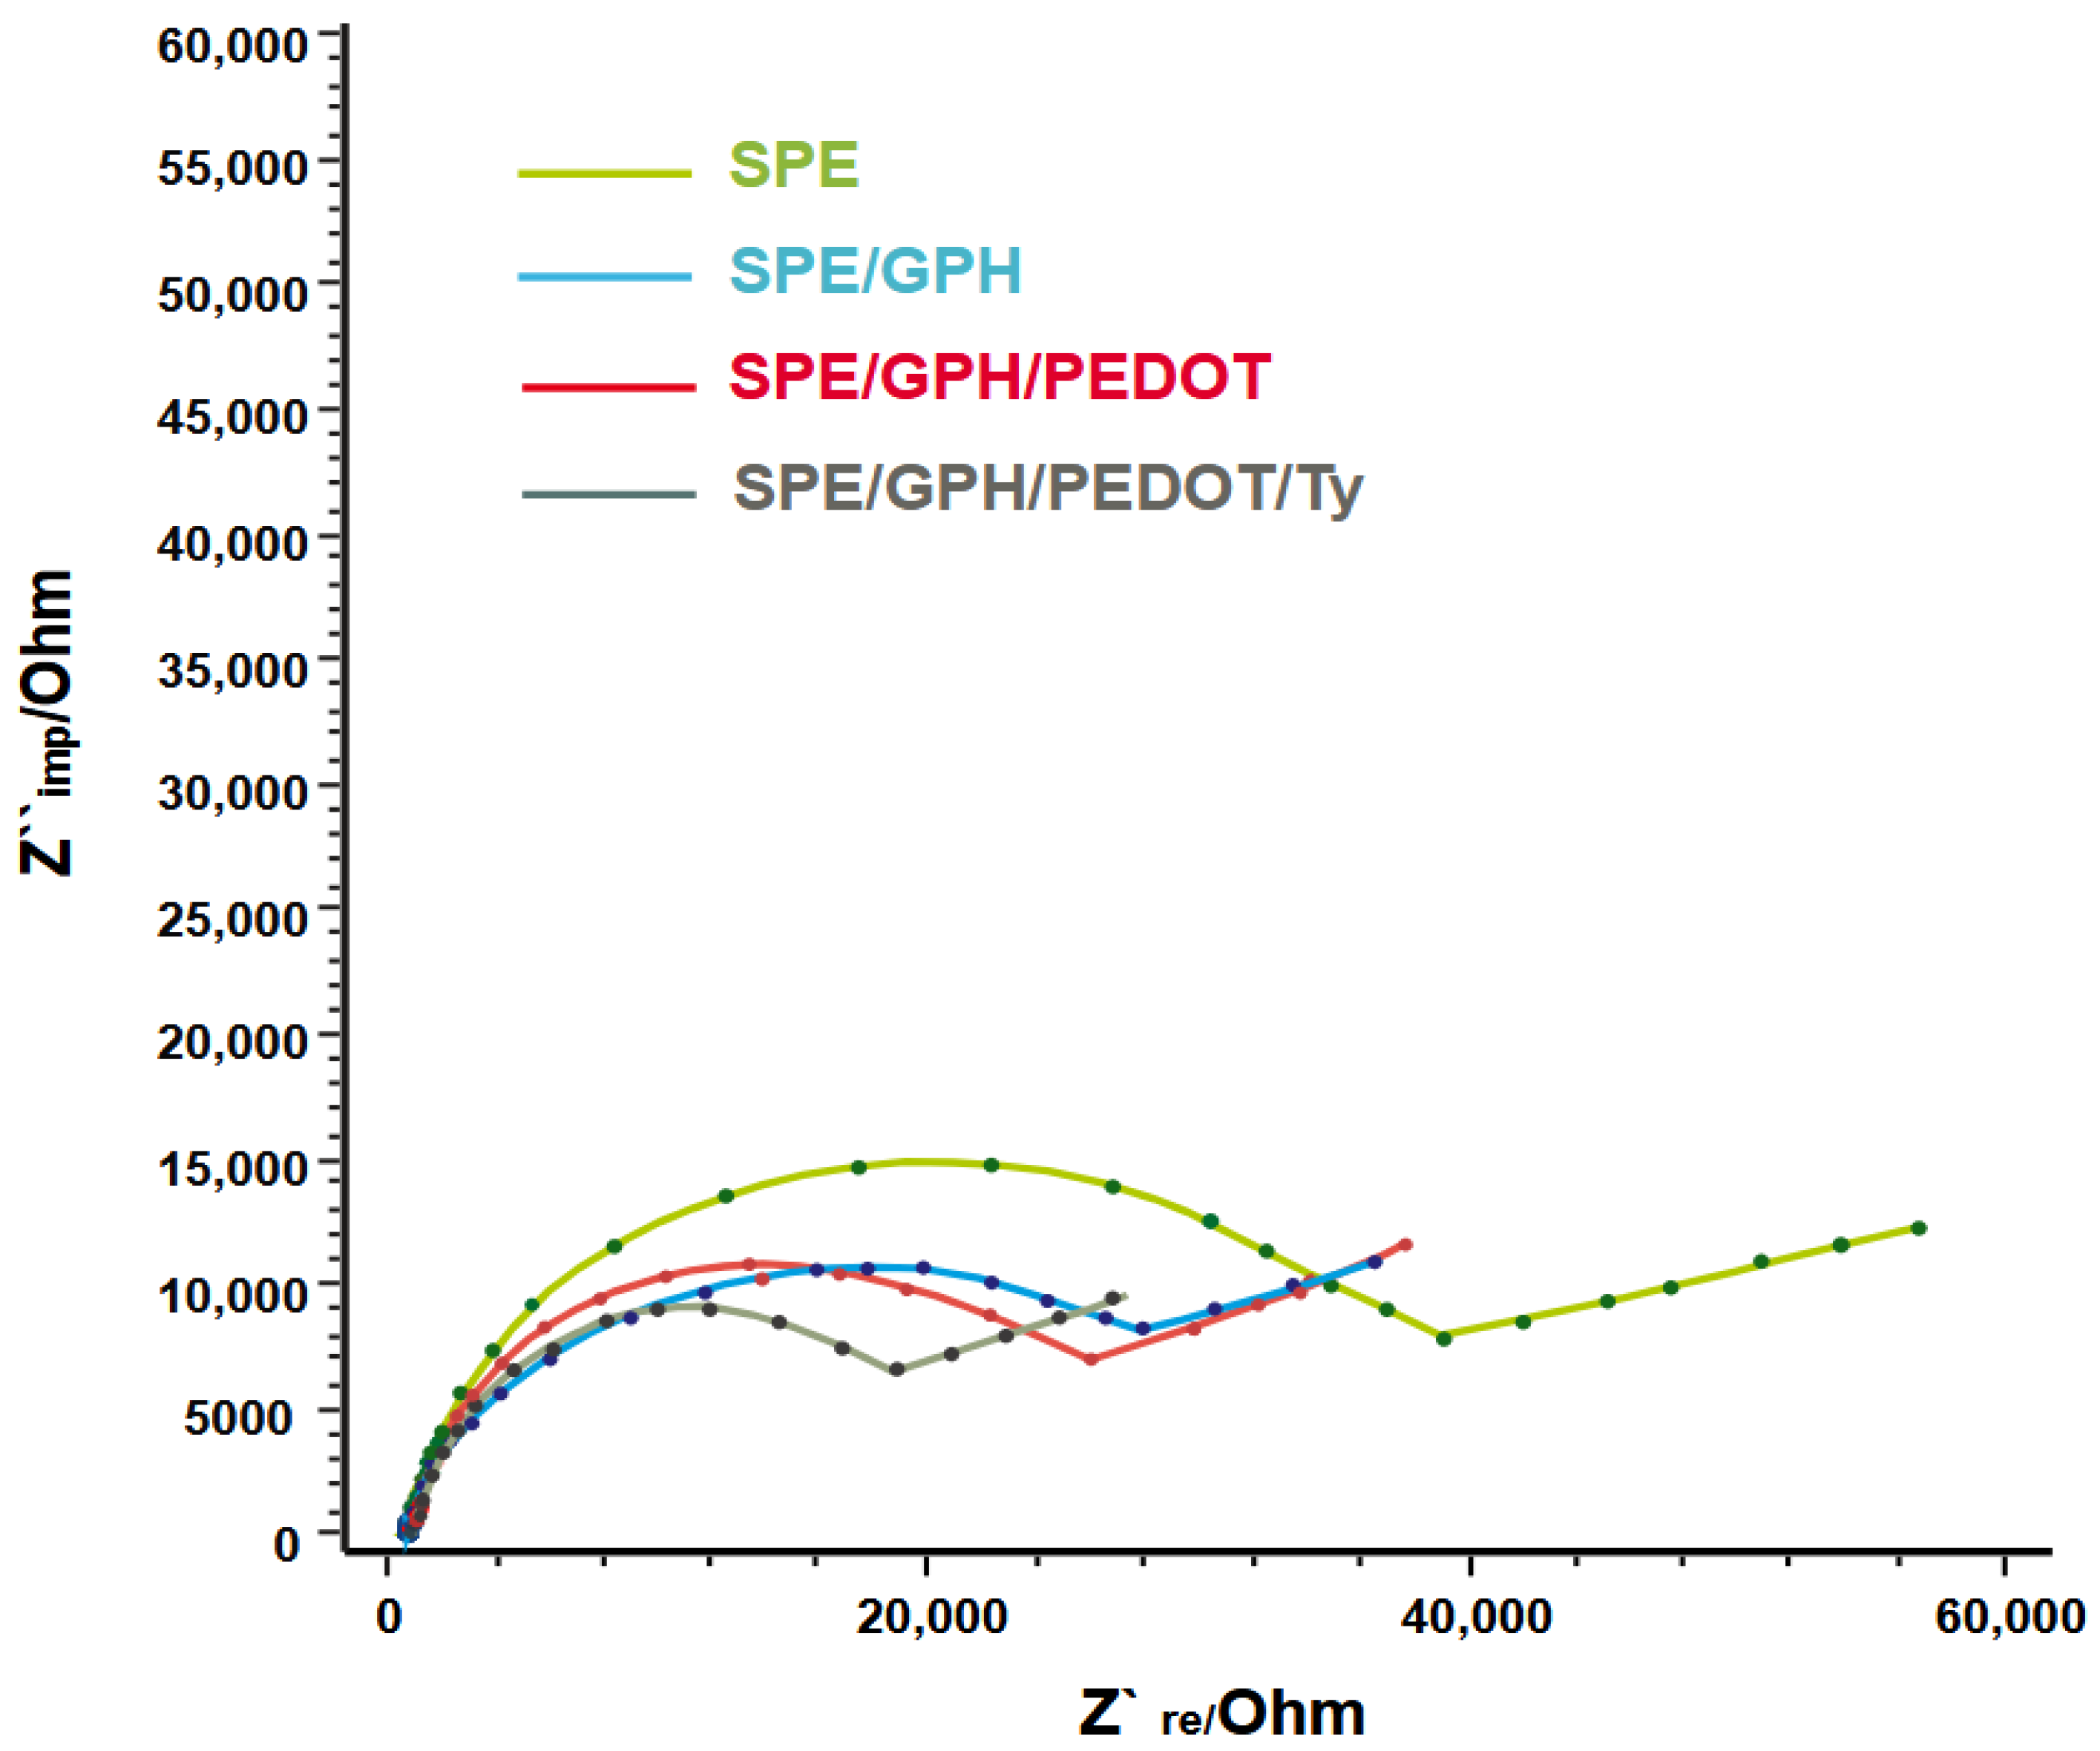
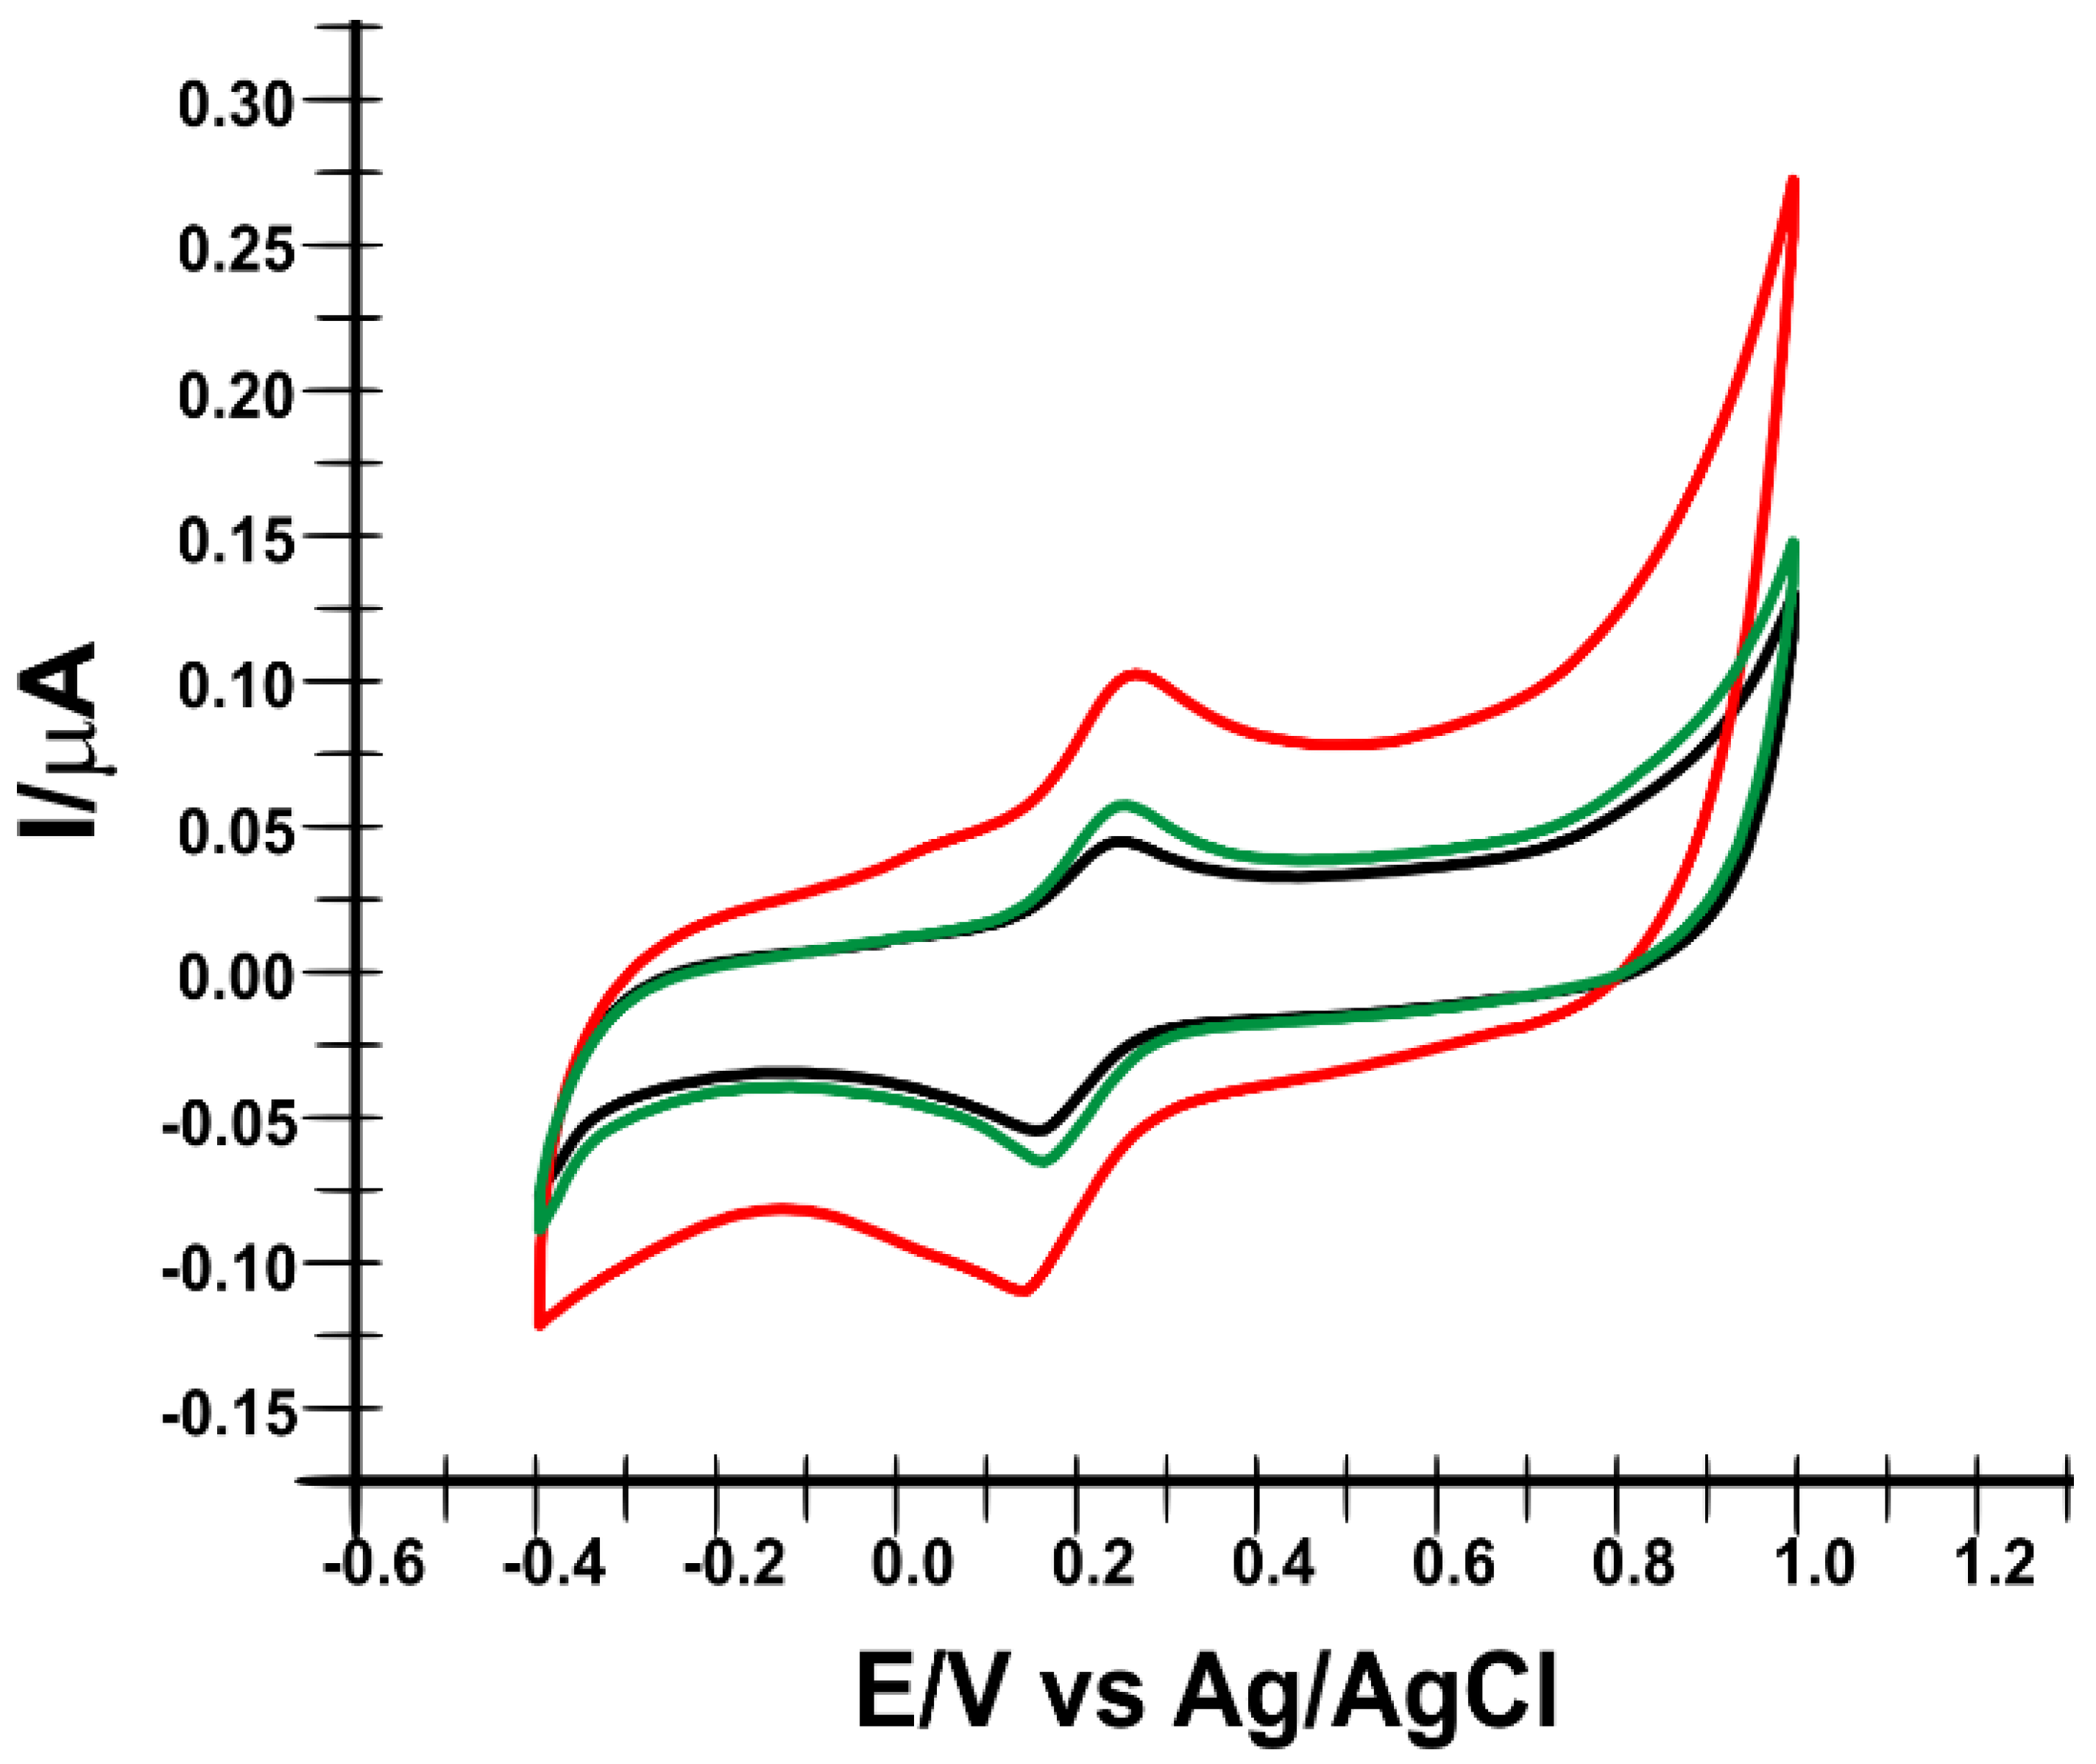
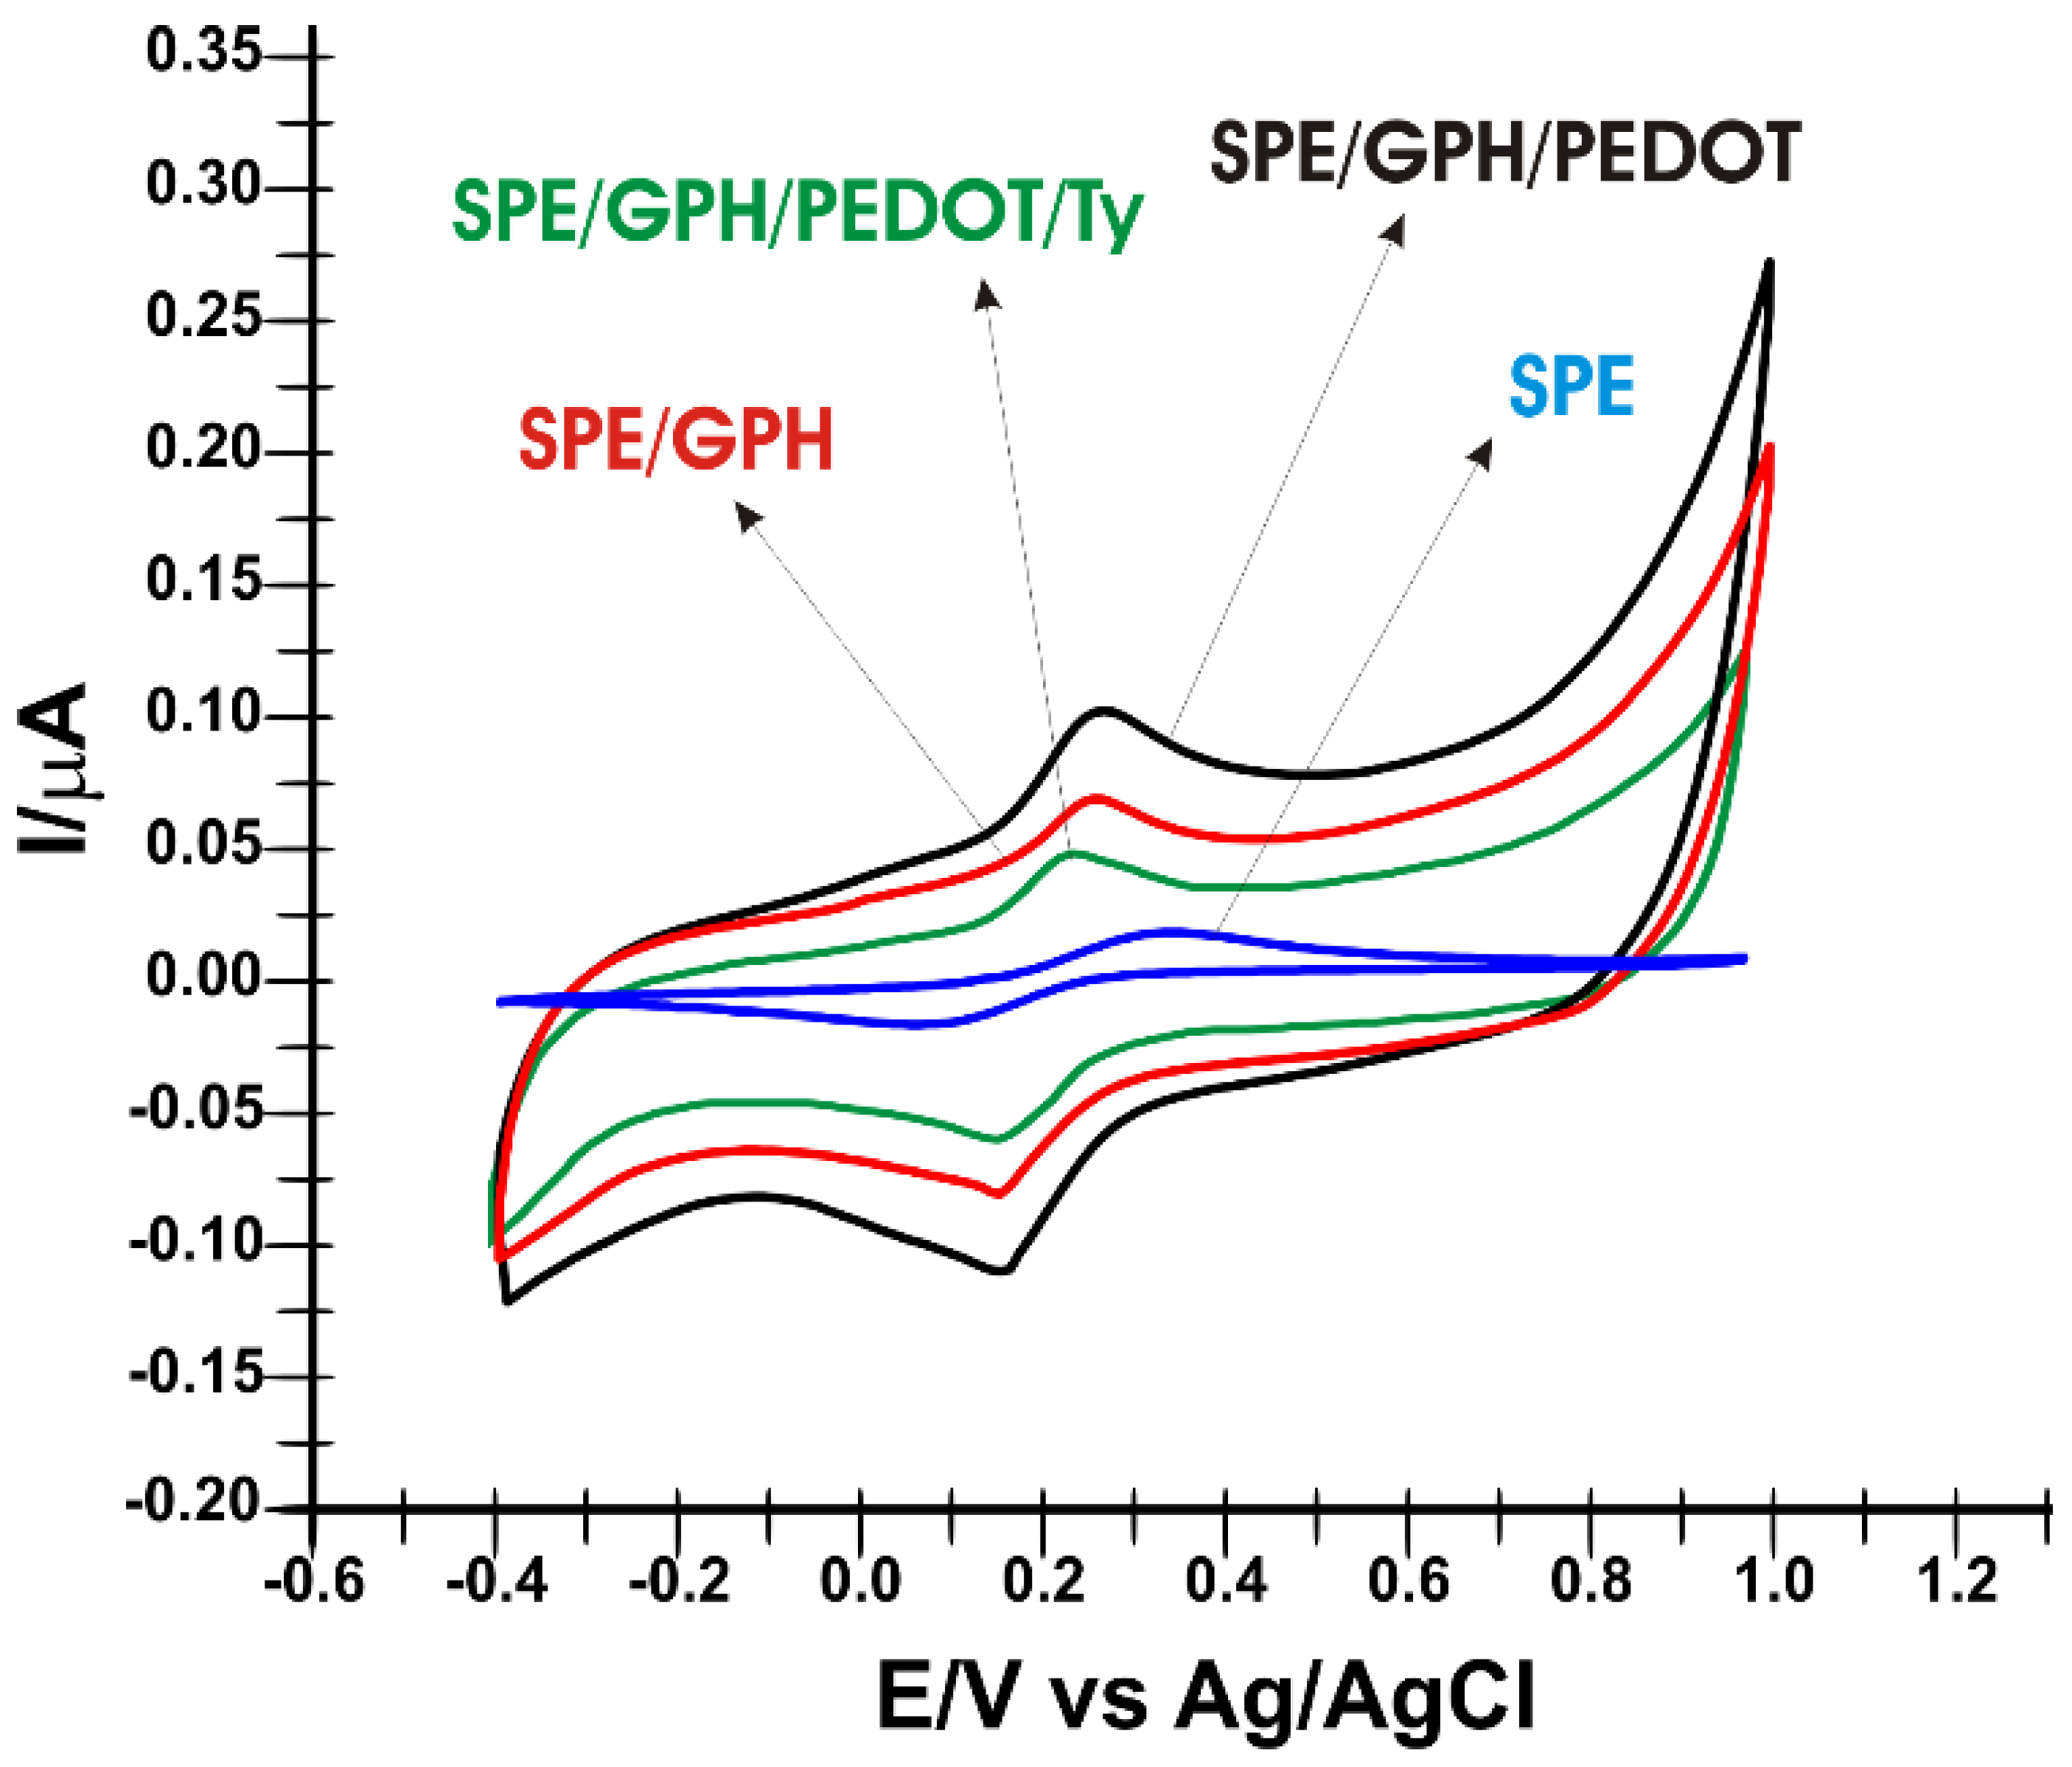
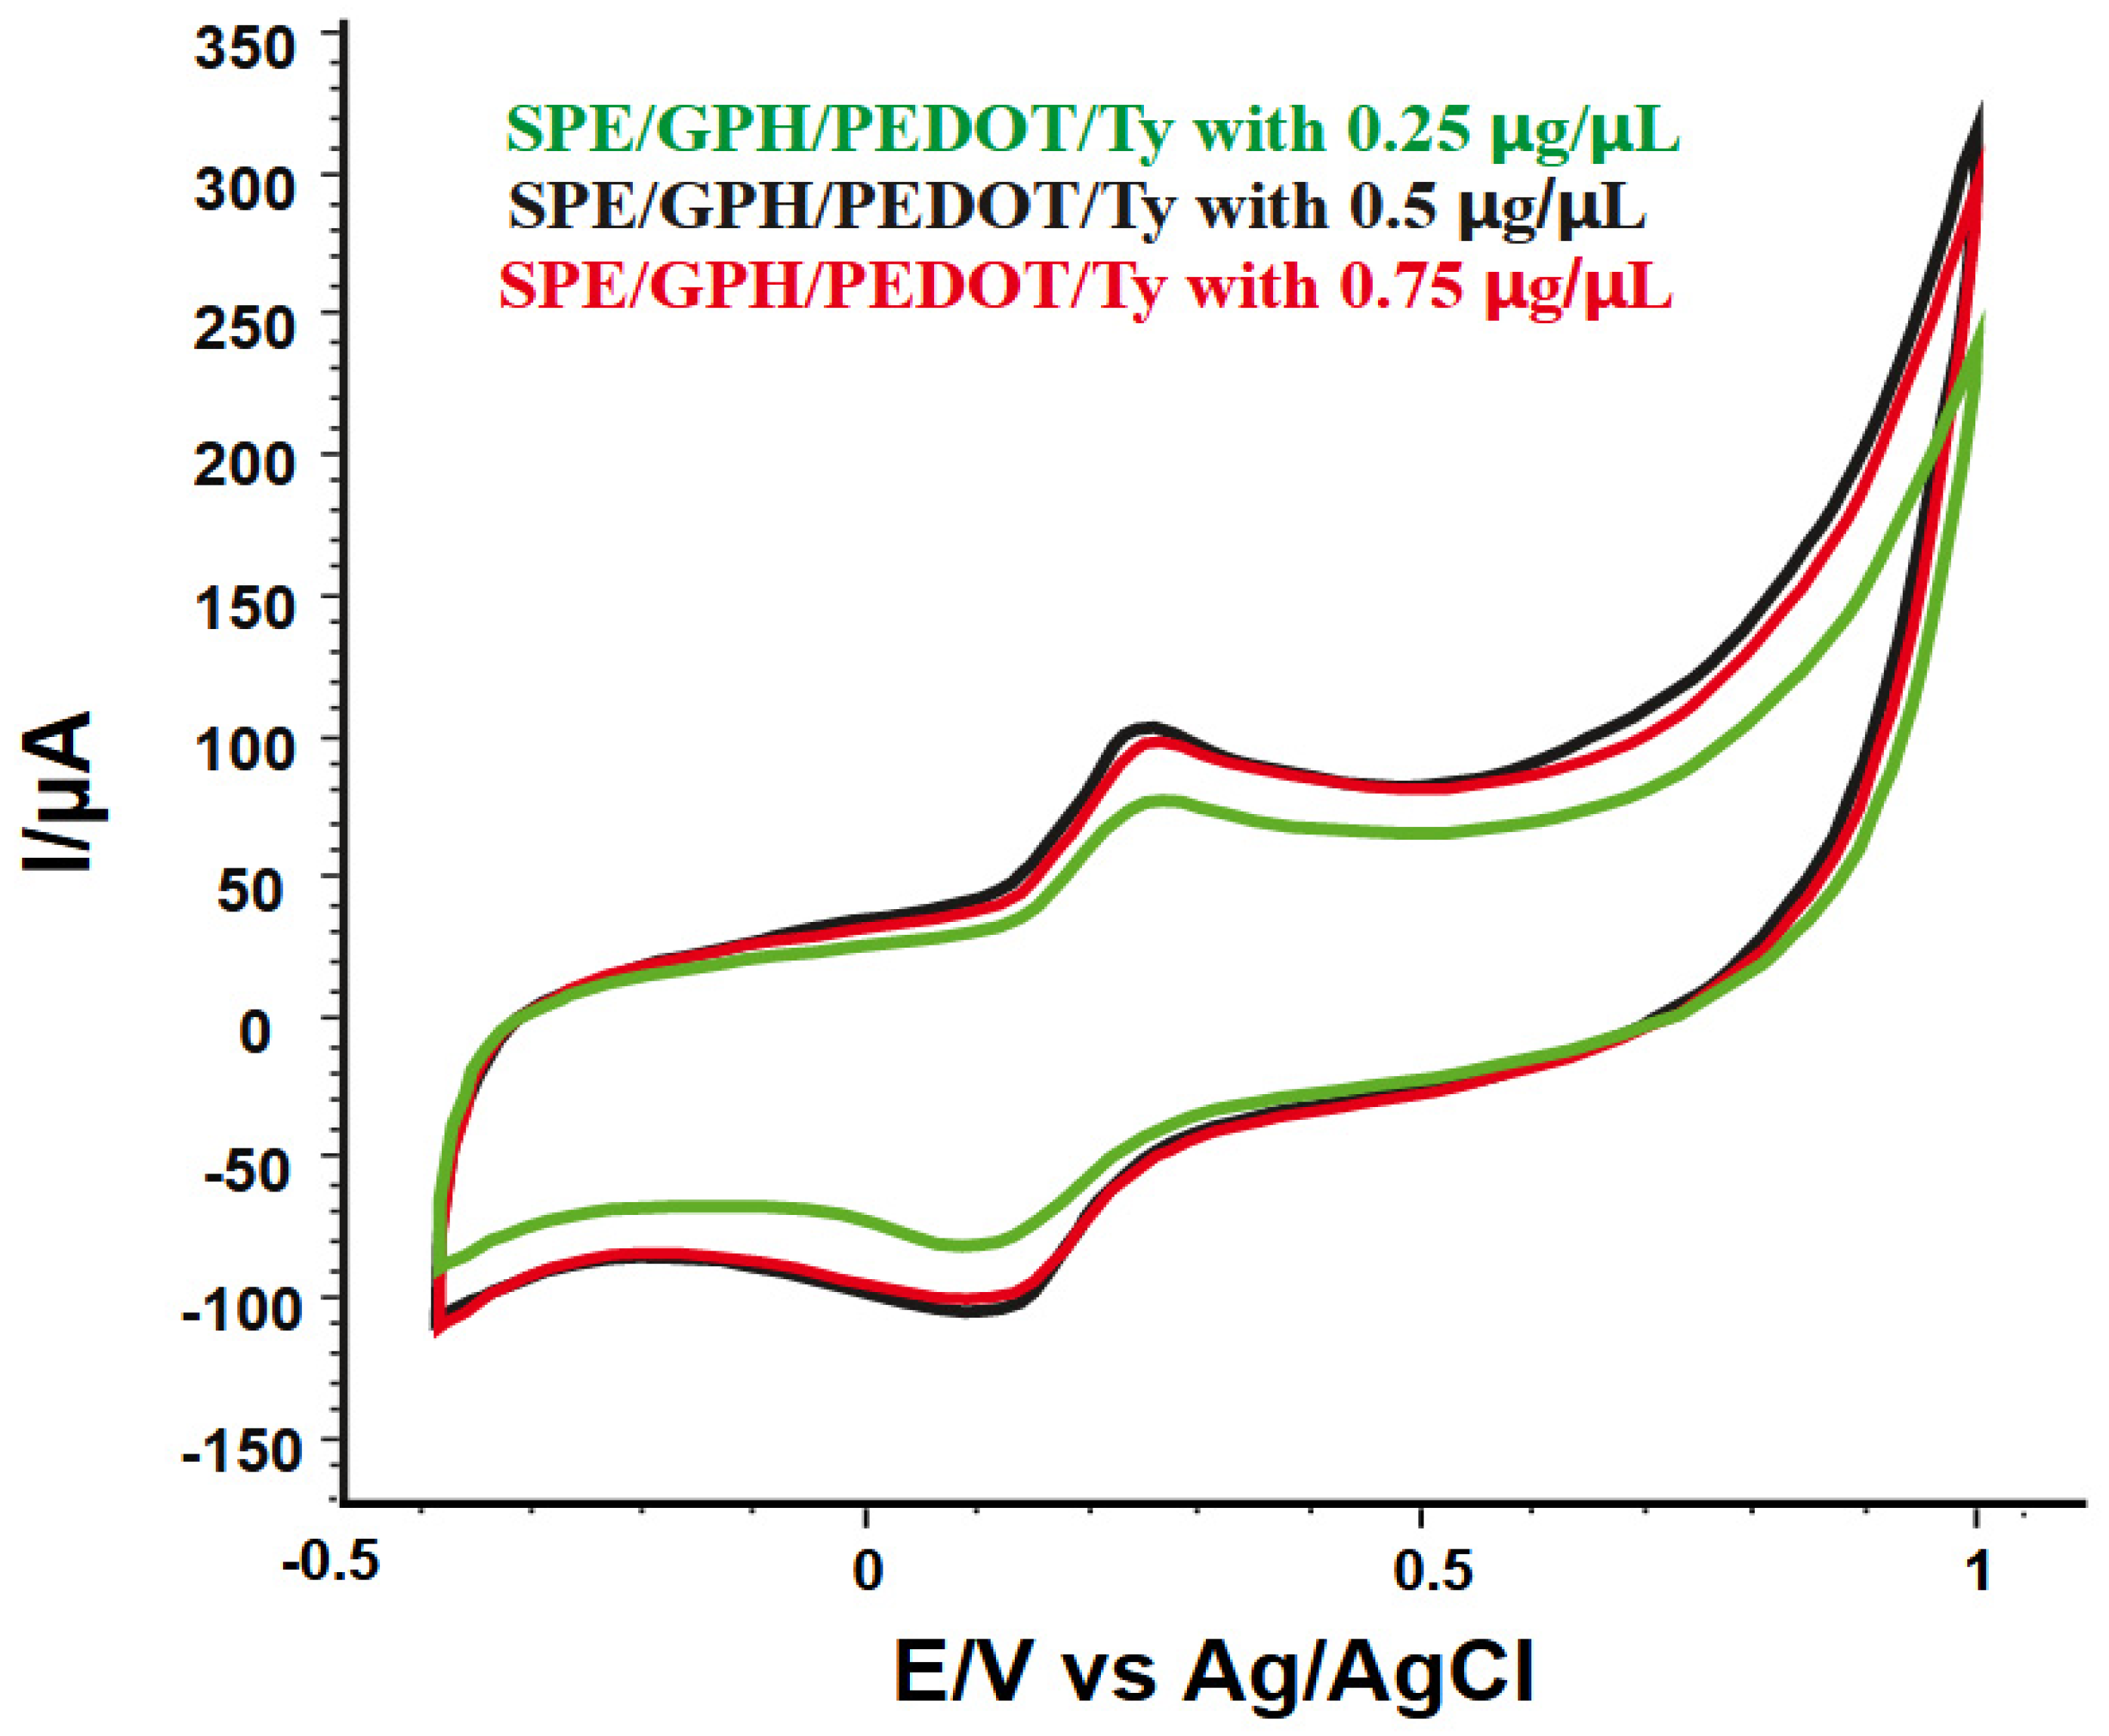
2.2. Electrochemical Characterization of the SPE/GPH/PEDOT/Ty
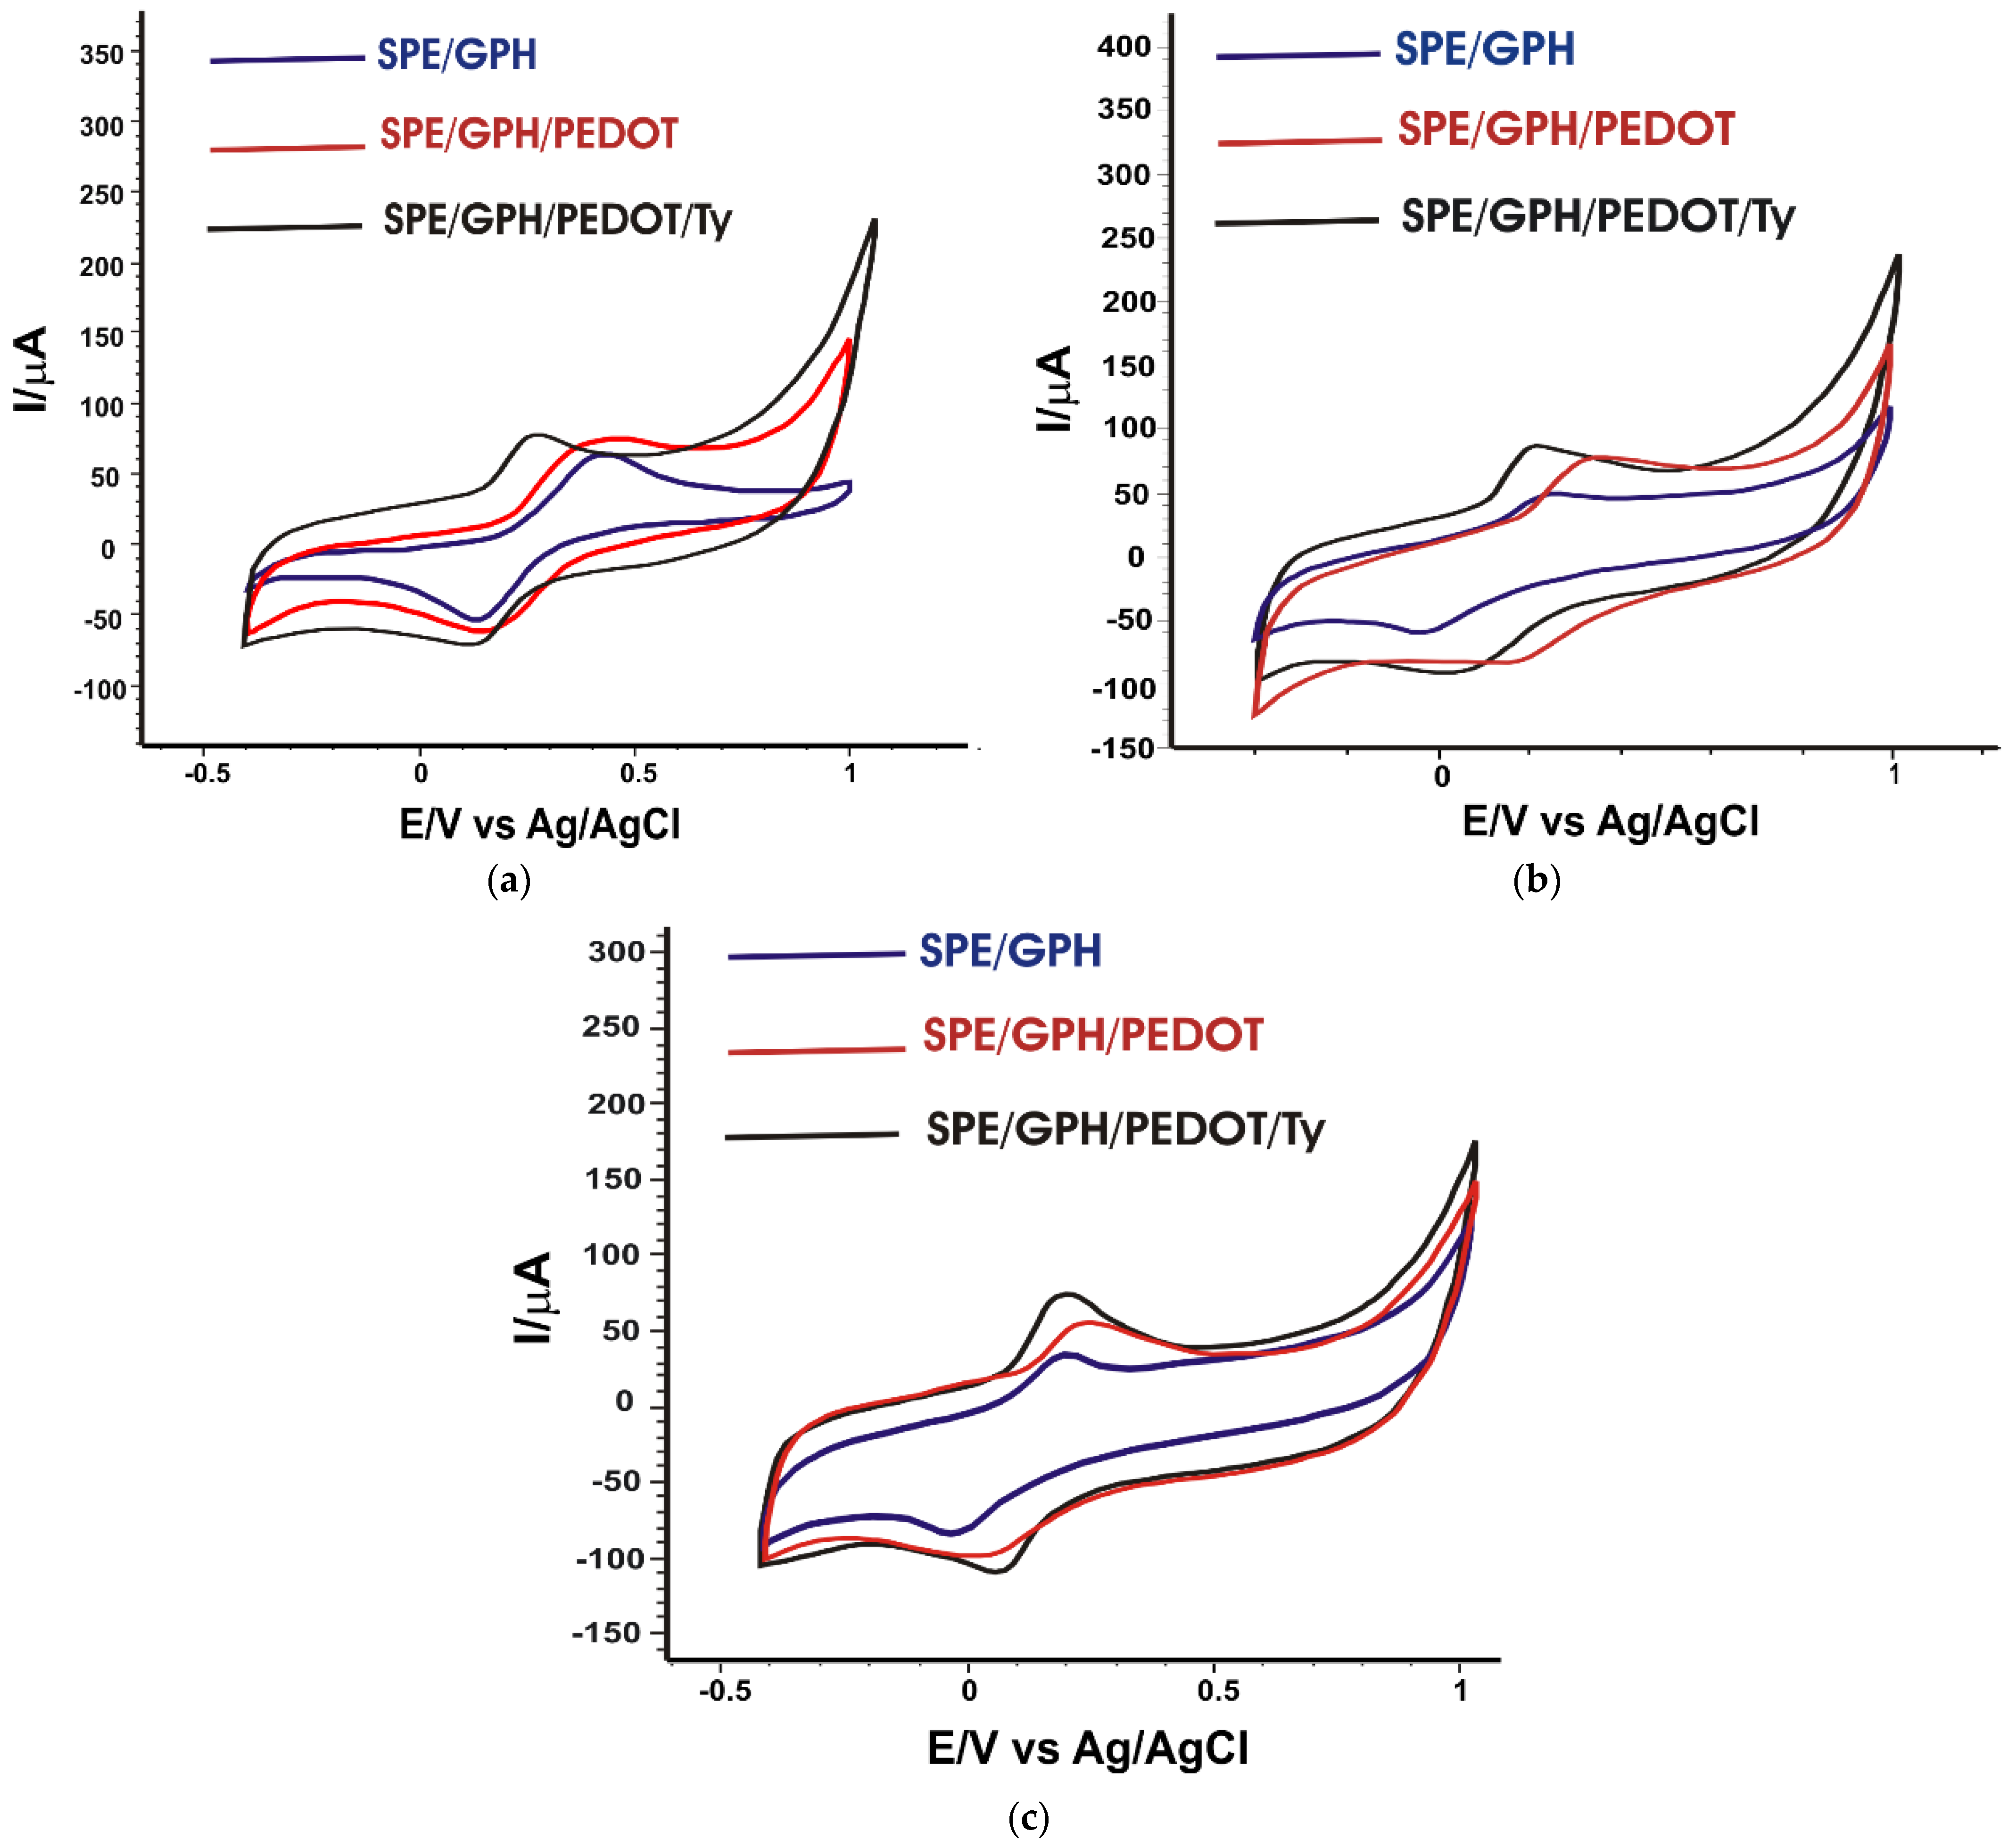
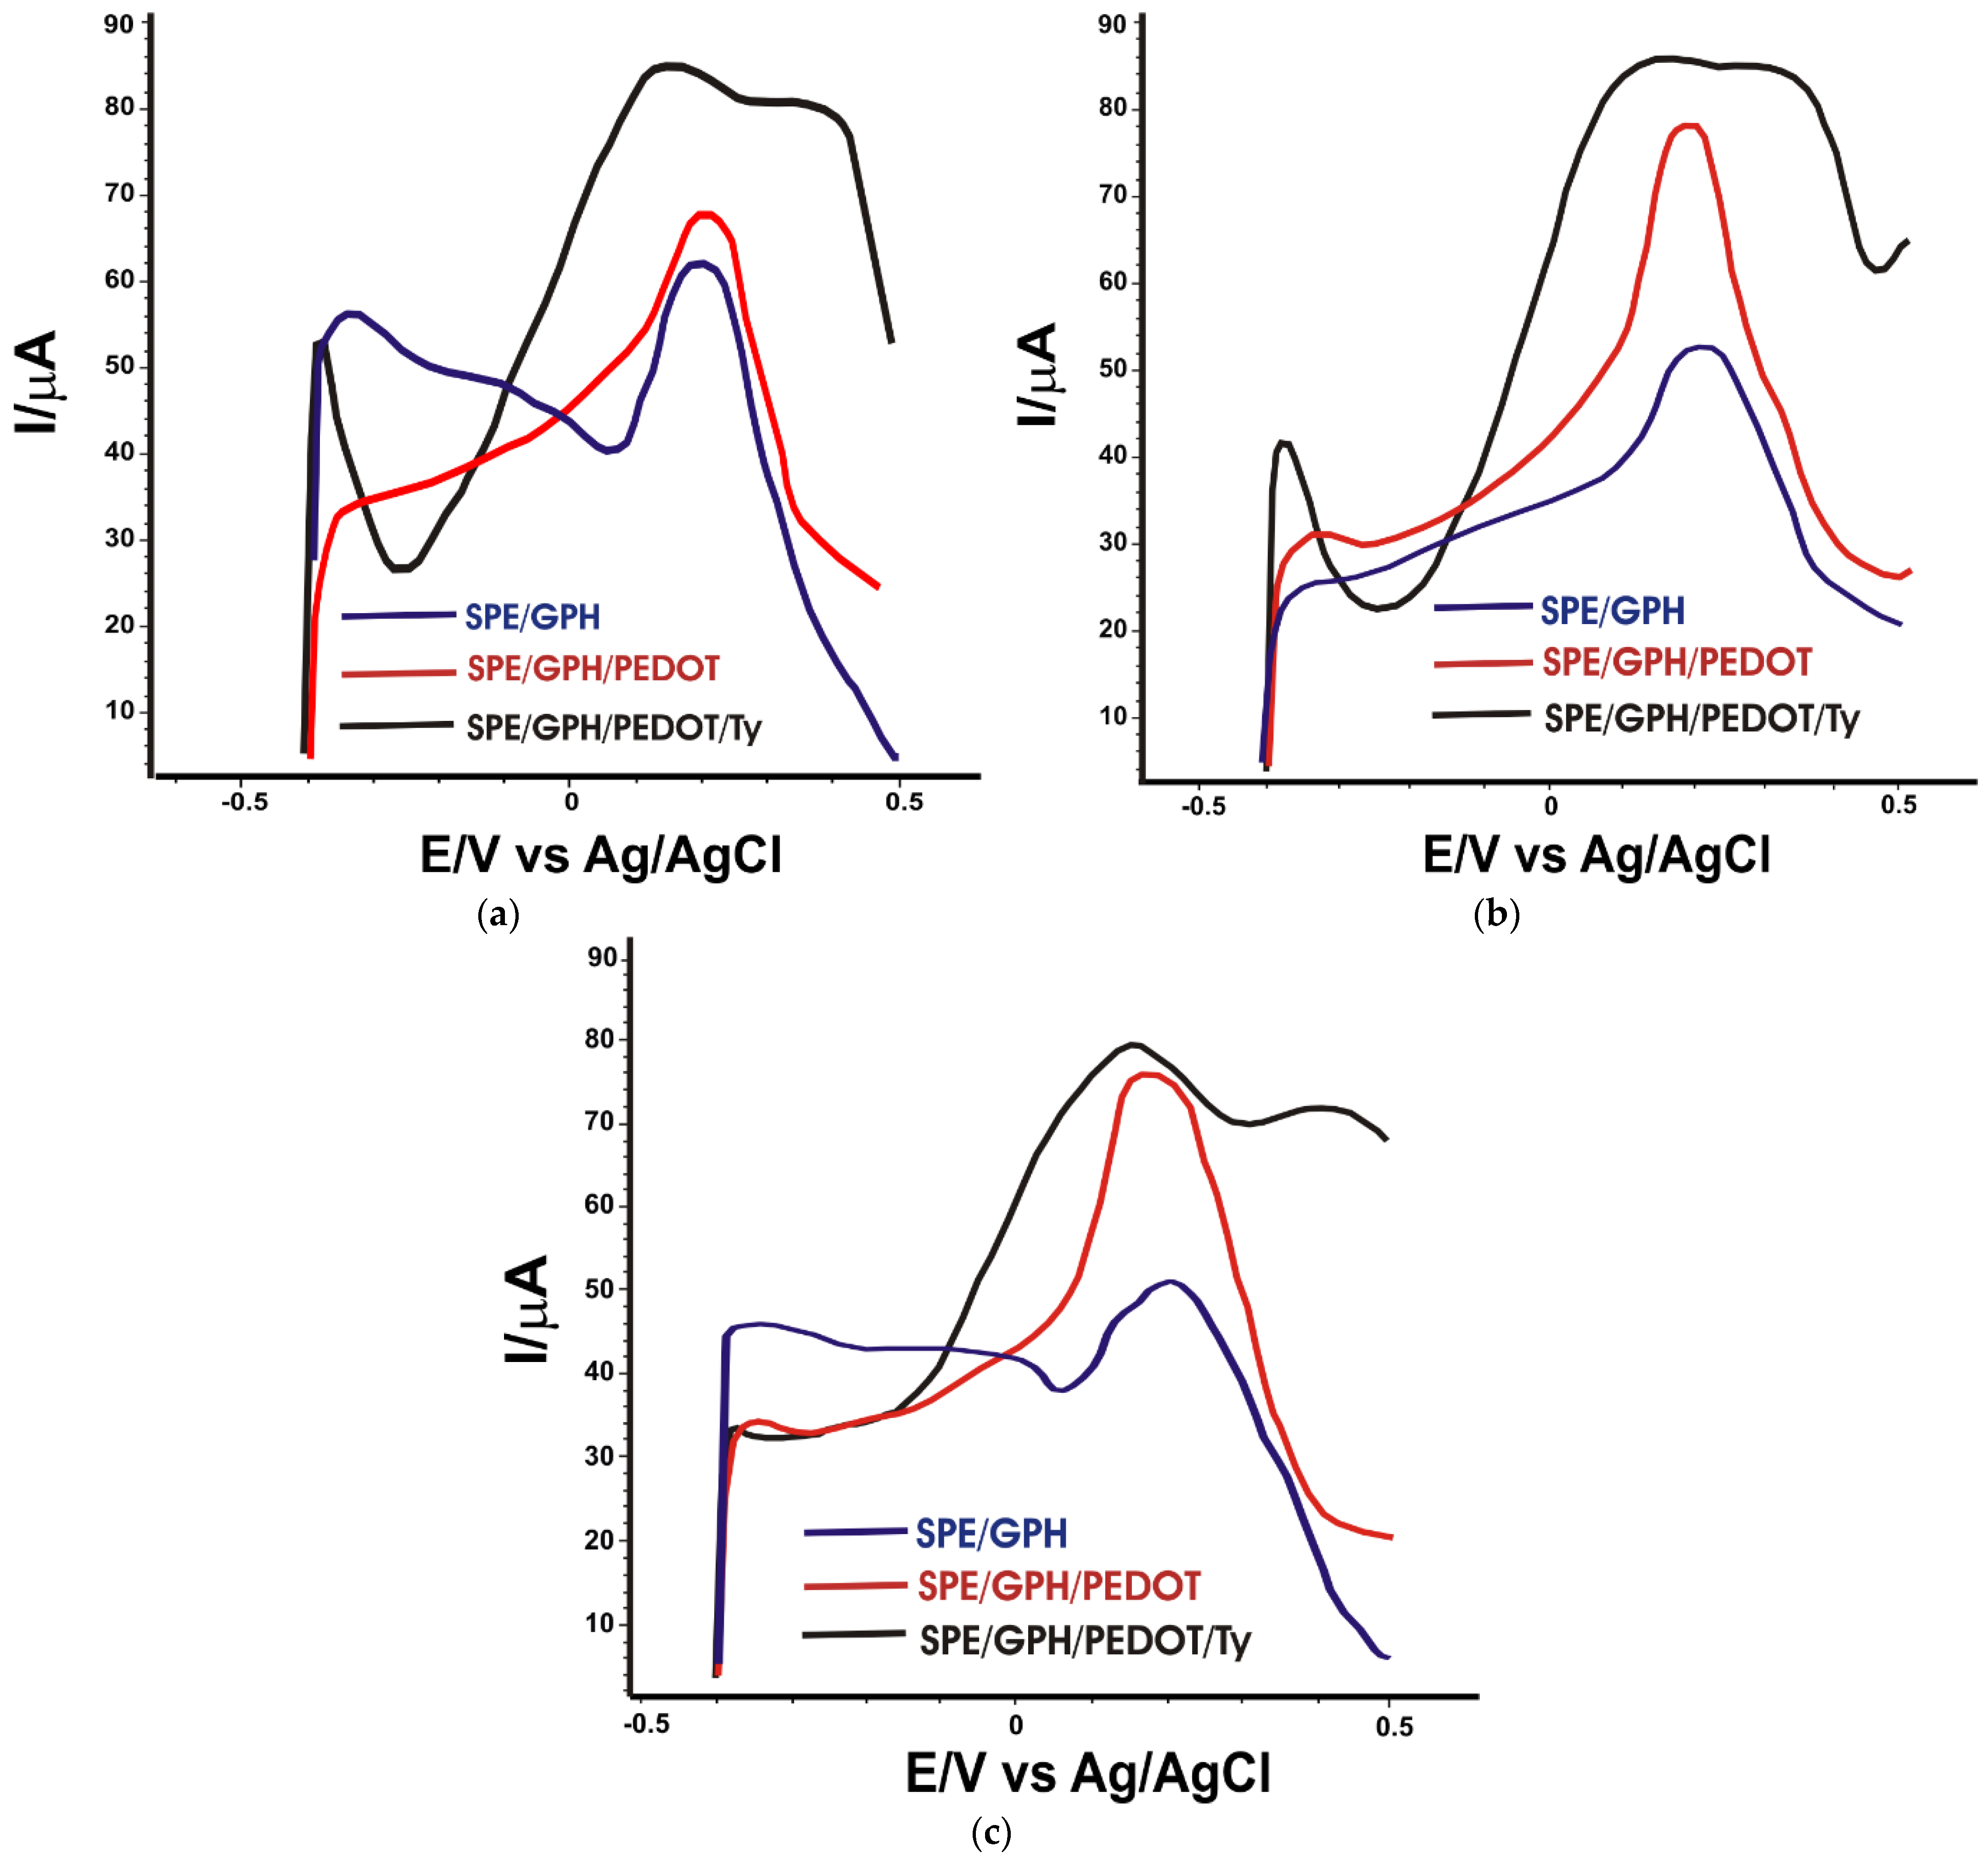
2.3. Electrochemical Behavior of Phenolic Compounds Using Modified Electrodes
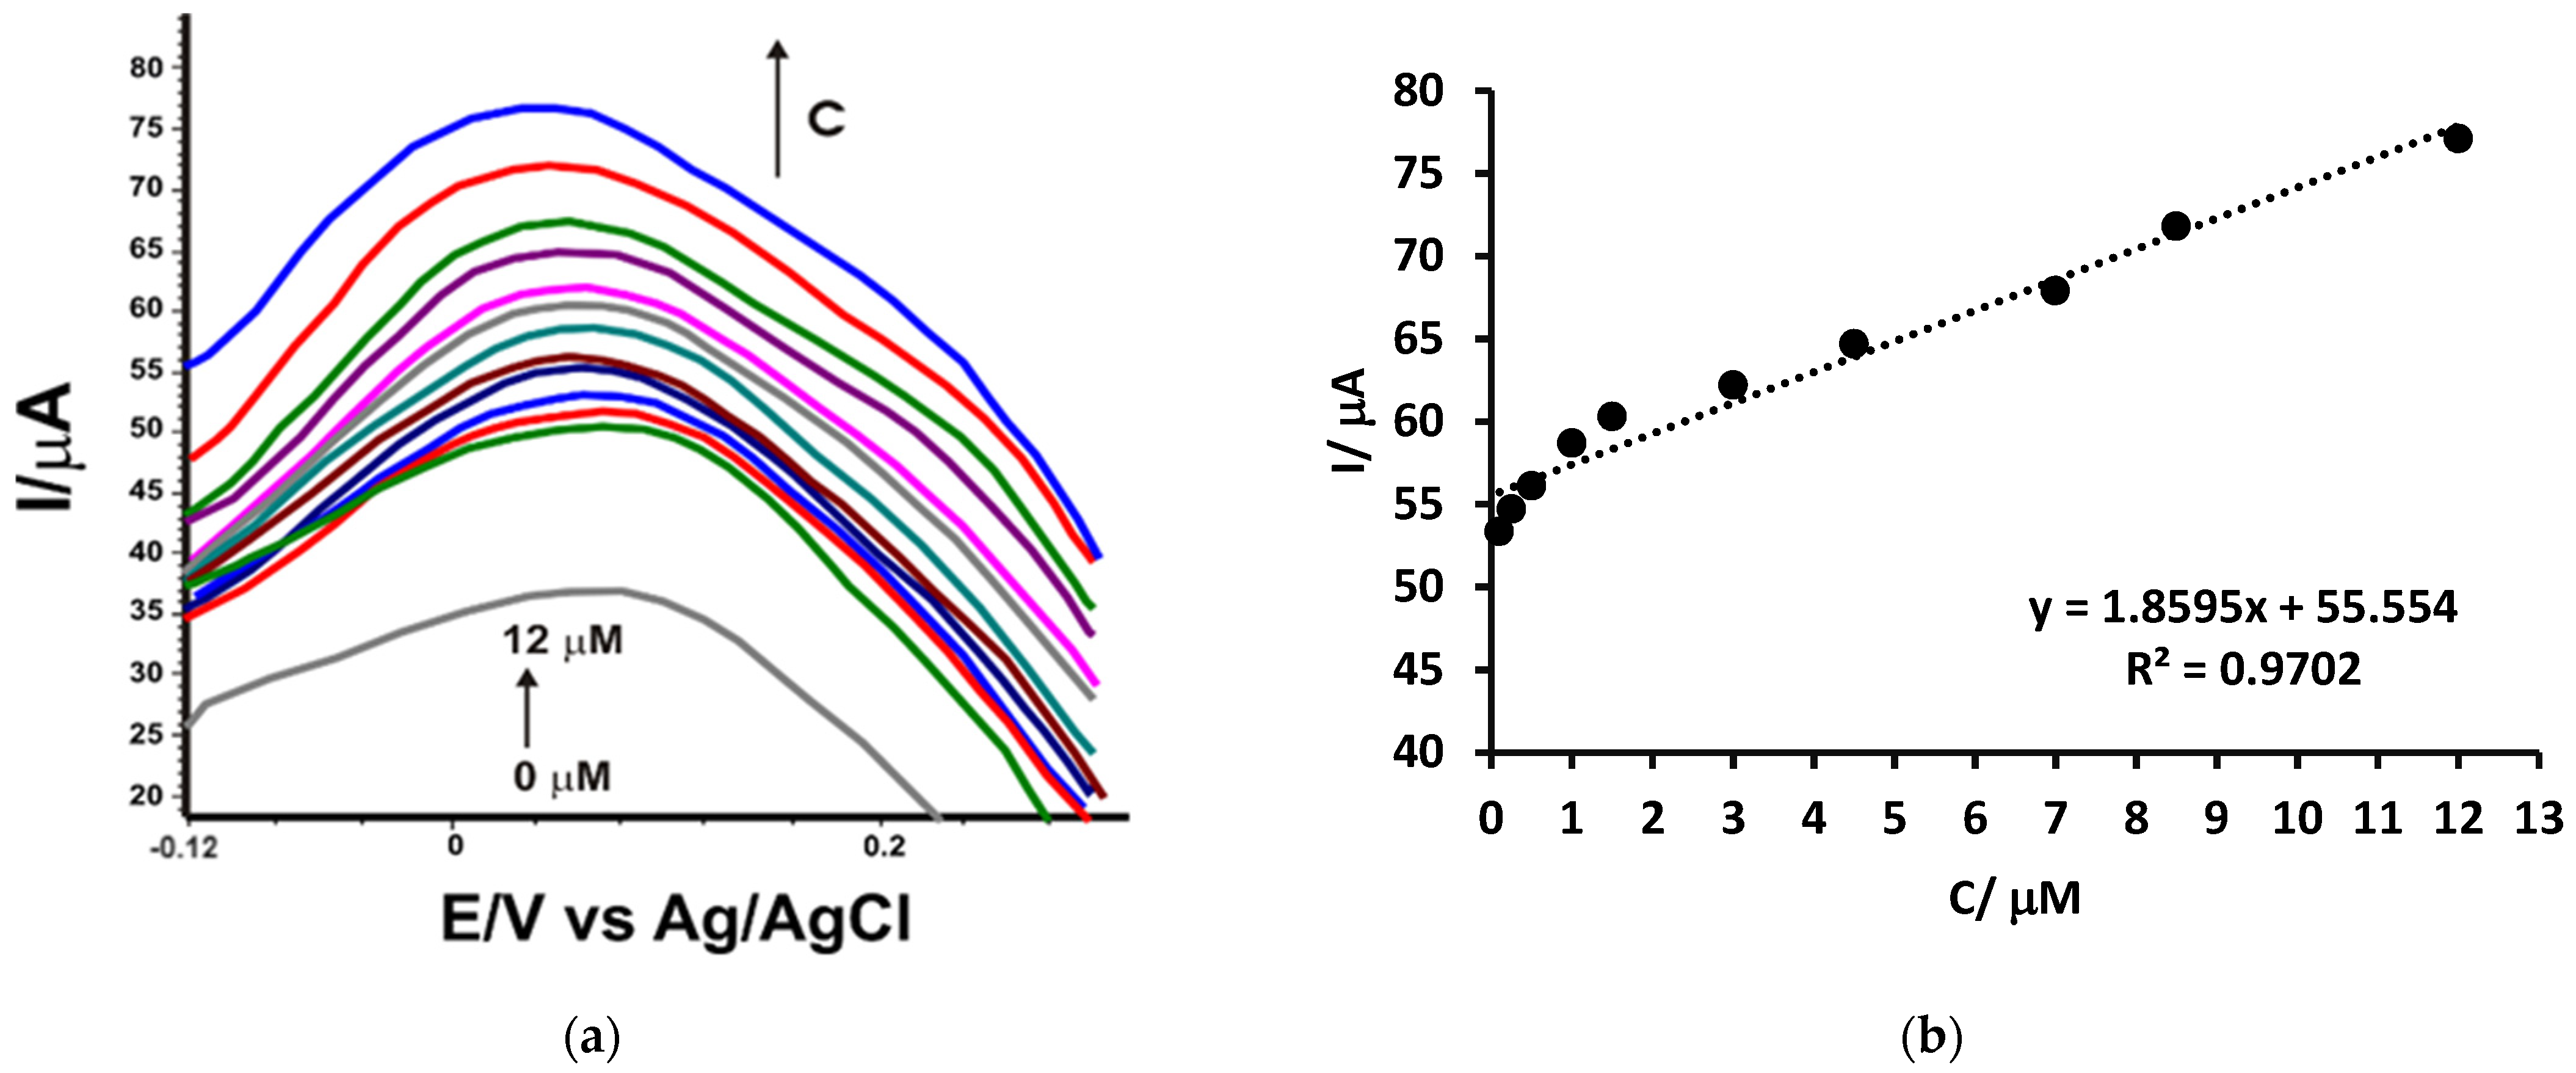
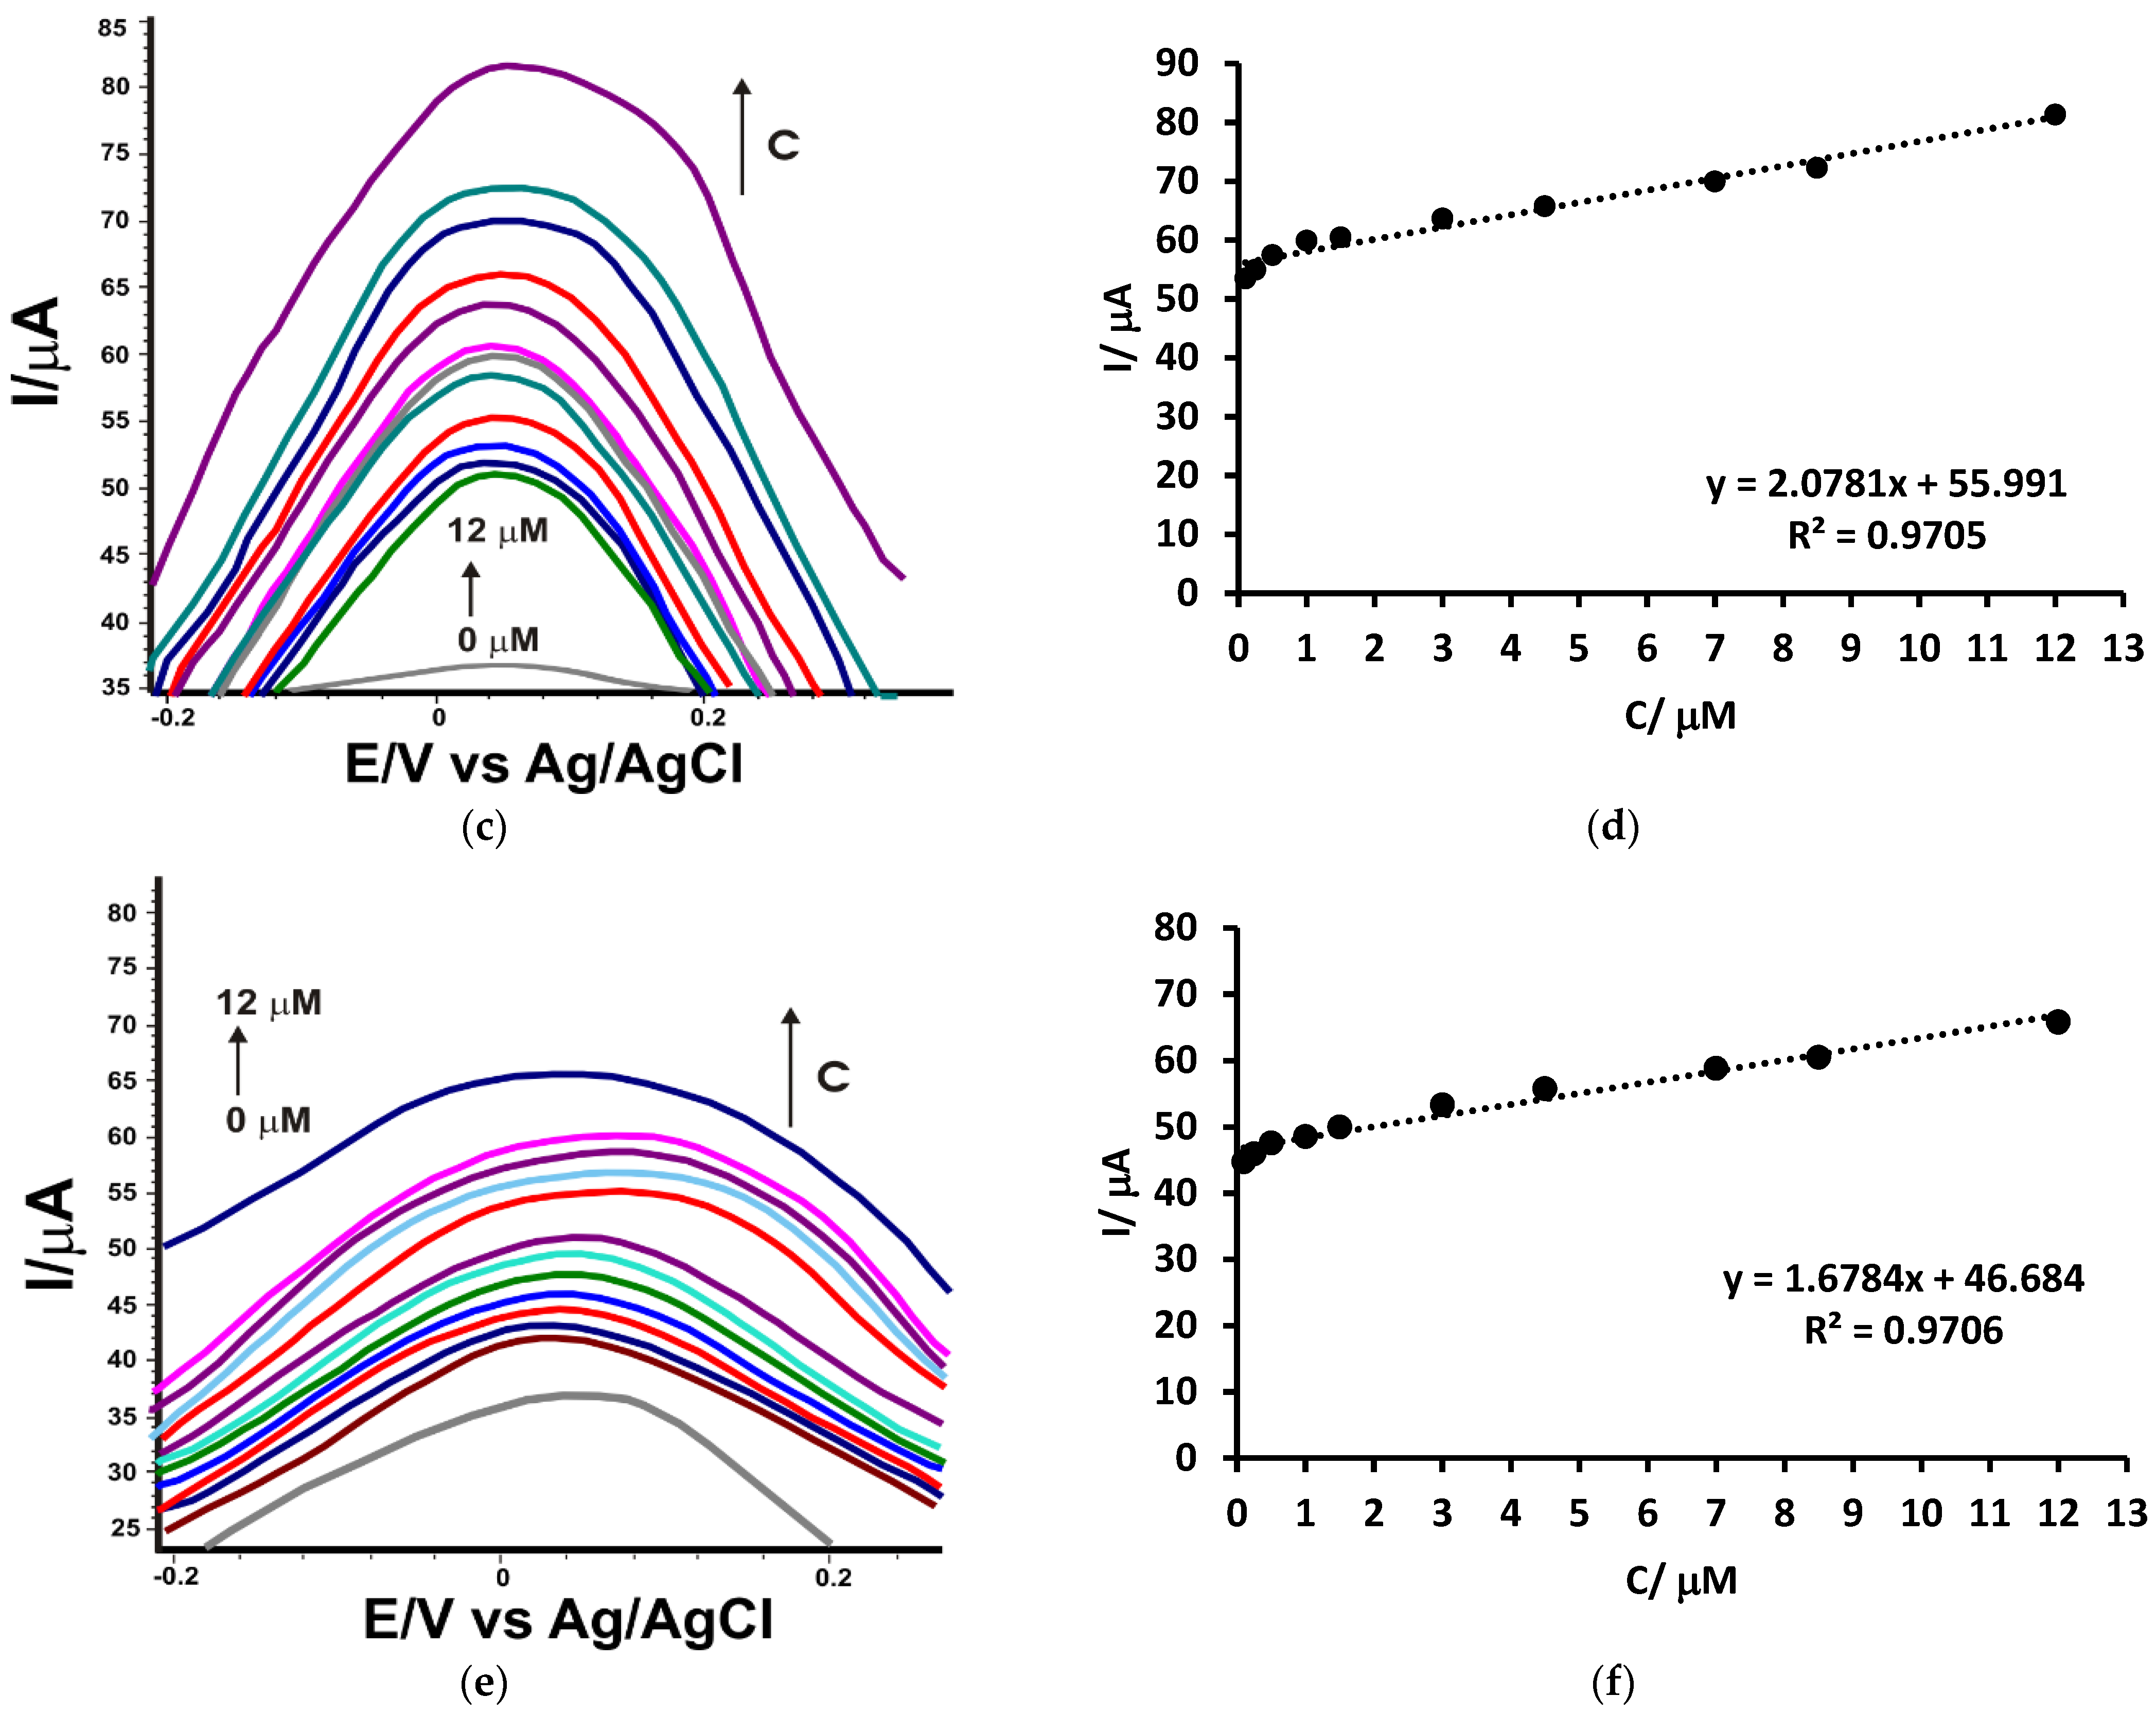
2.4. Calibration Curve and Detection Limit
2.5. Study of Stability and Precision of the SPE/GPH/PEDOT/Ty
2.6. Reproducibility of the SPE/GPH/PEDOT/Ty Biosensor
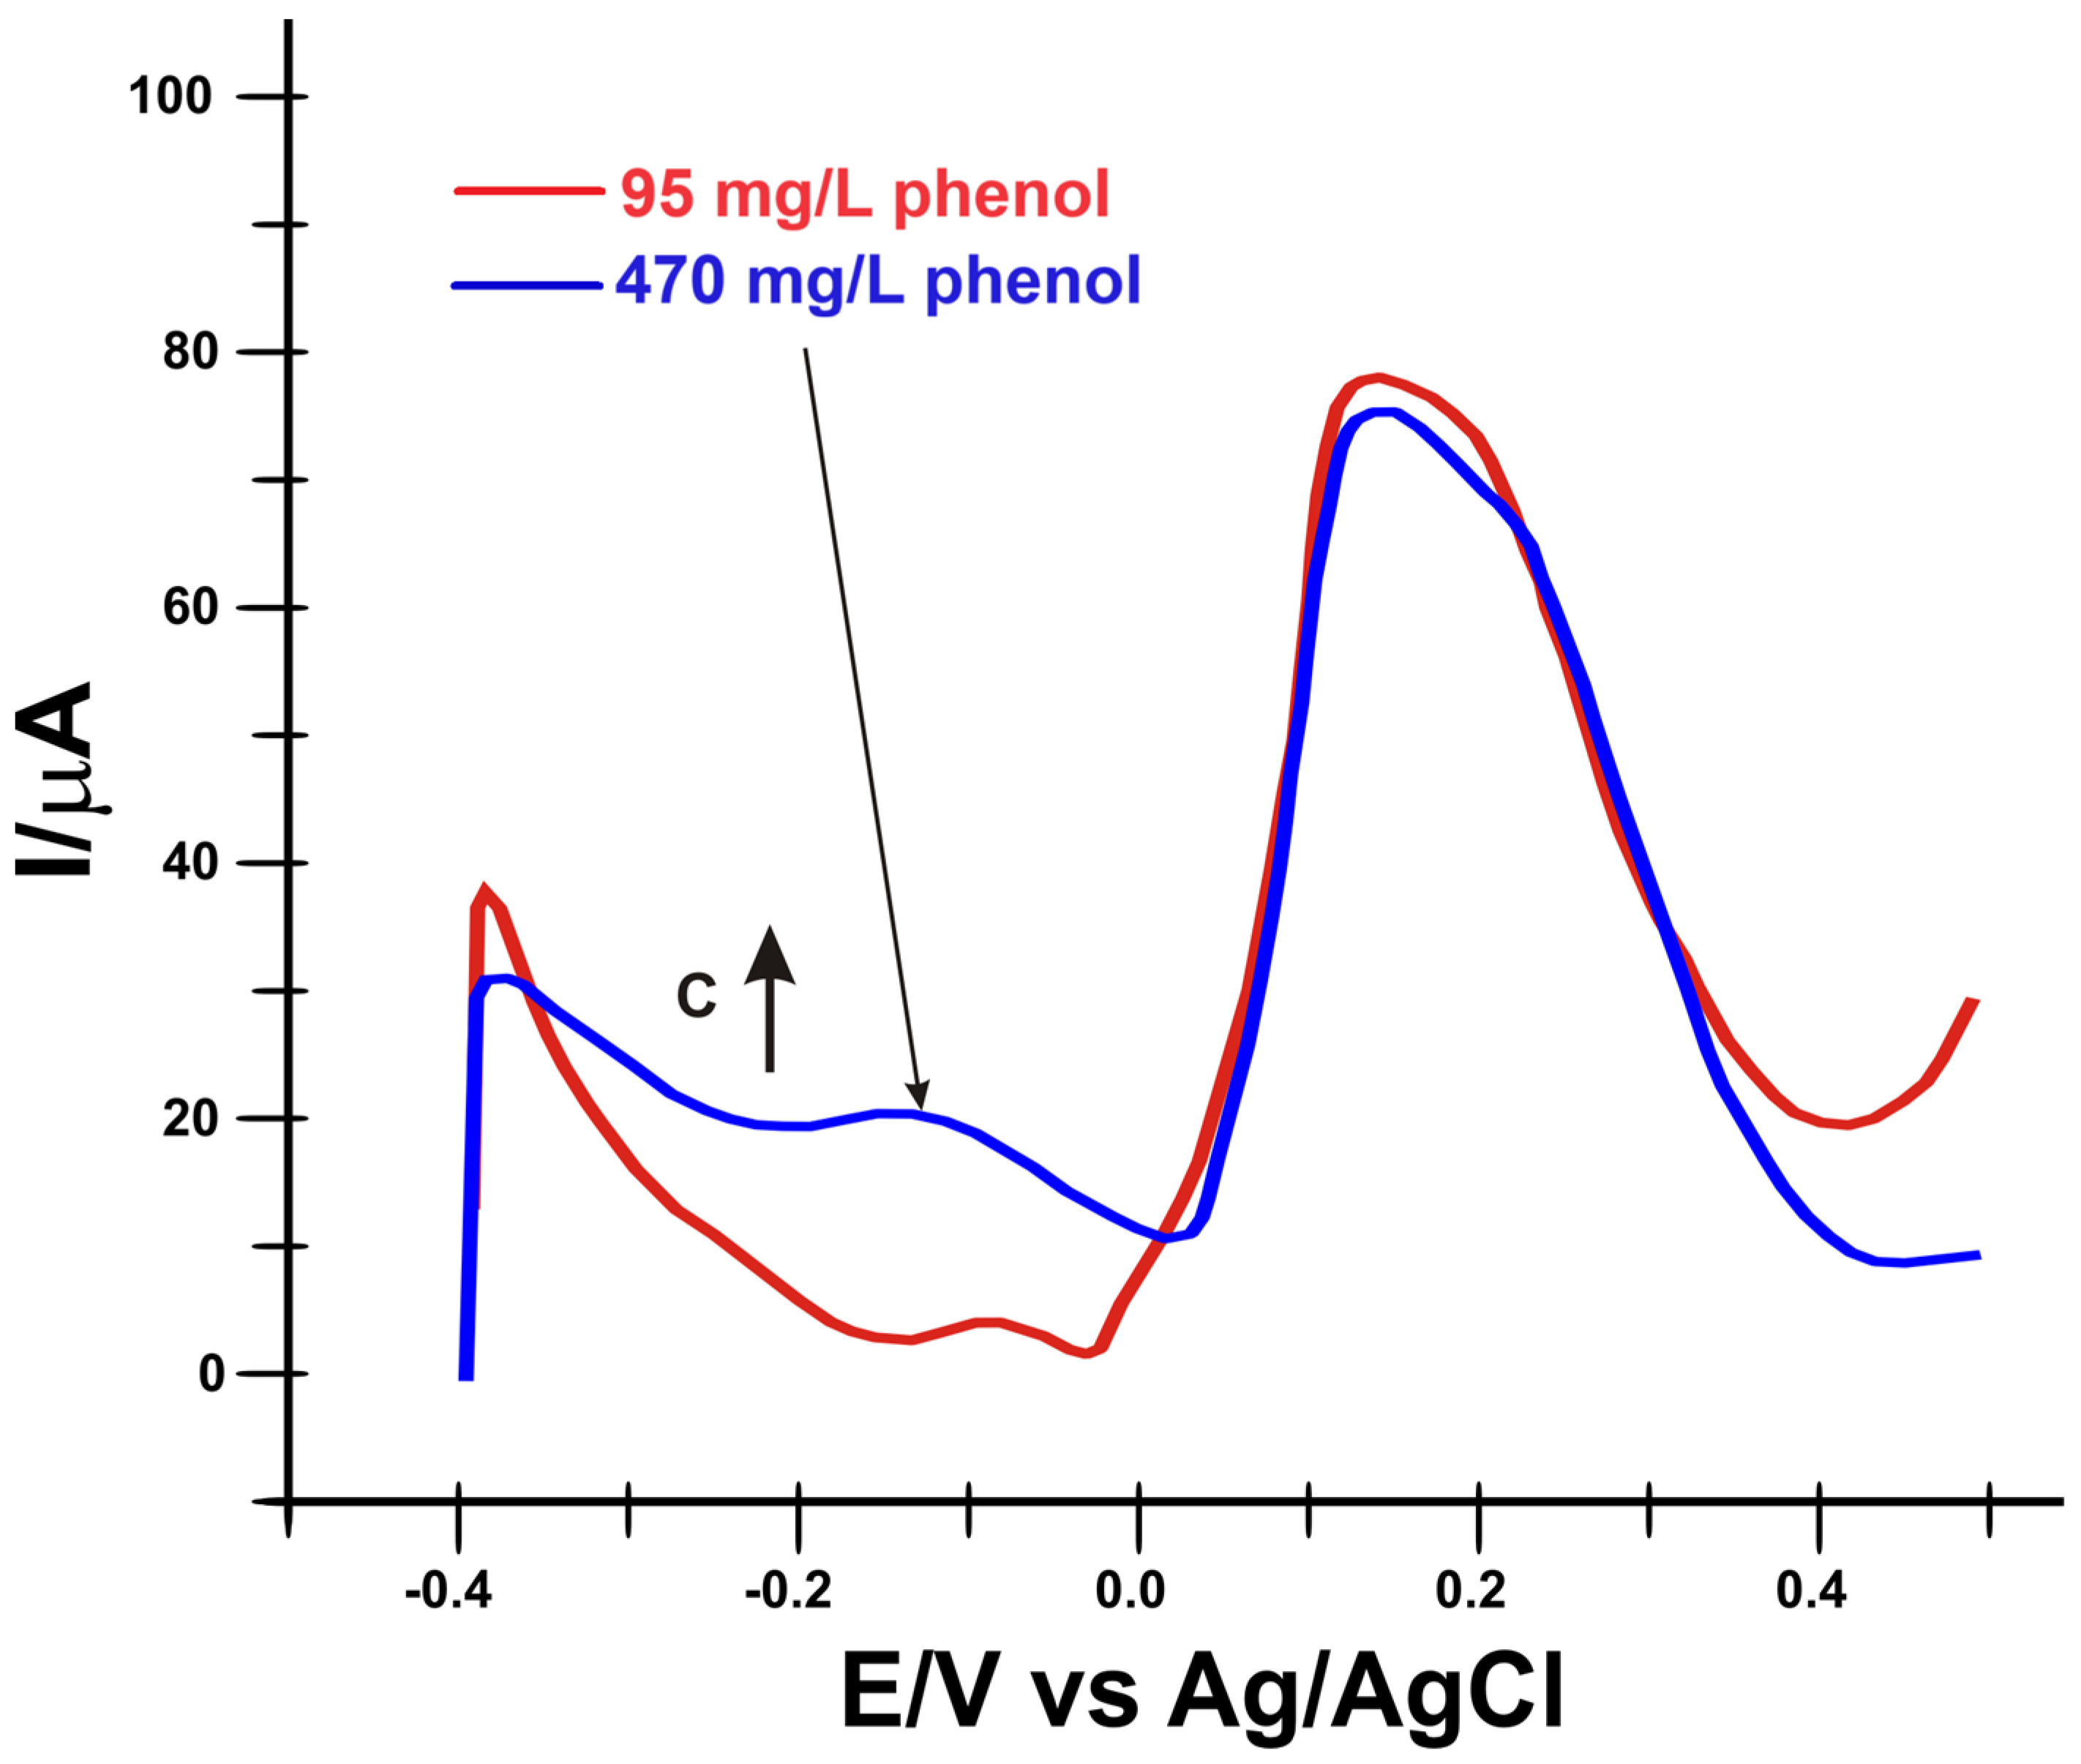
2.7. Selectivity of the SPE/GPH/PEDOT/Ty Biosensor
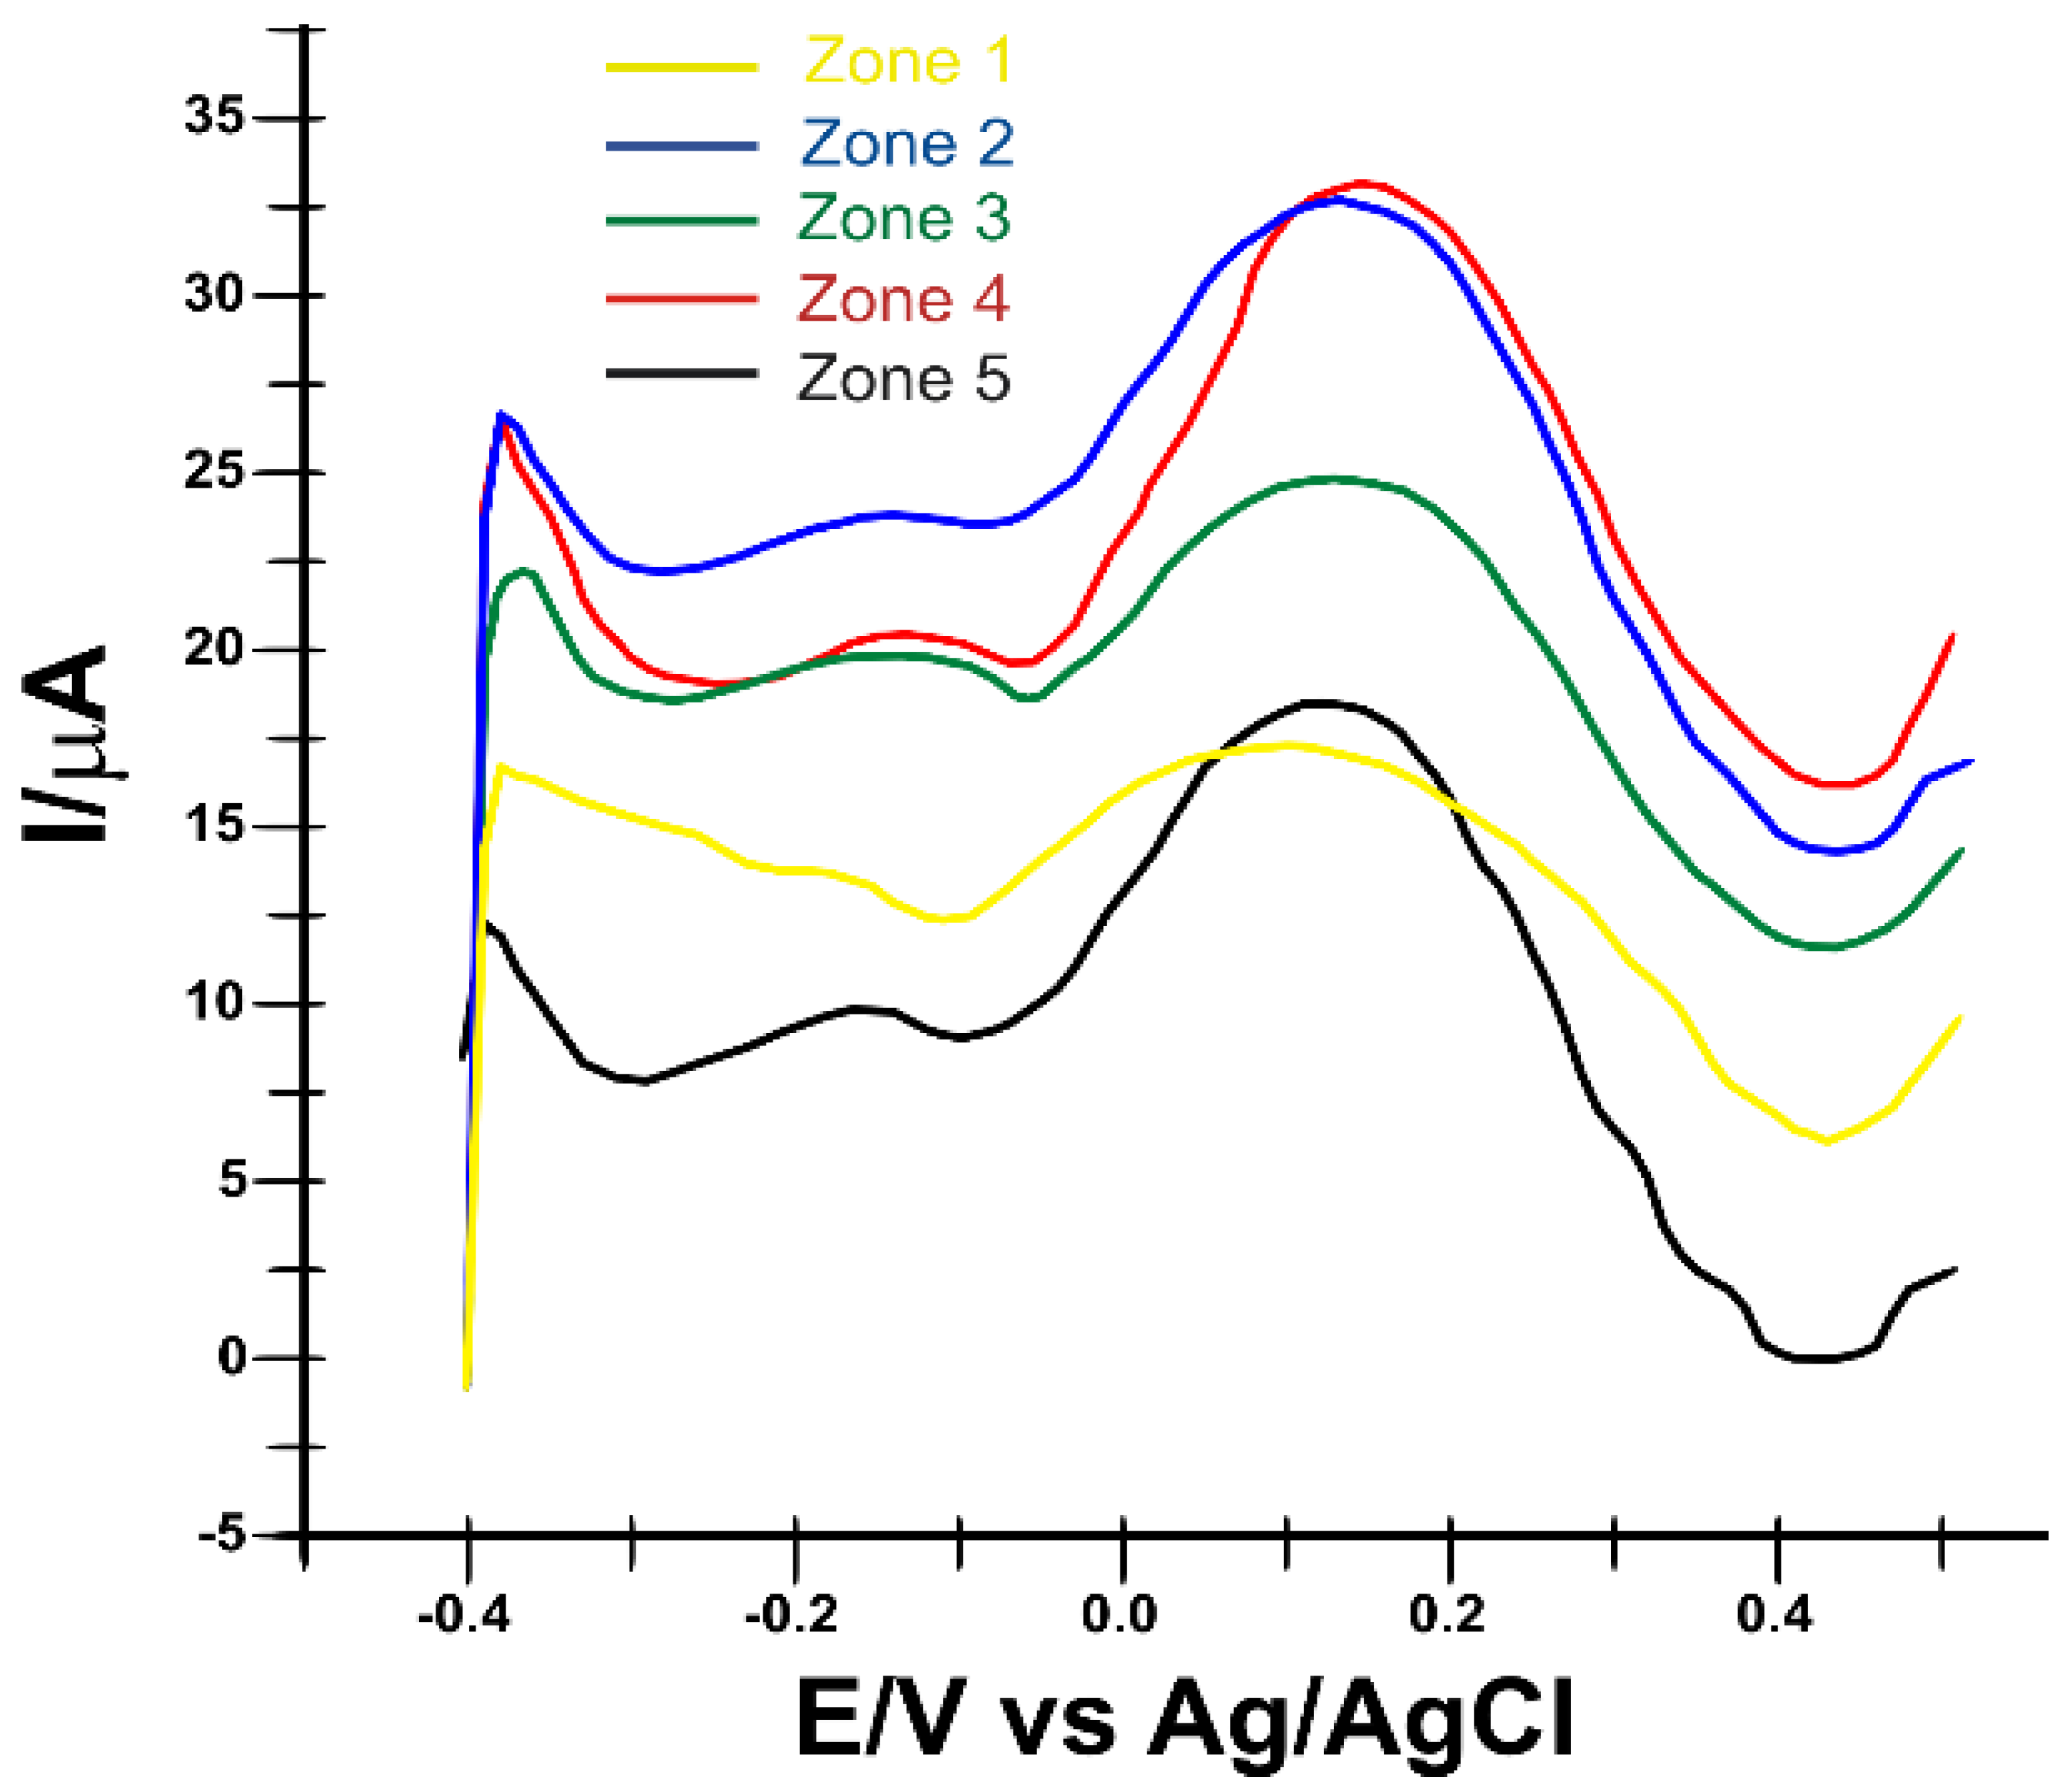
2.8. Real Sample Analysis
2.9. Validation of Results by the Standard Addition Method
3. Methods and Materials
3.1. Reagents and Solution
3.2. Apparatus
3.3. Modification of SPE Electrodes with GPH
3.4. Synthesis of the PEDOT Film
3.5. Preparation of Enzyme Electrodes
3.6. Samples Tested
4. Conclusions
Author Contributions
Funding
Institutional Review Board Statement
Informed Consent Statement
Data Availability Statement
Conflicts of Interest
References
- Mohamad Said, K.A.; Ismail, A.F.; Abdul Karim, Z.; Abdullah, M.S.; Hafeez, A. A Review of Technologies for the Phenolic Compounds Recovery and Phenol Removal from Wastewater. Process Saf. Environ. Prot. 2021, 151, 257–289. [Google Scholar] [CrossRef]
- Soto-Hernández, M.; Tenango, M.P.; García-Mateos, R. Phenolic Compounds: Natural Sources, Importance and Applications; BoD—Books on Demand: Norderstedt, Germany, 2017; ISBN 978-953-51-2957-8. [Google Scholar]
- Ramos, R.L.; Moreira, V.R.; Lebron, Y.A.R.; Santos, A.V.; Santos, L.V.S.; Amaral, M.C.S. Phenolic Compounds Seasonal Occurrence and Risk Assessment in Surface and Treated Waters in Minas Gerais—Brazil. Environ. Pollut. 2021, 268, 115782. [Google Scholar] [CrossRef] [PubMed]
- Mainali, K. Phenolic Compounds Contaminants in Water: A Glance. Curr. Trends Civ. Struct. Eng. 2020, 4, 593. [Google Scholar] [CrossRef]
- Solid-Phase Microextraction Coupled to High-Performance Liquid Chromatography to Determine Phenolic Compounds in Water Samples—ScienceDirect. Available online: https://www.sciencedirect.com/science/article/abs/pii/S0021967302001139 (accessed on 2 July 2023).
- Bajrai, F.S.M.; Ismail, B.S.; Mardiana-Jansar, K. Optimization Method for Simultaneous Extraction and Detection of Imazapic and Imazapyr Herbicides in Soil and Water Using HPLC-UV with Verification of LC-MS. Sains Malays. 2017, 46, 2339–2348. [Google Scholar] [CrossRef]
- Voltammetric and Amperometric Determination of Nitrophenols Using Boron-Doped Diamond Film Electrode|CU Digital Repository. Available online: https://dspace.cuni.cz/handle/20.500.11956/104345 (accessed on 2 July 2023).
- Govindhan, M.; Lafleur, T.; Adhikari, B.-R.; Chen, A. Electrochemical Sensor Based on Carbon Nanotubes for the Simultaneous Detection of Phenolic Pollutants. Electroanalysis 2015, 27, 902–909. [Google Scholar] [CrossRef]
- Tajik, S.; Beitollahi, H.; Nejad, F.G.; Dourandish, Z.; Khalilzadeh, M.A.; Jang, H.W.; Venditti, R.A.; Varma, R.S.; Shokouhimehr, M. Recent Developments in Polymer Nanocomposite-Based Electrochemical Sensors for Detecting Environmental Pollutants. Ind. Eng. Chem. Res. 2021, 60, 1112–1136. [Google Scholar] [CrossRef] [PubMed]
- Tan, F.; Cong, L.; Li, X.; Zhao, Q.; Zhao, H.; Quan, X.; Chen, J. An Electrochemical Sensor Based on Molecularly Imprinted Polypyrrole/Graphene Quantum Dots Composite for Detection of Bisphenol A in Water Samples. Sens. Actuators B Chem. 2016, 233, 599–606. [Google Scholar] [CrossRef]
- Braga, G.B.; Oliveira, A.E.F.; Pereira, A.C. Total Determination of Estrogenic Phenolic Compounds in River Water Using a Sensor Based on Reduced Graphene Oxide and Molecularly Imprinted Polymer. Electroanalysis 2018, 30, 2176–2184. [Google Scholar] [CrossRef]
- Saadati, F.; Ghahramani, F.; Shayani-jam, H.; Piri, F.; Yaftian, M.R. Synthesis and Characterization of Nanostructure Molecularly Imprinted Polyaniline/Graphene Oxide Composite as Highly Selective Electrochemical Sensor for Detection of p-Nitrophenol. J. Taiwan Inst. Chem. Eng. 2018, 86, 213–221. [Google Scholar] [CrossRef]
- Tian, Q.; Xu, J.; Zuo, Y.; Li, Y.; Zhang, J.; Zhou, Y.; Duan, X.; Lu, L.; Jia, H.; Xu, Q.; et al. Three-Dimensional PEDOT Composite Based Electrochemical Sensor for Sensitive Detection of Chlorophenol. J. Electroanal. Chem. 2019, 837, 1–9. [Google Scholar] [CrossRef]
- Caetano, F.R.; Carneiro, E.A.; Agustini, D.; Figueiredo-Filho, L.C.S.; Banks, C.E.; Bergamini, M.F.; Marcolino-Junior, L.H. Combination of Electrochemical Biosensor and Textile Threads: A Microfluidic Device for Phenol Determination in Tap Water. Biosens. Bioelectron. 2018, 99, 382–388. [Google Scholar] [CrossRef] [PubMed]
- Wang, Y.; Zhai, F.; Hasebe, Y.; Jia, H.; Zhang, Z. A Highly Sensitive Electrochemical Biosensor for Phenol Derivatives Using a Graphene Oxide-Modified Tyrosinase Electrode. Bioelectrochemistry 2018, 122, 174–182. [Google Scholar] [CrossRef] [PubMed]
- Han, E.; Yang, Y.; He, Z.; Cai, J.; Zhang, X.; Dong, X. Development of Tyrosinase Biosensor Based on Quantum Dots/Chitosan Nanocomposite for Detection of Phenolic Compounds. Anal. Biochem. 2015, 486, 102–106. [Google Scholar] [CrossRef] [PubMed]
- Wee, Y.; Park, S.; Kwon, Y.H.; Ju, Y.; Yeon, K.-M.; Kim, J. Tyrosinase-Immobilized CNT Based Biosensor for Highly-Sensitive Detection of Phenolic Compounds. Biosens. Bioelectron. 2019, 132, 279–285. [Google Scholar] [CrossRef]
- Forzato, C.; Vida, V.; Berti, F. Biosensors and Sensing Systems for Rapid Analysis of Phenolic Compounds from Plants: A Comprehensive Review. Biosensors 2020, 10, 105. [Google Scholar] [CrossRef] [PubMed]
- Munteanu, I.G.; Apetrei, C. Tyrosinase-Based Biosensor—A New Tool for Chlorogenic Acid Detection in Nutraceutical Formulations. Materials 2022, 15, 3221. [Google Scholar] [CrossRef] [PubMed]
- Liu, Y.; Chen, Y.; Fan, Y.; Gao, G.; Zhi, J. Development of a Tyrosinase Amperometric Biosensor Based on Carbon Nanomaterials for the Detection of Phenolic Pollutants in Diverse Environments. ChemElectroChem 2022, 9, e202200861. [Google Scholar] [CrossRef]
- Baluta, S.; Meloni, F.; Halicka, K.; Szyszka, A.; Zucca, A.; Pilo, M.I.; Cabaj, J. Differential Pulse Voltammetry and Chronoamperometry as Analytical Tools for Epinephrine Detection Using a Tyrosinase-Based Electrochemical Biosensor. RSC Adv. 2022, 12, 25342–25353. [Google Scholar] [CrossRef] [PubMed]
- Shahriary, L.; Athawale, A. Graphene Oxide Synthesized by Using Modified Hummers Approach. Renew. Energy Environ. Eng. 2014, 2, 58–63. [Google Scholar]
- Johra, F.T.; Lee, J.-W.; Jung, W.-G. Facile and Safe Graphene Preparation on Solution Based Platform. J. Ind. Eng. Chem. 2014, 20, 2883–2887. [Google Scholar] [CrossRef]
- Patra, S.; Barai, K.; Munichandraiah, N. Scanning Electron Microscopy Studies of PEDOT Prepared by Various Electrochemical Routes. Synth. Met. 2008, 158, 430–435. [Google Scholar] [CrossRef]
- Mayorga-Martinez, C.C.; Pino, F.; Kurbanoglu, S.; Rivas, L.; Ozkan, S.A.; Merkoçi, A. Iridium Oxide Nanoparticle Induced Dual Catalytic/Inhibition Based Detection of Phenol and Pesticide Compounds. J. Mater. Chem. B 2014, 2, 2233–2239. [Google Scholar] [CrossRef] [PubMed]
- Erkmen, C.; Demir, Y.; Kurbanoglu, S.; Uslu, B. Multi-Purpose Electrochemical Tyrosinase Nanobiosensor Based on Poly (3,4 Ethylenedioxythiophene) Nanoparticles Decorated Graphene Quantum Dots: Applications to Hormone Drugs Analyses and Inhibition Studies. Sens. Actuators B Chem. 2021, 343, 130164. [Google Scholar] [CrossRef]
- Cottis, P.P.; Evans, D.; Fabretto, M.; Pering, S.; Murphy, P.; Hojati-Talemi, P. Metal-Free Oxygen Reduction Electrodes Based on Thin PEDOT Films with High Electrocatalytic Activity. RSC Adv. 2014, 4, 9819. [Google Scholar] [CrossRef]
- Fenoy, G.F.; Rafti, M.; Marmisollé, W.A.; Azzaroni, O. Nanoarchitectonics of Metal Organic Frameworks and PEDOT Layer-by-Layer Electrodes for Boosting Oxygen Reduction Reaction. Mater. Adv. 2021, 2, 7731–7740. [Google Scholar] [CrossRef]
- Inroga, F.A.; Rocha, M.O.; Lavayen, V.; Arguello, J. Development of a Tyrosinase-Based Biosensor for Bisphenol A Detection Using Gold Leaf–like Microstructures. J. Solid State Electrochem. 2019, 23, 1659–1666. [Google Scholar] [CrossRef]
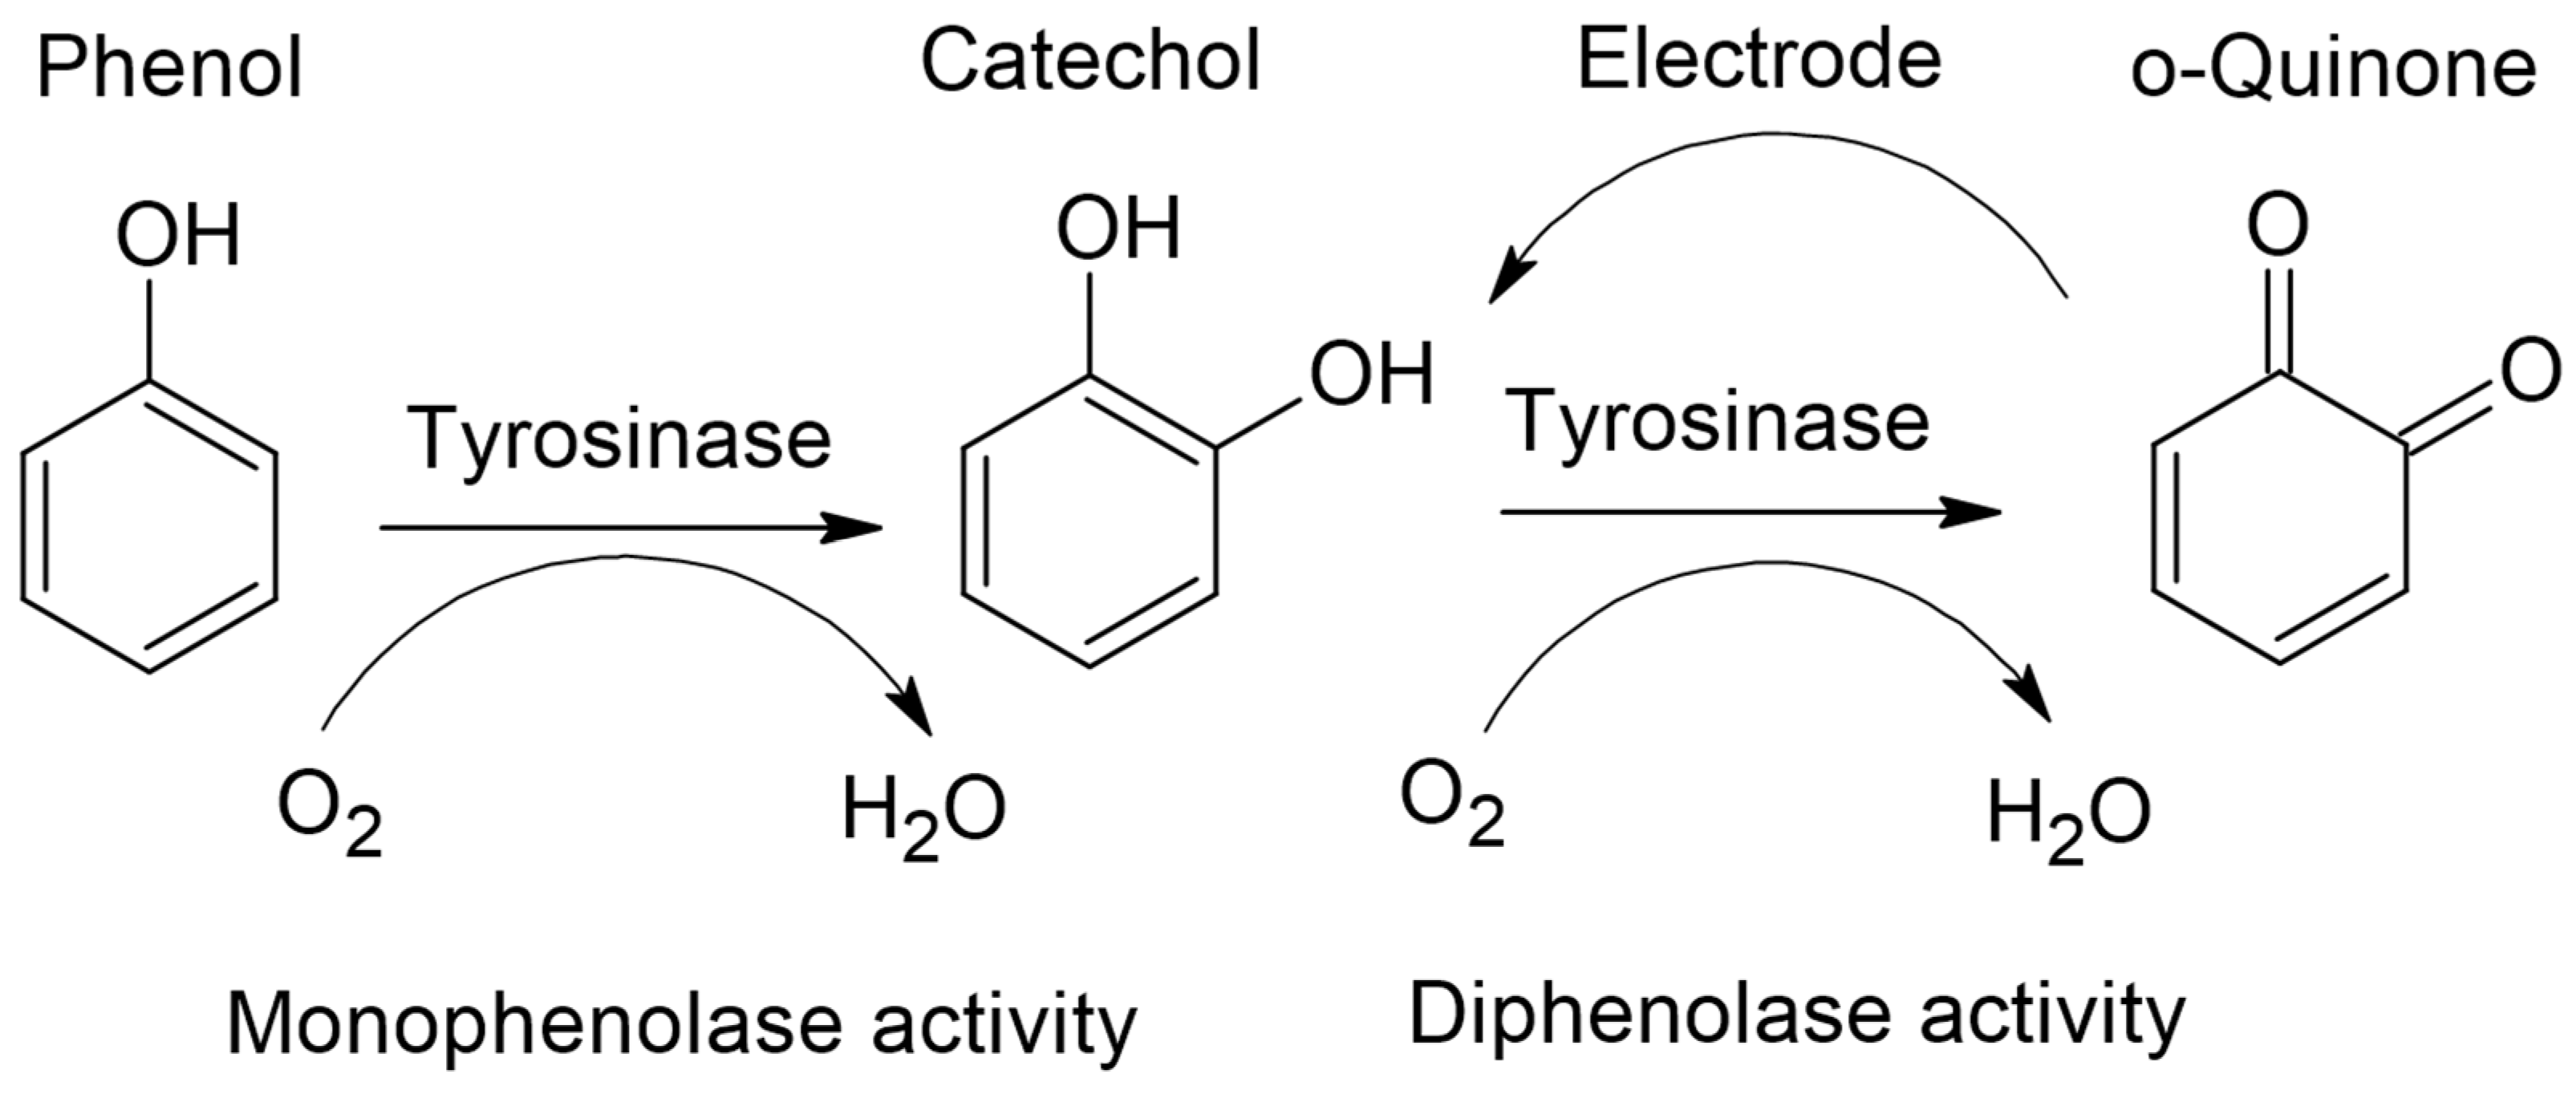
- Peñalver, M.J.; Hiner, A.N.P.; Rodríguez-López, J.N.; García-Cánovas, F.; Tudela, J. Mechanistic Implications of Variable Stoichiometries of Oxygen Consumption during Tyrosinase Catalyzed Oxidation of Monophenols and O-Diphenols. Biochim. Biophys. Acta BBA Protein Struct. Mol. Enzymol. 2002, 1597, 140–148. [Google Scholar] [CrossRef] [PubMed]
- Erkmen, C.; Kurbanoglu, S.; Uslu, B. Fabrication of Poly(3,4-Ethylenedioxythiophene)-Iridium Oxide Nanocomposite Based Tyrosinase Biosensor for the Dual Detection of Catechol and Azinphos Methyl. Sens. Actuators B Chem. 2020, 316, 128121. [Google Scholar] [CrossRef]
- Fang, Y.; Ramasamy, R.P. Detection of P-Ethylphenol, a Major Plant Volatile Organic Compound, by Tyrosinase-Based Electrochemical Biosensor. ECS J. Solid State Sci. Technol. 2016, 5, M3054–M3059. [Google Scholar] [CrossRef]
- Mei, L.-P.; Feng, J.-J.; Wu, L.; Zhou, J.-Y.; Chen, J.-R.; Wang, A.-J. Novel Phenol Biosensor Based on Laccase Immobilized on Reduced Graphene Oxide Supported Palladium–Copper Alloyed Nanocages. Biosens. Bioelectron. 2015, 74, 347–352. [Google Scholar] [CrossRef]
- Moczko, E.; Istamboulie, G.; Calas-Blanchard, C.; Rouillon, R.; Noguer, T. Biosensor Employing Screen-printed PEDOT:PSS for Sensitive Detection of Phenolic Compounds in Water. J. Polym. Sci. Part Polym. Chem. 2012, 50, 2286–2292. [Google Scholar] [CrossRef]
- Srinivasan, B. A Guide to the Michaelis–Menten Equation: Steady State and Beyond. FEBS J. 2022, 289, 6086–6098. [Google Scholar] [CrossRef]
- Apetrei, C.; Rodríguez-Méndez, M.L.; De Saja, J.A. Amperometric Tyrosinase Based Biosensor Using an Electropolymerized Phosphate-Doped Polypyrrole Film as an Immobilization Support. Application for Detection of Phenolic Compounds. Electrochim. Acta 2011, 56, 8919–8925. [Google Scholar] [CrossRef]
- Kıralp, S.; Toppare, L. Polyphenol Content in Selected Turkish Wines, an Alternative Method of Detection of Phenolics. Process Biochem. 2006, 41, 236–239. [Google Scholar] [CrossRef]
- Campanhã Vicentini, F.; Garcia, L.L.C.; Figueiredo-Filho, L.C.S.; Janegitz, B.C.; Fatibello-Filho, O. A Biosensor Based on Gold Nanoparticles, Dihexadecylphosphate, and Tyrosinase for the Determination of Catechol in Natural Water. Enzym. Microb. Technol. 2016, 84, 17–23. [Google Scholar] [CrossRef] [PubMed]
- Wong, A.; Santos, A.M.; Fatibello-Filho, O.; Sotomayor, M.D.P.T. Amperometric Tyrosinase Biosensor Based on Carbon Black Paste Electrode for Sensitive Detection of Catechol in Environmental Samples. Electroanalysis 2021, 33, 431–437. [Google Scholar] [CrossRef]
- Camargo, J.R.; Baccarin, M.; Raymundo-Pereira, P.A.; Campos, A.M.; Oliveira, G.G.; Fatibello-Filho, O.; Oliveira, O.N., Jr.; Janegitz, B.C. Electrochemical Biosensor Made with Tyrosinase Immobilized in a Matrix of Nanodiamonds and Potato Starch for Detecting Phenolic Compounds. Anal. Chim. Acta 2018, 1034, 137–143. [Google Scholar] [CrossRef] [PubMed]
- Gopal, P.; Narasimha, G.; Reddy, T.M. Development, Validation and Enzyme Kinetic Evaluation of Multi Walled Carbon Nano Tubes Mediated Tyrosinase Based Electrochemical Biosensing Platform for the Voltammetric Monitoring of Epinephrine. Process Biochem. 2020, 92, 476–485. [Google Scholar] [CrossRef]
- Palomar, Q.; Gondran, C.; Lellouche, J.-P.; Cosnier, S.; Holzinger, M. Functionalized Tungsten Disulfide Nanotubes for Dopamine and Catechol Detection in a Tyrosinase-Based Amperometric Biosensor Design. J. Mater. Chem. B 2020, 8, 3566–3573. [Google Scholar] [CrossRef]
- Liu, H.; Tian, X.; Liu, H.; Wang, X. Electrochemical Biosensor Based on Tyrosinase-Immobilized Phase-Change Microcapsules for Ultrasensitive Detection of Phenolic Contaminants under in Situ Thermal Management. J. Ind. Eng. Chem. 2023, 120, 349–360. [Google Scholar] [CrossRef]
- Kim, M.A.; Lee, W.-Y. Amperometric Phenol Biosensor Based on Sol–Gel Silicate/Nafion Composite Film. Anal. Chim. Acta 2003, 479, 143–150. [Google Scholar] [CrossRef]
- ORDIN 161 16/02/2006—Portal Legislativ. Available online: https://legislatie.just.ro/Public/DetaliiDocumentAfis/72574 (accessed on 19 November 2023).
- Bieńkowski, K.; Strawski, M.; Szklarczyk, M. The Determination of the Thickness of Electrodeposited Polymeric Films by AFM and Electrochemical Techniques. J. Electroanal. Chem. 2011, 662, 196–203. [Google Scholar] [CrossRef]
- Dinu, A.; Apetrei, C. Development of a Novel Sensor Based on Polypyrrole Doped with Potassium Hexacyanoferrate (II) for Detection of L-Tryptophan in Pharmaceutics. Inventions 2021, 6, 56. [Google Scholar] [CrossRef]
- Apetrei, I.; Apetrei, C. Development of a Novel Biosensor Based on Tyrosinase/Platinum Nanoparticles/Chitosan/Graphene Nanostructured Layer with Applicability in Bioanalysis. Materials 2019, 12, 1009. [Google Scholar] [CrossRef] [PubMed]


| Sensor | ΔE (V) | E1/2 (V) | Ia (μA) | Ic (μA) | Ea (V) | Ec (V) | Ic/Ia |
|---|---|---|---|---|---|---|---|
| SPE | 0.229 | 0.215 | 24.30 | −23.5 | 0.330 | 0.101 | 0.96 |
| SPE/GPH | 0.104 | 0.200 | 74.25 | −73.45 | 0.252 | 0.148 | 0.97 |
| SPE/GPH/PEDOT | 0.110 | 0.206 | 102.15 | −110.5 | 0.262 | 0.151 | 1.08 |
| SPE/GPH/PEDOT/Ty | 0.077 | 0.191 | 51.120 | −38.62 | 0.230 | 0.153 | 0.75 |
| CV | |||
| CAT | 3-methoxyCAT | 4-methylCAT | |
| Ia (μA) | 77.45 | 84.65 | 71.15 |
| Ea (V) | 0.25 | 0.1 | 0.21 |
| SWV | |||
| Ia (μA) | 85.15 | 86.25 | 79.15 |
| Ea (V) | 0.15 | 0.14 | 0.17 |
| Analyte | CAT | 3-methoxyCAT | 4-methylCAT |
|---|---|---|---|
| SPE/GPH/PEDOT/Ty Ei–Ef: −0.4–0.5 V vs. Ag/AgCl, Esw = 0.09 V, Pw = 50 ms | |||
| Sensitivity (A mol−1 L) | 1.859 × 10⁻⁶ | 2.078 × 10⁻⁶ | 1.678 × 10⁻⁶ |
| Limit of detection (mol L−1) | 8.63 × 10⁻¹⁰ | 7.72 × 10⁻¹⁰ | 9.56 × 10⁻¹⁰ |
| Limit of quantification (mol L−1) | 2.88 × 10⁻⁹ | 2.57 × 10⁻⁹ | 3.18 × 10⁻⁹ |
| Linear range (mol L−1) | 1 × 10⁻⁷–1.2 × 10⁻⁵ | ||
| R2 | 0.9702 | 0.9705 | 0.9706 |
| Parameter/Analyte | Imax (μA) | (μM) | Hill Coefficient (h) |
|---|---|---|---|
| CAT | 61.72 | 0.327 | 1.02 |
| 3-methoxyCAT | 62.5 | 0.368 | 1.16 |
| 4-methylCAT | 52.08 | 0.817 | 1.11 |
| Electrode | Linear Range (M) | LOD (M) | Sensitivity (A × mol−1 L) | (M) | Ref |
|---|---|---|---|---|---|
| Tyr-AuNPs-DHP/GCE | 2.5–95 × 10−6 | 1.7 × 10⁻⁷ | 0.115 | 0.0002 | [38] |
| Tyr-PO4–PPy/Pt | 10–120 × 10−6 | 8.4 × 10⁻⁷ | 0.047 | 0.0000802 | [36] |
| Tyr-GA/CBPE | 5.0 × 10⁻⁹–4.8 × 10⁻⁸ 4.8 × 10⁻⁸–8.5 × 10⁻⁶ | 1.5 × 10⁻⁹ | - | 1.2 × 10⁻⁵ | [39] |
| SPE/IrOx/PEDOT/Tyr | 0.05 × 10⁻⁶−10.65 × 10⁻⁶ | 1.7 × 10⁻⁸ | 3.017 × 10⁻⁶ | 5.2 × 10⁻⁵ | [31] |
| Tyr/GO/GA/GCE | 5 × 10⁻⁸−5 × 10⁻⁵ | 3 × 10⁻⁸ | 0.34 × 10⁻⁶ | 16.99 × 10⁻⁵ | [15] |
| Tyr-ND-PS/GCE | 5–740 × 10−6 | 0.39 × 10⁻⁶ | - | - | [40] |
| TMCG | 1−30 × 10−6 | 2.60 × 10⁻⁷ | 0.057 | 22.5 × 10⁻⁶ | [41] |
| Tyr-CNTs-Glu/NDs-SS/GCE | 0.03–30 × 10−6 | 9.8 × 10⁻⁹ | - | 205.17 × 10⁻⁶ | [20] |
| WS2-COOH nanotube + GCE | 0.6–70 × 10−6 | - | 0.0107 | 183 × 10−6 | [42] |
| Tyr-Fe3O4/PPy@TiO2@n-C20 MEPCM-modified GCE | 1–10 × 10−3 | 3.4 × 10⁻⁶ | 0.102 × 10⁻⁶ | - | [43] |
| SPE/GPH/PEDOT/Ty | 1 × 10⁻⁷–1.2 × 10⁻⁵ | 8.63 × 10⁻¹⁰ | 1.859 × 10⁻⁶ | 0.254 × 10⁻⁶ | This work |
| Solution 5 × 10⁻³ M | RSD % 10 Consecutive Scan | RSD % 10 Consecutive Days (One Scan per Day) |
|---|---|---|
| CAT | 1.63 | 1.82 |
| 3-methoxyCAT | 1.56 | 2.08 |
| 4-methylCAT | 2.61 | 2.87 |
| Phenolic Compound Present in Sample | Ratio | Recovery (%) | RSD (%) | Ratio | Recovery (%) | RSD (%) |
|---|---|---|---|---|---|---|
| Interfering compound Phenol | ||||||
| CAT | 1:1 | 94.06 | 4.32 | 1:5 | 93.00 | 5.12 |
| 3-methoxyCAT | 93.04 | 5.09 | 91.88 | 5.98 | ||
| 4-methylCAT | 99.17 | 0.58 | 95.07 | 3.57 | ||
| Sample | c (μM) | c (cg/L) | RSD (±%) | Phenolic Index (Order No. 161 Dated 16 February 2006) (cg/L) [45] |
|---|---|---|---|---|
| CAT | 5 | |||
| Zone 1 | 9.047 | 0.099 | 0.877 | |
| Zone 2 | 17.412 | 0.195 | 0.163 | |
| Zone 3 | 13.076 | 0.147 | 0.320 | |
| Zone 4 | 17.783 | 0.200 | 0.271 | |
| Zone 5 | 9.774 | 0.109 | 0.270 | |
| 3-methoxyCAT | ||||
| Zone 1 | 8.147 | 0.114 | 0.271 | |
| Zone 2 | 15.644 | 0.324 | 0.116 | |
| Zone 3 | 11.833 | 0.245 | 0.426 | |
| Zone 4 | 15.842 | 0.328 | 0.335 | |
| Zone 5 | 8.806 | 0.182 | 0.362 | |
| 4-methylCAT | ||||
| Zone 1 | 9.287 | 0.126 | 0.545 | |
| Zone 2 | 19.123 | 0.264 | 0.406 | |
| Zone 3 | 14.326 | 0.197 | 0.542 | |
| Zone 4 | 19.290 | 0.122 | 0.277 | |
| Zone 5 | 10.423 | 0.066 | 0.230 | |
| Sample | CAT (μM) Initial | CAT (μM) Added | CAT (μM) Found | Recovery (%) |
|---|---|---|---|---|
| Zone 1 | 9.047 | 2 | 10.97 | 99.30 ± 0.49 |
| 4 | 13.09 | 100.32 ± 0.23 | ||
| 7 | 16.28 | 101.45 ± 1.01 | ||
| 3-methoxyCAT (μM) Initial | 3-methoxyCAT (μM) Added | 3-methoxyCAT (μM) Found | Recovery (%) | |
| 8.147 | 2 | 10.00 | 98.55 ± 1.03 | |
| 4 | 11.98 | 98.62 ± 0.97 | ||
| 7 | 15.32 | 101.14 ± 0.80 | ||
| 4-methylCAT (μM) Initial | 4-methylCAT (μM) Added | 4-methylCAT (μM) Found | Recovery (%) | |
| 9.287 | 2 | 11.07 | 98.07 ± 1.37 | |
| 4 | 13.29 | 100.02 ± 0.01 | ||
| 7 | 16.08 | 98.72 ± 0.90 |
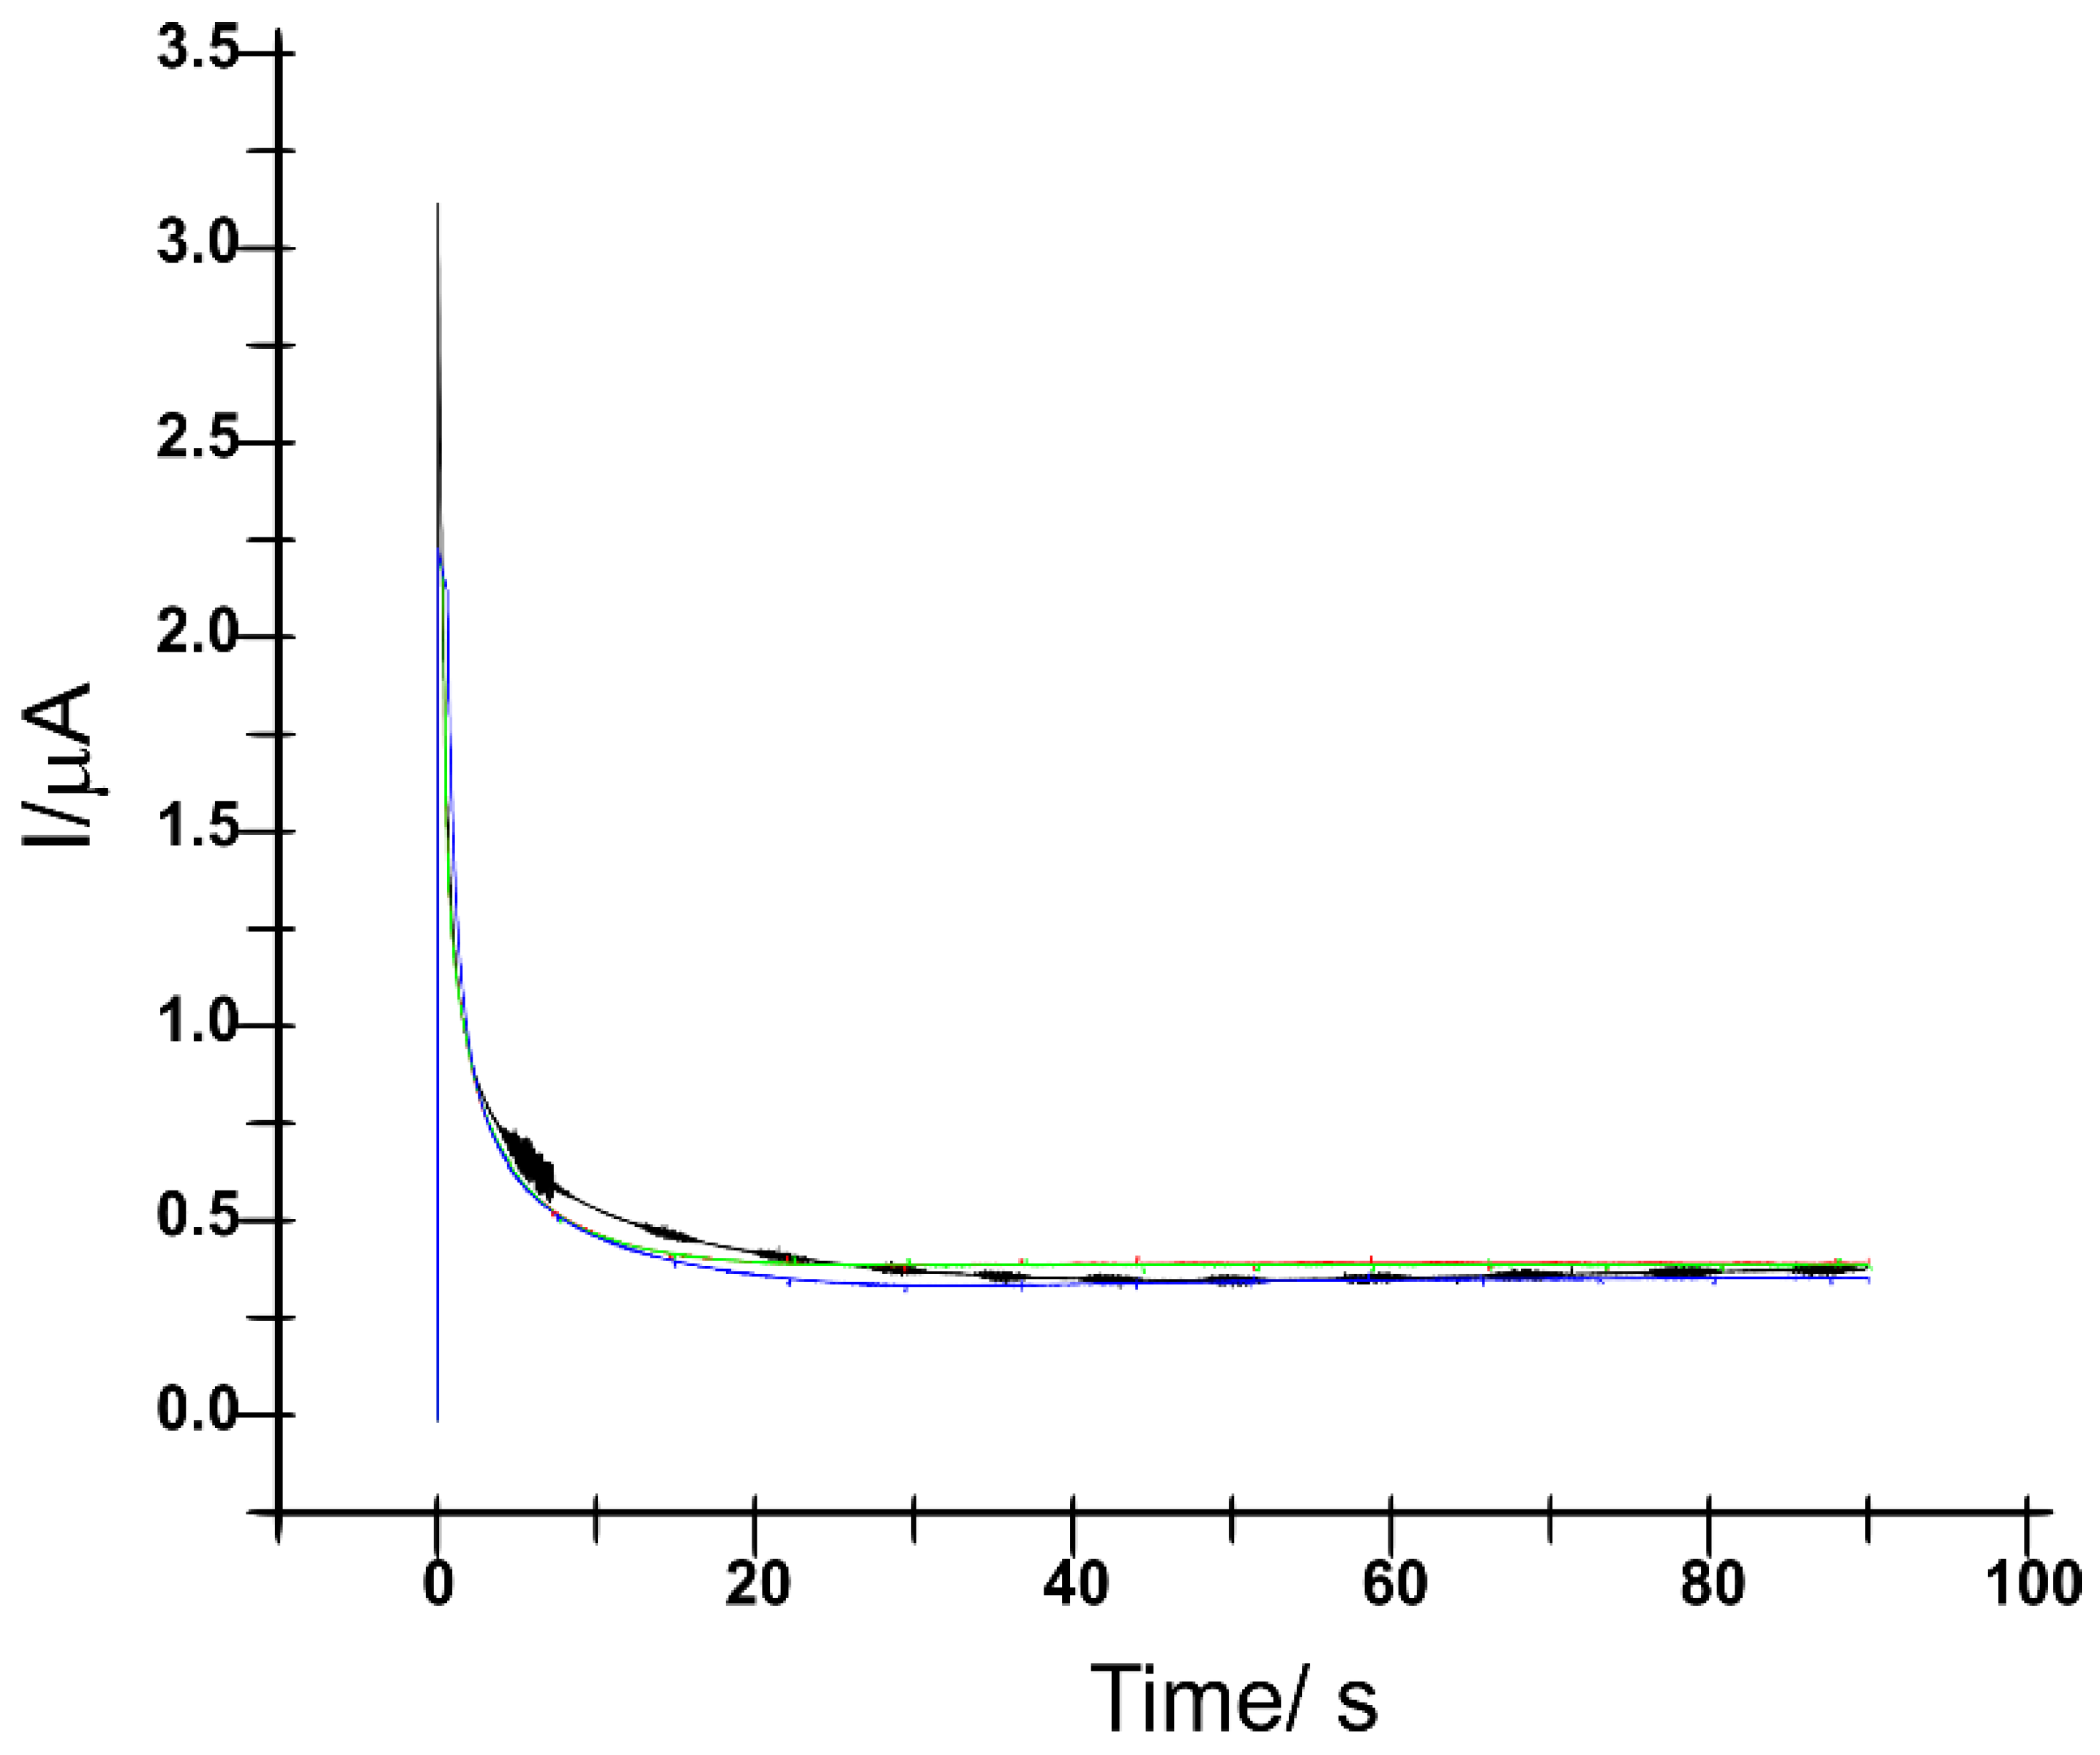
| t (s) | Q (C) | d (μm) |
|---|---|---|
| 60 | 24.57 | 2.86 ± 0.03 |
| 90 | 38.54 | 4.50 ± 0.04 |
| 120 | 40.21 | 4.68 ± 0.04 |
Disclaimer/Publisher’s Note: The statements, opinions and data contained in all publications are solely those of the individual author(s) and contributor(s) and not of MDPI and/or the editor(s). MDPI and/or the editor(s) disclaim responsibility for any injury to people or property resulting from any ideas, methods, instructions or products referred to in the content. |
© 2024 by the authors. Licensee MDPI, Basel, Switzerland. This article is an open access article distributed under the terms and conditions of the Creative Commons Attribution (CC BY) license (https://creativecommons.org/licenses/by/4.0/).
Share and Cite
Bounegru, A.V.; Iticescu, C.; Georgescu, L.P.; Apetrei, C. Development of an Innovative Biosensor Based on Graphene/PEDOT/Tyrosinase for the Detection of Phenolic Compounds in River Waters. Int. J. Mol. Sci. 2024, 25, 4419. https://doi.org/10.3390/ijms25084419
Bounegru AV, Iticescu C, Georgescu LP, Apetrei C. Development of an Innovative Biosensor Based on Graphene/PEDOT/Tyrosinase for the Detection of Phenolic Compounds in River Waters. International Journal of Molecular Sciences. 2024; 25(8):4419. https://doi.org/10.3390/ijms25084419
Chicago/Turabian StyleBounegru, Alexandra Virginia, Catalina Iticescu, Lucian P. Georgescu, and Constantin Apetrei. 2024. "Development of an Innovative Biosensor Based on Graphene/PEDOT/Tyrosinase for the Detection of Phenolic Compounds in River Waters" International Journal of Molecular Sciences 25, no. 8: 4419. https://doi.org/10.3390/ijms25084419