Article

Distinct Driver Pathway Enrichments and a High Prevalence of TSC2 Mutations in Right Colon Cancer in Chile: A Preliminary Comparative Analysis

by
Camilo Tapia-Valladares
1,
Guillermo Valenzuela
1,
Evelin González
2,
Ignacio Maureira
1,3,
Jessica Toro
1,4,
Matías Freire
5,
Gonzalo Sepúlveda-Hermosilla
5,
Diego Ampuero
5,
Alejandro Blanco
2,
Iván Gallegos
1,4,6,
Fernanda Morales
1,
José I. Erices
1,
Olga Barajas
1,4,7,
Mónica Ahumada
1,4,7,
Héctor R. Contreras
1,4,
Jaime González
1,
Ricardo Armisén
2 and
Katherine Marcelain
1,4,*
1
Departamento de Oncología Básico Clínico, Facultad de Medicina, Universidad de Chile, Santiago 8380000, Chile
2
Centro de Genética y Genómica, Instituto de Ciencias e Innovación en Medicina, Facultad de Medicina Clínica Alemana, Universidad del Desarrollo, Santiago 7610507, Chile
3
Departamento de Tecnología Médica, Facultad de Medicina, Universidad de Chile, Santiago 8380000, Chile
4
Centro para la Prevención y Control del Cáncer, CECAN, Universidad de Chile, Santiago 8380000, Chile
5
CORFO Center of Excellence in Precision Medicine, Pfizer Chile, Santiago 8380000, Chile
6
Departamento de Patología, Hospital Clínico de la Universidad de Chile, Santiago 8380453, Chile
7
Departamento de Medicina Interna, Hospital Clínico de la Universidad de Chile, Santiago 8380453, Chile
*
Author to whom correspondence should be addressed.
Int. J. Mol. Sci. 2024, 25(9), 4695; https://doi.org/10.3390/ijms25094695
Submission received: 9 February 2024 / Revised: 2 April 2024 / Accepted: 3 April 2024 / Published: 25 April 2024
(This article belongs to the Special Issue Cancer Genomics and Precision Oncology)

Abstract

:
Colorectal cancer (CRC) is the second leading cause of cancer deaths globally. While ethnic differences in driver gene mutations have been documented, the South American population remains understudied at the genomic level, despite facing a rising burden of CRC. We analyzed tumors of 40 Chilean CRC patients (Chp) using next-generation sequencing and compared them to data from mainly Caucasian cohorts (TCGA and MSK-IMPACT). We identified 388 mutations in 96 out of 135 genes, with TP53 (45%), KRAS (30%), PIK3CA (22.5%), ATM (20%), and POLE (20%) being the most frequently mutated. TSC2 mutations were associated with right colon cancer (44.44% in RCRC vs. 6.45% in LCRC, p-value = 0.016), and overall frequency was higher compared to TCGA (p-value = 1.847 × 10⁻⁵) and MSK-IMPACT cohorts (p-value = 3.062 × 10⁻²). Limited sample size restricts definitive conclusions, but our data suggest potential differences in driver mutations for Chilean patients, being that the RTK-RAS oncogenic pathway is less affected and the PI3K pathway is more altered in Chp compared to TCGA (45% vs. 25.56%, respectively). The prevalence of actionable pathways and driver mutations can guide therapeutic choices, but can also impact treatment effectiveness. Thus, these findings warrant further investigation in larger Chilean cohorts to confirm these initial observations. Understanding population-specific driver mutations can guide the development of precision medicine programs for CRC patients.

1. Introduction

Colorectal cancer (CRC) is the third most common type of cancer in incidence and the second in mortality worldwide, with incidence rates rising among South American countries over the last few years [1]. Among the risk factors are lifestyle behaviors such as diet, physical activity, obesity, alcohol consumption, and tobacco use [2].
CRC originates from the epithelial cells of the colon and rectum through a progressive and sequential accumulation of genetic alterations that primarily transform a normal epithelium into an adenoma and finally into a carcinoma [3]. The mechanisms leading to the production of these genetic alterations can be divided into three different pathways: chromosomal instability (CIN), microsatellite instability (MSI), and CpG island methylator phenotype (CIMP) [4].
CRC can develop throughout the colon and rectum, being more frequent in the distal or left colon, which is comprised of the colon from the splenic flexure up to the rectum. In contrast, the right or proximal colon is the segment including the caecum, ascending colon, and transverse colon. Right colon cancer (RCRC) is more associated with mucinous histology, BRAF mutation, and the MSI pathway, whereas in left colon cancer (LCRC), amplification of EGFR and ERBB2, TP53 mutation, and CIN pathway are more common [5,6,7,8].
Although the mutational landscape in CRC is well known, differences in the frequency of mutations related to ethnicity have been reported; a higher frequency of mutations in PIK3CA, MAP2K1, and NF1 have been seen in tumor samples from patients of African American ethnicity compared to Caucasians [9]. Conversely, a higher frequency of mutations in BRAF has been reported in tumor samples of patients of Caucasian ethnicity when compared with samples from Asian and African American subjects [10] and between the Western and Chinese populations [11].
Anti-EGFR targeted therapy has become the primary treatment option for patients with advanced disease. The presence of mutations in downstream effectors KRAS, NRAS, and BRAF are proven to confer resistance to the treatments with anti-EGFR agents [12,13,14]. Nevertheless, an important proportion of patients have poor or no response to this therapy despite having no detectable mutations in these genes [15,16]. Over the last years, mutations in other genes, such as PIK3CA and PTEN, have been proposed to predict response to anti-EGFR therapy [16,17,18,19,20]. However, these associations remain to be further investigated.
Thus, differences in the tumor mutational landscape between populations may translate into a distinct population-specific prevalence of driver mutations and actionable pathways and, after that, in a particular therapy program.
Numerous studies have been conducted to get a deeper insight into mutations and target therapy association in CRC. However, the Latin American population is often underrepresented in them. This entails, among other things, a need for knowledge about the real benefit this population might get from current and new targeted therapies, or which one better fits this population’s requirements.
This pilot study offers a unique contribution to colorectal cancer research by analyzing cohort of 40 Chilean patients. The admixed genomes of modern Chileans reflect ancestral contributions primarily from Europe and Native America, with a minor African influence. The Native American component originates from two major indigenous groups: the Mapuche from southern Chile, and the Aymara and Quechua populations of the north. Among European influences, Chileans exhibit greater genetic similarity to Spaniards and Italians compared to British or CEU (Utah Residents with Northern and Western European Ancestry) populations.
Given the limited data available on Latin American populations in colorectal cancer research, we focused on a Chilean cohort to gain further insights into the potential for population-specific genomic characteristics.
Comparisons with established cohorts like MSK-IMPACT and TCGA suggest potential differences in mutation frequencies, particularly in the PI3K pathway, where the Chilean cohort appears to have a higher frequency. While the limited sample size restricts definitive conclusions, these initial observations highlight the importance of including more diverse populations in colorectal cancer research. Understanding population-specific variations in driver mutations can inform the development of personalized therapeutic strategies for a wider range of patients.

2. Results

2.1. Clinical and General Characteristics of the Patients

In this study, 40 primary tumors were assessed. In total, 23 of them were from males, and 17 were from females. The median age at the diagnosis was 65.5 (ranging from 25 to 86) years. The histological diagnoses were tubular adenocarcinoma in 45% (18/40) of the cases, adenocarcinoma not otherwise specified (NOS) in 32.5% (13/40), 5% (2/40) papillary tubular adenocarcinomas, 2.5% (1/40) poorly differentiated with signet-cells carcinoma, 2.5% (1/40) adenocarcinoma with mixed mucinous and tubular subtypes, one mucinous adenocarcinoma (2.5%, 1/40), and 10% (4/40) not specified. CRC was mainly found in the left colon (LCRC), with thirty-one tumors, whereas nine were in the right colon (RCRC) (p-value = 1.508 × 10⁻⁶). Patients with LCRC were predominantly males (twenty males vs. eleven females), whereas patients with RCRC were predominantly females (six females vs. three males), but without a statistically significant difference. In addition, we explored the difference in CRC diagnosis based on the self-reported ethnicity of patients; however, we found no difference in the occurrence of LCRC and RCRC depending on ethnicity (Table 1).

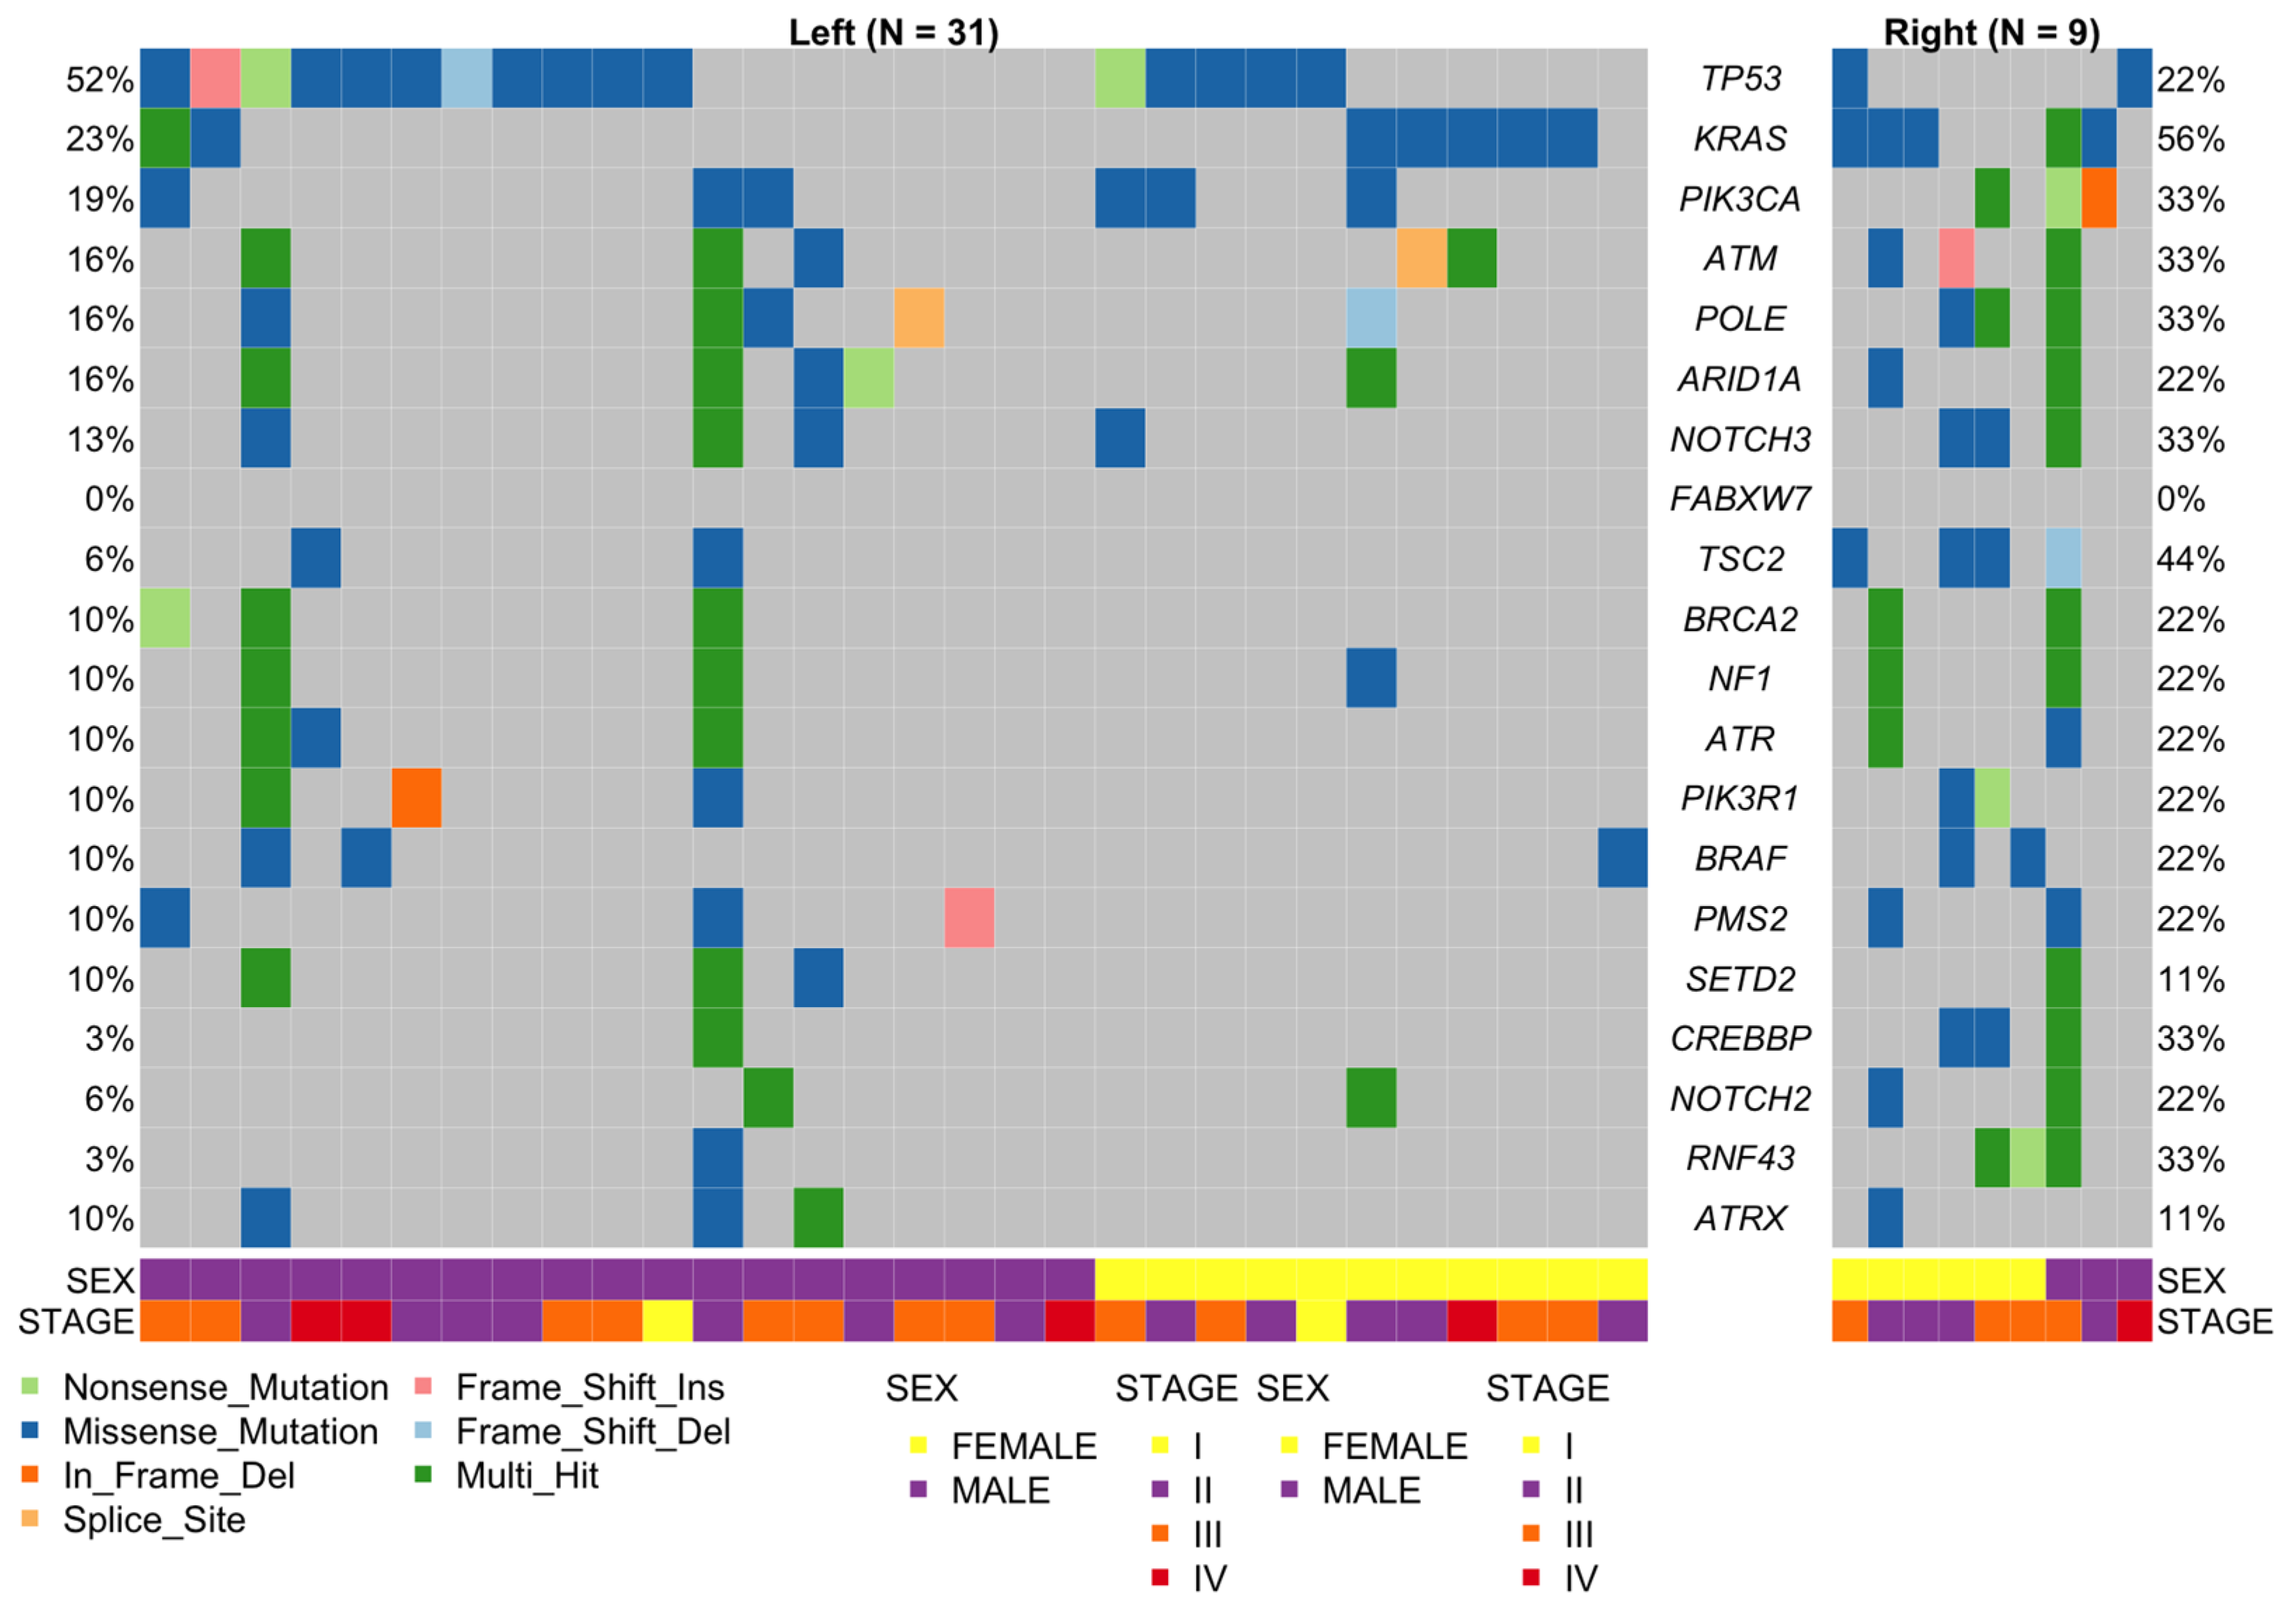
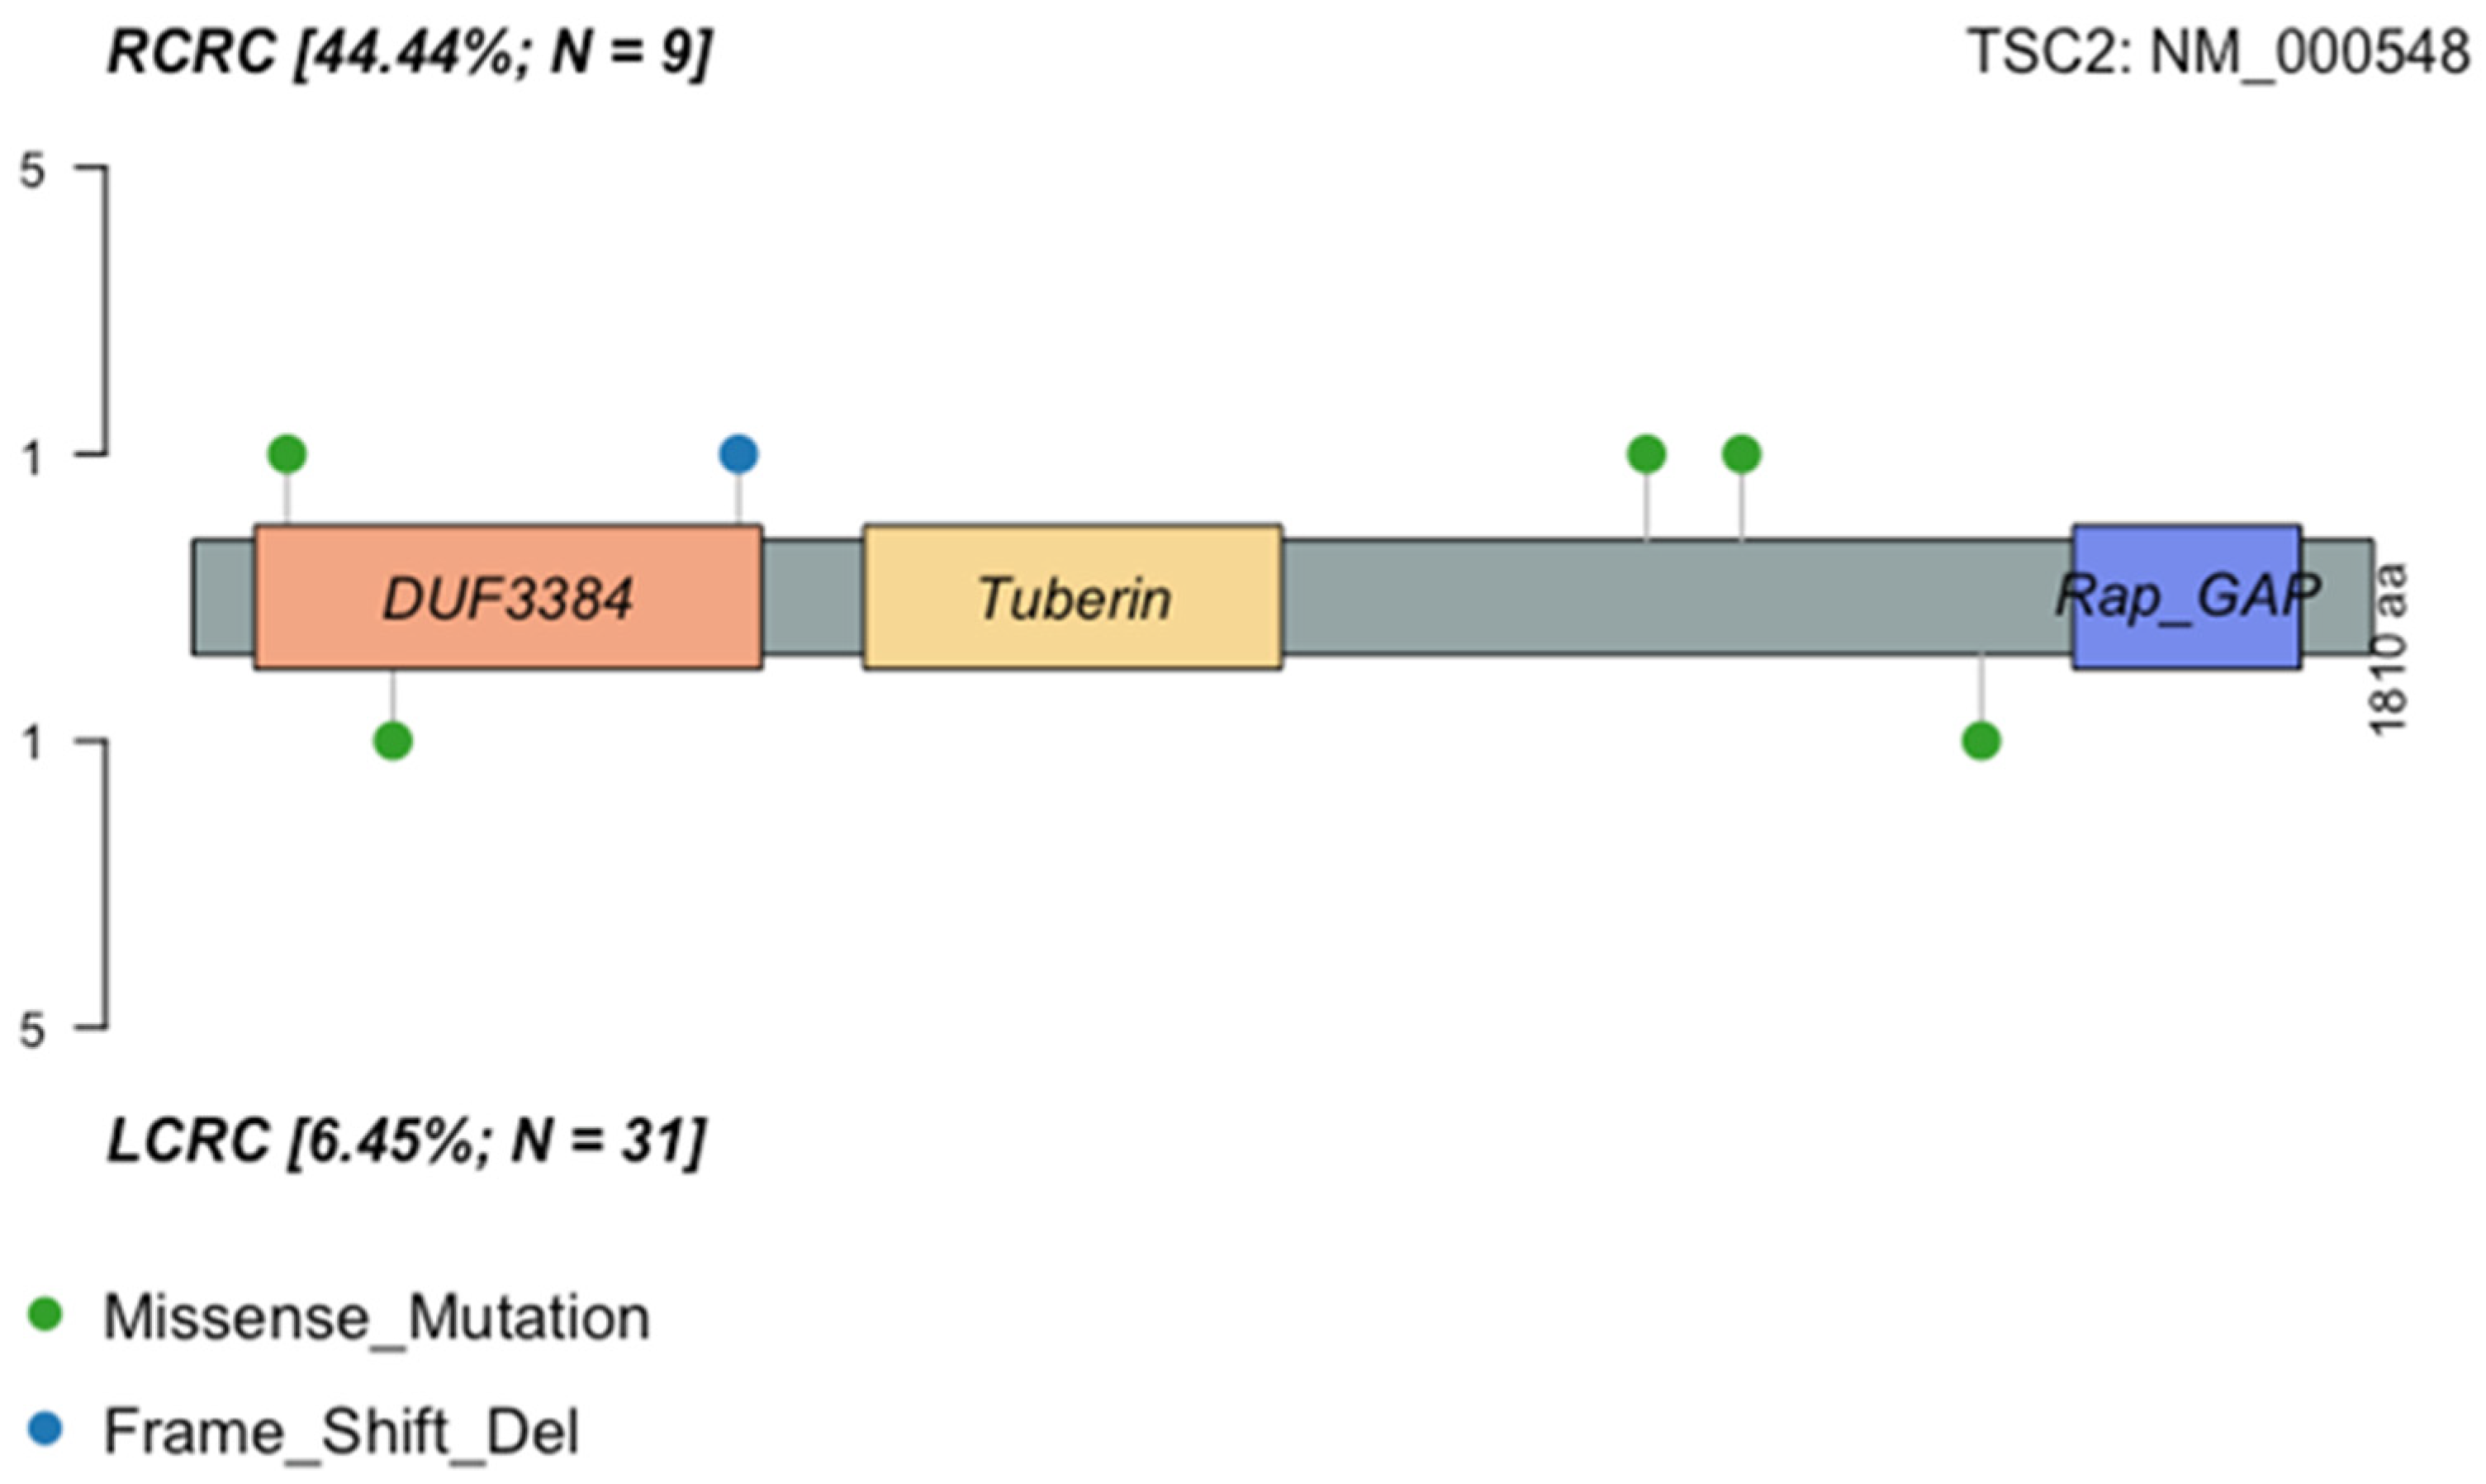
2.2. General Landscape

We detected 388 somatic non-synonymous single-nucleotide variants (SNV) and Indels in 96 out of 135 genes. The most frequent type of mutations were missense mutations (79.12%), followed by nonsense mutations (14.69%). The most frequently mutated genes were TP53 (45%), KRAS (30%), PIK3CA (22.5%), ATM (20%), and POLE (20%) (Figure 1). The median for the number of somatic variants was 3, the lower quartile (25%) was 1, whereas the higher quartile (75%) was 5.75 (ranging from 0 to 81). One patient had no detectable somatic variants (male, tumor of rectum, age at diagnosis 79 years), and there were three hypermutated tumors with 64, 73, and 81 somatic variants. These three individuals were all males, 66, 42, and 52 years old at diagnosis: the first two with left colon cancer and the last with right colon cancer. Unfortunately, no information about MSI status was available for these tumors.
One female patient was very young at diagnosis (25 years, left colon cancer), with MSI high, assessed using IHC (loss of expression of MLH1 and PMS2) and PCR. This patient had no family history of cancer, BRAF mutations, MLH1, PMS2, MSH2, or MSH6 mutations, but, interestingly, had mutations in POLE (c.2091delC) and BAP1 (c.G160A).

2.3. Mutational Status of Actionable Genes in CRC

2.3.1. KRAS, NRAS, and BRAF

Determination of the mutation status of KRAS, NRAS, and BRAF is the primary recommendation for patients being considered for anti-EGFR therapy in two major guidelines [21,22]. Fourteen KRAS mutations were detected in 30% (12/40) of the samples and were concentrated in exon 2, codons 12 and 13 (11 mutations), with two patients having two mutations. The remaining mutations were in exon 2, codon 23, and two in exon 3, codons 59 and 92. On the other hand, only one sample (2.5%) had a mutation NRAS in exon 3, codon 60 (Figure 1 and Supplementary Table S1).
Finally, 12.5% (5/40) of the patients had mutations detected in BRAF. These were concentrated in exon 15, three corresponding to V600E hotspot mutation, while the remaining two were in exon 11 (codon 469) and exon 15 (codon 584).

2.3.2. MLH1, PMS2, MSH2, and MSH6

Mutations in the genes coding for the mismatch repair proteins have been related to mismatch repair deficiency (dMMR) [23], which is a condition that needs to be evaluated for patients being considered for checkpoint inhibitor therapies [24]. Seven patients had mutations in PMS2, MSH2, and/or MSH6, and no mutations were found in MLH1. The patients (six males and one female) had an average age at diagnosis of 60.57 (±11.96, ranging from 42 to 75). Among the men, there was only one RCRC, whereas the only woman had also a RCRC. Five mutations in five patients were seen in PMS2, four missense mutations, and one frameshift insertion. Six mutations in MSH2 were found in four samples. three of them in exon 11, and one in exons 4, 10, and 15. Two were non-previously reported mutations (c.G680T and c.A2495G). Finally, five mutations were found in 7.5% (3/40) of the patients in MSH6. Unfortunately, MSI/MSS statuses were not available for these patients (Figure 1 and Supplementary Table S1).

2.4. Mutational Status of Emerging Predictive and Actionable Genes

2.4.1. PIK3CA

Although there is no current clinical recommendation for PIK3CA testing in CRC samples, mutations in this gene could confer resistance to anti-EGFR therapies and, on the other side, represent an opportunity for therapy [25,26]. Ten mutations were found in 22.5% of the patients (9/40); most of them were in exon 10 (four mutations), followed by exon 2 (three mutations). Two mutations were found in exon 21 and one was found in exon 5. One of the mutations in exon 2 was a novel in-frame deletion (c.335_337del). Other mutated genes in the PI3K-AKT-mTOR pathway were TSC1 (two mutations in two samples, 5%), TSC2 (six mutations in six samples, 15%, Figure 1), and PTEN (six mutations in four samples, 10%). Notably, one patient had three mutations in PTEN, including a non-previously reported mutation in exon 1 (c.G21T). The remainder were all in exons 5 and 8 (three and two, respectively). Finally, four mutations in four samples (10%) were detected in MTOR (Supplementary Table S1).

2.4.2. TP53

Mutations in TP53 have been related to reduced sensitivity to anti-EGFR therapy [27]. Mutations in this gene were found in 45% (18/40) of the patients. Most of them were missense mutations followed by frameshift and nonsense mutations (14, 2, and 2, respectively). Eight were in exon 1, two were in exon 2, three were in exon 3, four were in exon 4, and one was in exon 6.

2.5. Left Versus Right-Sided CRC

Out of the 40 samples sequenced, 31 corresponded to LCRC samples and 9 to RCRC. The mean age at diagnosis for LCRC was 61.35 (range 25–82) years and for RCRC was 71.22 (range 51–86) years, without a statistically significant difference (Wilcoxon test, p-value = 0.062). Several genes were found to tend to be mutated in one location or the other. TP53 was found to be mutated predominantly in LCRC, whereas KRAS, BRAF, and PIK3CA were found to be mainly in RCRC. The only mutation detected in NRAS was found in an LCRC sample. Additionally, diverse genes related to DNA damage repair mechanisms tended to be more frequently mutated in RCRC than in LCRC (BRCA1, BRCA2, MSH6, PMS2, and POLE). However, the only gene with a significant difference was TSC2 (44.44% in RCRC vs. 6.45% in LCRC, p-value = 0.016) (Figure 2 and Figure 3).

2.6. Comparison of Mutation Frequencies in Independent Cohorts

To determine differences or similarities among our cohort (Chilean patients, Chp) and other populations, colorectal cancer data from TCGA and MSK-IMPACT databases was obtained through cBioportal. The OncoKB database for colorectal cancer was consulted for the selection of genes with clinical implications, and mutation frequencies on selected genes were compared among the three cohorts. Despite the limited sample size, significant differences were found for NRAS, (p = 3.563 × 10⁻²), PIK3CA (p = 2.153 × 10⁻²), PTEN (0.04155), PMS2 (p = 8.651 × 10⁻⁵), TP53 (p = 1.698 × 10⁻⁶), and TSC2 (p = 1.463 × 10⁻⁴). All the remaining comparisons did not indicate statistically significant differences when compared all the three groups at once (Supplementary Table S2). Afterward, pairwise comparisons were made to determine if the difference for every gene was between TCGA vs. Chp or MSK-IMPACT vs. Chp. Significant differences, both for TCGA vs. Chp for TSC2 (p = 1.847 × 10⁻⁵) and PMS2 (p = 1.532 × 10⁻²), and MSK-IMPACT vs. Chp for TSC2 (p = 3.062 × 10⁻²) and for PMS2 (p = 1.125 × 10⁻⁴), were found (Figure 4). NRAS, PIK3CA, and TP53 were significant when comparing MSK-IMPACT vs. TCGA (p-values = 2.64 × 10⁻², 7.87 × 10⁻³ and 5.74 × 10⁻⁷, respectively), but not when comparing to Chp (p-values = 0.85, 0.62, and 0.15 for MSK-IMPACT vs. Chp, and p-values = 0.28, 0.64, and 0.73 for TCGA vs. Chp, respectively). PIK3R1 and PTEN showed a higher frequency of mutations in Chp compared to TCGA (15% vs. 5.38%, p-value = 0.06 and 15% vs. 4.93%, p-value = 0.042) (Figure 4).

2.7. Left Versus Right Sided CRC in MSK-IMPACT and TCGA Cohorts

LCRC and RCRC were compared independently in both the MSK-IMPACT and the TCGA cohorts. Except for TP53, all the remaining statistically significant differences were related to genes more frequently mutated in RCRC when compared to LCRC in both cohorts. Common to both cohorts were the differences found in BRAF, PIK3CA, and TP53, whereas statistically significant differences were found in ARID1A, BRCA2, CDK12, FGFR3, KRAS, MTOR, NF1, NTRK1, NTRK3, MSH2, MSH6, POLE, PTEN, RB1, TSC1, and TSC2 only in the MSK-IMPACT cohort, although with a tendency for agreement with the TCGA cohort, with exception of TSC2, which has no mutated cases in the RCRC cases (Table 2).

2.8. Pathway Analyses

To determine if there were any other differences not being detected by comparing individual genes, a general comparison based on mutated genes of the RTK-RAS and PI3K pathways among cohorts was made using the OncogenicPathways tool from the Maftools package. A significantly higher fraction of samples with altered PI3K pathway was found in the Chp and the MSK-IMPACT cohorts when compared to TCGA (45%, 38.52%, and 25.56%, respectively, p-values = 0.02 for Chp vs. TCGA, and 0.000921 for MSK-IMPACT vs. TCGA). Overall, there was not a significant difference as a group in the RTK-RAS pathway. However, a statistically significant difference was found between Chp and MSK-IMPACT in a pairwise comparison (57.5% vs. 74.12%, p-value = 0.03622), whereas for Chp vs. TCGA, the p-value was not low enough, but a tendency was observed (57.5% vs. 72.65%, respectively, p-value = 0.08) (Figure 5).
A gene-to-gene comparison was made to further investigate the difference between TCGA and Chp cohorts regarding the PI3K pathway. Significant differences were found in the frequencies of mutations in TSC2 (p = 1.85 × 10⁻⁵) and PTEN (p = 0.042). Moreover, there is a general tendency for the Chp cohort to have a higher proportion of mutations in genes of this pathway, having a higher frequency in 10 out of the 12 genes analyzed (Figure 6). Additionally, although there was not a significant difference in the pairwise comparison between Chp and MSK-IMPACT, a gene-to-gene comparison showed a significant difference in TSC2 mutation frequency (p = 3.062 × 10⁻², Figure 4).

2.9. General Characteristics of the PI3K Pathway Altered Samples

Among the 18 samples with at least one of the PI3K pathway genes mutated, there was no significant difference between LCRC and RCRC (12/31 LCRC and 6/9 RCRC, p-value = 0.2534, Fisher’s exact test). Also, there was no difference between mutated and non-mutated samples either in LCRC or RCRC (p-values = 0.1269 and 0.3469, respectively, Fisher’s exact test). Men and women were affected equally (10/23 and 8/17, respectively, p-value = 1, Fisher’s exact test). The mean age at diagnosis was 65 years (range 25–86). Half of the samples have coexistent mutations in KRAS, NRAS, or BRAF (Figure 7).

3. Discussion

Somatic mutations and their frequencies in CRC have been assessed in many studies, and population-associated differences have been described. Indeed, some of the most frequently mutated genes in CRC have a wide range of variation in the mutation frequency according to ethnicity. For example, studies in patients of African and European ancestry have reported a higher prevalence of KRAS (60% vs. 50%) and PIK3CA (20% vs. 17%) mutations in African patients. Also, African patients have a lower prevalence of BRAF V600 mutations (2.0% vs. 6.0%) [28], and a Chinese cohort of 652 subjects showed frequencies of 23.7%, 25.8%, and 9.81% for KRAS, TP53, and PIK3CA [29]. Even further, dos Santos et al. found differences among the Brazilian population according to their ancestry; individuals with the highest proportion of African ascendancy had more frequent NF1 and BRAF mutations, whereas those with the highest proportion of Native American ancestry had fewer TP53 and PIK3CA mutations when compared to those of intermediate and the lowest proportion of Native American ancestry [30].
Knowing the frequency of specific mutations with diagnostic, therapeutic, and prognostic value is important to establish proper public health policies, for example, regarding treatment strategies and access.

3.1. Frequency of CRC Mutations in LATAM Cohorts

Unfortunately, detailed descriptions of mutation frequencies in the Latin American population are limited [31]. A study of 30 CRC Colombian patients reported frequencies of 13.3% in KRAS and 6.6% TP53 mutations [32]. In a Chilean CRC cohort of 106 patients, mutation frequencies of 26%, 12%, and 18% for KRAS, BRAF, and PI3KCA, respectively, were reported [8]. In both studies, mutation frequencies for KRAS, BRAF, PIK3CA, and TP53 were lower compared to the results obtained in this work. This difference can be explained by the methodology, since authors used qPCR and Sanger sequencing in these studies, limiting the analysis to specific codons or small regions. In fact, using NGS in a Brazilian cohort of 91 patients, dos Santos et al., found mutation frequencies similar to our results in TP53 (56%), BRAF (8.8%), FBXW7 (11%), and PIK3CA (15.4%) [30]. Nevertheless, they also found a higher incidence of KRAS mutations (52.7% vs. 30% in Chp) and a lower incidence of ATM mutations (6% vs. 20% in Chp). On the other hand, Takenaka et al. found different mutation frequencies in advanced rectal cancer from Brazilian and Argentinian patients in TP53 (78.1% vs. 11%, respectively), KRAS (40.9% vs. 6%) and FBXW7 (17.5% vs. 6%). It is important to mention that both dos Santos et al. and Takenaka et al. found APC as the most mutated gene in their cohorts [30,33]. Unfortunately, we do not know the mutation frequency in our cohort, since this gene was not analyzed.

3.2. Comparison of CRC Mutations with TCGA and MSK-IMPACT Cohorts

We also find differences in mutation frequencies when comparing Chp with other well-characterized cohorts, TCGA and MSK. Although information about the ethnicity of the patients in these cohorts was not completely available, they are mainly Caucasian [34,35]. The most notable finding was the higher frequency of TSC2 and PMS2 mutations in the Chilean cohort, compared to TCGA and MSK. TSC2 mutations were also frequent in a Chinese cohort, and were associated with bad prognosis [36].
The six TSC2 mutations found in six samples (1 per sample) were manually curated to discard any potential technical artifact (Figure 3). Five mutations were predicted deleterious using at least five prediction tools. These mutations have a COSMIC ID, with one entry in “large intestine”, and were classified as “somatic” according to a pipeline previously described [37]. Nevertheless, all six variants were looked for in large population germline variant databases ExAc and GnomAD (overall and population specific); ABraOM (Brazilian genomic variants); BIPMed (Brazilian Initiative on Precision Medicine); and in a local Chilean database. In all databases, these variants had a VAF mostly 0 or <0.0001. Nevertheless, one of these mutations with COSMIC ID was found with a VAF > 0.5 in the tumor, and thus a germline origin cannot be discarded in this case.
Regarding PMS2 mutations, five mutations were found in five patients (one per sample), with VAF ranging from 0.05 to 0.48. Three mutations were found in LCRC and two in RCRC. Two of the mutations found in LCRC were classified as “novel”, c.T619C and c.460dupT.

3.3. Left vs. Right CRC

Regarding laterality, we observed previously described differences between LCRC and RCRC: LCRC was more frequent than RCRC; KRAS, BRAF, and PIK3CA were more frequently mutated in RCRC [6,38,39]; and TP53 mutations were predominantly found in LCRC. These differences were also observed in the TCGA and MSK-IMPACT cohorts [39,40]. Given the small sample size (especially for RCRC), these differences were not significant in Chp. Nevertheless, a significant difference in the frequency of TSC2 mutations was found between RCRC and LCRC, being higher in RCRC. As far as we know, this finding has not been reported before.
Although the MSK-IMPACT cohort has more significant differences between mutated genes on both sides, compared to TCGA, there is a tendency to agree between them. However, some differences could also be seen; for example, FGFR1, FGFR2, and MSH2 were mainly mutated in RCRC in MSK-IMPACT, whereas the opposite was seen in TCGA. TSC2 was more frequently mutated in RCRC in the MSK-IMPACT cohort, whereas in TCGA samples, only two mutations were found in LCRC and no mutations in RCRC.
TSC1/TSC2 genes are part of the PI3K/AKT/mTOR pathway, which are the main negative regulators of mTOR activation. In the normal activation of the PI3K pathway, Akt phosphorylates TSC1/TSC2, allowing the activation of mTOR through the GTP-binding protein Rheb [41,42]. Mutations in TSC1/TSC2 can lead to mTOR overactivation, promoting tumor growth [43]. The role of somatic mutations in TSC2 is not described in CRC, but a study has shown that it could be associated with a worse prognosis when performing a combined prognostic model of mutations in five genes [36]. TSC2 mutations or other PI3K components are supposed to sensitize tumors to mTOR inhibitors such as everolimus or sirolimus, which have been proposed as possible targeted therapies in other non-colorectal solid cancers [44,45,46,47]. Moreover, TSC2 mutations may eventually affect EGFR-TKI response, since PI3K-AKT-mTOR pathway activation has been described as an important resistance mechanism in patients treated with EGFR TKIs (see below).

3.4. Comparison between Oncogenic Pathways

Hyperactivation of the PI3K/AKT/mTOR pathway may be an opportunity for treatment with mTOR inhibitor therapy, which has been suggested to have a beneficial effect when not associated with KRAS mutations [48]. Previous studies have found greater activation of this PI3K pathway in populations of African ancestry compared to populations of European ancestry [28]. On the other hand, a similar frequency of activation of the PI3K pathway was found in a Brazilian cohort to those we observed in TCGA (23.1% and 25.56%, respectively) [30]. Here, we found greater activation of the PI3K pathway compared to the TCGA cohort (45% in Chp vs. 25.56%). This is caused not only by the significant increase in TSC2 mutations, but also PIK3R1 and PTEN, which showed a higher frequency of mutations in Chp compared to TCGA (15% vs. 5.38%, p-value = 0.06 and 15% vs. 4.93%, p-value = 0.042).
As mentioned above, in addition to response to mTOR inhibitors, the oncogenic activation of the PI3K/AKT/mTOR pathway members have been involved in the resistance to EGFR/BRAF inhibitors. For instance, a PIK3R1 mutation emerged in a patient with a BRAF V600E mutation after dual treatment with cetuximab and vemurafenib, suggesting a possible role in acquired resistance to this therapy [20], whilst PIK3CA and PTEN mutations became detectable in circulating tumor DNA from metastatic CRC patients after treatment with panitumumab [49]. Colon cancer cell lines showed increased resistance to cetuximab when PTEN expression is lost or PIK3CA is mutated, and an even higher degree of resistance when any of these alterations is concurrently present with RAS/BRAF mutations [50]. Additionally, PTEN loss of expression has been associated with resistance to cetuximab in metastatic CRC [51,52]. Thus, it is plausible to expect that PTEN loss-of-function variants might influence the performance of a patient to anti-EGFR therapy.
We also observed a slightly higher, but not significant, mutation frequency in PIK3CA (17.94% TCGA vs. 25% Chp, p-value = 0.4069). Mutations in this gene have been previously associated with resistance to first-line chemotherapy, poor prognosis [17], and resistance to EGFR-targeted therapy [52]. However, this latter point could be controversial, as the predictive value of PIK3CA mutations might be restricted to those affecting exon 20 [18].
Genetic background likely explains some of the previously observed differences between Latin Americans, and specifically between Chileans and international cohorts. In Chile, the average individual possesses roughly 48% Native American ancestry with less than 3% African ancestry, significantly lower than populations like Brazilians and Colombians [34]. Furthermore, Chilean European ancestry (around 50%) shows greater similarity to Spaniards and Italians, who are also underrepresented in cohorts like TCGA and MSK [35,53]. While this study only captured self-reported ethnicity data from 17 patients, most identified as “Chilean” (admixed), and all originated from a region with a predominantly admixed population, reflecting the average genetic makeup of Chile. Future studies with larger sample sizes and combined genetic ancestry and self-reported ethnicity data would provide a more comprehensive picture and enable subgroup analysis based on ethnicity.
A population’s specific genetic composition, interacting with its geographical and/or cultural environment, may influence the activation of certain carcinogenic pathways, leading to variations in tumor mutational profiles. For instance, some genetic loci exhibit highly divergent allele frequencies across diverse geographic regions or ancestries. One such locus in Chileans displays significant allele frequency differentiation within the Low-density lipoprotein Receptor Related Protein 1B (LRP1B) gene, previously linked to obesity, a known CRC risk factor [54,55]. LRP1B functions as a tumor suppressor, regulating the extracellular environment to limit cancer cell invasion [56]. Notably, recent research also suggests LRP1B regulates the PI3K/AKT pathway in Hepatocellular Carcinoma (HCC) [57]. Therefore, polymorphisms in this gene, combined with high-fat diets, could potentially explain the rising obesity and CRC rates in Chile, along with the higher prevalence of PI3K pathway mutations described in this work.

4. Materials and Methods

4.1. Samples and Sequencing

Formalin-fixed paraffin-embedded (FFPE) tumor samples were obtained from forty Chilean CRC patients (Chp) treated at the University Hospital and collected through the “Biobanco de Tejidos de la Universidad de Chile, BTUCH”. DNA was isolated using RecoverAll™ Total Nucleic Acid Isolation Kit (ThermoFisher, Waltham, MA, USA). In total, 20ng of DNA were used to library preparation using the Oncomine™ Comprehensive Assay V3 (Thermo Fisher Scientific) following product instructions. Sequencing was performed in an Ion S5™ Sytem using Ion 550 kit-CHEF (Thermo Fisher Scientific).

4.2. Bioinformatic Analysis, Variant Calling and Classification

The preprocessing and data processing were carried out using the Oncomine Comprehensive Assay v3 (OCA) v5.18 DNA workflow, using default parameters and the hg19 genome reference. For alignment and variant calling, stringent parameters were defined. Single Nucleotide Variants (SNV) required a minimum allele frequency of 5%, while Indels required 7%. The minimum coverage for a variant to be considered was set at 10× for SNV and Indels. Additionally, the minimum coverage for the variant location was set at 50×.
Variant annotation was performed using ANNOVAR [58] including RefGene, GnomAD v2.1.1, ESP6500, ExAC v0.3, 1000 Genomes phase 3, CADD v1.3, dbSNP v150, COSMIC v94, CLINVAR 2021, ICGC28, ABraOM, and Snp138NonFlaged. To enhance the filtering of germline variants in tumor samples, large and local population germline variant databases were interrogated: ExAc and GnomAD (overall and population specific); BIPMed (Brazilian Initiative on Precision Medicine); and a Chilean database composed by variants imputed from genotyping 2 arrays with 1313 and 2249 samples from Chilean individuals [59,60], and whole exome sequencing (WES) data from 87 individuals [61].

4.3. Public Databases

Mutation data of CRC samples were extracted from The Cancer Atlas Genome firehose legacy and Memorial Sloan Kettering Clinical Sequencing cohorts [56] (hereafter TCGA and MSK-IMPACT, respectively) through cBioportal (https://www.cbioportal.org, accessed on 25 march 2022). Only somatic protein-affecting variants found in primary tumors were analyzed in both datasets. The sample size for the TCGA and MSK-IMPACT cohorts were 223 and 514, respectively.

4.4. Gene Selection

The OncoKB database (https://www.oncokb.org, accessed on 7 July 2022) was consulted to select genes for further comparisons between different cohort data sets. To do that, filtering based on colorectal cancer was done, choosing all the genes affected by alterations other than those resulting from large structural alterations (amplifications, translocations, etc.) and including those valid both for colorectal cancer and for “all solid tumors”, disregarding the level of evidence. These genes were: BRAF, KRAS, NRAS, NTRK1, NTRK3, ARID1A, CDK12, CDKN2A, FGFR1, FGFR2, FGFR3, MTOR, NF1, and PTEN. Although specific alterations were associated with drugs in some cases, here we compared all mutations affecting those genes in all cohorts.
Other genes classically related to CRC or with potential interest were also considered. Those genes were: BRCA1, BRCA2, MLH1, MSH2, MSH6, PMS2, POLE, RB1, TP53, TSC1, and TSC2.

4.5. Pathways Analyses

Pathways analyses were made using the OncogenicPathways tool from the Maftool package, separately considering the RTK-RAS and PI3K pathways. Given that MSK-IMPACT, TCGA, and Chp cohorts were sequenced using different approaches, only mutations in shared gene regions were performed.

4.6. Statistical Data Analysis

Differences in age at diagnosis between right and left CRC were done using the Wilcoxon test. Fisher’s exact test was used to compare mutation frequencies within the Chp cohort (either when comparing RCRC and LCRC, men and women, etc.). The Chi-square test was performed for comparing mutation frequencies among all three cohorts. p-values were adjusted according to the Benjamini–Hochberg’s method [62], and pairwise Chi-square test with Yates’ continuity correction was used for post hoc comparison in case of a significant p-value (<0.05). All statistical and data analyses were done using R 4.1.1 software. Grouped bar plots, oncoplots, and pathway plots were generated using ggplot2 and MafTools packages in R 4.1.1 software.

5. Conclusions

In this preliminary work, we found differences in TSC2 and PMS2 mutation frequency and PI3K oncogenic pathway activation in a cohort of 40 CRC from Chilean patients compared to other cohorts. These differences could be related to ethnicity and genetic background. However, given that the small size of this study does not allow further stratification of patients and tumors, intrinsic disease-related factors could also contribute to differences [53,54].
Nevertheless, these findings may have a high impact on clinical decisions at individual and public health levels. For instance, our study group showed lower frequency of mutations in the TRK/RAS pathway than international cohorts, suggesting that Chilean patients may benefit from anti-EGFR therapies. However, on the other side, the most frequently mutated genes/pathways are associated with resistance to these medications.
Further exploration in larger follow-up studies with a significantly larger sample size and complete demographic and genetic information are needed to validate these results and to definitively assess TSC2 mutation frequency, its association with tumor location, and the influence of genetic background and other factors on the oncogenic process.
These findings highlight the urgent need of tumor characterization of all under-represented populations and increase diversity in late-stage clinical trials.

Supplementary Materials

The following supporting information can be downloaded at: https://www.mdpi.com/article/10.3390/ijms25094695/s1.

Author Contributions

Conceptualization, C.T.-V. and K.M.; Data curation, C.T.-V., E.G. and K.M.; Formal analysis, C.T.-V., G.V., E.G., I.M., M.F., G.S.-H., D.A., A.B., J.I.E. and H.R.C.; Funding acquisition, J.G., R.A. and K.M.; Investigation, I.G., O.B. and M.A.; Methodology, C.T.-V., E.G., I.M., J.T., M.F., G.S.-H., D.A., A.B. and F.M.; Resources, I.G., O.B., M.A., J.G. and R.A.; Supervision, R.A. and K.M.; Writing—original draft, C.T.-V., G.V., J.I.E. and K.M.; Writing—review and editing, C.T.-V., G.V., E.G., I.M., J.T., M.F., G.S.-H., D.A., A.B., I.G., F.M., J.I.E., O.B., M.A., H.R.C., J.G., R.A. and K.M. All authors have read and agreed to the published version of the manuscript.

Funding

This research was funded by ANID, Grants No. ACT210079, FONIS SA20I0059, FONDEF IT16I10051, FONDEF ID21I10355, FONDAP 152220002 (CECAN) & CORFO International Center of Excellence Program #13CEE2-21602.

Institutional Review Board Statement

The study was conducted in accordance with the Declaration of Helsinki, and approved by the “Scientific or Research Ethics Committee of the Hospital Clínico Universidad de Chile (HCUCH)” (X9001083 protocol, Acta No. 17/2017).

Informed Consent Statement

All subjects involved in the gave their informed consent.

Data Availability Statement

TCGA data were downloaded from https://www.cbioportal.org/study/summary?id=coadread_tcga, and MSK-IMPACT was downloaded from https://www.cbioportal.org/study/summary?id=msk_impact_2017, both accessed on 25 March 2022. Data generated during this study will be available upon request.

Acknowledgments

We thank Alicia Colombo and the staff from the “Biobanco de Tejidos de la Universidad de Chile” (BTUCH), Daniela Diez, and Vania Montecinos for sample processing and clinical data collection.

Conflicts of Interest

G.S.-H., A.B., R.A., and M.F. were Pfizer Chile employees. K.M. received a grant and non-financial support for to perform this work from CEMP Pfizer Chile. R.A. declares honoraria for conferences, advisory boards, and educational activities from Roche, grants and support for scientific research from Illumina, Pfizer, Roche, and Thermo Fisher Scientific, and honoraria for conferences from Thermo Fisher Scientific, Janssen, and Tecnofarma. The other authors declare that they have no competing interests. The funders had no role in the design of the study; in the collection, analyses, or interpretation of data; in the writing of the manuscript; or in the decision to publish the results.

References

  1. Sung, H.; Ferlay, J.; Siegel, R.L.; Laversanne, M.; Soerjomataram, I.; Jemal, A.; Bray, F. Global Cancer Statistics 2020: GLOBOCAN Estimates of Incidence and Mortality Worldwide for 36 Cancers in 185 Countries. CA Cancer J Clin. 2021, 71, 209–249. [Google Scholar] [CrossRef] [PubMed]
  2. Sawicki, T.; Ruszkowska, M.; Danielewicz, A.; Niedźwiedzka, E.; Arłukowicz, T.; Przybyłowicz, K.E. A Review of Colorectal Cancer in Terms of Epidemiology, Risk Factors, Development, Symptoms and Diagnosis. Cancers 2021, 13, 2021. [Google Scholar] [CrossRef] [PubMed]
  3. Fearon, E.R.; Vogelstein, B. Genetic Model for Colorectal Tumorigenesis. Cell 1990, 61, 759–767. [Google Scholar] [CrossRef] [PubMed]
  4. Mármol, I.; Sánchez-de-Diego, C.; Pradilla Dieste, A.; Cerrada, E.; Rodriguez Yoldi, M.J. Colorectal carcinoma: A General Overview and Future Perspectives in Colorectal Cancer. Int. J. Mol. Sci. 2017, 18, 197. [Google Scholar] [CrossRef] [PubMed]
  5. Salem, M.E.; Weinberg, B.A.; Xiu, J.; El-Deiry, W.S.; Hwang, J.J.; Gatalica, Z.; Philip, P.A.; Shields, A.F.; Lenz, H.J.; Marshall, J.L. Comparative molecular analyses of left-sided colon, right-sided colon, and rectal cancers. Oncotarget 2017, 8, 86356–86368. [Google Scholar] [CrossRef] [PubMed]
  6. Missiaglia, E.; Jacobs, B.; D’Ario, G.; Di Narzo, A.F.; Soneson, C.; Budinska, E.; Popovici, V.; Vecchione, L.; Gerster, S.; Yan, P.; et al. Distal and proximal colon cancers differ in terms of molecular, pathological, and clinical features. Ann. Oncol. 2014, 25, 1995–2001. [Google Scholar] [CrossRef]
  7. Baran, B.; Mert Ozupek, N.; Yerli Tetik, N.; Acar, E.; Bekcioglu, O.; Baskin, Y. Difference Between Left-Sided and Right-Sided Colorectal Cancer: A Focused Review of Literature. Gastroenterol. Res. 2018, 11, 264–273. [Google Scholar] [CrossRef]
  8. Wielandt, A.M.; Hurtado, C.; Moreno, C.M.; Villarroel, C.; Castro, M.; Estay, M.; Simian, D.; Martinez, M.; Vial, M.T.; Kronberg, U.; et al. Characterization of Chilean patients with sporadic colorectal cancer according to the three main carcinogenic pathways: Microsatellite instability, CpG island methylator phenotype and Chromosomal instability. Tumor Biol. 2020, 42, 7–21. [Google Scholar] [CrossRef]
  9. Heath, E.I.; Lynce, F.; Xiu, J.; Ellerbrock, A.; Reddy, S.K.; Obeid, E.; Liu, S.V.; Bolling-Fischer, A.; Separovic, D.; Vanderwalde, A. Racial disparities in the molecular landscape of cancer. AntiCancer Res. 2018, 38, 2235–2240. [Google Scholar] [CrossRef]
  10. Hanna, M.C.; Go, C.; Roden, C.; Jones, R.T.; Pochanard, P.; Javed, A.Y.; Javed, A.; Mondal, C.; Palescandolo, E.; Van Hummelen, P.; et al. Colorectal Cancers from Distinct Ancestral Populations Show Variations in BRAF Mutation Frequency. PLoS ONE 2013, 8, e74950. [Google Scholar] [CrossRef]
  11. Zhang, J.; Zheng, J.; Yang, Y.; Lu, J.; Gao, J.; Lu, T.; Sun, J.; Jiang, H.; Zhu, Y.; Zheng, Y.; et al. Molecular spectrum of KRAS, NRAS, BRAF and PIK3CA mutations in Chinese colorectal cancer patients: Analysis of 1110 cases. Sci. Rep. 2015, 5, 18678–18686. [Google Scholar] [CrossRef] [PubMed]
  12. De Roock, W.; Claes, B.; Bernasconi, D.; De Schutter, J.; Biesmans, B.; Fountzilas, G.; Kalogeras, K.T.; Kotoula, V.; Papamichael, D.; Laurent-Puig, P.; et al. Effects of KRAS, BRAF, NRAS, and PIK3CA mutations on the efficacy of cetuximab plus chemotherapy in chemotherapy-refractory metastatic colorectal cancer: A retrospective consortium analysis. Lancet Oncol. 2010, 11, 753–762. [Google Scholar] [CrossRef] [PubMed]
  13. Hsu, H.C.; Thiam, T.K.; Lu, Y.J.; Yeh, C.Y.; Tsai, W.S.; You, J.F.; Hung, H.Y.; Tsai, C.N.; Hsu, A.; Chen, H.C.; et al. Mutations of KRAS/NRAS/BRAF predict cetuximab resistance in metastatic colorectal cancer patients. Oncotarget 2016, 7, 22257–22270. [Google Scholar] [CrossRef] [PubMed]
  14. Lièvre, A.; Bachet, J.B.; Le Corre, D.; Boige, V.; Landi, B.; Emile, J.F.; Côté, J.F.; Tomasic, G.; Penna, C.; Ducreux, M.; et al. KRAS mutation status is predictive of response to cetuximab therapy in colorectal cancer. Cancer Res. 2006, 66, 3992–3995. [Google Scholar] [CrossRef] [PubMed]
  15. Moiseyenko, V.M.; Moiseyenko, F.V.; Yanus, G.A.; Kuligina, E.S.; Sokolenko, A.P.; Bizin, I.V.; Kudriavtsev, A.A.; Aleksakhina, S.N.; Volkov, N.M.; Chubenko, V.A.; et al. First-Line Cetuximab Monotherapy in KRAS/NRAS/BRAF Mutation-Negative Colorectal Cancer Patients. Clin. Drug Investig. 2018, 38, 553–562. [Google Scholar] [CrossRef]
  16. De Roock, W.; De Vriendt, V.; Normanno, N.; Ciardiello, F.; Tejpar, S. KRAS, BRAF, PIK3CA, and PTEN mutations: Implications for targeted therapies in metastatic colorectal cancer. Lancet Oncol. 2011, 12, 594–603. [Google Scholar] [CrossRef]
  17. Wang, Q.; Shi, Y.L.; Zhou, K.; Wang, L.L.; Yan, Z.X.; Liu, Y.L.; Xu, L.L.; Zhao, S.W.; Chu, H.L.; Shi, T.T.; et al. PIK3CA mutations confer resistance to first-line chemotherapy in colorectal cancer. Cell Death Dis. 2018, 9, 739–750. [Google Scholar] [CrossRef]
  18. Mao, C.; Yang, Z.Y.; Hu, X.F.; Chen, Q.; Tang, J.L. PIK3CA exon 20 mutations as a potential biomarker for resistance to anti-EGFR monoclonal antibodies in KRAS wild-type metastatic colorectal cancer: A systematic review and meta-analysis. Ann. Oncol. 2012, 23, 1518–1525. [Google Scholar] [CrossRef]
  19. Therkildsen, C.; Bergmann, T.K.; Henrichsen-Schnack, T.; Ladelund, S.; Nilbert, M. The predictive value of KRAS, NRAS, BRAF, PIK3CA and PTEN for anti-EGFR treatment in metastatic colorectal cancer: A systematic review and meta-analysis. Acta Oncol. 2014, 53, 852–864. [Google Scholar] [CrossRef]
  20. Sartore-Bianchi, A.; Martini, M.; Molinari, F.; Veronese, S.; Nichelatti, M.; Artale, S.; Di Nicolantonio, F.; Saletti, P.; De Dosso, S.; Mazzucchelli, L.; et al. PIK3CA mutations in colorectal cancer are associated with clinical resistance to EGFR-targeted monoclonal antibodies. Cancer Res. 2009, 69, 1851–1857. [Google Scholar] [CrossRef]
  21. Benson, A.B.; Venook, A.P.; Al-Hawary, M.M.; Arain, M.A.; Chen, Y.J.; Ciombor, K.K.; Cohen, S.; Cooper, H.S.; Deming, D.; Farkas, L.; et al. Colon cancer, Version 2.2021, NCCN Clinical Practice Guidelines in Oncology. J. Natl. Compr. Cancer Netw. 2021, 19, 329–359. [Google Scholar] [CrossRef] [PubMed]
  22. Sepulveda, A.R.; Hamilton, S.R.; Allegra, C.J.; Grody, W.; Cushman-Vokoun, A.M.; Funkhouser, W.K.; Kopetz, S.E.; Lieu, C.; Lindor, N.M.; Minsky, B.D.; et al. Molecular biomarkers for the evaluation of colorectal cancer: Guideline from the American society for clinical pathology, college of American pathologists, association for molecular pathology, and American society of clinical oncology. Arch. Pathol. Lab. Med. 2017, 141, 625–657. [Google Scholar] [CrossRef]
  23. Grady, W.M.; Pritchard, C.C. Molecular alterations and biomarkers in colorectal cancer. Toxicol. Pathol. 2014, 42, 124–139. [Google Scholar] [CrossRef] [PubMed]
  24. Bartley, A.N.; Mills, A.M.; Konnick, E.; Overman, M.; Ventura, C.B.; Souter, L.; Colasacco, C.; Stadler, Z.K.; Kerr, S.; Howitt, B.E.; et al. Mismatch Repair and Microsatellite Instability Testing for Immune Checkpoint Inhibitor Therapy: Guideline From the College of American Pathologists in Collaboration With the Association for Molecular Pathology and Fight Colorectal Cancer. Arch. Pathol. Lab. Med. 2022, 146, 1194–1210. [Google Scholar] [CrossRef] [PubMed]
  25. Zhou, J.; Ji, Q.; Li, Q. Resistance to anti-EGFR therapies in metastatic colorectal cancer: Underlying mechanisms and reversal strategies. J. Exp. Clin. Cancer Res. 2021, 40, 328–345. [Google Scholar] [CrossRef]
  26. He, Y.; Sun, M.M.; Zhang, G.G.; Yang, J.; Chen, K.S.; Xu, W.W.; Li, B. Targeting PI3K/Akt signal transduction for cancer therapy. Signal Transduct. Target. Ther. 2021, 6, 425–442. [Google Scholar] [CrossRef]
  27. Huemer, F.; Thaler, J.; Piringer, G.; Hackl, H.; Pleyer, L.; Hufnagl, C.; Weiss, L.; Greil, R. Sidedness and TP53 mutations impact OS in anti-EGFR but not anti-VEGF treated mCRC—An analysis of the KRAS registry of the AGMT (Arbeitsgemeinschaft Medikamentöse Tumortherapie). BMC Cancer 2018, 18, 11. [Google Scholar] [CrossRef]
  28. Myer, P.A.; Lee, J.K.; Madison, R.W.; Pradhan, K.; Newberg, J.Y.; Isasi, C.R.; Klempner, S.J.; Frampton, G.M.; Ross, J.S.; Venstrom, J.M.; et al. The Genomics of Colorectal Cancer in Populations with African and European Ancestry. Cancer Discov. 2022, 12, 1282–1293. [Google Scholar] [CrossRef]
  29. Wang, Y.; Liu, H.; Hou, Y.; Zhou, X.; Liang, L.; Zhang, Z.; Shi, H.; Xu, S.; Hu, P.; Zheng, Z.; et al. Performance validation of an amplicon-based targeted next-generation sequencing assay and mutation profiling of 648 Chinese colorectal cancer patients. Virchows Arch. 2018, 472, 959–968. [Google Scholar] [CrossRef]
  30. Dos Santos, W.; Sobanski, T.; de Carvalho, A.C.; Evangelista, A.F.; Matsushita, M.; Berardinelli, G.N.; de Oliveira, M.A.; Reis, R.M.; Guimarães, D.P. Mutation profiling of cancer drivers in Brazilian colorectal cancer. Sci. Rep. 2019, 9, 13687–13700. [Google Scholar] [CrossRef]
  31. Torres, Á.; Oliver, J.; Frecha, C.; Montealegre, A.L.; Quezada-Urbán, R.; Díaz-Velásquez, C.E.; Vaca-Paniagua, F.; Perdomo, S. Cancer Genomic Resources and Present Needs in the Latin American Region. Public. Health Genom. 2017, 20, 194–201. [Google Scholar] [CrossRef] [PubMed]
  32. Palacio-Rúa, K.A.; Isaza-Jiménez, L.F.; Ahumada-Rodríguez, E.; Ceballos-García, H.; Muñetón-Peña, C.M. Genetic analysis in APC, KRAS, and TP53 in patients with stomach and colon cancer. Rev. Gastroenterol. Mex. 2014, 79, 79–89. [Google Scholar] [CrossRef] [PubMed]
  33. Takenaka, I.K.T.M.; Bartelli, T.F.; Defelicibus, A.; Sendoya, J.M.; Golubicki, M.; Robbio, J.; Serpa, M.S.; Branco, G.P.; Santos, L.B.C.; Claro, L.C.L.; et al. Exome and Tissue-Associated Microbiota as Predictive Markers of Response to Neoadjuvant Treatment in Locally Advanced Rectal Cancer. Front. Oncol. 2022, 12, 809441–809457. [Google Scholar] [CrossRef] [PubMed]
  34. Lorenzo Bermejo, J.; Boekstegers, F.; González Silos, R.; Marcelain, K.; Baez Benavides, P.; Barahona Ponce, C.; Müller, B.; Ferreccio, C.; Koshiol, J.; Fischer, C.; et al. Subtypes of Native American ancestry and leading causes of death: Mapuche ancestry-specific associations with gallbladder cancer risk in Chile. PLoS Genet. 2017, 13, e1006756. [Google Scholar] [CrossRef] [PubMed]
  35. Yaeger, R.; Chatila, W.K.; Lipsyc, M.D.; Hechtman, J.F.; Cercek, A.; Sanchez-Vega, F.; Jayakumaran, G.; Middha, S.; Zehir, A.; Donoghue, M.T.A.; et al. Clinical Sequencing Defines the Genomic Landscape of Metastatic Colorectal Cancer. Cancer Cell. 2018, 33, 125–136.e3. [Google Scholar] [CrossRef] [PubMed]
  36. Zheng, L.; Zhan, Y.; Lu, J.; Hu, J.; Kong, D. A prognostic predictive model constituted with gene mutations of APC, BRCA2, CDH1, SMO, and TSC2 in colorectal cancer. Ann. Transl. Med. 2021, 9, 680–691. [Google Scholar] [CrossRef] [PubMed]
  37. Salvo, M.; González-Feliú, E.; Toro, J.; Gallegos, I.; Maureira, I.; Miranda-González, N.; Barajas, O.; Bustamante, E.; Ahumada, M.; Colombo, A.; et al. Validation of an NGS Panel Designed for Detection of Actionable Mutations in Tumors Common in Latin America. J. Pers. Med. 2021, 11, 899. [Google Scholar] [CrossRef] [PubMed]
  38. Xie, M.Z.; Li, J.L.; Cai, Z.M.; Li, K.Z.; Hu, B.L. Impact of primary colorectal Cancer location on the KRAS status and its prognostic value. BMC Gastroenterol. 2019, 19, 46–55. [Google Scholar] [CrossRef]
  39. Nawa, T.; Kato, J.; Kawamoto, H.; Okada, H.; Yamamoto, H.; Kohno, H.; Endo, H.; Shiratori, Y. Differences between right- and left-sided colon cancer in patient characteristics, cancer morphology and histology. J. Gastroenterol. Hepatol. 2008, 23, 418–423. [Google Scholar] [CrossRef]
  40. Scott, N.; Sagar, P.; Stewart, J.; Blair, G.E.; Dixon, M.F.; Quirke, P. p53 in colorectal cancer: Clinicopathological correlation and prognostlc significance. Br. J. Cancer 1991, 63, 317–319. [Google Scholar] [CrossRef]
  41. Rinne, N.; Christie, E.L.; Ardasheva, A.; Kwok, C.H.; Demchenko, N.; Low, C.; Tralau-Stewart, C.; Fotopoulou, C.; Cunnea, P. Targeting the PI3K/AKT/mTOR pathway in epithelial ovarian cancer, therapeutic treatment options for platinum-resistant ovarian cancer. Cancer Drug Resist. 2021, 4, 573–595. [Google Scholar] [CrossRef] [PubMed]
  42. Porta, C.; Paglino, C.; Mosca, A. Targeting PI3K/Akt/mTOR signaling in cancer. Front. Oncol. 2014, 4, 64–75. [Google Scholar] [CrossRef] [PubMed]
  43. Huang, J.; Manning, B.D. The TSC1-TSC2 complex: A molecular switchboard controlling cell growth. Biochem. J. 2008, 412, 179–190. [Google Scholar] [CrossRef] [PubMed]
  44. Kwiatkowski, D.J.; Choueiri, T.K.; Fay, A.P.; Rini, B.I.; Thorner, A.R.; de Velasco, G.; Tyburczy, M.E.; Hamieh, L.; Albiges, L.; Agarwal, N.; et al. Mutations in TSC1, TSC2, and MTOR are associated with response to rapalogs in patients with metastatic renal cell carcinoma. Clin. Cancer Res. 2016, 22, 2445–2452. [Google Scholar] [CrossRef] [PubMed]
  45. Zureick, A.H.; McFadden, K.A.; Mody, R.; Koschmann, C. Successful treatment of a TSC2-mutant glioblastoma with everolimus. BMJ Case Rep. 2019, 12, 227734–227738. [Google Scholar] [CrossRef] [PubMed]
  46. Bellmunt, J.; Lalani, A.K.A.; Jacobus, S.; Wankowicz, S.A.; Polacek, L.; Takeda, D.Y.; Harshman, L.C.; Wagle, N.; Moreno, I.; Lundgren, K.; et al. Everolimus and pazopanib (E/P) benefit genomically selected patients with metastatic urothelial carcinoma. Br. J. Cancer 2018, 119, 707–712. [Google Scholar] [CrossRef] [PubMed]
  47. Adib, E.; Klonowska, K.; Giannikou, K.; Do, K.T.; Pruitt-Thompson, S.; Bhushan, K.; Milstein, M.I.; Hedglin, J.; Kargus, K.E.; Sholl, L.M.; et al. Phase II clinical trial of everolimus in a pan-cancer cohort of patients with mTOR pathway alterations. Clin. Cancer Res. 2021, 27, 3845–3853. [Google Scholar] [CrossRef]
  48. Di Nicolantonio, F.; Arena, S.; Tabernero, J.; Grosso, S.; Molinari, F.; Macarulla, T.; Russo, M.; Cancelliere, C.; Zecchin, D.; Mazzucchelli, L.; et al. Deregulation of the PI3K and KRAS signaling pathways in human cancer cells determines their response to everolimus. J. Clin. Investig. 2010, 120, 2858–2866. [Google Scholar] [CrossRef]
  49. Sartore-Bianchi, A.; Pietrantonio, F.; Lonardi, S.; Mussolin, B.; Rua, F.; Crisafulli, G.; Bartolini, A.; Fenocchio, E.; Amatu, A.; Manca, P.; et al. Circulating tumor DNA to guide rechallenge with panitumumab in metastatic colorectal cancer: The phase 2 CHRONOS trial. Nat. Med. 2022, 28, 1612–1618. [Google Scholar] [CrossRef]
  50. Jhawer, M.; Goel, S.; Wilson, A.J.; Montagna, C.; Ling, Y.H.; Byun, D.S.; Nasser, S.; Arango, D.; Shin, J.; Klampfer, L.; et al. PIK3CA mutation/PTEN expression status predicts response of colon cancer cells to the epidermal growth factor receptor inhibitor cetuximab. Cancer Res. 2008, 68, 1953–1961. [Google Scholar] [CrossRef]
  51. Frattini, M.; Saletti, P.; Romagnani, E.; Martin, V.; Molinari, F.; Ghisletta, M.; Camponovo, A.; Etienne, L.L.; Cavalli, F.; Mazzucchelli, L. PTEN loss of expression predicts cetuximab efficacy in metastatic colorectal cancer patients. Br. J. Cancer 2007, 97, 1139–1145. [Google Scholar] [CrossRef] [PubMed]
  52. Laurent-Puig, P.; Cayre, A.; Manceau, G.; Buc, E.; Bachet, J.B.; Lecomte, T.; Rougier, P.; Lievre, A.; Landi, B.; Boige, V.; et al. Analysis of PTEN, BRAF, and EGFR status in determining benefit from cetuximab therapy in wild-type KRAS metastatic colon cancer. J. Clin. Oncol. 2009, 27, 5924–5930. [Google Scholar] [CrossRef] [PubMed]
  53. Eyheramendy, S.; Martinez, F.I.; Manevy, F.; Vial, C.; Repetto, G.M. Genetic structure characterization of Chileans reflects historical immigration patterns. Nat. Commun. 2015, 6, 6472. [Google Scholar] [CrossRef] [PubMed]
  54. Cornelis, M.C.; Rimm, E.B.; Curhan, G.C.; Kraft, P.; Hunter, D.J.; Hu, F.B.; van Dam, R.M. Obesity susceptibility loci and uncontrolled eating, emotional eating and cognitive restraint behaviors in men and women. Obesity 2014, 22, E135–E141. [Google Scholar] [CrossRef] [PubMed]
  55. Burgdorf, K.S.; Gjesing, A.P.; Grarup, N.; Justesen, J.M.; Sandholt, C.H.; Witte, D.R.; Jørgensen, T.; Madsbad, S.; Hansen, T.; Pedersen, O. Association studies of novel obesity-related gene variants with quantitative metabolic phenotypes in a population-based sample of 6039 Danish individuals. Diabetologia 2012, 55, 105–113. [Google Scholar] [CrossRef] [PubMed]
  56. Prazeres, H.; Torres, J.; Rodrigues, F.; Pinto, M.; Pastoriza, M.C.; Gomes, D.; Cameselle-Teijeiro, J.; Vidal, A.; Martins, T.C.; Sobrinho-Simões, M.; et al. Chromosomal, epigenetic and microRNA-mediated inactivation of LRP1B, a modulator of the extracellular environment of thyroid cancer cells. Oncogene 2011, 30, 1302–1317. [Google Scholar] [CrossRef]
  57. Zhai, X.; Xia, Z.; Du, G.; Zhang, X.; Xia, T.; Ma, D.; Li, X.; Jin, B.; Zhang, H. LRP1B suppresses HCC progression through the NCSTN/PI3K/AKT signaling axis and affects doxorubicin resistance. Genes Dis. 2022, 10, 2082–2096. [Google Scholar] [CrossRef] [PubMed]
  58. Wang, K.; Li, M.; Hakonarson, H. ANNOVAR: Functional annotation of genetic variants from high-throughput sequencing data. Nucleic Acids Res. 2010, 38, e164. [Google Scholar] [CrossRef] [PubMed]
  59. Zollner, L.; Boekstegers, F.; Barahona Ponce, C.; Scherer, D.; Marcelain, K.; Gárate-Calderón, V.; Waldenberger, M.; Morales, E.; Rojas, A.; Munoz, C.; et al. Gallbladder Cancer Risk and Indigenous South American Mapuche Ancestry: Instrumental Variable Analysis Using Ancestry-Informative Markers. Cancers 2023, 15, 4033. [Google Scholar] [CrossRef]
  60. Barahona Ponce, C.; Scherer, D.; Brinster, R.; Boekstegers, F.; Marcelain, K.; Gárate-Calderón, V.; Müller, B.; De Toro, G.; Retamales, J.; Barajas, O.; et al. Gallstones, Body Mass Index, C-Reactive Protein, and Gallbladder Cancer: Mendelian Randomization Analysis of Chilean and European Genotype Data. Hepatology 2021, 73, 1783–1796. [Google Scholar] [CrossRef]
  61. Poli, M.C.; Rebolledo-Jaramillo, B.; Lagos, C.; Orellana, J.; Moreno, G.; Martín, L.M.; Encina, G.; Böhme, D.; Faundes, V.; Zavala, M.J.; et al. Decoding complex inherited phenotypes in rare disorders: The DECIPHERD initiative for rare undiagnosed diseases in Chile. Eur. J. Hum. Genet. 2024. [Google Scholar] [CrossRef] [PubMed]
  62. Benjamini, Y.; Hochberg, Y. Controlling the False Discovery Rate: A Practical and Powerful Approach to Multiple Testing. Behav. Brain Res. 2001, 125, 279–284. [Google Scholar] [CrossRef] [PubMed]
Figure 1. Distribution and mutation type for the 20 most mutated genes found in 37 out of 40 tumor samples, separated by sidedness. The lower panel shows the sex and stage distributions. Mutation types are depicted in a color code.
Ijms 25 04695 g001
Figure 2. Mutation frequencies for clinically relevant genes (upper panel) and other genes of interest (lower panel) in LCRC, RCRC, and both sides.
Ijms 25 04695 g002
Figure 3. Distribution of mutations in TSC2 protein in the Chp cohort. Amino acid changes are displayed by sidedness.
Ijms 25 04695 g003
Figure 4. Mutation frequencies of clinically relevant genes (upper panel) and other genes of interest (lower panel) in TCGA, MSK-IMPACT, and Chp patients. Only statistically significant differences between both groups compared to Chp cohort are indicated (* p < 0.05, chi-square test).
Ijms 25 04695 g004
Figure 5. Fraction of the mutated genes considered in each pathway (on the left) and the fraction of the samples affected by those mutations (on the right) in every cohort.
Ijms 25 04695 g005
Figure 6. Mutation frequencies for the TCGA and Chp cohorts in the PI3K pathway genes. (* p < 0.05, Fisher’s exact test).
Ijms 25 04695 g006
Figure 7. Distribution and type of mutations in the PI3K pathway and KRAS, NRAS, and BRAF genes, in samples enriched in modifications in the PI3K oncogenic pathway. The right panel shows the number of samples with mutations in the gene indicated in the same line on the left. The lower panel shows the sex of the patient and the location of the primary tumor.
Ijms 25 04695 g007
Table 1. General characteristics of the patients and their tumors.
Characteristic RCRCLCRCTOTALp-Value
(LCRC vs. RCRC) *
Cases 931400.000001508
GenderMales320230.1338
Females611170.1338
Mean age at
diagnosis
71.22
(range 51–86) years
61.35
(range 25–82) years
63.58
(range 25–86) years
0.06236
StageI0221
II412161
III413171
IV1451
Histological
diagnosis
Tubular adenocarcinoma315180.4761
Adenocarcinoma, NOS31013N/A
Papillary-tubular adenocarcinoma1120.4038
Poorly differentiated with signet-cells carcinoma0111
Mucinous adenocarcinoma1010.225
Adenocarcinoma mixed tubular and mucinous0111
Not specified134N/A
EthnicityChilean29111
Mapuche2350.2677
European0111
Not specified61723N/A
* Statistically significant differences are highlighted in bold. Fisher’s exact test.
Table 2. Comparison between LCRC and RCRC in MSK-IMPACT and TCGA, with p-values determined using a chi-square test. Statistically significant p-values (adjusted for false discovery rate) are highlighted in bold.
MSK-IMPACT TCGA
GeneLCRC
(n = 311)
RCRC
(n = 199)
p-Valueadj p-ValueLCRC
(n = 142)
RCRC
(n = 78)
p-Valueadj p-Value
ARID1A11.58% (36)24.12% (48)3.140 × 10−41.13 × 10−36.34% (9)16.67% (13)2.725 × 10−21.18 × 10−1
BRAF8.36% (26)23.62% (47)3.015 × 10−63.92 × 10−52.82% (4)23.08% (18)5.191 × 10−61.35 × 10−4
BRCA14.5% (14)6.03% (12)5.76 × 10−15.99 × 10−12.11% (3)385% (3)7.471 × 10−19.42 × 10−1
BRCA26.75% (21)22.11% (44)7.924 × 10−72.06 × 10−58.45% (12)12.82% (10)4.245 × 10−18.49 × 10−1
CDK122.89% (9)7.04% (14)4.774 × 10−26.53 × 10−22.82% (4)6.41% (5)3.516 × 10−17.62 × 10−1
CDKN2A1.93% (6)4.02% (8)2.577 × 10−12.91 × 10−10% (0)1.28% (1)7.606 × 10−19.42 × 10−1
FGFR11.93% (6)4.52% (9)1.550 × 10−11.83 × 10−12.11% (3)1.28% (1)1 × 1001 × 10−0
FGFR22.25% (7)5.03% (10)1.471 × 10−11.82 × 10−13.52% (5)1.28% (1)5.873 × 10−19.42 × 10−1
FGFR31.29% (4)6.53% (13)3.009 × 10−36.52 × 10−30% (0)2.56% (2)2.402 × 10−15.68 × 10−1
KRAS41.16% (128)57.79% (115)3.470 × 10−41.13 × 10−341.55% (59)46.15% (36)6.049 × 10−19.42 × 10−1
MLH11.93% (6)5.53% (11)5.053 × 10−26.57 × 10−22.82% (4)5.13% (4)6.173 × 10−19.42 × 10−1
MSH22.57% (8)8.04% (16)8.538 × 10−31.59 × 10−23.52% (5)2.56% (2)1 × 1001 × 10−0
MSH63.54% (11)11.06% (22)1.462 × 10−33.8 × 10−34.23% (6)11.54% (9)7.523 × 10−22.79 × 10−1
MTOR3.54% (11)14.07% (28)2.722 × 10−51.42 × 10−45.63% (8)11.54% (9)1.919 × 10−15.68 × 10−1
NF14.18% (13)13.07% (26)4.442 × 10−41.28 × 10−34.23% (6)6.41% (5)6.98 × 10−19.42 × 10−1
NRAS4.18% (13)5.03% (10)8.182 × 10−18.18 × 10−19.15% (13)8.97% (7)1 × 1001 × 10−0
NTRK12.57% (8)8.54% (17)4.569 × 10−39.14 × 10−32.11% (3)3.85% (3)7.471 × 10−19.42 × 10−1
NTRK32.25% (7)6.53% (13)2.808 × 10−24.06 × 10−22.11% (3)11.54% (9)8.419 × 10−35.47 × 10−2
PIK3CA19.61% (61)38.19% (76)6.347 × 10−65.16 × 10−511.27% (16)30.77% (24)6.618 × 10−45.74 × 10−3
PMS20.96% (3)2.51% (5)3.139 × 10−13.4 × 10−11.41% (2)5.13% (4)2.349 × 10−15.68 × 10−1
POLE6.75% (21)14.07% (28)9.839 × 10−31.71 × 10−25.63% (8)16.67% (13)1.534 × 10−27.98 × 10−2
PTEN7.07% (22)16.08% (32)2.091 × 10−34.94 × 10−34.93% (7)5.13% (4)1 × 1001 × 10−0
RB13.54% (11)8.54% (17)2.631 × 10−24.96 × 10−22.11% (3)6.41% (5)2.104 × 10−15.68 × 10−1
TP5381.03% (252)62.81% (125)7.944 × 10−65.16 × 10−565.49% (93)35.9% (28)4.515 × 10−55.87 × 10−4
TSC11.93% (6)6.03% (12)2.765 × 10−24.06 × 10−21.41% (2)2.56% (2)9.312 × 10−11 × 10−0
TSC21.93% (6)10.55% (21)5.35 × 10−52.32 × 10−41.41% (2)0% (0)7.562 × 10−19.42 × 10−1
Disclaimer/Publisher’s Note: The statements, opinions and data contained in all publications are solely those of the individual author(s) and contributor(s) and not of MDPI and/or the editor(s). MDPI and/or the editor(s) disclaim responsibility for any injury to people or property resulting from any ideas, methods, instructions or products referred to in the content.

