Article

Phenolics Profile and Phenol-Related Enzyme Activities in Cucumber Plants Under Ni Stress

1
Faculty of Biology and Environmental Protection, Department of Plant Physiology and Biochemistry, University of Lodz, Banacha 12/16, 90-237 Łódź, Poland
2
Institute of Biology and Earth Sciences, University of the National Education Commission, Podchorążych 2, 30-084 Kraków, Poland
*
Author to whom correspondence should be addressed.
Int. J. Mol. Sci. 2025, 26(3), 1237; https://doi.org/10.3390/ijms26031237
Submission received: 10 January 2025 / Revised: 29 January 2025 / Accepted: 29 January 2025 / Published: 31 January 2025
(This article belongs to the Section Molecular Plant Sciences)

Abstract

:
Ni phytotoxicity has been attributed to its multidirectional detrimental effects on plant cell structure and function. However, relatively little is known about Ni’s impact on phenolic metabolism in plants. The objective of our study was to obtain insight into the effect of Ni treatment on phenolic compound composition, phenol-related enzyme activities, and lignin accumulation in cucumber plants. Besides growth reduction, the chlorophyll a and carotenoid contents as well as the chlorophyll a fluorescence parameters, namely, the maximum photochemical efficiency of PS II and non-photochemical quenching, were significantly decreased in the Ni-treated cucumber plants. Application of Ni resulted in changes in the phenolic acid and flavonoid profiles; however, the total content of the detected phenolic compounds remained unchanged in the leaf and slightly decreased in the root. The Ni-induced release of free phenolic acids from their conjugates was found in the leaf. Ni treatment led to a marked increase in leaf peroxidase activities assayed with various phenolic substrates, while it did not influence phenyl ammonia lyase and polyphenol oxidase activities. Increased lignin deposition was observed in the leaf blade of Ni-exposed plants. Neither lignin accumulation nor induction of peroxidase activities were found in the root. Our results indicate that the Ni effect on phenolic compound composition and related enzyme activities is organ-specific. The observed changes in the content of individual compounds might result rather from the metal-triggered conversions of the compounds constitutively present in the cucumber tissues than from de novo synthesis.

1. Introduction

Nickel has been classified as a microelement; however, its excessive concentrations become toxic to most plant species. The toxicity of this heavy metal is evidenced by the appearance of various symptoms including growth reduction, wilting, leaf chlorosis, or root browning. Nickel’s phytotoxicity has been attributed to its detrimental impact on metabolic pathways and key physiological processes [1]. Compared to other heavy metals, Ni’s effect on plants has been studied less intensively. There are only a few reports on the effect of Ni on phenol metabolism [2,3].
Phenolic compounds are secondary metabolites widely distributed in plants. Their structure is characterized by the presence of at least one aromatic ring bearing one or more hydroxyl groups [4]. Phenolics originate from L-phenylalanine produced in the shikimate pathway. Conversion of L-phenylalanine to trans-cinnamic acid catalyzed by L-phenylalanine ammonia lyase (PAL, EC 3.5.1.5) is the first step in the biosynthesis of phenolic compounds. This heterogenous group encompasses, among others, simple phenols, phenolic acids, and flavonoids [5]. Both free and conjugated forms of phenolic compounds can be found in plants. The most common phenolic conjugates are β-O-glycosides in which one or more sugar moieties are linked to the OH group [6]. Due to the presence of hydroxyl groups in their structure, phenolics show antioxidant properties. These compounds are believed to prevent oxidative stress as direct reactive oxygen species (ROS) scavengers and electron donors for antioxidative enzymes. It is considered that the antioxidative activity of phenolic compounds depends on the number and position of OH groups [4,7]. The protective properties of phenolic compounds under heavy metal stress can be also ascribed to their metal chelation ability [8].
Peroxidases (POXs, EC 1.11.1.7) use H 2 O 2 to oxidize a variety of organic compounds including phenols. These enzymes are considered to participate in processes of cell wall stiffening, namely, lignification and cross-linking of cell wall polymers. Being involved in the remodeling of cell walls, POXs play an important role in plants under both physiological and stress conditions [9,10]. POX activity is usually measured using guaiacol as a universal substrate. It has been proposed that the application of more specific substrates such as syringaldazine, phenolic acids, or flavonoids in a POX activity assay may help us to understand better the role of POXs in individual processes [11]. It is believed that POXs participating in lignin synthesis in vitro display high affinity toward syringaldazine, a lignin monomer analog [12]. Determination of POX activity with ferulic acid is assumed to reflect the dynamics of POX-mediated oxidation of this phenolic acid, resulting in the formation of diferulate bridges between cell wall polysaccharides [13,14]. Peroxidase using quercetin as a substrate is considered to play a significant role in the removal of H 2 O 2 , thus supporting other antioxidant enzymes [15].
Polyphenol oxidases (PPOs) catalyze the oxidation of phenols to quinones using molecular oxygen as an electron acceptor. According to the substrate specificity and mechanism of reaction, PPOs are divided into several groups including laccases (PPOL, EC 10.3.2) that oxidize both o-diphenols and p-diphenols to the corresponding quinones and catechol oxidases (PPOC, EC 1.10.3.1), which are able to oxidize solely o-diphenols. It is believed that PPOs cooperate with POXs in lignin synthesis and cross-linking of cell wall components [16].
Lignin is a complex component of the plant cell wall consisting of phenolic heteropolymers which are covalently bound to both polysaccharides and proteins. Lignin is synthesized from three p-hydroxycinnamyl alcohols, namely, p-coumaryl, coniferyl, and sinapyl alcohol, collectively called monolignols. In the first step, they are enzymatically oxidized to the corresponding oxyradicals, which subsequently spontaneously polymerize, forming lignin [17].
The cucumber is a widely cultivated and economically important crop, which in our earlier research was shown to be relatively sensitive to Ni [18]. The appearance of necrotic spots on the oldest (the first) leaf of Ni-treated cucumber plants suggested increased lignification and possible alterations in the metabolism of phenolics. Therefore, the objective of our study was to obtain insight into the Ni effect on phenolic compound composition in cucumber plants including a separate analysis of free and conjugated compounds. The activities of enzymes involved in phenolic synthesis or oxidation as well as parameters indicating the stress level in plants were studied in parallel. To our knowledge, this is the first report presenting the Ni effect on the ratio of free to conjugated forms of phenolic compounds and showing the Ni-induced changes in the flavonoid profile.

2. Results

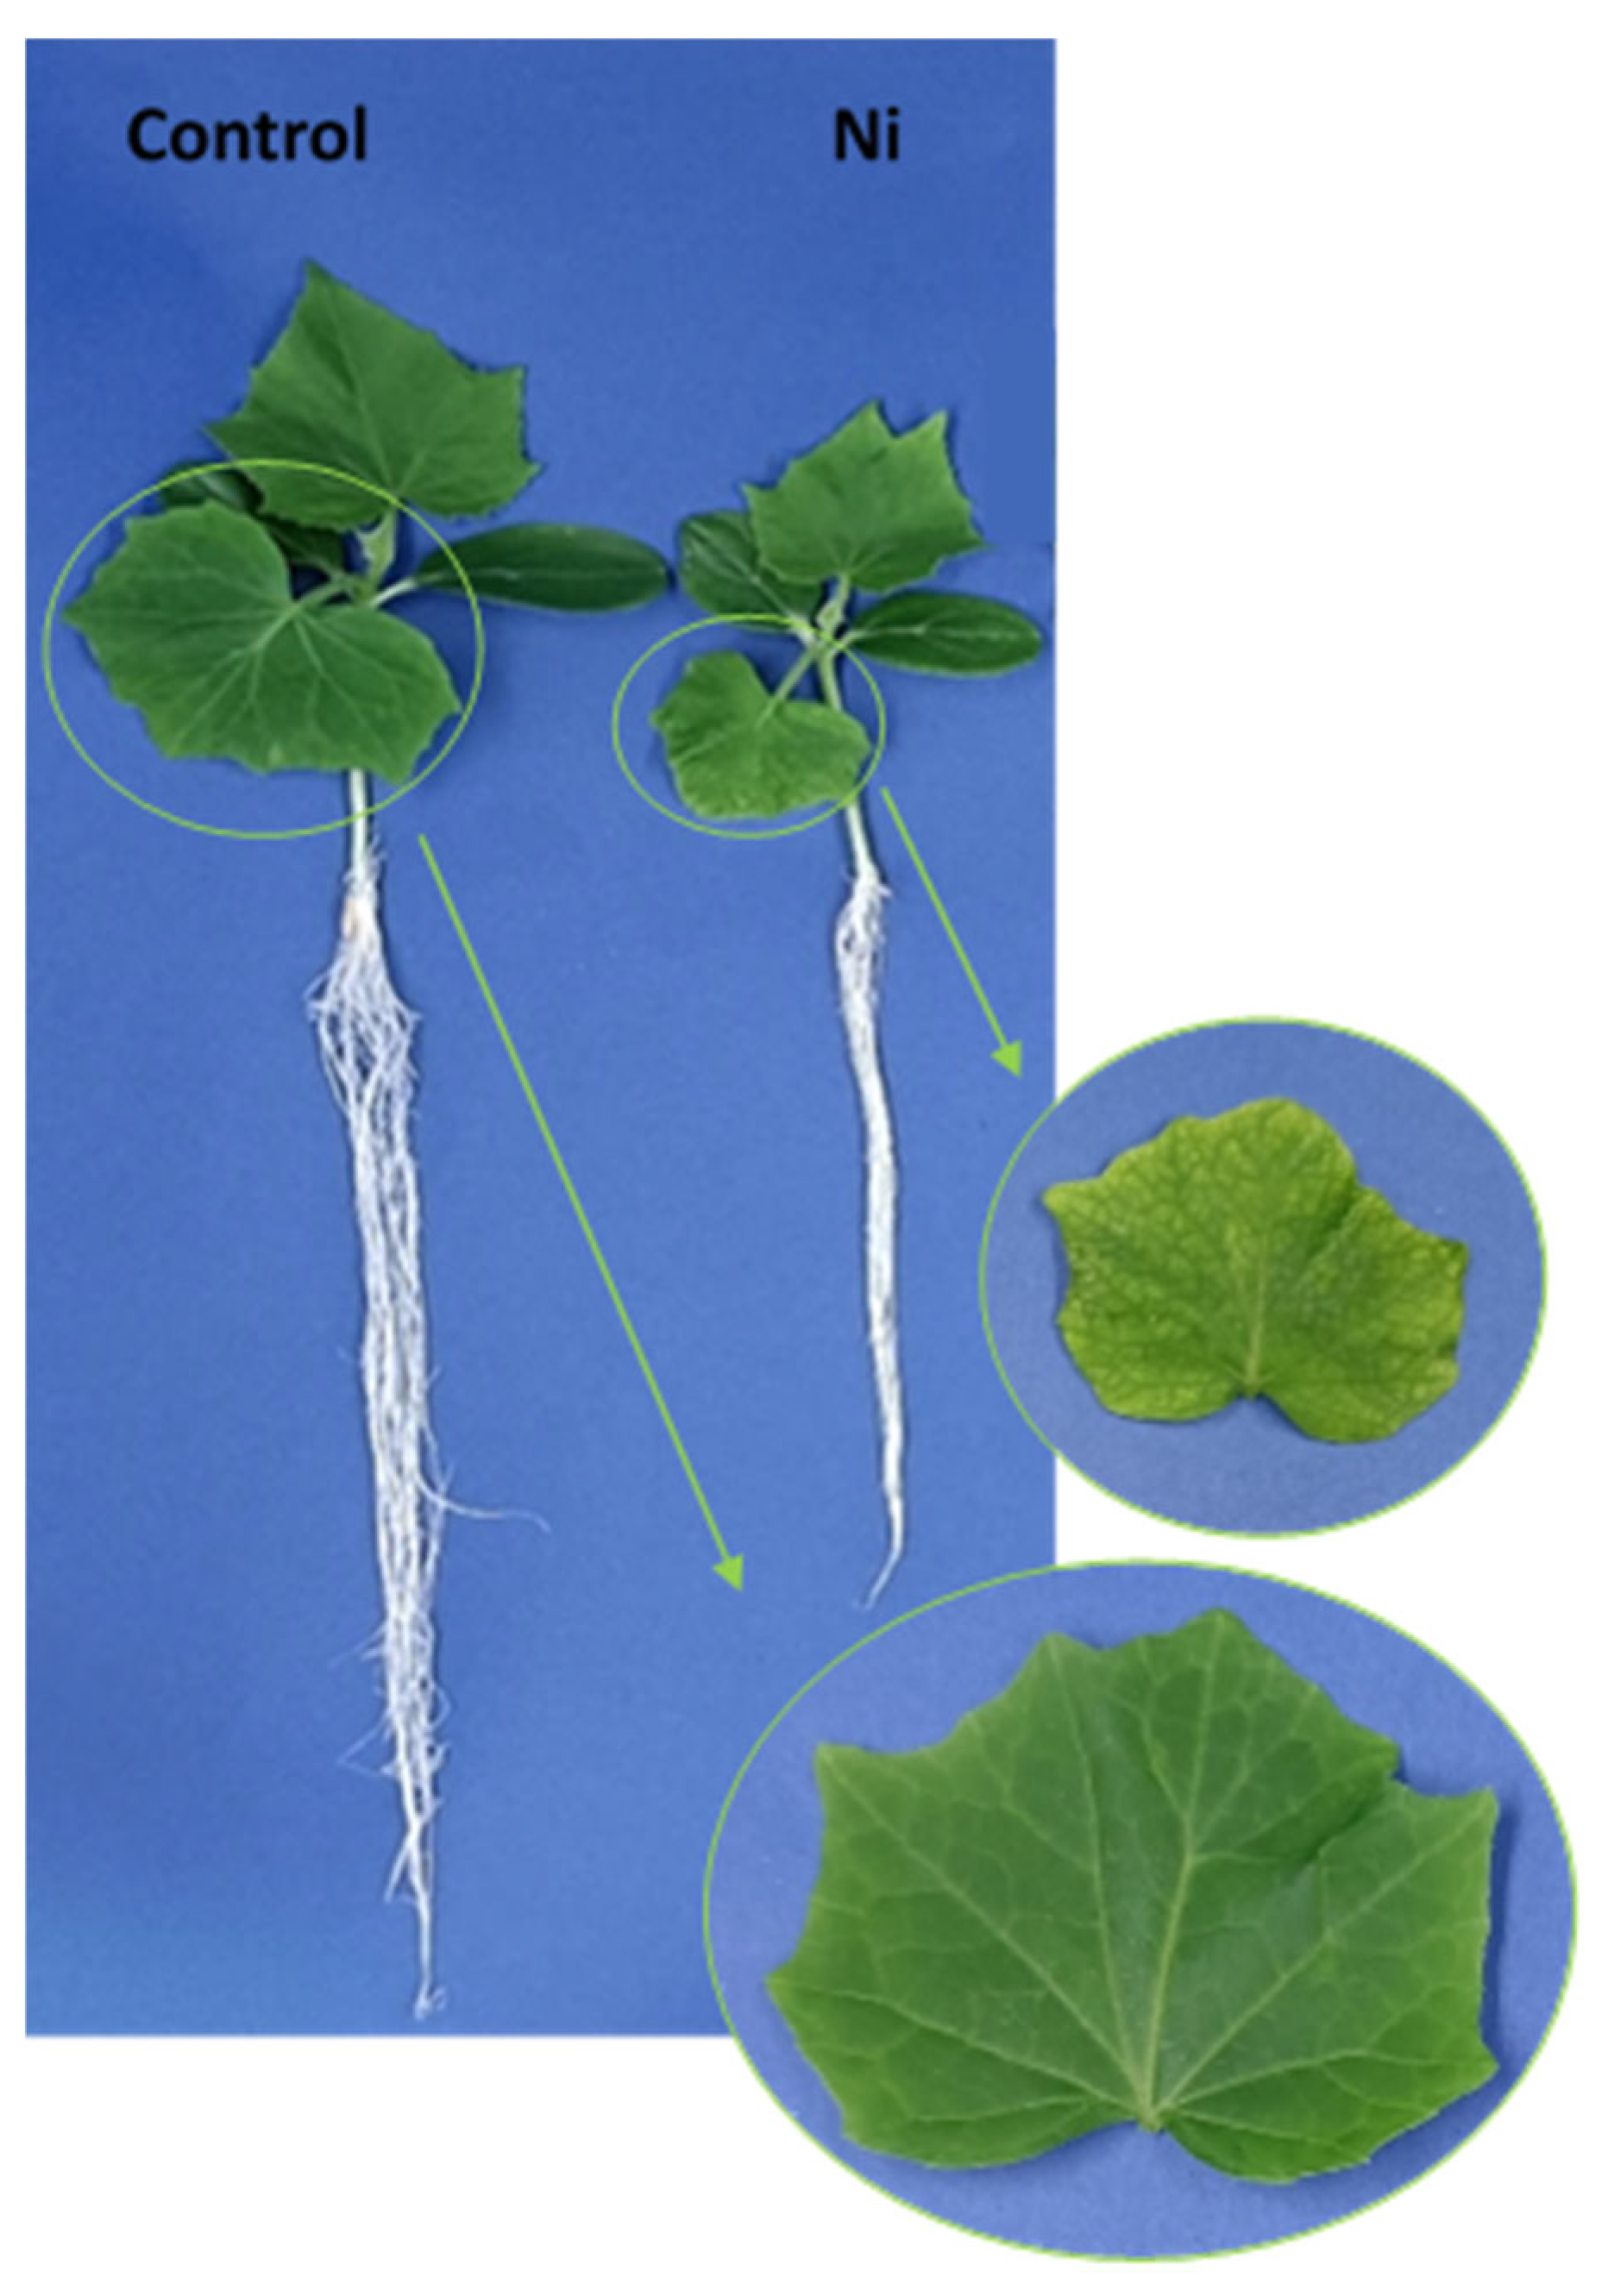
2.1. Growth, Ni Accumulation, and Relative Water Content (RWC)

Nickel treatment caused significant growth inhibition of both the aboveground and underground parts of cucumber plants (Figure 1). A considerable reduction in root length and a decrease in the number of lateral roots were observed compared to the control. In addition to the reduced leaf blade surface area, chlorosis and small necrotic spots were visible on the first (the oldest) leaf, which was taken for further analyses.
Nickel treatment markedly reduced the fresh weight of the leaf and root by 53% and 59%, respectively (Table 1). Accumulation of the metal in the root was about 2-fold higher compared to the leaf. No significant changes in RWC were observed in the Ni-treated cucumber plants.

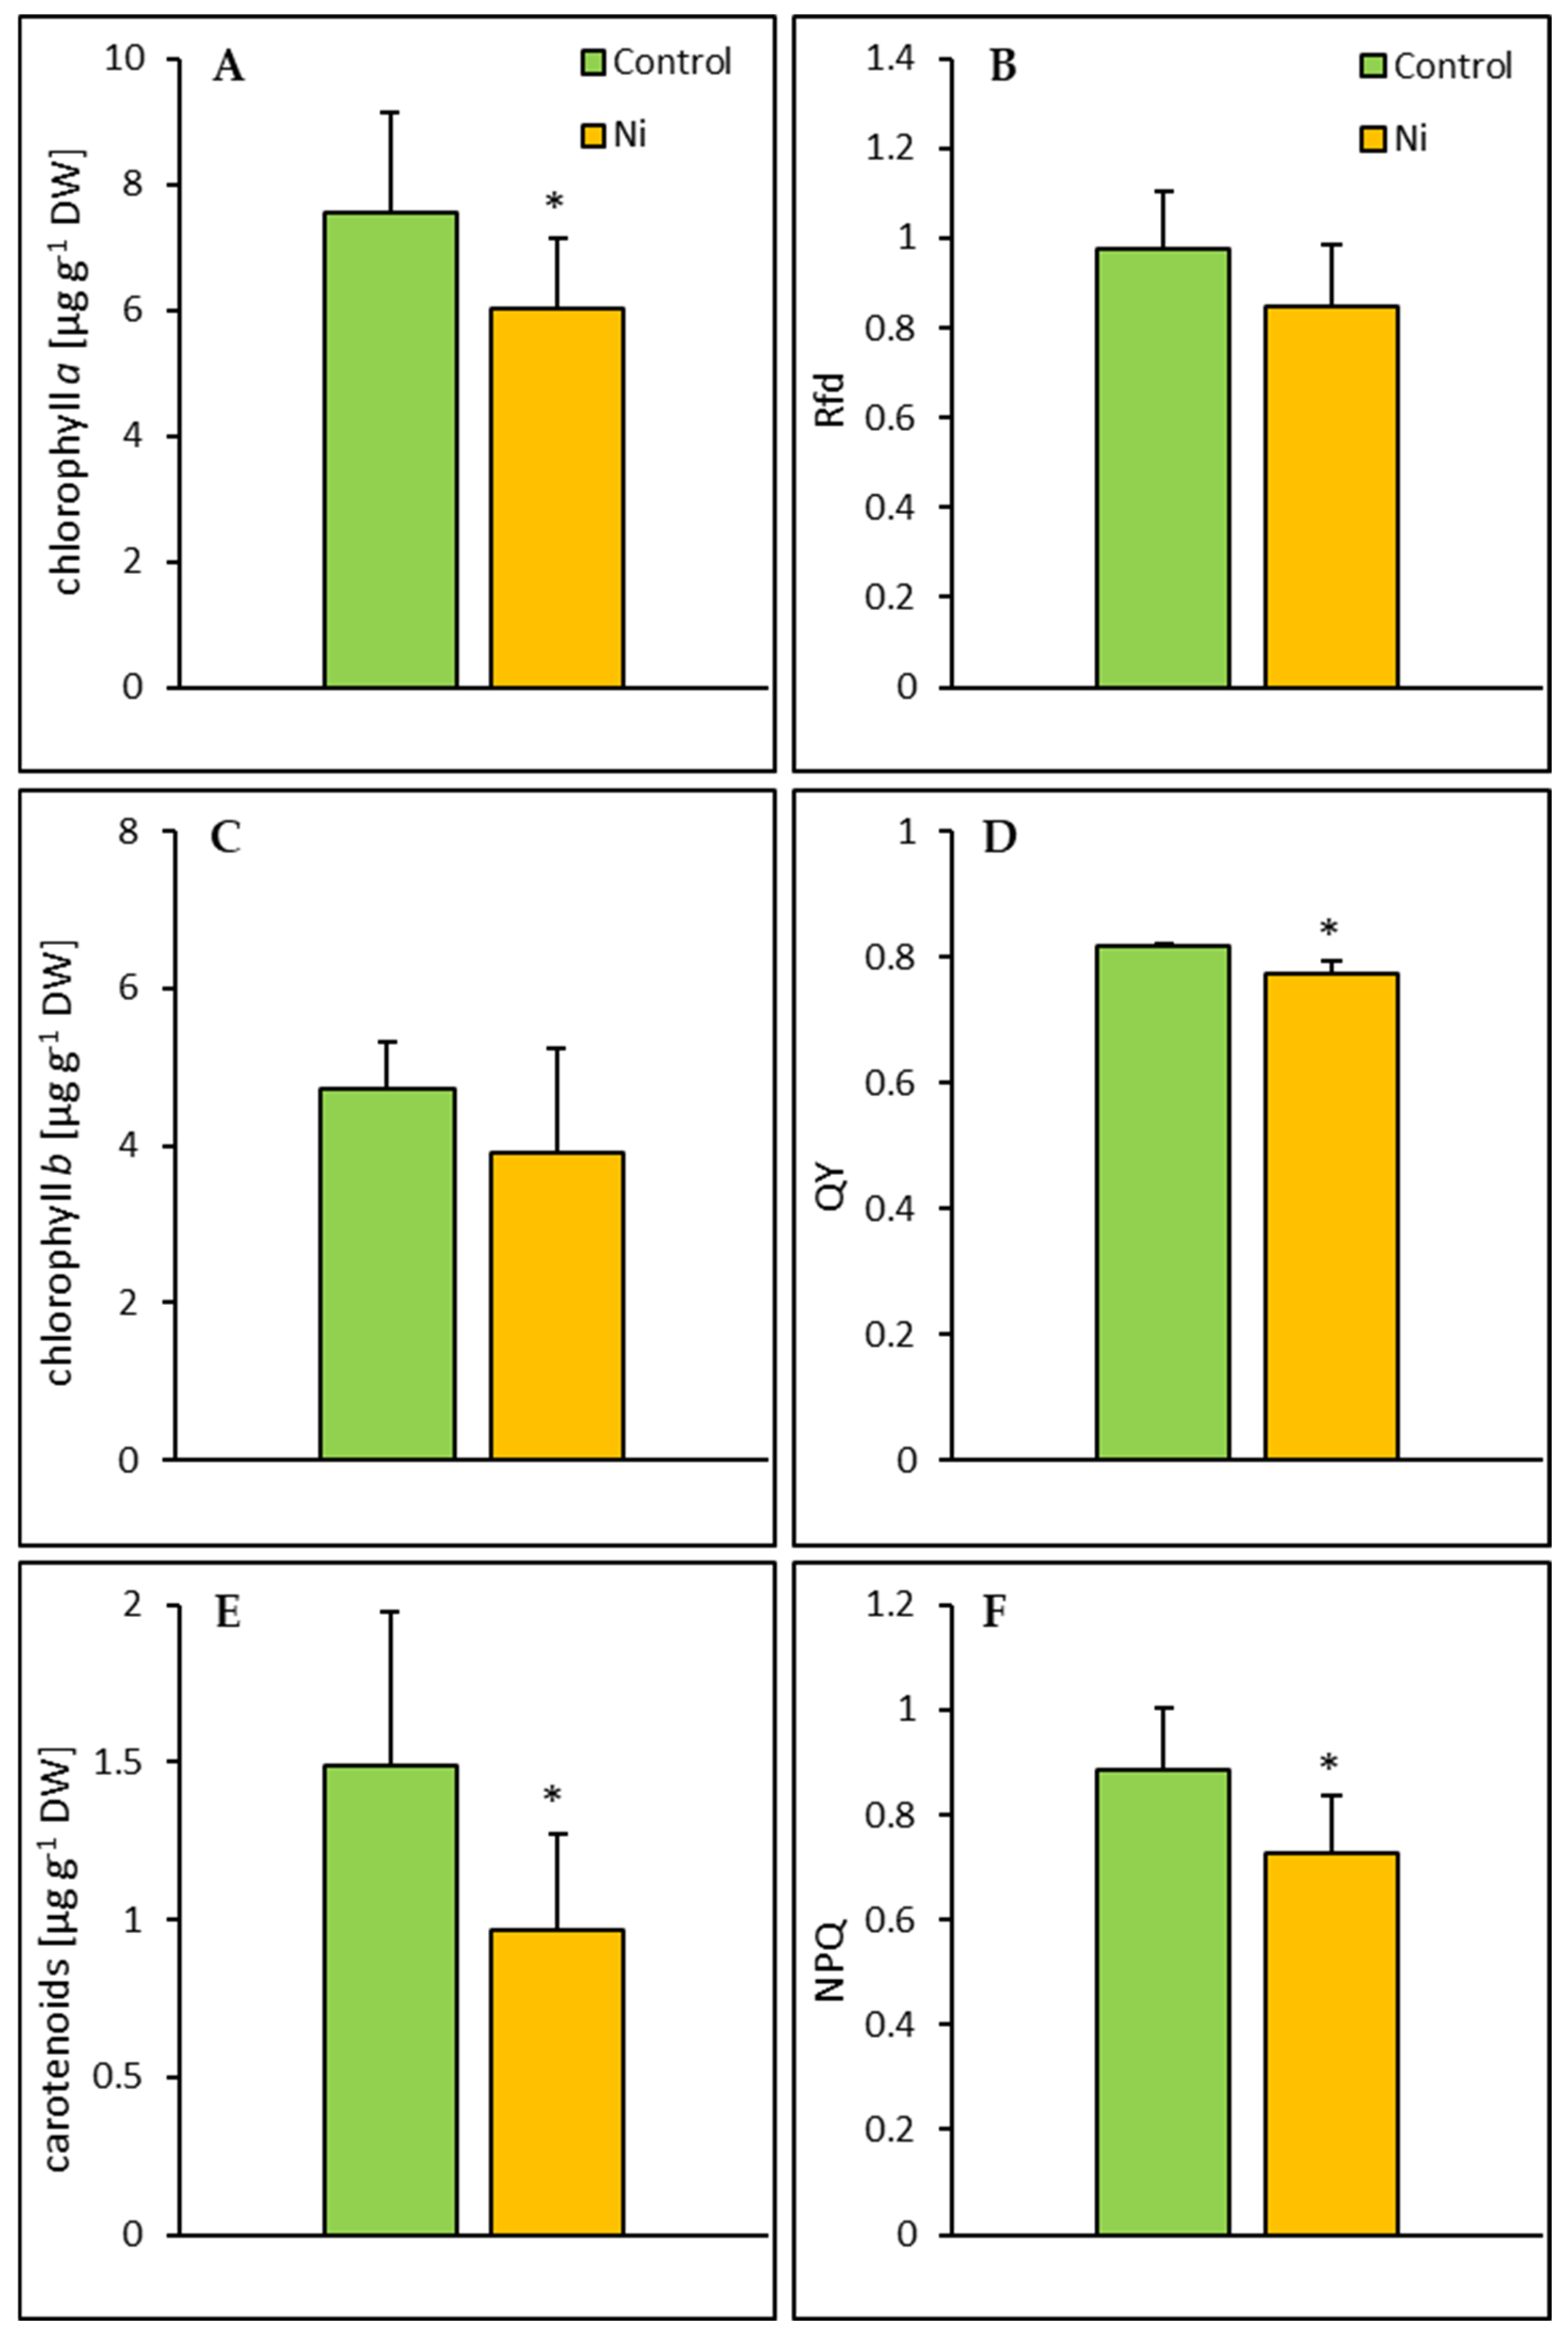
2.2. Photosynthetic Pigments and Chlorophyll a Fluorescence

Exposure of cucumber plants to Ni resulted in a significant decrease in chlorophyll a and carotenoid contents by 20% and 35%, respectively (Figure 2). The maximum photochemical efficiency of PS II and non-photochemical quenching values in the leaf of Ni-treated cucumber plants were 6% and 18% lower than in the control, respectively.

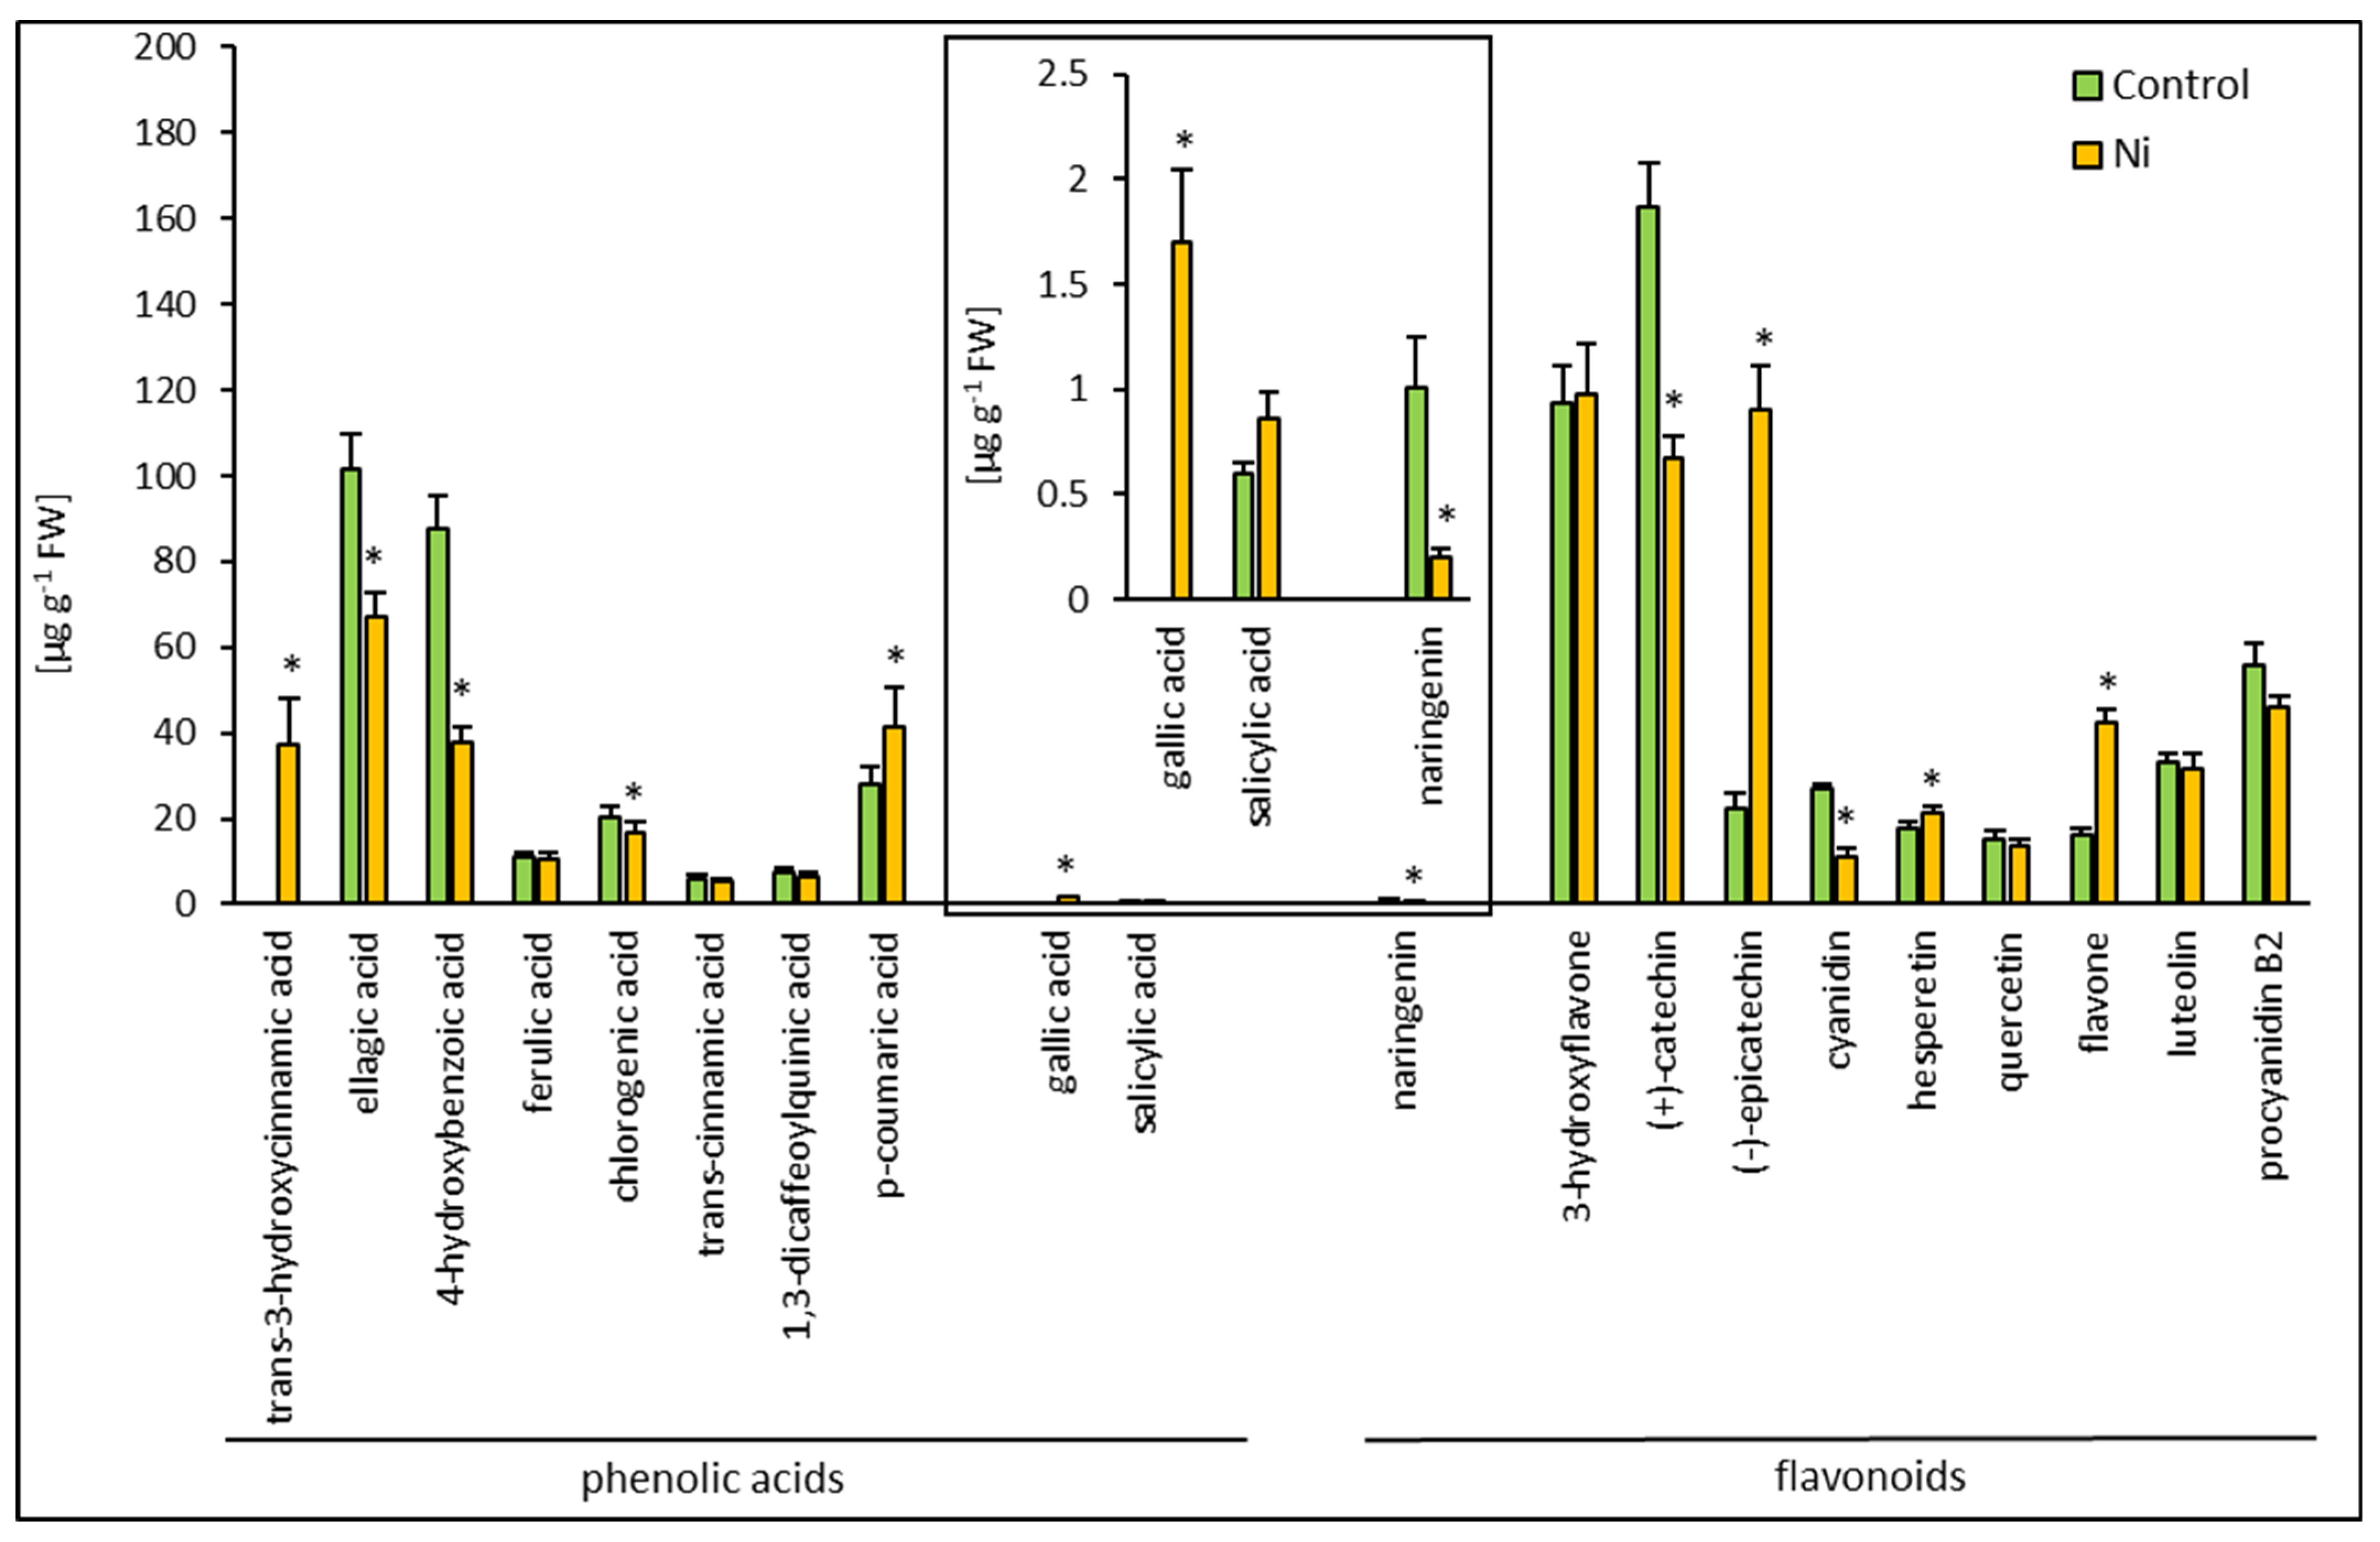
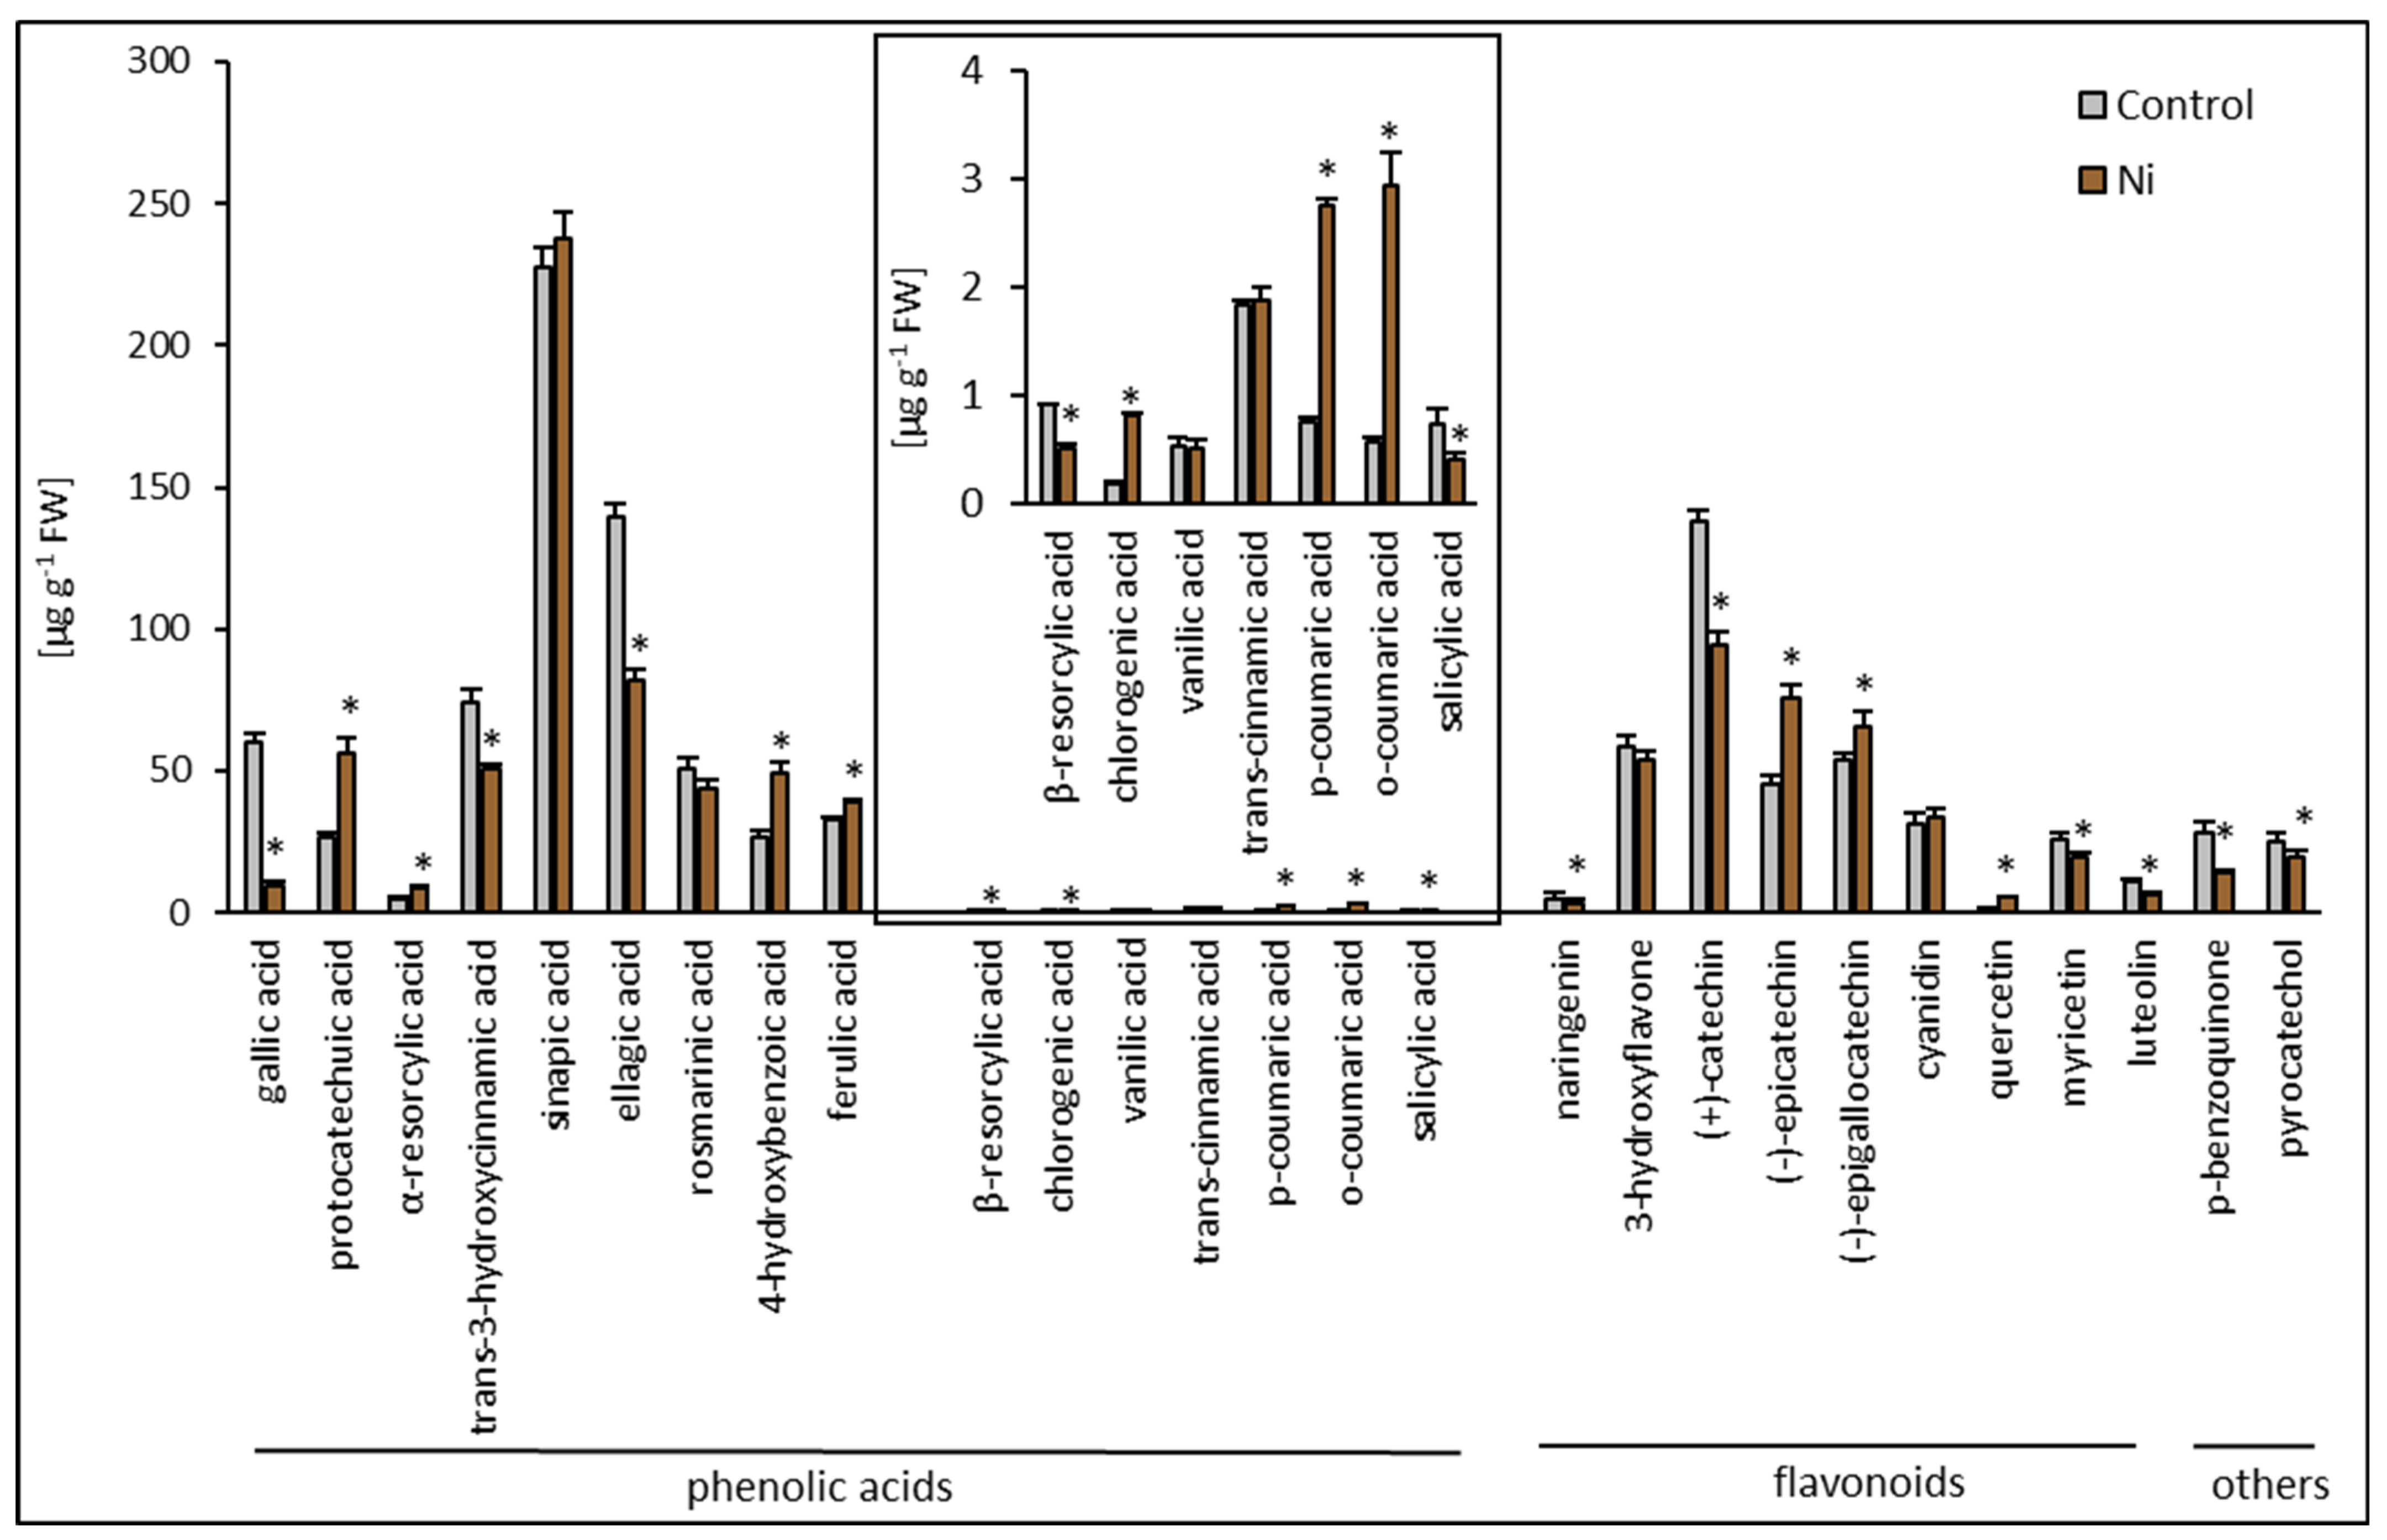
2.3. Phenolic Compound Composition Analysis

HPLC analysis revealed a distinct constitutive phenolic compound composition of the cucumber leaf and root. Generally, in the leaf, 20 compounds were detected (Figure 3), while in the root, 27 phenolic compounds were found (Figure 4).
Among the phenolic compounds in the leaf, 10 phenolic acids and 10 flavonoids were detected. Cinnamic acid derivatives included trans-3-hydroxycinnamic acid, ferulic acid, chlorogenic acid, trans-cinnamic acid, and 1,3-dicaffeoylquinic acid. Benzoic acid derivatives encompassed ellagic acid, 4-hydroxybenzoic acid, p-coumaric acid, gallic acid, and salicylic acid. Flavonoids detected in the cucumber leaf included 3-hydroxyflavone, flavone, (+)-catechin, (−)-epicatechin, cyanidin, naringenin, hesperetin, quercetin, luteolin, and procyanidin B2. The most abundant phenolic acids were ellagic acid (39%) and 4-hydroxybenzoic acid (33%). The most abundant flavonoids were (+)-catechin (35%) and 3-hydroxyflavone (25%) (Figure 3). Among the phenolic compounds in the root, 16 phenolic acids and 11 flavonoids were detected. Cinnamic acid derivatives included trans-3-hydroxycinnamic acid, sinapic acid, rosmarinic acid, ferulic acid, chlorogenic acid, and trans-cinnamic acid. Benzoic acid derivatives encompassed gallic acid, protocatechuic acid, α-resorcylic acid, β-resorcylic acid, ellagic acid, 4-hydroxybenzoic acid, vanillic acid, p-coumaric acid, o-coumaric acid, and salicylic acid. Flavonoids detected in the cucumber leaf included myricetin, 3-hydroxyflavone, (+)-catechin, (−)-epicatechin, (−)-epigallocatechin, cyanidin, naringenin, quercetin, and luteolin. Apart from the abovementioned phenolic acids and flavonoids, p-benzoquinone and pyrocatechol were found in the root extract. The most abundant phenolic acids in the root were sinapic acid (30%) and ellagic acid (22%), while the most abundant flavonoid was (+)-catechin (37%) (Figure 4). In general, the leaf and root of the control cucumber plants differed in the total phenolic acid and flavonoid contents. A 2.5-fold lower content of phenolic acids and a 1.3-fold higher content of flavonoids were found in the leaf compared to the root.
Considering all phenolic compounds in the profile, Ni did not cause any change in the total phenolic compound content in the cucumber leaf. Exposure to Ni resulted in the appearance of two new compounds, absent in the control, i.e., gallic acid and trans-3-hydroxycinnamic acid in the leaf. The most pronounced increases were found for (−)-epicatechin and flavone contents, with about 5-fold and 2.6-fold enhancement, respectively. Increased contents of p-coumaric acid and hesperetin were also observed in the leaf of cucumber plants treated with Ni. Decreases in the content of 4-hydroxybenzoic acid, ellagic acid, and chlorogenic acid, as well as naringenin, cyanidin, and (+)-catechin, were also noted (Figure 3). Nickel treatment caused a slight reduction (about 6%) in the content of phenolic compounds in the root of cucumber plants. The highest values, a 5.2-fold increase in o-coumaric acid content and a 4.3-fold increase in chlorogenic acid, were observed in the root. Increases in the contents of p-coumaric acid, quercetin, and protocatechuic acid were also found. Smaller increases in the content were noted for 4-hydroxybenzoic acid, α-resorcylic acid, (−)-epicatechin, (−)-epigallocatechin, and ferulic acid. Decreases in the contents of gallic acid, p-benzoquinone, β-resorcylic acid, salicylic acid, ellagic acid, luteolin, naringenin, (+)-catechin, trans-3-hydroxycinnamic acid, myricetin, and pyrocatechol were found (Figure 4).
In order to analyze the content of phenolic compounds more precisely, acid hydrolysis of the extracts was performed, which allowed the separation of pools of free and conjugated phenolic compounds. The results concerning the Ni effect on free and conjugated phenol contents in the cucumber leaf and root are shown in Table 2 and Table 3, respectively.
In the control leaf, (−)-epicatechin occurred mainly in the free form (96.5%), while hesperetin was present mainly in the conjugated form (86.4%). Quercetin and luteolin occurred only in the conjugated form (Table 2). In the root, gallic acid was present mainly in the free form (99.1%), while ferulic acid occurred mainly in the conjugated form (96.5%). Similarly, quercetin occurred only in the conjugated form in the root of cucumber plants (Table 3).
Taking into account the entire pool of phenolic acids in the leaf, the content of their free forms increased about 1.6-fold as a result of Ni treatment. The largest increases in free forms, about 2-fold, were found for 4-hydroxybenzoic acid and ellagic acid. However in the case of most phenolic acids, Ni did not significantly influence the ratio of free to conjugated forms. As for the entire leaf flavonoid pool, the ratio of their free forms to their total content did not change after Ni treatment. However, the content of free procyanidin B2 increased by over 2.5-fold, while the content of free (−)-epicatechin and hesperetin decreased by 67% and 34%, respectively. In the root, increased release from conjugated forms was found for 10 phenolic compounds, with the largest, more than 8-fold, for ferulic acid, as well as trans-cinnamic acid (2.7-fold) and pyrocatechol (2.7-fold). A significant decrease in the abundance of free forms of phenolic compounds in the total pool was observed for seven phenolic compounds, the largest of which was observed for (−)-epigallocatechin (75%), (−)-epicatechin (51%), and o-coumaric acid (51%).

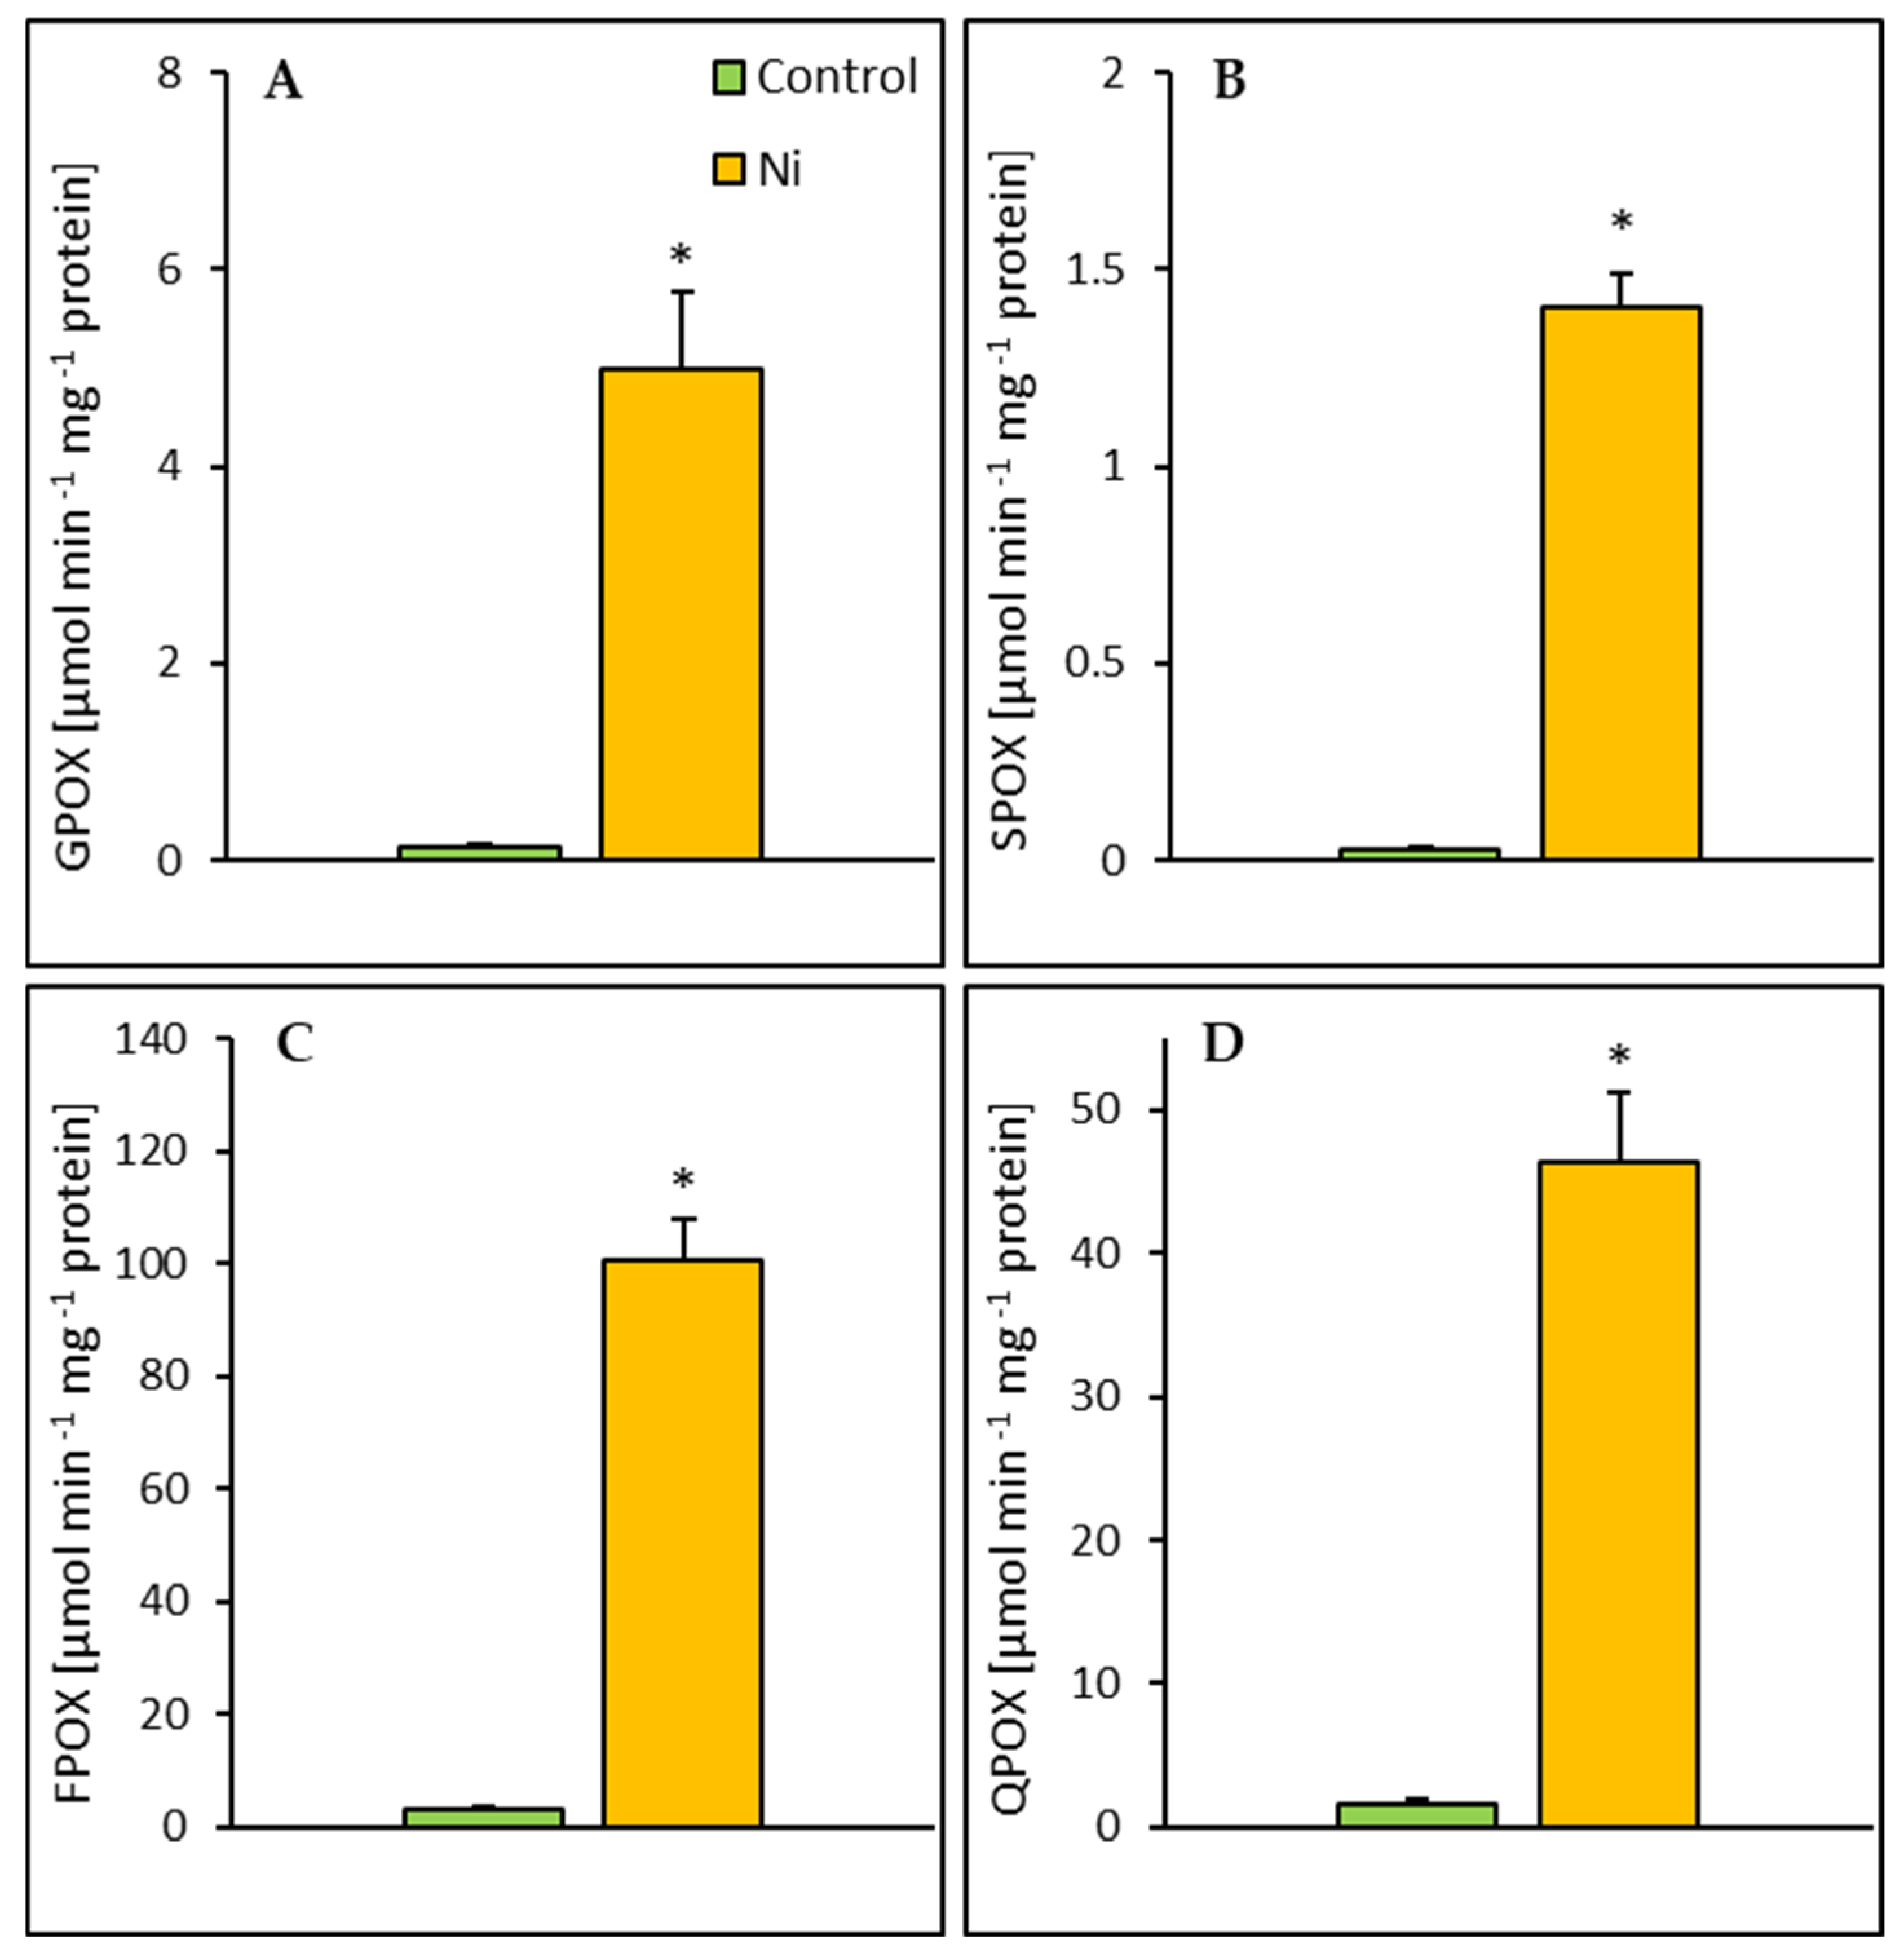
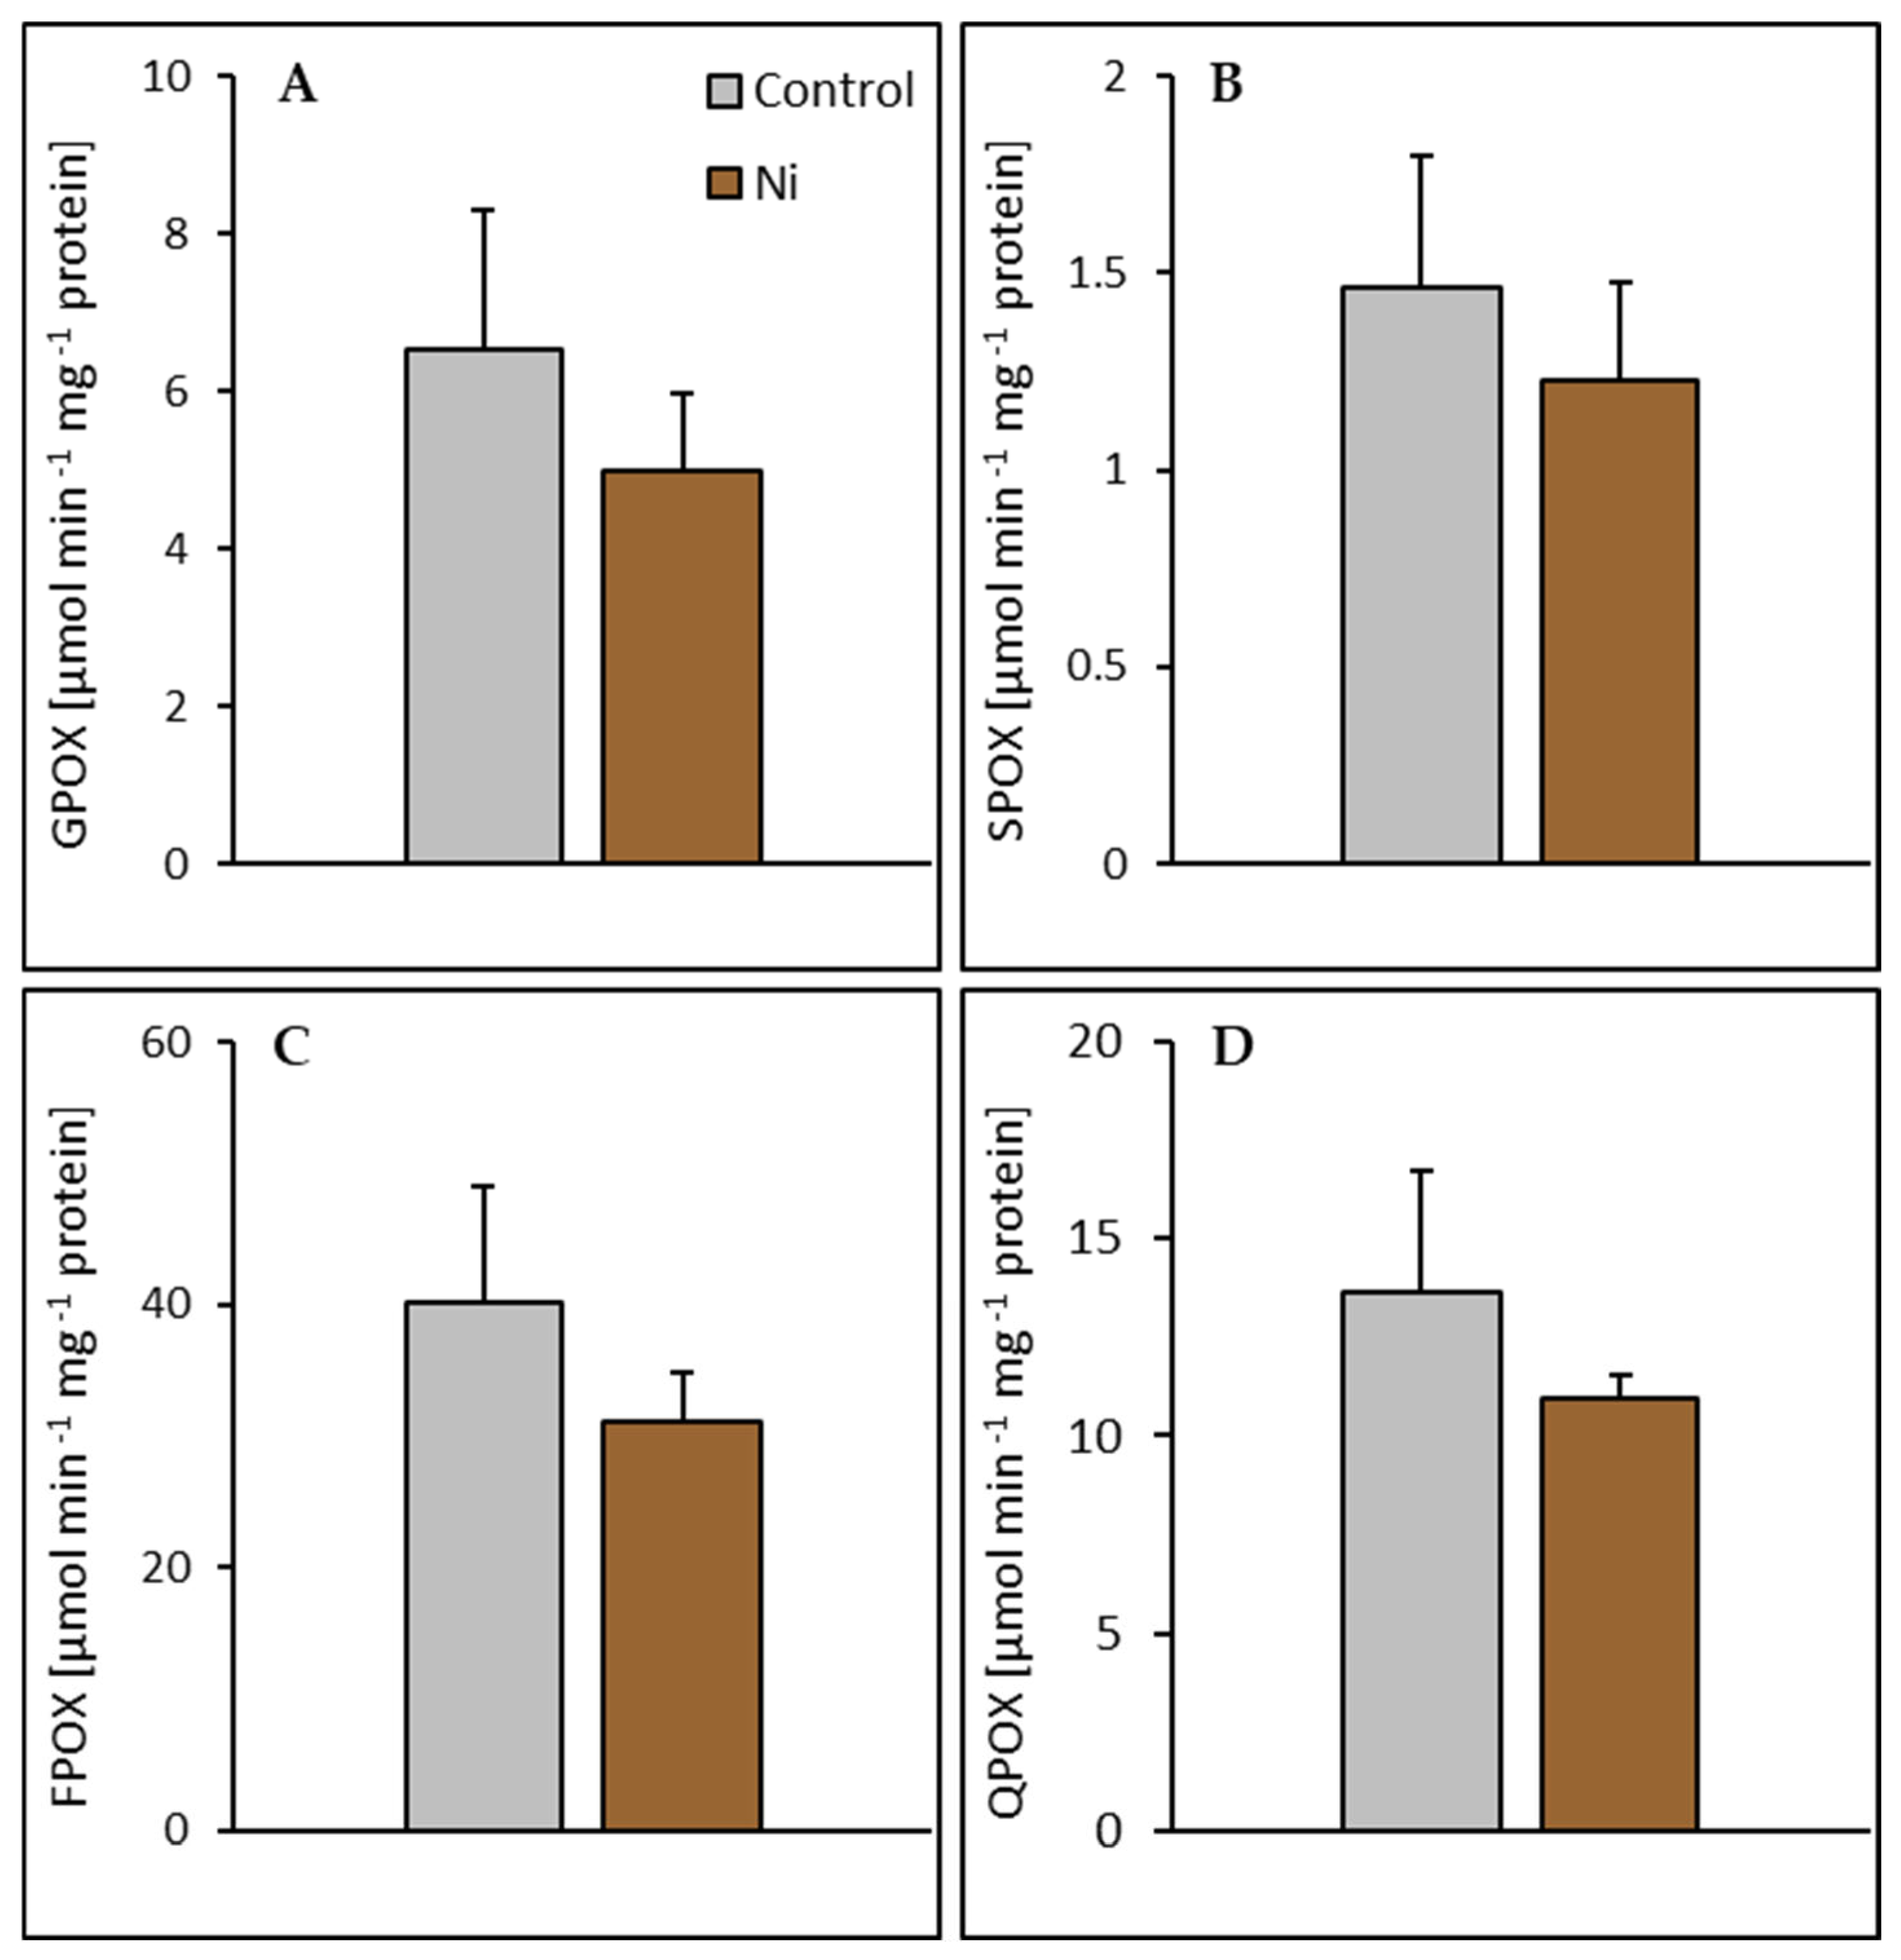
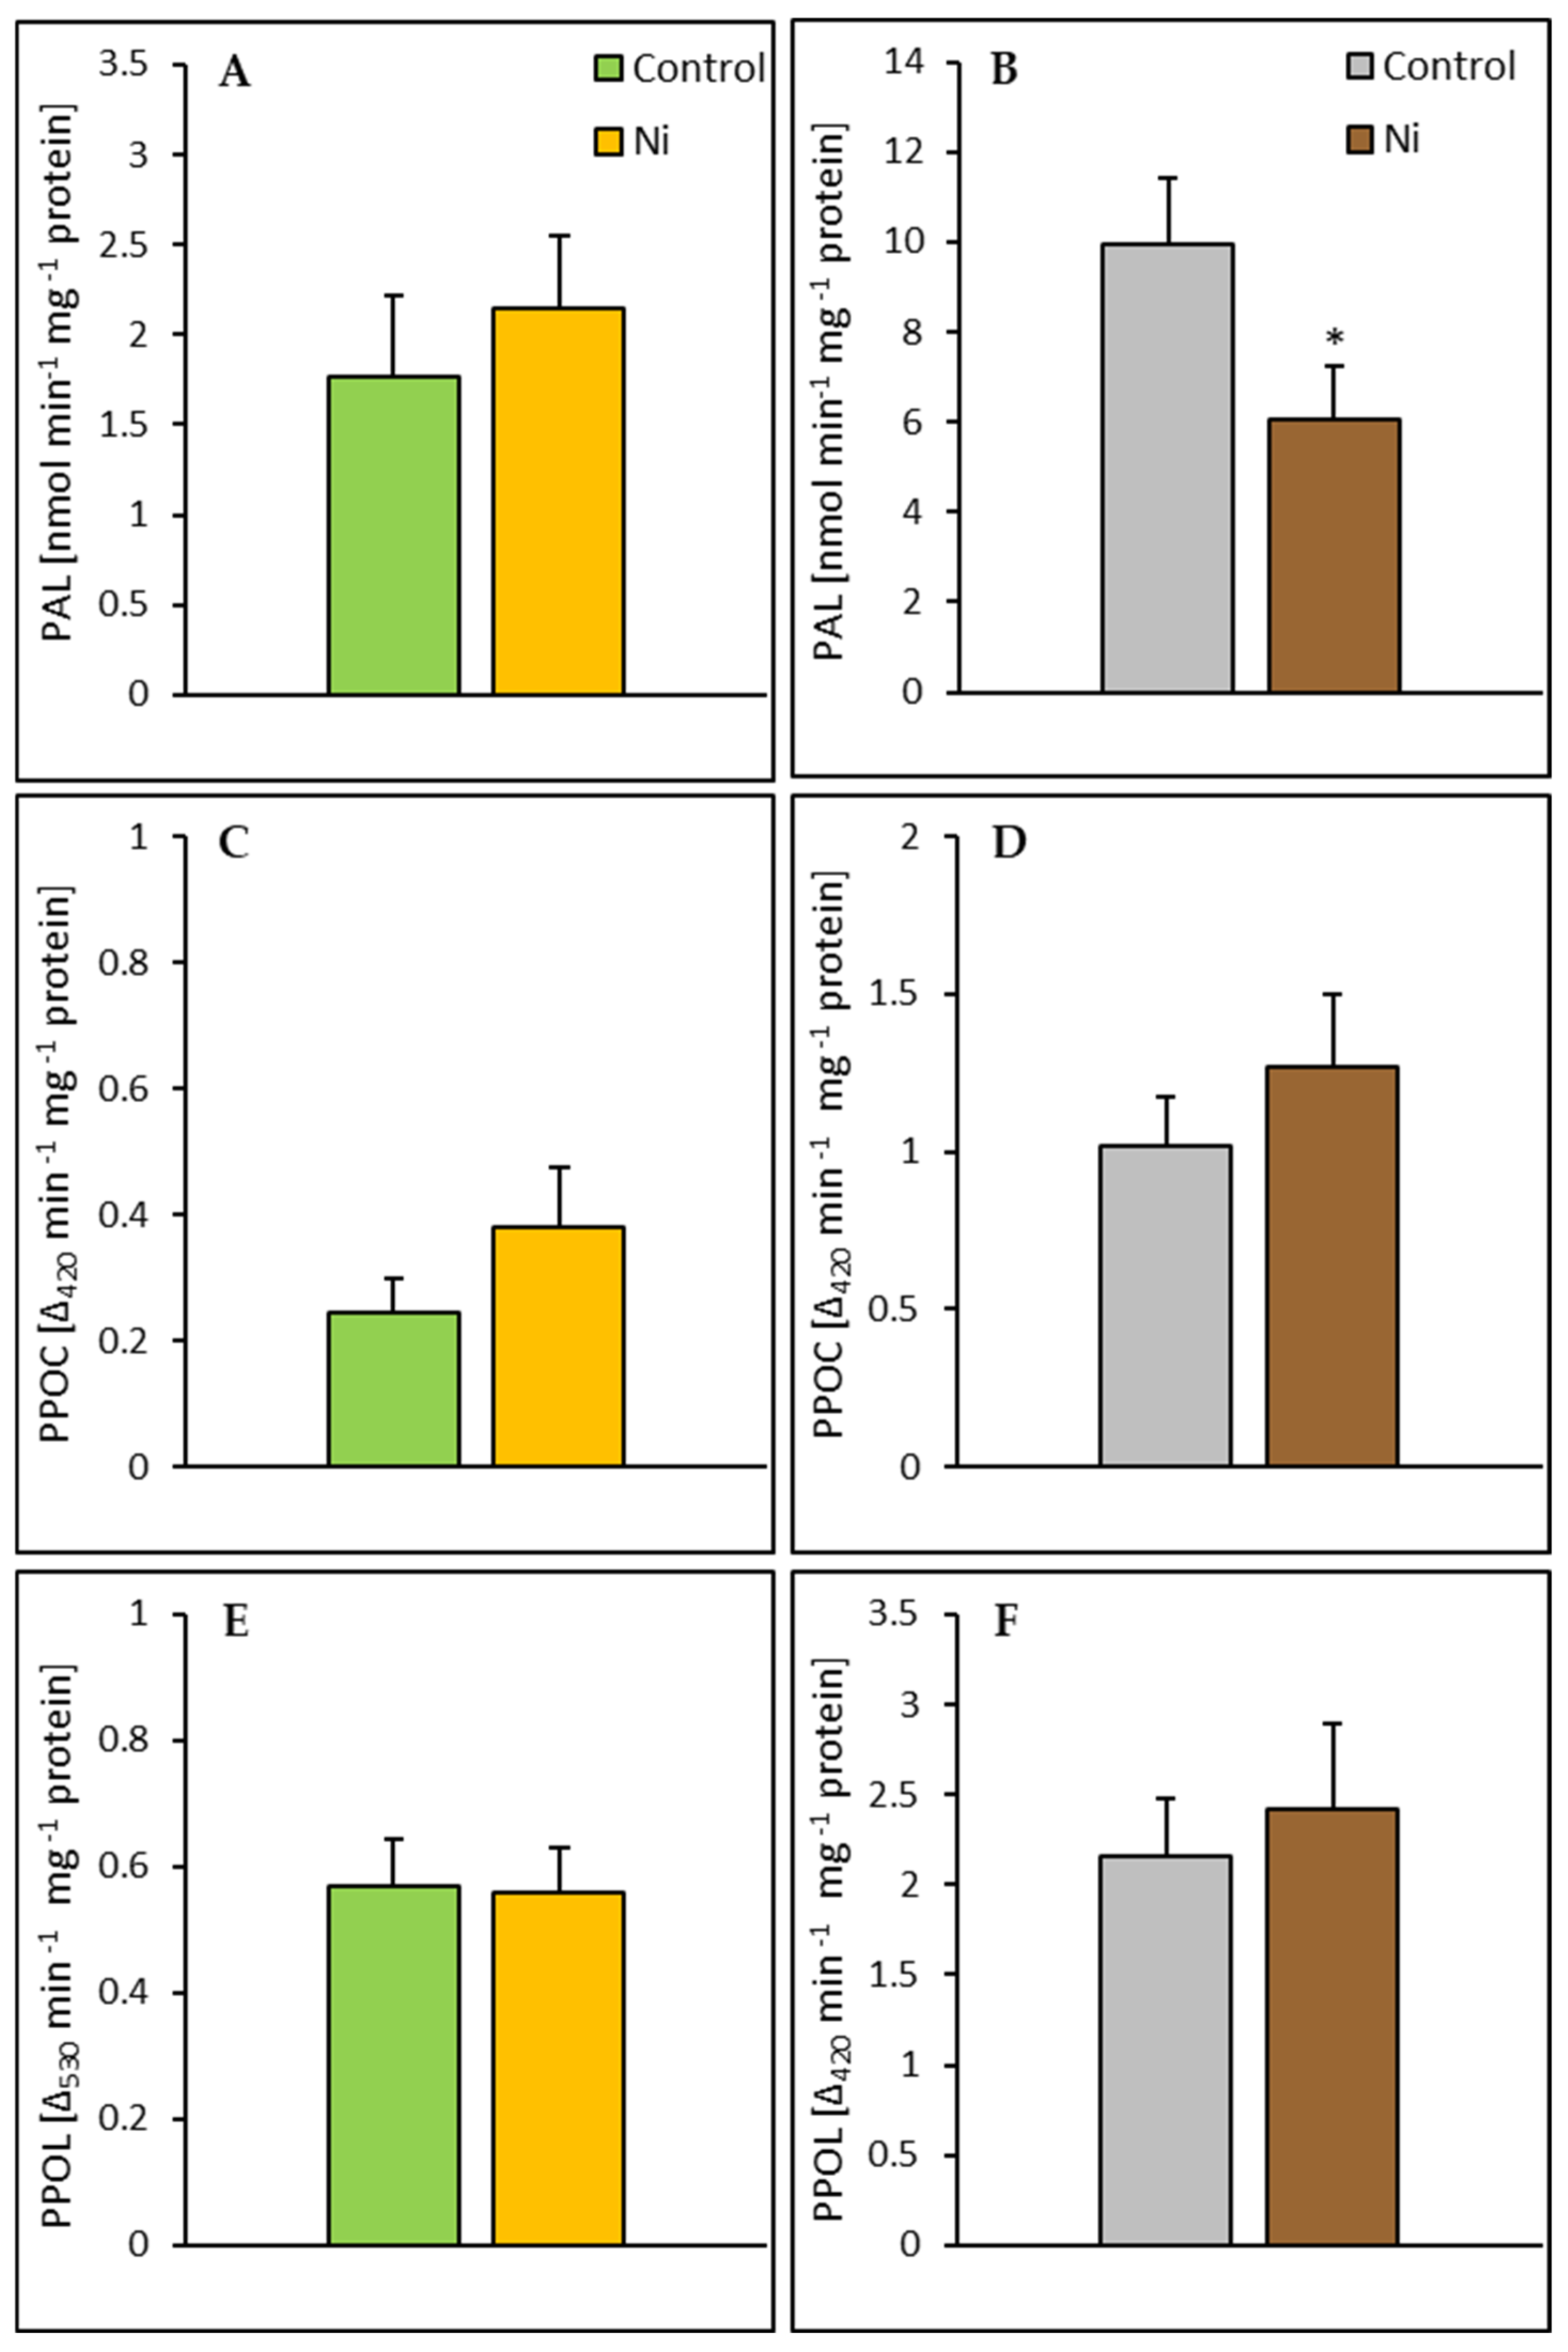
2.4. Enzyme Activities

In the leaf, Ni treatment caused a significant increase in POX activities assayed with all tested phenolic substrates: guaiacol (GPOX), syringaldazine (SPOX), ferulic acid (FPOX), and quercetin (QPOX) (Figure 5). Exposure of cucumber plants to Ni led to an increase in POX activities in the range of 30–47-fold depending on the substrate used. The highest activity increase was found for SPOX and the lowest was for QPOX. No significant changes in POX activities were noted in the root (Figure 6).
Exposure of cucumber plants to Ni resulted in a 39% decrease in PAL activity in the root but did not significantly affect the activity of this enzyme in the leaf. In both the leaf and the root, Ni application did not significantly alter the activities of PPOC and PPOL (Figure 7).

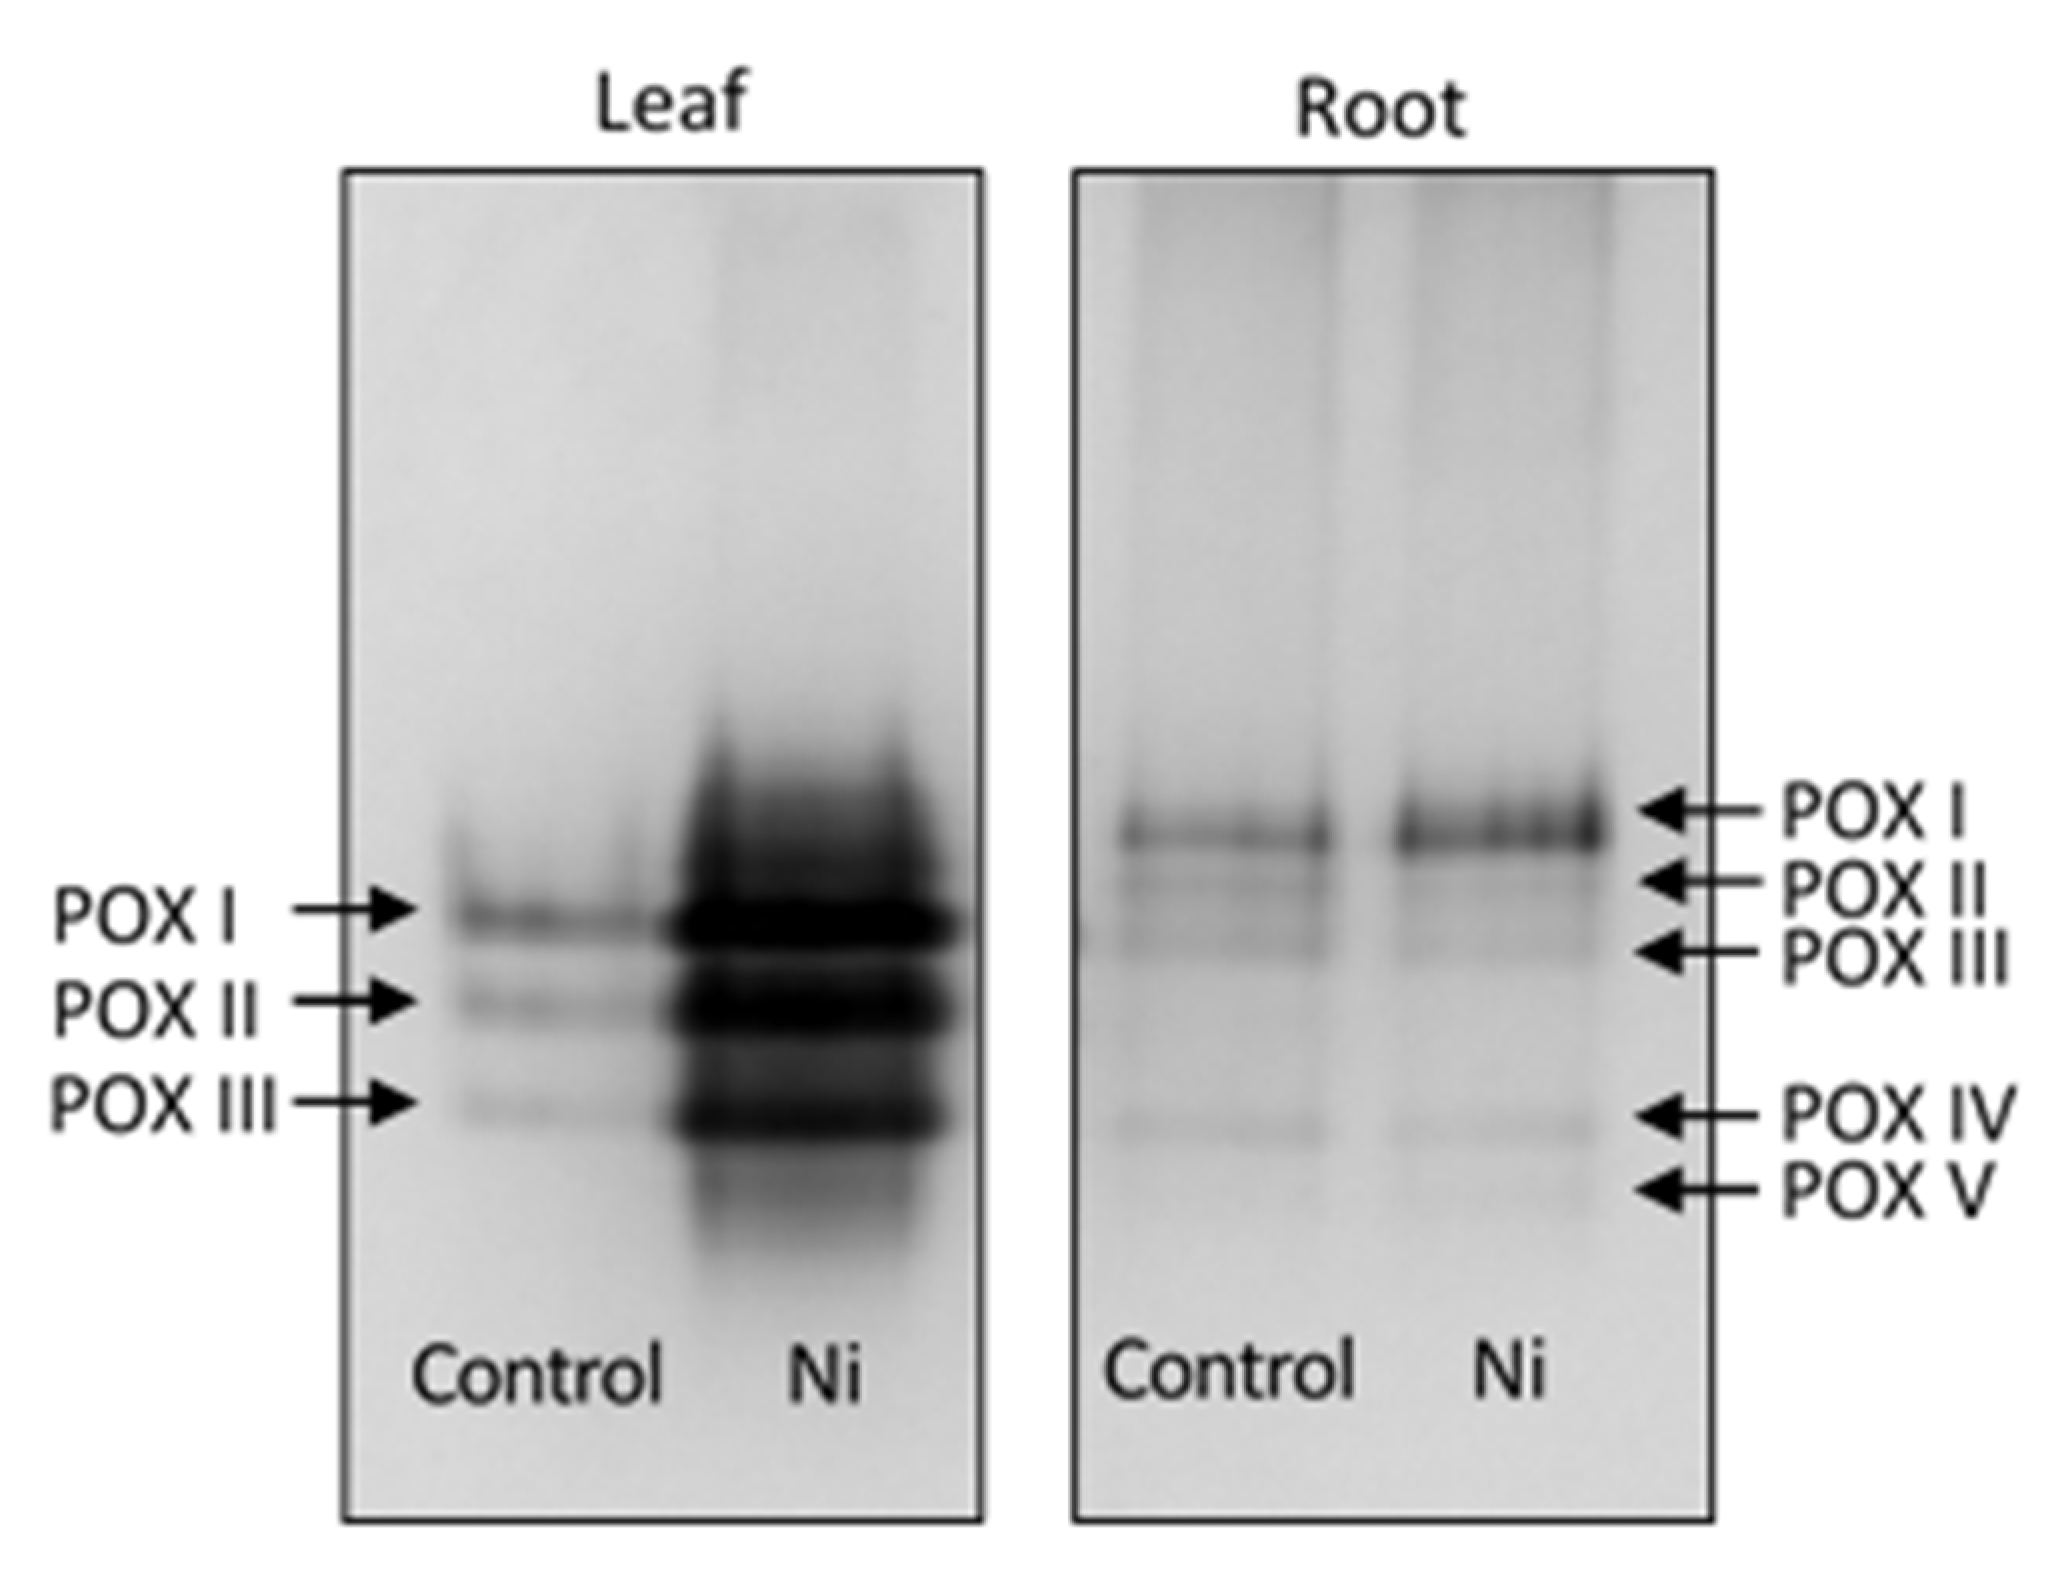
2.5. Native Polyacrylamide Gel Electrophoresis (PAGE)

Using electrophoretic protein separation, the differentiation of POX isoenzymatic forms was demonstrated. In the leaf of the control cucumber plants, three POX isoforms were detected, while in the root, five POX isoforms were found (Figure 8). Ni treatment led to an increase in the intensity of the bands constitutively present in the control. No new POX isoforms appeared after Ni treatment.

2.6. Histochemical Detection of Lignin

In situ detection of lignin in cucumber leaf and root was performed using phloroglucinol staining (Figure 9). Nickel treatment caused a significant lignin accumulation in the leaf. While in the control leaf lignin was mainly located in the veins, in the leaf of cucumber seedlings treated with Ni, pink spots indicating the presence of lignin were observed in interveinal areas, mainly at the edge of the blade. The roots of the control and Ni-treated plants showed no visible differences in lignin accumulation.

3. Discussion

Growth inhibition is a common plant response to stress, including that caused by heavy metals. In accordance with the results of previous studies on the Ni effect on plants [19,20,21], we found over a 50% decrease in the fresh weight of cucumber seedlings, with the root being slightly more affected compared to the leaf. The stronger inhibition of root growth could be related to the more-than-twice-higher Ni accumulation in this organ compared to the leaf. Higher Ni accumulation in roots was also found in wheat [22] and peanuts [23]. Accumulation of most of the uptaken metal in the underground part is a typical reaction of excluder plant species, including cucumber [24]. This is considered a plant defense strategy aimed at protecting the photosynthetic apparatus against the toxic effects of metal [25].
Reduction in plant growth under Ni stress may result from disruption of metabolic pathways and physiological processes by the metal. Our previous studies conducted on wheat seedlings revealed the Ni-triggered disturbance in nitrogen and carbon metabolism [26,27]. Although growth suppression is usually considered to be a consequence of stress, it has also been proposed to be, at least partly, a strategy of adaptation to stress conditions [28]. The existence of such a mechanism in cucumber plants subjected to Ni stress cannot be excluded.
Nickel has been reported to affect water relations in plants, which was evidenced by decreased RWC [29,30]. In contrast, in our study, Ni treatment did not significantly influence RWC in either the leaf or the root. The possible explanation for this result could be that the applied Ni dose was not high enough to affect water relations in the leaf or root tissues.
Apart from growth parameters, photosynthetic pigment contents and chlorophyll a fluorescence are often measured to assess stress level in plants. The total chlorophyll content in the cucumber leaf decreased in response to Ni treatment; however, only in the case of chlorophyll a did this reduction occur at a statistically significant level. Reduction of chlorophyll content in response to stress factors, including metals, may be the result of its reduced biosynthesis [31] or increased degradation [32]. It is possible that the reduction in chlorophyll content observed in our study was also associated with a significant decrease in carotenoid concentration. It is believed that carotenoids, as non-enzymatic antioxidants, play an important role in protecting chlorophyll against oxidative stress [33]. A decrease in carotenoid concentration in response to Ni treatment was also found in pumpkin leaves [34].
The fluorescence-decline ratio is considered to be an excellent vitality index and indicator of stress condition in plants [35]. In our study, the Rfd value remained unchanged, which could suggest that Ni treatment did not affect the vitality of cucumber plants. Contrary to our findings, exposure of green filamentous alga Zygnema sp. to Cd and Zn led to a decrease in Rfd [36]. Although Rfd was not altered in the Ni-treated cucumber, the QY, reflecting the maximum photochemical efficiency of photosystem II (PSII), was significantly decreased. A decline in QY was previously reported for Ni-treated wheat seedlings [37]. Disruption of the PSII functioning under Ni-stress conditions may result from photoinhibition in the PSII reaction center induced by this metal, as demonstrated by Jahan et al. [38]. Reduction in QY was also observed in plants exposed to Cu [39], Cd, and Pb [40]. Non-photochemical quenching (NPQ) based on thermal dissipation of excess light energy is thought to be an important process preventing photoinhibition in plants subjected to stress [41]. Decreased NPQ found in our study indicates that the NPQ-dependent energy dissipation mechanism was affected by Ni stress. This could be related to a pronounced decrease in carotenoid content in the cucumber leaf. Xanthophylls, which are a type of carotenoids, are involved in the protection of the photosynthetic apparatus by dissipating excessive excitation energy in the form of heat. Consistent with our results, NPQ decline was also observed in mulberry leaves after Pb and Cd application [40]. However, increases in NPQ in response to heavy metal treatment were also reported [39,41]. Our results suggest that QY and NPQ are better than Rfd indicators of a stress condition in Ni-treated cucumber plants.
It has been reported that overexcitation of the photosynthetic apparatus may result in ROS formation [41]. Our previous study conducted on Ni-stressed cucumber plants revealed a marked accumulation of O 2 . - and H 2 O 2 in the leaf [18]. It can be suggested that the observed enhancement of ROS levels in cucumber leaves could have been, at least partly, related to the Ni-induced disturbance of the NPQ mechanism.
Phenolic compounds are considered to play an important protective role in plants under stress conditions [5]. It has been suggested that the concentration of phenolics in plant tissues may be used to assess the impact of environmental stress in plants [42]. HPLC analysis revealed distinct constitutive phenolic profiles in the cucumber leaf and root. Compared to the leaf, in the root more compounds, mainly phenolic acids, were detected. In the root, 16 phenolic acids were found, while in the leaf, only 8 phenolic acids were present. With regard to flavonoids, a similar number of compounds were detected in both organs. Some compounds occurred exclusively in the leaf or in the root. Apart from the qualitative differences in phenolic composition, the organs also differed in the quantity of individual compounds. Among phenolic acids, in the leaf, ellagic acid was the most abundant, while in the roots, sinapic acid was the dominating compound. However, in both organs, (+)-catechin was the most abundant flavonoid. Variation in the phenolic compound composition between leaves and roots was also reported for other plant species. According to the literature data, phenolic compound composition is both species- and organ-specific [3,43,44].
Nickel treatment generally did not influence the total contents of phenolic acids and flavonoids detected in the leaf and slightly decreased them in the root. However, changes were found in the content of most individual compounds. Both increases and decreases were observed in phenolic contents after Ni treatment. In the leaf, the most pronounced increase was shown for (−)-epicatechin and the strongest decrease for naringenin. Two new compounds, absent in the control, namely, trans-3-hydroxycinnamic acid and gallic acid, appeared in the leaf in response to Ni treatment. The emergence of new compounds was also reported for the leaves of Basilicum polystachyon treated with Pb and Hg [45]. The appearance of gallic acid in the leaf of cucumber plants exposed to Ni was accompanied by a decrease in ellagic acid content, which may imply the metal-induced degradation of ellagic acid, a dimeric form of gallic acid. It is also possible that the increase in (−)-epicatechin content could have resulted from the epimerization of (−)-catechin, whose content was significantly decreased in response to Ni treatment. In the root chlorogenic, p-coumaric and o-coumaric acids, being the less abundant in the control plant, showed the most pronounced increases in response to Ni application. The most affected was the gallic acid content. Similarly to the leaf, Ni-evoked conversion of (−)-catechin to (−)- epicatechin can be suggested. In accordance with our findings, the total phenolic acid content remained unchanged in the leaves of Ni-treated Matricaria chamomilla plants. However, in contrast to the cucumber plants, the M. chamomilla roots responded to Ni stress with an accumulation of phenolic acids [3].
Accumulation of phenolic compounds in the tissues of Ni-treated cucumber plants may be related to their involvement in defense against Ni stress. Phenols are known for their antioxidant properties. The most important determinants for the antioxidant potential of phenols are the number and localization of OH groups. Flavonoids’ antioxidant activity additionally depends on the presence of a 3 OH group in the C ring and a 5 OH group in the A ring as well as the presence of the orto-3’,4’-dihydroxy structure in the B ring [4]. Apart from antioxidant activity, phenolic compounds are also good metal chelators [8]. Ni2+ ions were shown to bind preferentially to carboxyl groups of hydroxycinnamic acids [46].
Phenolic compounds, similar to other secondary metabolites, often occur in plants as glycoconjugates. Most phenolics are nucleophilic molecules with high damage potential to cellular components. It is believed that storing phenolic compounds in the form of inactive conjugates is a common strategy to protect plants from their toxicity. Glycosylated phenolics are considered as a reserve of active compounds which can be mobilized under stress conditions. Moreover, glycosylation increases the stability and solubility of phenolics and thus is essential for their transport within plants [47,48]. To obtain better insight into the Ni effect on phenolic composition in cucumber plants, we analyzed leaf and root extracts before and after acid analysis, which is believed to degrade glycosidic bonds [45]. This allowed us to distinguish between free and glycosylated phenolic forms. Taking into account the total phenolic acid and flavonoid pools in the control leaf, the conjugated forms dominated. Similarly, in the control B. polystachyon leaves, mainly glycosides of phenolic acids were found [45]. In the cucumber root, free and conjugated forms of phenolic acids and flavonoids were present in similar quantities. Individual compounds showed various aglycon/glycoside ratios. Some of them occurred mainly as free forms and others mainly as glycosides. Quercetin in both organs and luteolin in the leaf were found exclusively as glycosylated forms.
Nickel treatment markedly influenced the ratio of the free to the conjugated form of individual compounds, resulting in both increases and decreases in the free-form content depending on the compound. In the leaf, generally, the amount of free phenolic acids increased in response to Ni treatment, indicating the Ni-induced degradation of conjugates. In line with our findings, stimulation of phenolic acid deglycosylation was reported for the leaves of B. polystachyon exposed to Pb and Hg. In the cucumber root, the deglycosylation degree of the total phenolic acids pool was lower compared to the leaf; however, a considerable release of the free forms of some compounds was found. The free ferulic acid content in the roots of Ni-treated cucumber plants was over 8-fold higher compared to the control. Taking into account the total flavonoid pool, the content of their aglycones in the leaf remained unaltered. Contrary to our results, an intensive release of isoflavonoid aglycones was reported for Cu-treated alfalfa seedlings [49]. A decrease in the root total free flavonoid content found in our study could have resulted mainly from the Ni-stimulated glycosylation of some individual compounds, including (−)-epicatechin and (−)-epigallocatechin, accounting for 40% of the total flavonoid content. The glycosylation status of phenolic compounds is regulated by the action of glycosyltransferases catalyzing the formation of glycoconjugates and glycoside hydrolases degrading the glycosidic bond between the phenol and sugar moiety [47]. Thus, the changes in the amount of free and conjugated phenolic forms observed in cucumber plants may suggest activation of these enzymes under the condition of Ni stress.
The release of phenolic compounds from their conjugated forms may improve their antioxidant and chelating activity. The glycosylated forms of phenols were found to exhibit lower antioxidant potential compared to their aglycones [50]. It is also believed that free phenolic compounds have higher complexing potential than the respective glycosides [6,8]. Deglycosylated forms of phenolics, especially flavonoids, may also serve as electron donors for POXs and thus can be involved in the removal of H 2 O 2 [51].
Salicylic acid (SA) is an important signaling molecule, activating plant defense responses against both biotic and abiotic stresses [52,53]. In the pool of phenolic acids in cucumber plants, a small quantity of SA was found. In the leaf and the root, it accounted for 0.2% and 0.1% of the total phenolic acids content, respectively. A similar abundance of SA was also reported for M. chamomilla leaf and root tissue [3]. In cucumber plants, the total SA content was not significantly influenced by Ni treatment in the leaf, but in the root, it was significantly decreased. To our knowledge, only one paper dealing with the Ni effect on SA content has been published before [3]. Both increases and decreases in SA content were observed in the root and leaf of M. chamomilla plants depending on the Ni dose. In the present study, in both cucumber organs Ni treatment did not influence the ratio of free to conjugated SA forms. Both our findings and the results of the above-cited paper do not provide a clear answer regarding the role of endogenous SA in the plant response to Ni stress. However, an enhancement of Ni stress tolerance after the application of exogenous SA was demonstrated for mustard plants [54].
Phenolic biosynthesis begins with PAL-catalyzed deamination of L-phenylalanine. In our study, no significant modifications in PAL activity were found in the leaf, and in the root, it was decreased in response to Ni treatment. Unchanged PAL activity in the leaf corresponded with the unaltered content of trans-cinnamic acid, the direct product of the PAL-catalyzed reaction. In the roots, despite decreased PAL activity, trans-cinnamic acid content also did not show changes compared to the control. In the cucumber leaf, unaltered PAL activity was accompanied by the total content of detected phenolic compounds being unchanged. In the root, both PAL activity and phenolic compound content showed a decreasing trend in response to Ni application. Our results suggest that Ni stress did not induce de novo synthesis of phenolic compounds in cucumber plants. The observed changes in the content of individual compounds might have resulted from the metal-triggered conversions of the compounds constitutively present in the cucumber tissues. In agreement with the results of our study, unaltered or reduced PAL activity was found in the roots of Pb-treated soybean seedlings [55] and in the cotyledons of Ni-treated Jatropha curcas [2], respectively. However, increases in this enzyme activity in the responses of plants to heavy metal treatment have also been reported [55,56,57].
Enzymatic oxidation of phenolic compounds may be catalyzed by PPOs or POXs using O 2 or H 2 O 2 as electron acceptors, respectively. In our study, both in the leaf and the root, neither PPOC nor PPOL activity was significantly influenced by Ni treatment. Similarly, unaltered PPO activity was found in the leaves of Ni-treated M. chamomilla [3] and Cd-treated Brassica juncea plants [58]. In contrast, a pronounced increase in PPO activity was observed in the leaves and roots of Cu- and Zn-treated Kandelia obovata plants [42]. A significant reduction in this enzyme activity was reported for the roots of Ni-treated M. chamomilla [3]. In our study, POX activities in the leaf increased markedly after Ni, while in the root no significant alterations in POX activities were observed. Similarly, Ni-induced several-fold enhancement in POX activity in the shoot accompanied by unchanged activity of this enzyme in the root was reported for wheat seedlings [59]. Depending on the substrate used in the assay, POX activity in the leaf of Ni-treated cucumber plants was 30–47-fold higher compared to the respective control. Apart from the widely used unspecific substrate guaiacol, we also measured POX activity using more specific substrates, namely, ferulic acid, and syringaldazine, which are considered to reflect the activities of POXs involved in plant cell wall strengthening processes, namely, diferulate bridge formation and lignin synthesis, respectively [12,14]. Increased FPOX and SPOX activities found in the cucumber leaf may suggest that Ni treatment activated the POX-mediated processes of cell wall reinforcement. A Ni-induced increase in SPOX activity accompanied by accumulation of lignin was demonstrated in the roots of rice seedlings [60].
Peroxidases using quercetin or other flavonoids as electron donors are believed to play an important role in the removal of H 2 O 2 [15,51]. In the leaf of Ni-treated cucumber plants, we found a considerable increase in QPOX activity, which coincided with a significant accumulation of H 2 O 2 reported in our previous work [18]. Since an enhancement in H 2 O 2 level was accompanied by a decrease in CAT and only a slight increase in APX activities [18], it can be suggested that in the Ni-stressed cucumber leaf, QPOX may be involved in H 2 O 2 detoxication, thereby supporting the main antioxidant enzymes degrading this ROS.
Plant peroxidases are known for the multiplicity of their isoforms [9]. To obtain insight into the effect of Ni on POX isoforms, non-denaturing PAGE of the leaf and the root proteins was performed. In the control plants, three POX isoforms were detected in the leaf and five isoforms in the root. In both organs, Ni treatment increased the intensity of POX bands already present in the control; however, the POX isoform pattern remained unchanged. Consistent with our results, an increase in individual isoform activities and lack of appearance of new isoforms were reported for cotyledons of Ni-treated Jatropha curcas [2]. In contrast, in garden cress sprouts, two new POX isoforms were found in response to Cd and Pb treatment [61].
Lignin is principally deposited in the secondary wall of certain plant tissues, including the xylem and phloem. Synthesis of this polymer may be also induced in response to biotic and abiotic stress. In plants exposed to heavy metals, lignin is considered to serve as the physical barrier against metal ions’ ingress into the cell [62]. Staining with phloroglucinol revealed a considerable accumulation of lignin in the leaf of the Ni-treated cucumber plant. Lignin distribution in the leaf blade generally corresponded with the pattern of necrotic spots that appeared in response to Ni treatment. Accumulation of lignin accompanied by an increase in SPOX activity implies the Ni-promoted POX-dependent lignification in the cucumber leaf. There are some previous reports on an enhancement in lignin content in response to heavy metals [39,56,63]; however, to our knowledge, the phloroglucinol-based in situ lignin detection in heavy metal-stressed plants has not been presented before. Contrary to the leaf, in the cucumber root neither enhanced lignin deposition nor an increase in SPOX activity was found. Increased lignification is believed to be responsible for growth reduction in heavy metal-treated plants [63]. Our results indicate that in the Ni-treated cucumber plants, restriction of the leaf blade growth might be attributed, at least partly, to an increased lignification; however, other processes had to be involved in the root growth inhibition.

4. Materials and Methods

4.1. Plant Material and Growth Conditions

Seeds of cucumber (Cucumis sativus L.) cv. Cezar were germinated for 6 days. Then the seedlings were transferred into diluted (1:4) Hoagland nutrient solution containing 10 µM Ni supplied as chloride. An equimolar concentration of Cl- (in the form of NaCl) was added to the control nutrient solution instead of NiCl2. The pH of the nutrient solution was adjusted to 5.8. The plants were grown in a controlled-climate room at 24 °C and 175 µmol m−2 s−1 photosynthetic photon flux density (PPFD), with a 16 h photoperiod. After 14 days, the 1st leaves and roots were harvested. Samples were immediately frozen in liquid nitrogen and stored at −70 °C pending analysis.

4.2. Growth Parameters, Ni Contents, and Relative Water Content

The fresh weight (FW) of the leaves and roots was measured immediately after harvesting. Dry weight (DW) was measured after oven-drying of the leaf/root sample for 48 h at 105 °C. Relative water content (RWC) was determined according to Smart and Bingham [64] and calculated as RWC [%] = [(FW − DW)/(FSW − DW)] × 100. Fully saturated weight (FSW) was determined after floating of the leaf/root sample in distilled water for 4 h at 20 °C in darkness.
Nickel contents in the cucumber tissues were determined by atomic absorption spectrometry. The dried tissue (100 mg) was digested in 5 cm3 69% HNO3 using a microwave mineralizer (UniClever, Plazmatronika, Wroclaw, Poland). Nickel contents were determined using a Varian SpectrAA 300 spectrometer (Varian Australia Pty. Ltd., Mulgrave, Australia) equipped with a deuterium lamp for background correction and an air/acetylene flame at 232 nm. The standards of Ni (T.J.Baker, Phillipsburg, NJ, USA) were used for calibration. Nickel contents were expressed in µg per g DW.

4.3. Photosynthetic Pigment Concentrations and Chlorophyll a Fluorescence

For determination of photosynthetic pigment concentrations, the leaves were homogenized twice with 80% acetone and centrifuged (33,987× g, 15 min). After measurement of absorbance of the supernatants at 663 nm, 647 nm, and 470 nm, chlorophyll a, chlorophyll b, and total carotenoid contents were calculated according to the method of Wellburn [65].
Maximum photochemical efficiency of PSII (QY), fluorescence decline ratio (Rfd), and non-photochemical quenching (NPQ) were estimated using a portable fluorometer FluorPen FP110-LM/D (Photon Systems Instruments, Drásov, Czech Republic). Prior to measurements, the plants were dark-adapted for 20 min. Five measurements were performed per leaf blade, and the results were averaged.

4.4. HPLC Analysis

The plant tissue was homogenized in a mortar in an 80% methanol solution (1:5 w/v), then the homogenate was centrifuged (33,987× g, 15 min, 4 °C). The obtained supernatant was poured off and the pellet was extracted with 90% methanol solution and centrifuged again (33,987× g, 15 min, 4 °C). After pouring off the supernatant, the pellet was extracted with 100% methanol and centrifuged (33,987× g, 15 min, 4 °C). The mixture of 3 obtained supernatants was poured into round-bottom flasks and evaporated to dryness under vacuum at 65 °C. The residue was re-dissolved in hot distilled water and poured into centrifuge tubes. The procedure was repeated 3 times, and the supernatants were centrifuged (33,987× g, 15 min, 4 °C). The obtained extracts were supplemented with water to the same volume (6 cm3) and divided into two parts: for the determination of free and conjugated phenolic compounds. To determine the pool of free phenolic compounds, 0.5 cm3 of the extract was taken, poured into an Eppendorf tube, and mixed with 1 cm3 of HPLC-grade methanol. To determine the content of free SA, the extracts were adjusted to pH~2, and the resulting precipitate was centrifuged (33,987× g, 15 min) and extracted three times with a mixture of cyclopentane, ethyl acetate, and isopropanol (50:50:1), each time shaking and collecting the upper organic layer in round-bottom flasks. Then the extracts were evaporated in a vacuum evaporator at 55 °C, and the resulting precipitate was dissolved in 70% methanol with 0.5% formic acid. Until analysis, the samples were stored in a freezer at −18 °C.
To release phenolic compounds from the conjugated form, the extracts were subjected to acid hydrolysis. The extract (3 cm3) was hydrolyzed in 4 M HCl at 80 °C for 1.5 h. Then the samples were cooled and adjusted to pH ~ 2 with 30% NaOH, poured into centrifuge tubes, and centrifuged. To determine the content of phenolic compounds released from the conjugated form, 0.5 cm3 of the hydrolyzed extract was taken and poured into an Eppendorf tube, and 1 cm3 of methanol (HPLC-grade) was added. Extraction of the released salicylic acid was carried out with a mixture of cyclopentane, ethyl acetate, and isopropyl alcohol (50:50:1) in the same way as in the case of free SA. Until assayed, the samples were stored in a freezer at −18 °C.
Chromatographic analysis of the phenolic compounds was carried out using an HPLC system (Summit x2 Dual-Gradient System, Dionex, Sunnyvale, CA, USA) equipped with a photodiode-array detector (PDA100 DAD) and a fluorescence detector (RF-2000). Phenolic compounds present in the extracts were separated on an RP-C18 column (aQ Hypersil GOLD, 250 × 4.6 mm, 5 mm) joined with a guard column (GOLD aQ Drop-In guards, 10 × 4 mm2, 5 mm, Polygen, Gliwice, Poland) at 25 °C. The injection volume of the analyzed samples was 20 mm3. A mobile phase composed of water (A) and methanol (POCH, Gliwice, Poland) (B), both with 0.1% formic acid (Sigma-Aldrich, Saint Louis, MO, USA), was used. The linear gradient was started after 2 min of isocratic elution with 5% B, increasing slowly over 30 min to 55% B, followed by 5 min of isocratic elution. Between 35 and 45 min, the concentration of phase B increased to 70% followed by 5 min isocratic elution. Then between 50 and 52 min, the gradient was returned to the initial 5% B, and the column was recalibrated for the next 3 min. The flow rate was 1 cm3 min −1. The absorbance was measured at 235, 280, 325, and 375 nm and the fluorescence at 420 nm (excitation 270 nm, emission 420 nm). Phenolic compounds in the extracts were identified by comparing the retention times and online UV absorption spectra of the analyzed samples with the respective data obtained from reference standards (Sigma-Aldrich, Saint Louis, MO, USA). Quantification was based on calibration curves for standards of phenolic compounds covering the range 5–200 mg cm−3; the linearity of the calibration curve was verified by the correlation coefficient (r2 ≥ 0.9994). Prior to total phenolic content analysis, obtained water extracts were centrifuged (33,987× g, 20 min); additionally, before HPLC analysis, supernatants were filtered through a 45 µm syringe filter (Millipore, Billerica, MA, USA). The content of phenolic compounds was expressed as μg per g of FW.

4.5. Enzyme Extraction and Assays

The plant tissue was homogenized (1:10 w/v) in an ice-cold mortar using 50 mM sodium phosphate buffer pH 7.0 containing 1 mM EDTA. After centrifugation (33,987× g, 15 min, 4 °C) the supernatant was used for the determination of GPOX, SPOX, FPOX, QPOX, PAL, PPOC, and PPOL activities.
GPOX activity was measured by the method of Maehly and Chance [66]. The assay mixture contained 50 mM sodium acetate buffer pH 5.6, 5.4 mM guaiacol, 15 mM H 2 O 2 , and enzyme extract. The increase in absorbance due to the oxidation of guaiacol to tetraguaiacol (ε = 26.6 mM−1 cm−1) was monitored at λ = 470 nm. GPOX activity was expressed in micromoles of tetraguaiacol formed per 1 min per 1 mg of protein (µmol min−1 mg−1 protein).
SPOX activity was measured by the method of Imberty et al. [67]. The reaction mixture consisted of 50 mM phosphate buffer (sodium salt) pH 6.0, 0.11 mM H 2 O 2 , enzyme extract, and 29 μM syringaldazine, the addition of which initiated the reaction. At the same time, reference samples without H 2 O 2 were prepared. The increase in absorbance was determined at a wavelength of λ = 530 nm for 4 min. Enzyme activity was calculated using the molar absorption coefficient for the syringaldazine oxidation product, ε = 27 mM −1 cm−1. SPOX activity was expressed in micromoles of syringaldazine oxidized per 1 min per 1 mg of protein (µmol min−1 mg−1 protein).
FPOX activity was determined based on the change in absorbance during oxidation of ferulic acid (ε = 11.3 mM−1 cm−1) according to a modified method described by Takahama [68]. The reaction mixture contained 50 mM phosphate buffer (sodium salt) pH 6.0, 0.1 mM H 2 O 2 , enzyme extract, and 0.14 mM ferulic acid. Absorbances were measured on a spectrophotometer at a wavelength of λ = 310 nm for 4 min. FPOX activity was expressed in micromoles of ferulic acid oxidized per 1 min per 1 mg of protein (µmol min−1 mg−1 protein).
QPOX activity was determined based on the change in absorbance during quercetin oxidation (ε = 17,5 mM−1 cm−1) [69] according to the modified method of Takahama and Hirota [70]. The reaction mixture contained 50 mM phosphate buffer (sodium salt) pH 7.0, 50 µM quercetin, enzyme extract, and 50 µM H 2 O 2 . Absorbances were measured on a spectrophotometer at λ= 380 nm for 4 min. QPOX activity was expressed in micromoles of quercetin oxidized per 1 min per 1 mg of protein (µmol min−1 mg−1 protein).
PAL activity was determined spectrophotometrically according to the modified method of Kolupaev et al. [71]. The reaction mixture contained borate buffer pH 8.8, enzyme extract, and 50 mM L-phenylalanine. Enzyme activity was measured at λ = 290 nm, and then the samples were incubated at 37 °C. After an hour, 5 M HCl was added and the absorbance was determined again. Enzyme activity was calculated using the molar absorption coefficient for the formed product (trans-cinnamic acid), ε = 9 mM−1 cm−1. PAL activity was expressed in nanomoles of trans-cinnamic acid formed per 1 min per 1 mg of protein (nmol min−1 mg−1 protein).
Activities of polyphenol oxidases: PPOC and PPOL were assayed according to the modified method by Dörnenburg and Knorr [72]. For the PPOC assay, the reaction mixture (2 cm3) consisted of 0.05 M sodium acetate buffer pH 5.6, 11.35 mM pyrocatechol, and the enzyme extract. After 2 h of incubation at 30 °C, the absorbance was measured at 420 nm. For the PPOL assay, the reaction mixture (2 cm3) consisted of 0.05 M sodium acetate buffer pH 5.6, 6.9 mM 1,4-phenylenediamine dihydrochloride, and the enzyme extract. After 2 h of incubation at 30 °C, the absorbance was measured at 530 nm. The activities of PPOC and PPOL were expressed as a change in absorbance per 1 min per 1 mg of protein.

4.6. Native Polyacrylamide Gel Electrophoresis (PAGE)

The electrophoretic separation of POX isoenzymes was carried out in a polyacrylamide gel under non-denaturing conditions. The plant tissue was homogenized (1:10 w/v) in 50 mM sodium phosphate buffer pH 7.0 containing 1 mM EDTA and 1% PVP. The samples were then centrifuged (33,987× g, 15 min, 4 °C). The supernatant was mixed with loading buffer (40% sucrose, 0.01% bromophenol blue) in a ratio of 2:1 v/v.
The electrophoretic separation of POX isoenzymes was carried out in an 8% polyacrylamide gel. The polyacrylamide gel was prepared in two stages. In the first stage, a separating gel was prepared, which contained deionized water, 30% acrylamide/bisacrylamide, 1.5 M Tris-HCl buffer pH 8.8, 10% ammonium persulfate, and 2.8 mM N,N,N′,N′-tetramethylethylenediamine (TEMED). To remove any air bubbles, an aqueous solution of isobutanol was applied to the separating gel. In the second stage, a thickening gel was prepared at a concentration of 4%, to which 0.5 M Tris-HCl buffer pH 6.8 was added instead of 1.5 M Tris-HCl buffer. The polymerized gels were placed in an electrophoresis apparatus (Mini-PROTEAN Tetra Cell, BioRad, Hercules, CA, USA) in 5x concentrated electrophoresis buffer (125 mM Tris and 1.25 M glycine, pH 8.3). Electrophoresis was carried out at a current intensity of 20 mA under a voltage of 100/165 V at a temperature of 4 °C until the migrating dye front reached the lower limit of the gel.
For the identification of POX isoforms, gels were stained for 30 min in 100 mM acetate buffer pH 5.0 with 0.2 M guaiacol at room temperature. H 2 O 2 was then added to a final concentration of 0.1% and incubated until bands appeared. Stained gels were analyzed using a Gel Doc EZ System gel documenter (BioRad, Hercules, CA, USA).

4.7. Lignin Detection

For the detection of lignin, a mixture of phloroglucinol–HCl (3% phloroglucinol in ethanol/concentrated HCl, 2:1, v/v) was used [73]. In the case of leaves, chlorophyll was removed using a mixture of methanol–acetic acid (9:1, v/v) before lignin detection [74]. Finally, the leaf and root scans were taken.

4.8. Statistical Analysis

The results are means of 3 independent experiments. For fresh weight estimation, 4 plants were analyzed per treatment in each experiment, so the data present the means of 12 observations. For the other parameters, 1–3 samples were analyzed per treatment in each experiment (n = 3–9). The significance of differences between Ni-treated seedlings and the control was estimated using one-way ANOVA followed by the Fisher’s least significant difference (LSD) test (p < 0.05). Sample variability was given as the standard deviation of the mean. The statistical analysis was carried out using Statistica 13.1 software.

5. Conclusions

Our study revealed the Ni-induced remodeling of the phenolics profile in the cucumber leaf and root. The changes in the content of individual compounds are suggested to result rather from conversions of the compounds constitutively present in the tissues than from de novo synthesis. The Ni-triggered release of free phenolics from their conjugated forms may lead to improvement of their antioxidant and chelating properties.

Author Contributions

Conceptualization, E.G.; methodology, E.G., A.W., A.K. and M.W.; formal analysis, A.W.; investigation, E.G., A.W., A.K. and M.W.; writing—original draft preparation, E.G. and A.W.; writing—review and editing, E.G., A.W. and A.K.; validation, E.G. and A.W.; visualization, A.W. and A.K.; supervision, E.G. All authors have read and agreed to the published version of the manuscript.

Funding

This research received no external funding.

Institutional Review Board Statement

Not applicable.

Informed Consent Statement

Not applicable.

Data Availability Statement

The original data presented in the study are openly available in [ijms-26-01237 data_Gajewska et al.] at [https://uniwersytetlodzki-my.sharepoint.com/:x:/g/personal/ewa_gajewska_biol_uni_lodz_pl/EZrT-h3PRbxCkb7baoQocbYBaqzNNh9yuq247qIzxoNbtA, accessed on 10 January 2025].

Conflicts of Interest

The authors declare no conflicts of interest.

Abbreviations

DWDry weight
FWFresh weight
FSWFully saturated weight
FPOXPeroxidase assayed with ferulic acid
GPOXPeroxidase assayed with guaiacol
H 2 O 2 Hydrogen peroxide
NPQNon-photochemical quenching
PALPhenylalanine ammonia lyase
POXPeroxidase
PPFDPhotosynthetic photon flux density
PPOCCatecholase
PPOLLaccase
PS IIPhotosystem II
RfdFluorescence decline ratio
ROSReactive oxygen species
RWCRelative water content
SASalicylic acid
SPOXPeroxidase assayed with syringaldazine
QPOXPeroxidase assayed with quercetin
QYMaximum photochemical efficiency of PS II

References

  1. Shahzad, B.; Tanveer, M.; Rehman, A.; Cheema, S.A.; Fahad, S.; Rehman, S.; Sharma, A. Nickel; Whether Toxic or Essential for Plants and Environment—A Review. Plant Physiol. Biochem. 2018, 132, 641–651. [Google Scholar] [CrossRef]
  2. Yan, R.; Gao, S.; Yang, W.; Cao, M.; Wang, S.; Chen, F. Nickel Toxicity Induced Antioxidant Enzyme and Phenylalanine Ammonia-Lyase Activities in Jatropha curcas L. Cotyledons. Plant Soil. Environ. 2008, 54, 294–300. [Google Scholar] [CrossRef]
  3. Kováčik, J.; Klejdus, B.; Bačkor, M. Phenolic Metabolism of Matricaria Chamomilla Plants Exposed to Nickel. J. Plant Physiol. 2009, 166, 1460–1464. [Google Scholar] [CrossRef] [PubMed]
  4. Michalak, A. Heavy Metals Toxicity Phenolic Compounds and Their Antioxidant Activity in Plants Growing under Heavy Metal Stress. Pol. J. Environ. Stud. 2006, 15, 523–530. [Google Scholar]
  5. Sharma, A.; Shahzad, B.; Rehman, A.; Bhardwaj, R.; Landi, M.; Zheng, B. Response of Phenylpropanoid Pathway and the Role of Polyphenols in Plants under Abiotic Stress. Molecules 2019, 24, 2452. [Google Scholar] [CrossRef] [PubMed]
  6. Goncharuk, E.A.; Zagoskina, N.V. Heavy Metals, Their Phytotoxicity, and the Role of Phenolic Antioxidants in Plant Stress Responses with Focus on Cadmium: Review. Molecules 2023, 28, 3921. [Google Scholar] [CrossRef]
  7. Olszowy, M. What Is Responsible for Antioxidant Properties of Polyphenolic Compounds from Plants? Plant Physiol. Biochem. 2019, 144, 135–143. [Google Scholar] [CrossRef]
  8. Hider, R.C.; Liu, Z.D.; Khodr, H.H. Metal Chelation of Polyphenols. In Methods in Enzymology; Academic Press: Cambridge, MA, USA, 2001; Volume 335, pp. 190–203. [Google Scholar]
  9. Hiraga, S.; Sasaki, K.; Ito, H.; Ohashi, Y.; Matsui, H. A Large Family of Class III Plant Peroxidases. Plant Cell Physiol. 2001, 42, 462–468. [Google Scholar] [CrossRef]
  10. Passardi, F.; Penel, C.; Dunand, C. Performing the Paradoxical: How Plant Peroxidases Modify the Cell Wall. Trends Plant Sci. 2004, 9, 534–540. [Google Scholar] [CrossRef]
  11. Zelinová, V.; Mistrík, I.; Paľove-Balang, P.; Tamás, L. Peroxidase Activity against Guaiacol, NADH, Chlorogenic Acid, Ferulic Acid and Coniferyl Alcohol in Root Tips of Lotus Japonicus and L. Corniculatus Grown under Low PH and Aluminium Stress. Biologia 2010, 65, 279–283. [Google Scholar] [CrossRef]
  12. Quiroga, M.; Guerrero, C.; Botella, M.A.; Barceló, A.; Amaya, I.; Medina, M.I.; Alonso, F.J.; de Forchetti, S.M.; Tigier, H.; Valpuesta, V. A Tomato Peroxidase Involved in the Synthesis of Lignin and Suberin. Plant Physiol. 2000, 122, 1119–1128. [Google Scholar] [CrossRef] [PubMed]
  13. Sánchez, M.; Pena, M.J.; Revilla, G.; Zarra, I. Changes in Dehydrodiferulic Acids and Peroxidase Activity against Ferulic Acid Associated with Cell Walls during Growth of Pinus Pinaster Hypocotyl. Plant Physiol. 1996, 111, 941–946. [Google Scholar] [CrossRef] [PubMed]
  14. Halušková, L.; Valentovičová, K.; Huttová, J.; Mistrík, I.; Tamás, L. Effect of Heavy Metals on Root Growth and Peroxidase Activity in Barley Root Tip. Acta Physiol. Plant 2010, 32, 59–65. [Google Scholar] [CrossRef]
  15. Awad, H.M.; Boersma, M.G.; Vervoort, J.; Rietjens, I.M.C.M. Peroxidase-Catalyzed Formation of Quercetin Quinone Methide–Glutathione Adducts. Arch. Biochem. Biophys. 2000, 378, 224–233. [Google Scholar] [CrossRef]
  16. Janusz, G.; Pawlik, A.; Świderska-Burek, U.; Polak, J.; Sulej, J.; Jarosz-Wilkołazka, A.; Paszczyński, A. Laccase Properties, Physiological Functions, and Evolution. Int. J. Mol. Sci. 2020, 21, 966. [Google Scholar] [CrossRef]
  17. Frei, M. Lignin: Characterization of a Multifaceted Crop Component. Sci. World J. 2013, 2013, 436517. [Google Scholar] [CrossRef]
  18. Gajewska, E.; Witusińska, A.; Bernat, P. Nickel-Induced Oxidative Stress and Phospholipid Remodeling in Cucumber Leaves. Plant Sci. 2024, 348, 112229. [Google Scholar] [CrossRef]
  19. Rahman, H.; Sabreen, S.; Alam, S.; Kawai, S. Effects of Nickel on Growth and Composition of Metal Micronutrients in Barley Plants Grown in Nutrient Solution. J. Plant Nutr. 2005, 28, 393–404. [Google Scholar] [CrossRef]
  20. Gajewska, E.; Bernat, P.; Dlugoński, J.; Sklodowska, M. Effect of Nickel on Membrane Integrity, Lipid Peroxidation and Fatty Acid Composition in Wheat Seedlings. J. Agron. Crop Sci. 2012, 198, 286–294. [Google Scholar] [CrossRef]
  21. Helaoui, S.; Boughattas, I.; Hattab, S.; Mkhinini, M.; Alphonse, V.; Livet, A.; Bousserrhine, N.; Banni, M. Physiological, Biochemical and Transcriptomic Responses of Medicago sativa to Nickel Exposure. Chemosphere 2020, 249, 126121. [Google Scholar] [CrossRef]
  22. Parlak, K.U. Effect of Nickel on Growth and Biochemical Characteristics of Wheat (Triticum aestivum L.) Seedlings. NJAS-Wagening. J. Life Sci. 2016, 76, 1–5. [Google Scholar] [CrossRef]
  23. Gopal, R. Excess Nickel Modulates Oxidative Stress Responsive Enzymes in Groundnut. J. Plant Nutr. 2014, 37, 1433–1440. [Google Scholar] [CrossRef]
  24. Baker, A.J.M. Accumulators and Excluders—Strategies in the Response of Plants to Heavy Metals. J. Plant Nutr. 1981, 3, 643–654. [Google Scholar] [CrossRef]
  25. Krämer, U.; Pickering, I.J.; Prince, R.C.; Raskin, I.; Salt, D.E. Subcellular Localization and Speciation of Nickel in Hyperaccumulator and Non-Accumulator Thlaspi Species. Plant Physiol. 2000, 122, 1343–1353. [Google Scholar] [CrossRef]
  26. Gajewska, E.; Skłodowska, M. Nickel-Induced Changes in Nitrogen Metabolism in Wheat Shoots. J. Plant Physiol. 2009, 166, 1034–1044. [Google Scholar] [CrossRef]
  27. Gajewska, E.; Niewiadomska, E.; Tokarz, K.; Słaba, M.; Skłodowska, M. Nickel-Induced Changes in Carbon Metabolism in Wheat Shoots. J. Plant Physiol. 2013, 170, 369–377. [Google Scholar] [CrossRef]
  28. Zhang, H.; Zhao, Y.; Zhu, J.-K. Thriving under Stress: How Plants Balance Growth and the Stress Response. Dev. Cell 2020, 55, 529–543. [Google Scholar] [CrossRef]
  29. Jagetiya, B.; Soni, A.; Yadav, S. Effect of Nickel on Plant Water Relations and Growth in Green Gram. Indian. J. Plant Physiol. 2013, 18, 372–376. [Google Scholar] [CrossRef]
  30. Fiala, R.; Fialová, I.; Vaculík, M.; Luxová, M. Effect of Silicon on the Young Maize Plants Exposed to Nickel Stress. Plant Physiol. Biochem. 2021, 166, 645–656. [Google Scholar] [CrossRef]
  31. Stobart, A.K.; Griffiths, W.T.; Ameen-Bukthari, I.; Sherwood, R.P. The Effect of Cd2+ on the Biosynthesis of Chlorophyll in Leaves of Barley. Physiol. Plant. 1985, 63, 293–298. [Google Scholar] [CrossRef]
  32. Somashekaraiah, B.V.; Somashekaraiah, P.; Padmaja, K.; Prasad, A.R.K. Phytotoxicity of Cadmium Ions on Germinating Seedlings of Mung Bean (Phaseolus vulgaris): Involvement of Lipid Peroxides in Chlorophyll Degradation. Physiol. Plant. 1992, 85, 85–89. [Google Scholar] [CrossRef]
  33. Sharma, R.K.; Agrawal, M. Biological Effects of Heavy Metals: An Overview. J. Environ. Biol. 2005, 26, 301–313. [Google Scholar]
  34. Valivand, M.; Amooaghaie, R. Foliar Spray with Sodium Hydrosulfide and Calcium Chloride Advances Dynamic of Critical Elements and Efficiency of Nitrogen Metabolism in Cucurbita pepo L. under Nickel Stress. Sci. Hortic. 2021, 283, 110052. [Google Scholar] [CrossRef]
  35. Lichtenthaler, H.K. Multi-Colour Fluorescence Imaging of Photosynthetic Activity and Plant Stress. Photosynthetica 2021, 59, 364–380. [Google Scholar] [CrossRef]
  36. Varela Hernandez, H.P. Effects of Heavy Metals Ions on Primary Photosynthetic Processes in Antarctic Filamentous Alga zygnema sp. Czech Polar Rep. 2016, 6, 180–185. [Google Scholar] [CrossRef]
  37. Gajewska, E.; Drobik, D.; Wielanek, M.; Sekulska-Nalewajko, J.; Gocławski, J.; Mazur, J.; Skłodowska, M. Alleviation of Nickel Toxicity in Wheat (Triticum aestivum L.) Seedlings by Selenium Supplementation. Biol. Lett. 2013, 50, 63–76. [Google Scholar] [CrossRef]
  38. Jahan, M.S.; Guo, S.; Baloch, A.R.; Sun, J.; Shu, S.; Wang, Y.; Ahammed, G.J.; Kabir, K.; Roy, R. Melatonin Alleviates Nickel Phytotoxicity by Improving Photosynthesis, Secondary Metabolism and Oxidative Stress Tolerance in Tomato Seedlings. Ecotoxicol. Environ. Saf. 2020, 197, 110593. [Google Scholar] [CrossRef]
  39. Li, Y.; Shi, S.; Zhang, Y.; Zhang, A.; Wang, Z.; Yang, Y. Copper Stress-Induced Phytotoxicity Associated with Photosynthetic Characteristics and Lignin Metabolism in Wheat Seedlings. Ecotoxicol. Environ. Saf. 2023, 254, 114739. [Google Scholar] [CrossRef]
  40. Huihui, Z.; Xin, L.; Zisong, X.; Yue, W.; Zhiyuan, T.; Meijun, A.; Yuehui, Z.; Wenxu, Z.; Nan, X.; Guangyu, S. Toxic Effects of Heavy Metals Pb and Cd on Mulberry (Morus alba L.) Seedling Leaves: Photosynthetic Function and Reactive Oxygen Species (ROS) Metabolism Responses. Ecotoxicol. Environ. Saf. 2020, 195, 110469. [Google Scholar] [CrossRef]
  41. Pluciński, B.; Nowicka, B.; Waloszek, A.; Rutkowska, J.; Strzałka, K. The Role of Antioxidant Response and Nonphotochemical Quenching of Chlorophyll Fluorescence in Long-Term Adaptation to Cu-Induced Stress in Chlamydomonas Reinhardtii. Environ. Sci. Pollut. Res. 2023, 30, 67250–67262. [Google Scholar] [CrossRef]
  42. Chen, S.; Lin, R.; Lu, H.; Wang, Q.; Yang, J.; Liu, J.; Yan, C. Effects of Phenolic Acids on Free Radical Scavenging and Heavy Metal Bioavailability in Kandelia Obovata under Cadmium and Zinc Stress. Chemosphere 2020, 249, 126341. [Google Scholar] [CrossRef] [PubMed]
  43. Kováčik, J.; Klejdus, B.; Hedbavny, J.; Zoń, J. Significance of Phenols in Cadmium and Nickel Uptake. J. Plant Physiol. 2011, 168, 576–584. [Google Scholar] [CrossRef] [PubMed]
  44. Taulavuori, K.; Hyöky, V.; Oksanen, J.; Taulavuori, E.; Julkunen-Tiitto, R. Species-Specific Differences in Synthesis of Flavonoids and Phenolic Acids under Increasing Periods of Enhanced Blue Light. Environ. Exp. Bot. 2016, 121, 145–150. [Google Scholar] [CrossRef]
  45. Das, S.; Sultana, K.W.; Mondal, M.; Chandra, I.; Ndhlala, A.R. Unveiling the Dual Nature of Heavy Metals: Stressors and Promoters of Phenolic Compound Biosynthesis in Basilicum polystachyon (L.) Moench In Vitro. Plants 2023, 13, 98. [Google Scholar] [CrossRef] [PubMed]
  46. Meychik, N.; Nikolaeva, Y.; Kushunina, M.; Yermakov, I. Are the Carboxyl Groups of Pectin Polymers the Only Metal-Binding Sites in Plant Cell Walls? Plant Soil. 2014, 381, 25–34. [Google Scholar] [CrossRef]
  47. Le Roy, J.; Huss, B.; Creach, A.; Hawkins, S.; Neutelings, G. Glycosylation Is a Major Regulator of Phenylpropanoid Availability and Biological Activity in Plants. Front. Plant Sci. 2016, 7, 735. [Google Scholar] [CrossRef]
  48. Zhang, T.; Shi, M.; Yan, H.; Li, C. Effects of Salicylic Acid on Heavy Metal Resistance in Eukaryotic Algae and Its Mechanisms. Int. J. Environ. Res. Public. Health 2022, 19, 13415. [Google Scholar] [CrossRef]
  49. Parry, A.D.; Tiller, S.A.; Edwards, R. The Effects of Heavy Metals and Root Immersion on Isoflavonoid Metabolism in Alfalfa (Medicago sativa L.). Plant Physiol. 1994, 106, 195–202. [Google Scholar] [CrossRef]
  50. Parcheta, M.; Świsłocka, R.; Orzechowska, S.; Akimowicz, M.; Choińska, R.; Lewandowski, W. Recent Developments in Effective Antioxidants: The Structure and Antioxidant Properties. Materials 2021, 14, 1984. [Google Scholar] [CrossRef]
  51. Yamasaki, H.; Sakihama, Y.; Ikehara, N. Flavonoid-Peroxidase Reaction as a Detoxification Mechanism of Plant Cells against H2O2. Plant Physiol. 1997, 115, 1405–1412. [Google Scholar] [CrossRef]
  52. Khan, M.I.R.; Fatma, M.; Per, T.S.; Anjum, N.A.; Khan, N.A. Salicylic Acid-Induced Abiotic Stress Tolerance and Underlying Mechanisms in Plants. Front. Plant Sci. 2015, 6, 462. [Google Scholar] [CrossRef] [PubMed]
  53. Sharma, A.; Sidhu, G.P.S.; Araniti, F.; Bali, A.S.; Shahzad, B.; Tripathi, D.K.; Brestic, M.; Skalicky, M.; Landi, M. The Role of Salicylic Acid in Plants Exposed to Heavy Metals. Molecules 2020, 25, 540. [Google Scholar] [CrossRef] [PubMed]
  54. Zaid, A.; Mohammad, F.; Wani, S.H.; Siddique, K.M.H. Salicylic Acid Enhances Nickel Stress Tolerance by Up-Regulating Antioxidant Defense and Glyoxalase Systems in Mustard Plants. Ecotoxicol. Environ. Saf. 2019, 180, 575–587. [Google Scholar] [CrossRef] [PubMed]
  55. Pawlak-Sprada, S.; Arasimowicz-Jelonek, M.; Podgórska, M.; Deckert, J. Activation of Phenylpropanoid Pathway in Legume Plants Exposed to Heavy Metals. Part I. Effects of Cadmium and Lead on Phenylalanine Ammonia-Lyase Gene Expression, Enzyme Activity and Lignin Content. Acta Biochim. Pol. 2011, 58, 211–216. [Google Scholar] [CrossRef]
  56. Kováčik, J.; Klejdus, B. Dynamics of Phenolic Acids and Lignin Accumulation in Metal-Treated Matricaria Chamomilla Roots. Plant Cell Rep. 2008, 27, 605–615. [Google Scholar] [CrossRef]
  57. Beshamgan, E.S.; Sharifi, M.; Zarinkamar, F. Crosstalk among Polyamines, Phytohormones, Hydrogen Peroxide, and Phenylethanoid Glycosides Responses in Scrophularia Striata to Cd Stress. Plant Physiol. Biochem. 2019, 143, 129–141. [Google Scholar] [CrossRef]
  58. Kapoor, D.; Kaur, S.; Bhardwaj, R. Physiological and Biochemical Changes in Brassica Juncea Plants under Cd-Induced Stress. Biomed. Res. Int. 2014, 2014, 726070. [Google Scholar] [CrossRef]
  59. Gajewska, E.; Skłodowska, M. Differential Effect of Equal Copper, Cadmium and Nickel Concentration on Biochemical Reactions in Wheat Seedlings. Ecotoxicol. Environ. Saf. 2010, 73, 996–1003. [Google Scholar] [CrossRef]
  60. Lin, Y.-C.; Kao, C.-H. Nickel Toxicity of Rice Seedlings: Cell Wall Peroxidase, Lignin, and NiSO4-Inhibited Root Growth. Crop Environ. Bioinform. 2005, 2, 131–136. [Google Scholar]
  61. Abdel-Aty, A.M.; Elsayed, A.M.; Gad, A.A.M.; Barakat, A.Z.; Mohamed, S.A. Antioxidant System of Garden Cress Sprouts for Using in Bio-Monitor of Cadmium and Lead Contamination. Sci. Rep. 2023, 13, 10445. [Google Scholar] [CrossRef]
  62. Ma, Q.-H. Lignin Biosynthesis and Its Diversified Roles in Disease Resistance. Genes 2024, 15, 295. [Google Scholar] [CrossRef] [PubMed]
  63. Finger-Teixeira, A.; Ferrarese, M.D.L.L.; Soares, A.R.; da Silva, D.; Ferrarese-Filho, O. Cadmium-Induced Lignification Restricts Soybean Root Growth. Ecotoxicol. Environ. Saf. 2010, 73, 1959–1964. [Google Scholar] [CrossRef] [PubMed]
  64. Smart, R.E.; Bingham, G.E. Rapid Estimates of Relative Water Content. Plant Physiol. 1974, 53, 258–260. [Google Scholar] [CrossRef] [PubMed]
  65. Wellburn, A.R. The Spectral Determination of Chlorophylls a and b, as Well as Total Carotenoids, Using Various Solvents with Spectrophotometers of Different Resolution. J. Plant Physiol. 1994, 144, 307–313. [Google Scholar] [CrossRef]
  66. Maehly, A.C.; Chance, B. The Assay of Catalases and Peroxidases. Methods Biochem. Anal. 1954, 1, 357–425. [Google Scholar] [CrossRef]
  67. Imberty, A.; Goldberg, R.; Catesson, A.M. Isolation and Characterization of Populus Isoperoxidases Involved in the Last Step of Lignin Formation. Planta 1985, 164, 221–226. [Google Scholar] [CrossRef]
  68. Takahama, U. Oxidation of Hydroxycinnamic Acid and Hydroxycinnamyl Alcohol Derivatives by Laccase and Peroxidase. Interactions among p-Hydroxyphenyl, Guaiacyl and Syringyl Groups during the Oxidation Reactions. Physiol. Plant 1995, 93, 61–68. [Google Scholar] [CrossRef]
  69. Takahama, U.; Egashira, T. Peroxidases in Vacuoles of Vicia Faba Leaves. Phytochemistry 1991, 30, 73–77. [Google Scholar] [CrossRef]
  70. Takahama, U.; Hirota, S. Deglucosidation of Quercetin Glucosides to the Aglycone and Formation of Antifungal Agents by Peroxidase-Dependent Oxidation of Quercetin on Browning of Onion Scales. Plant Cell Physiol. 2000, 41, 1021–1029. [Google Scholar] [CrossRef]
  71. Kolupaev, Y.E.; Horielova, E.I.; Yastreb, T.O.; Popov, Y.V.; Ryabchun, N.I. Phenylalanine Ammonia-Lyase Activity and Content of Flavonoid Compounds in Wheat Seedlings at the Action of Hypothermia and Hydrogen Sulfide Donor. Ukr. Biochem. J. 2018, 90, 12–20. [Google Scholar] [CrossRef]
  72. Dörnenburg, H.; Knorr, D. Evaluation of Elicitor-and High-Pressure-Induced Enzymatic Browning Utilizing Potato (Solanum tuberosum) Suspension Cultures as a Model System for Plant Tissues. J. Agric. Food Chem. 1997, 45, 4173–4177. [Google Scholar] [CrossRef]
  73. Pradhan Mitra, P.; Loqué, D. Histochemical Staining of Arabidopsis Thaliana Secondary Cell Wall Elements. J. Vis. Exp. 2014, 51381. [Google Scholar] [CrossRef]
  74. Mittal, A.; Balasubramanian, R.; Cao, J.; Singh, P.; Subramanian, S.; Hicks, G.; Nothnagel, E.A.; Abidi, N.; Janda, J.; Galbraith, D.W.; et al. TOPOISOMERASE 6B Is Involved in Chromatin Remodelling Associated with Control of Carbon Partitioning into Secondary Metabolites and Cell Walls, and Epidermal Morphogenesis in Arabidopsis. J. Exp. Bot. 2014, 65, 4217–4239. [Google Scholar] [CrossRef] [PubMed]
Figure 1. Appearance of the 14-day-old control and Ni-treated cucumber plants.
Ijms 26 01237 g001
Figure 2. Effect of Ni treatment on chlorophyll a (A), chlorophyll b (C), and carotenoid (E) contents, fluorescence decline ratio (Rfd) (B), maximum photochemical efficiency of PS II (QY) (D), and non-photochemical quenching (NPQ) (F) in the cucumber leaf. Data represent mean values ± SD (n = 6–9); * indicates values that differ significantly from the control at p ˂ 0.05.
Ijms 26 01237 g002
Figure 3. Effect of Ni treatment on phenolic compounds composition in cucumber leaf. Data represent mean values ± SD (n = 3); * indicates values that differ significantly from the control at p ˂ 0.05.
Ijms 26 01237 g003
Figure 4. Effect of Ni treatment on phenolic compound composition in cucumber root. Data represent mean values ± SD (n = 3); * indicates values that differ significantly from the control at p ˂ 0.05.
Ijms 26 01237 g004
Figure 5. Effect of Ni treatment on the activity of POX assayed with guaiacol (GPOX) (A), syringaldazine (SPOX) (B), ferulic acid (FPOX) (C), and quercetin (QPOX) (D) in the cucumber leaf. Data represent mean values ± SD (n = 3–7); * indicates values that differ significantly from the control at p ˂ 0.05.
Ijms 26 01237 g005
Figure 6. Effect of Ni treatment on the activity of POX assayed with guaiacol (GPOX) (A), syringaldazine (SPOX) (B), ferulic acid (FPOX) (C), and quercetin (QPOX) (D) in the cucumber root. Data represent mean values ± SD (n = 3–7).
Ijms 26 01237 g006
Figure 7. Effect of Ni treatment on PAL, PPOC, and PPOL activities in cucumber leaf (A,C,E) and root (B,D,F). Data represent mean values ± SD (n = 3–7); * indicates values that differ significantly from the control at p ˂ 0.05.
Ijms 26 01237 g007
Figure 8. Leaf and root peroxidase isoforms from the control and the Ni-treated cucumber plant.
Ijms 26 01237 g008
Figure 9. Effect of Ni treatment on lignin content in cucumber leaf (AD) and root (E,F). A, C—control and Ni-treated leaf before chlorophyll removal and phloroglucinol staining; (B,D)—control and Ni-treated leaf after phloroglucinol staining; (E,F)—control and Ni-treated root after phloroglucinol staining. Bar = 2 cm.
Ijms 26 01237 g009
Table 1. Effect of Ni treatment on growth, Ni accumulation, and the relative water content in the cucumber leaf and root. Data represent mean values ± SD (n = 6–12); * indicates values that differ significantly from the control at p < 0.05.
TreatmentFresh weight
[mg]
Ni content
[μg g−1 DW]
RWC
[%]
Control leaf284.3 ± 58.91.98 ± 0.7589.84 ± 0.22
Ni leaf133.6 ± 43.3 *292.85 ± 65.81 *87.62 ± 1.33
Control root533.47 ± 104.874.38 ± 0.4295.16 ± 0.40
Ni root221.24 ± 58.77 *592.89 ± 82.12 *94.97 ± 0.48
Table 2. Effect of Ni treatment on free and conjugated phenol contents in the cucumber leaf. Data represent mean values ± SD (n = 3); * indicates values that differ significantly from the control at p ˂ 0.05; numbers highlighted in Ijms 26 01237 i001/Ijms 26 01237 i002 coloration indicate increases/decreases compared to the control.
Metabolite [µg g−1 FW]FreeConjugatedFree/Total [%]
ControlNiControlNiControlNi
Phenolic acidstrans-3-hydroxycinnamic acid033.75 ± 8.7204.52 ± 1.25-91.0 ± 8.65
ellagic acid37.06 ± 2.9736.34 ± 4.864.49 ± 5.5730.75 ± 2.27 *36.5 ± 1.4454.2 ± 3.47 *
4-hydroxybenzoic acid13.91 ± 1.4112.52 ± 1.0773.63 ± 6.7225.15 ± 2.76 *15.9 ± 0.5533.2 ± 0.97 *
ferulic acid4.81 ± 0.414.82 ± 0.676.43 ± 0.475.81 ± 1.0642.8 ± 0.6245.3 ± 4.82
chlorogenic acid16.64 ± 2.213.88 ± 1.743.43 ± 0.892.96 ± 0.9082.9 ± 2.6982.4 ± 3.55
trans-cinnamic acid4.64 ± 0.494.67 ± 0.471.04 ± 0.530.69 ± 0.2881.7 ± 9.3689.8 ± 4.23 *
p-coumaric acid18.62 ± 2.4224.6 ± 2.65 *9.32 ± 1.6716.67 ± 3.42 *66.6 ± 1.8659.6 ± 7.91
1,3-dicaffeoylquinic acid6.68 ± 1.155.42 ± 0.651.25 ± 0.320.97 ± 0.3087.2 ± 2.9984.8 ± 3.55
gallic acid00.27 ± 0.0501.43 ± 0.31-15.9 ± 1.48
salicylic acid0.15 ± 0.020.29 ± 0.090.44 ± 0.050.57 ± 0.0825.5 ± 3.1633.3 ± 7.52
Total102.51136.56 (133%)160.0289.5 (56%)39.060.8 (156%)
Flavonoidsnaringenin0.89 ± 0.220.17 ± 0.04 *0.12 ± 0.060.03 ± 0.008 *88.1 ± 5.4785.0 ± 7.14
3-hydroxyflavone56.26 ± 4.5856.28 ± 4.3560.79 ± 4.3562.59 ± 8.32 *48.1 ± 0.7047.3 ± 2.24
(+)-catechin59.93 ± 5.7633.41 ± 2.65 *102.59 ± 4.8570.45 ± 2.89 *36.9 ± 1.2132.2 ± 1.05
(−)-epicatechin21.39 ± 3.0836.92 ± 4.66 *3.48 ± 1.4478.42 ± 5.99 *96.5 ± 4.8232.0 ± 1.45 *
cyanidin22.54 ± 4.669.75 ± 1.37 *0.65 ± 0.161.88 ± 0.56 *83.8 ± 5.0286.7 ± 6.93
quercetin0015.19 ± 1.9913.44 ± 1.91--
luteolin0033.37 ± 1.6331.65 ± 3.34--
hesperetin2.39 ± 0.481.93 ± 0.3615.23 ± 1.4119.56 ± 1.1713.6 ± 2.119.0 ± 1.21 *
flavone6.99 ± 0.9419.17 ± 1.71 *9.00 ± 1.0223.02 ± 1.65 *43.7 ± 3.3345.4 ± 1.26
procyanidin B219.35 ± 3.6543.05 ± 2.35 *36.48 ± 3.000.77 ± 0.93 *34.7 ± 4.3193.3 ± 3.59 *
Total189.74200.68 (106%)276.91301.81 (109%)40.639.8 (98%)
Table 3. Effect of Ni treatment on free and conjugated phenol contents in the cucumber root. Data represent mean values ± SD (n = 3); * indicate values that differ significantly from the control at p ˂ 0.05; numbers highlighted in Ijms 26 01237 i003/Ijms 26 01237 i004 coloration indicate increases/decreases compared to the control.
Metabolite [µg g−1 FW]FreeConjugatedFree/Total [%]
ControlNiControlNiControlNi
Phenolic acidsgallic acid59.9 ± 3.846.36 ± 1.17 *1.05 ± 0.553.47 ± 0.31 *99.1 ± 7.3264.7 ± 5.76 *
protocatechuic acid21.92 ± 2.9954.81 ± 4.99 *4.32 ± 1.591.60 ± 0.48 *83.5 ± 6.5597.0 ± 0.69 *
α-resorcylic acid4.56 ± 0.478.07± 0.84 *0.45 ± 0.080.61 ± 0.5191.0 ± 1.6293.0 ± 0.51
trans-3-hydroxycinnamic acid51.02 ± 2.622.73 ± 0.33 *23.40 ± 2.4228.19 ± 1.54 *68.6 ± 1.7844.6 ± 1.68 *
sinapic acid147.37 ± 2.98189.9 ± 4.36 *80.49 ± 5.2348.03 ± 4.87 *64.7 ± 1.5279.8 ± 1.31 *
ellagic acid15.67 ± 0.8621.18 ± 2.11 *124.15 ± 5.3660.88 ± 2.07 *11.2 ± 0.9925.8 ± 1.78 *
rosmarinic acid24.91 ± 1.9324.84 ± 1.1325.89 ± 3.1818.52 ± 3.8549.0 ± 4.0257.3 ± 5.77
4-hydroxybenzoic acid5.46 ± 1.116.7 ± 1.0621.45 ± 0.842.21 ± 2.73 *20.3 ± 2.8813.7 ± 1.12 *
ferulic acid1.15 ± 0.1711.52 ± 0.54 *31.51 ± 0.9127.47 ± 0.56 *3.5 ± 0.4129.5 ± 0.64 *
β-resorcylic acid0.1 ± 0.010.07 ± 0.004 *0.81 ± 0.010.43 ± 0.04 *11.0 ± 1.0913.7 ± 1.68
chlorogenic acid0.18 ± 0.030.75 ± 0.04 *0.01 ± 0.0010.08 ± 0.05 *94.7 ± 2.5491.5 ± 2.28
vanillic acid0.44 ± 0.010.43 ± 0.120.09 ± 0.080.07 ± 0.0583.0 ± 13.1386.0 ± 12.09
trans-cinnamic acid0.32 ± 0.020.88 ± 0.06 *1.51 ± 0.031.00 ± 0.0617.5 ± 0.9246.8 ± 1.46 *
p-coumaric acid0.27 ± 0.052.14 ± 0.17 *0.48 ± 0.050.62 ± 0.1236.0 ± 5.7077.5 ± 4.73 *
o-coumaric acid0.5 ± 0.021.29 ± 0.11 *0.06 ± 0.011.65 ± 0.28 *89.3 ± 1.8843.9 ± 3.75 *
salicylic acid0.22 ± 0.080.16 ± 0.050.50 ± 0.120.25 ± 0.0230.8 ± 9.5639.0 ± 6.84
Total333.99351.83 (105%)316.17235.08 (74%)51.459.9 (117%)
Flavonoidsnaringenin2.86 ± 0.081.43 ± 0.11 *2.12 ± 0.181.71 ± 0.16 *57.4 ± 2.6645.5 ± 0.44 *
3-hydroxyflavone25.26 ± 2.2522.95 ± 2.2232.90 ± 2.5930.58 ± 1.8243.4 ± 1.9342.9 ± 2.10
(+)-catechin40.21 ± 3.0745.65 ± 4.1898.03 ± 5.8148.36 ± 6.14 *29.1 ± 2.7248.6 ± 4.84 *
(−)-epicatechin24.74 ± 1.5920.06 ± 2.7120.70 ± 1.1755.26 ± 5.84 *54.4 ± 2.026.6 ± 3.73 *
(−)-epigallocatechin53.08 ± 3.5715.75 ± 1.6 *0.70 ± 0.2849.45 ± 3.5 *98.7 ± 0.5324.2 ± 2.65 *
cyanidin5.75 ± 0.3812.36 ± 1.89 *25.52 ± 0.6121.06 ± 3.0318.4 ± 1.2837.1 ± 3.33 *
quercetin001.94 ± 0.15.24 ± 0.15 *--
myricetin21.48 ± 2.3917.03 ± 2.324.32 ± 0.392.49 ± 0.33 *83.2 ± 9.5887.3 ± 7.91
luteolin1.59 ± 0.3109.22 ± 0.866.38 ± 0.9314.7 ± 2.49-
Total174.97135.23 (77%)195.45220.53 (113%)47.238.0 (81%)
Otherp-benzoquinone4.8 ± 0.244.91 ± 0.6822.99 ± 3.99.04 ± 0.89 *17.3 ± 1.9435.2 ± 3.88 *
pyrocatechol4.39 ± 0.559.25 ± 0.72 *20.96 ± 2.510.28 ± 2.33 *17.3 ± 2.3847.3 ± 6.65 *
Total9.1914.16 (154%)43.9519.32 (44%)17.342.3 (244%)
Disclaimer/Publisher’s Note: The statements, opinions and data contained in all publications are solely those of the individual author(s) and contributor(s) and not of MDPI and/or the editor(s). MDPI and/or the editor(s) disclaim responsibility for any injury to people or property resulting from any ideas, methods, instructions or products referred to in the content.

