
Selective Up-Regulation of Tumor Suppressor Gene Retinoblastoma by Bisacridine Derivative Through Gene Promoter Quadruplex Structures for Cancer Treatment


Abstract
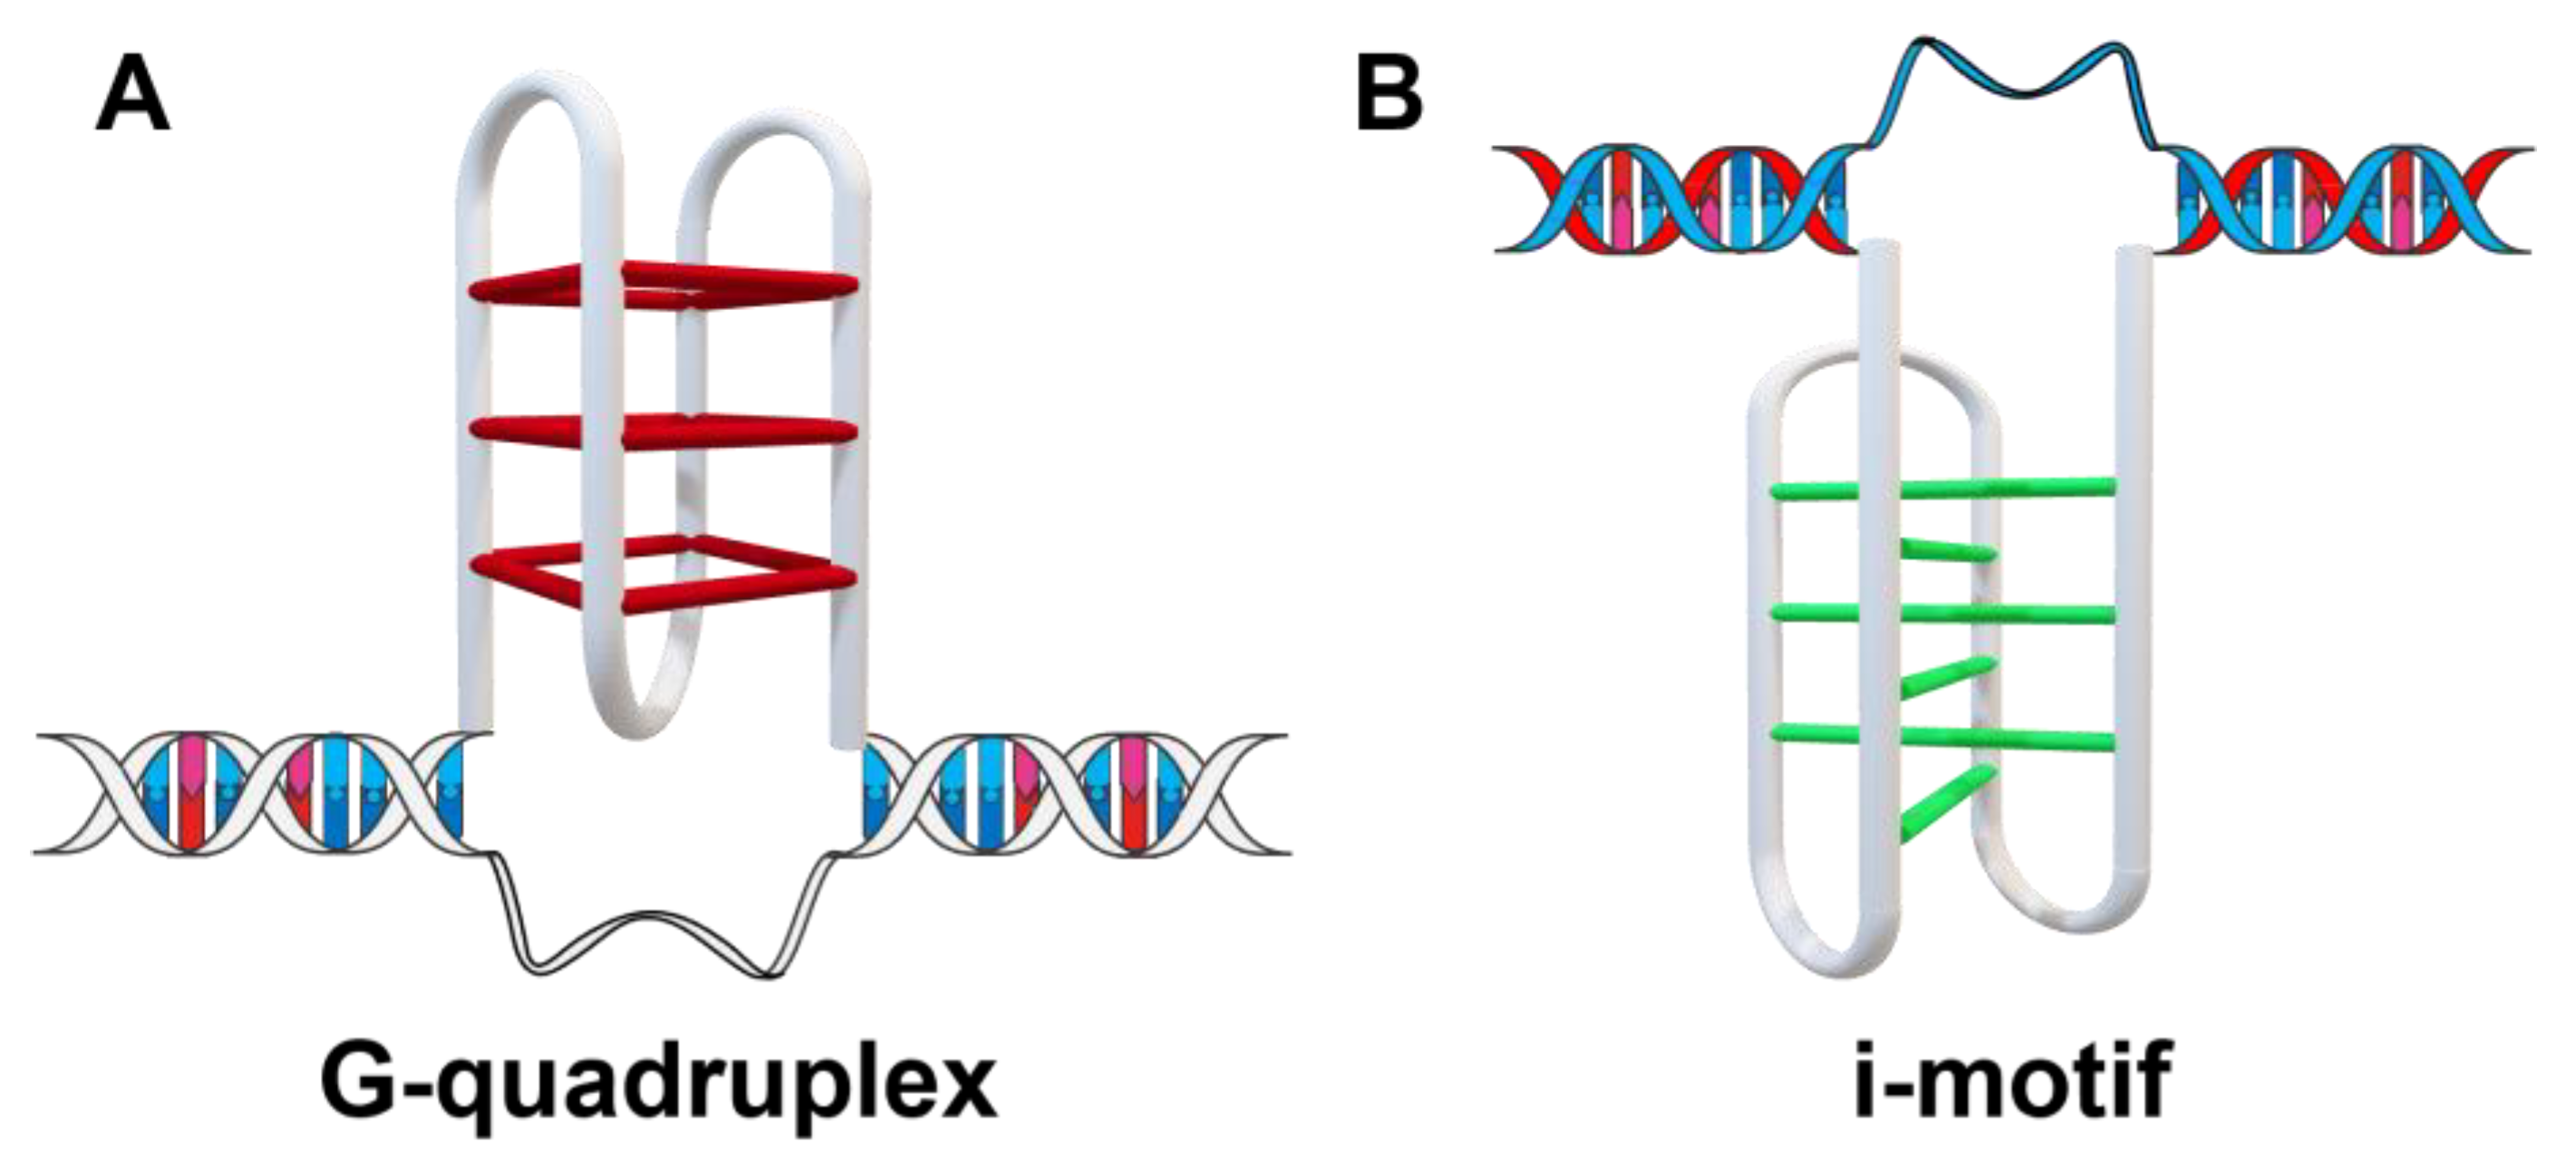
:1. Introduction
2. Results
2.1. Screening for Small Molecules Binding to RB Promoter Quadruplex Structures
2.2. Bisacridine Derivative A06 and A02 Could Destabilize RB Promoter Quadruplex Structures
2.3. Bisacridine Derivative A06 Could Specifically Bind to and Destabilize RB Promoter Quadruplex Structures
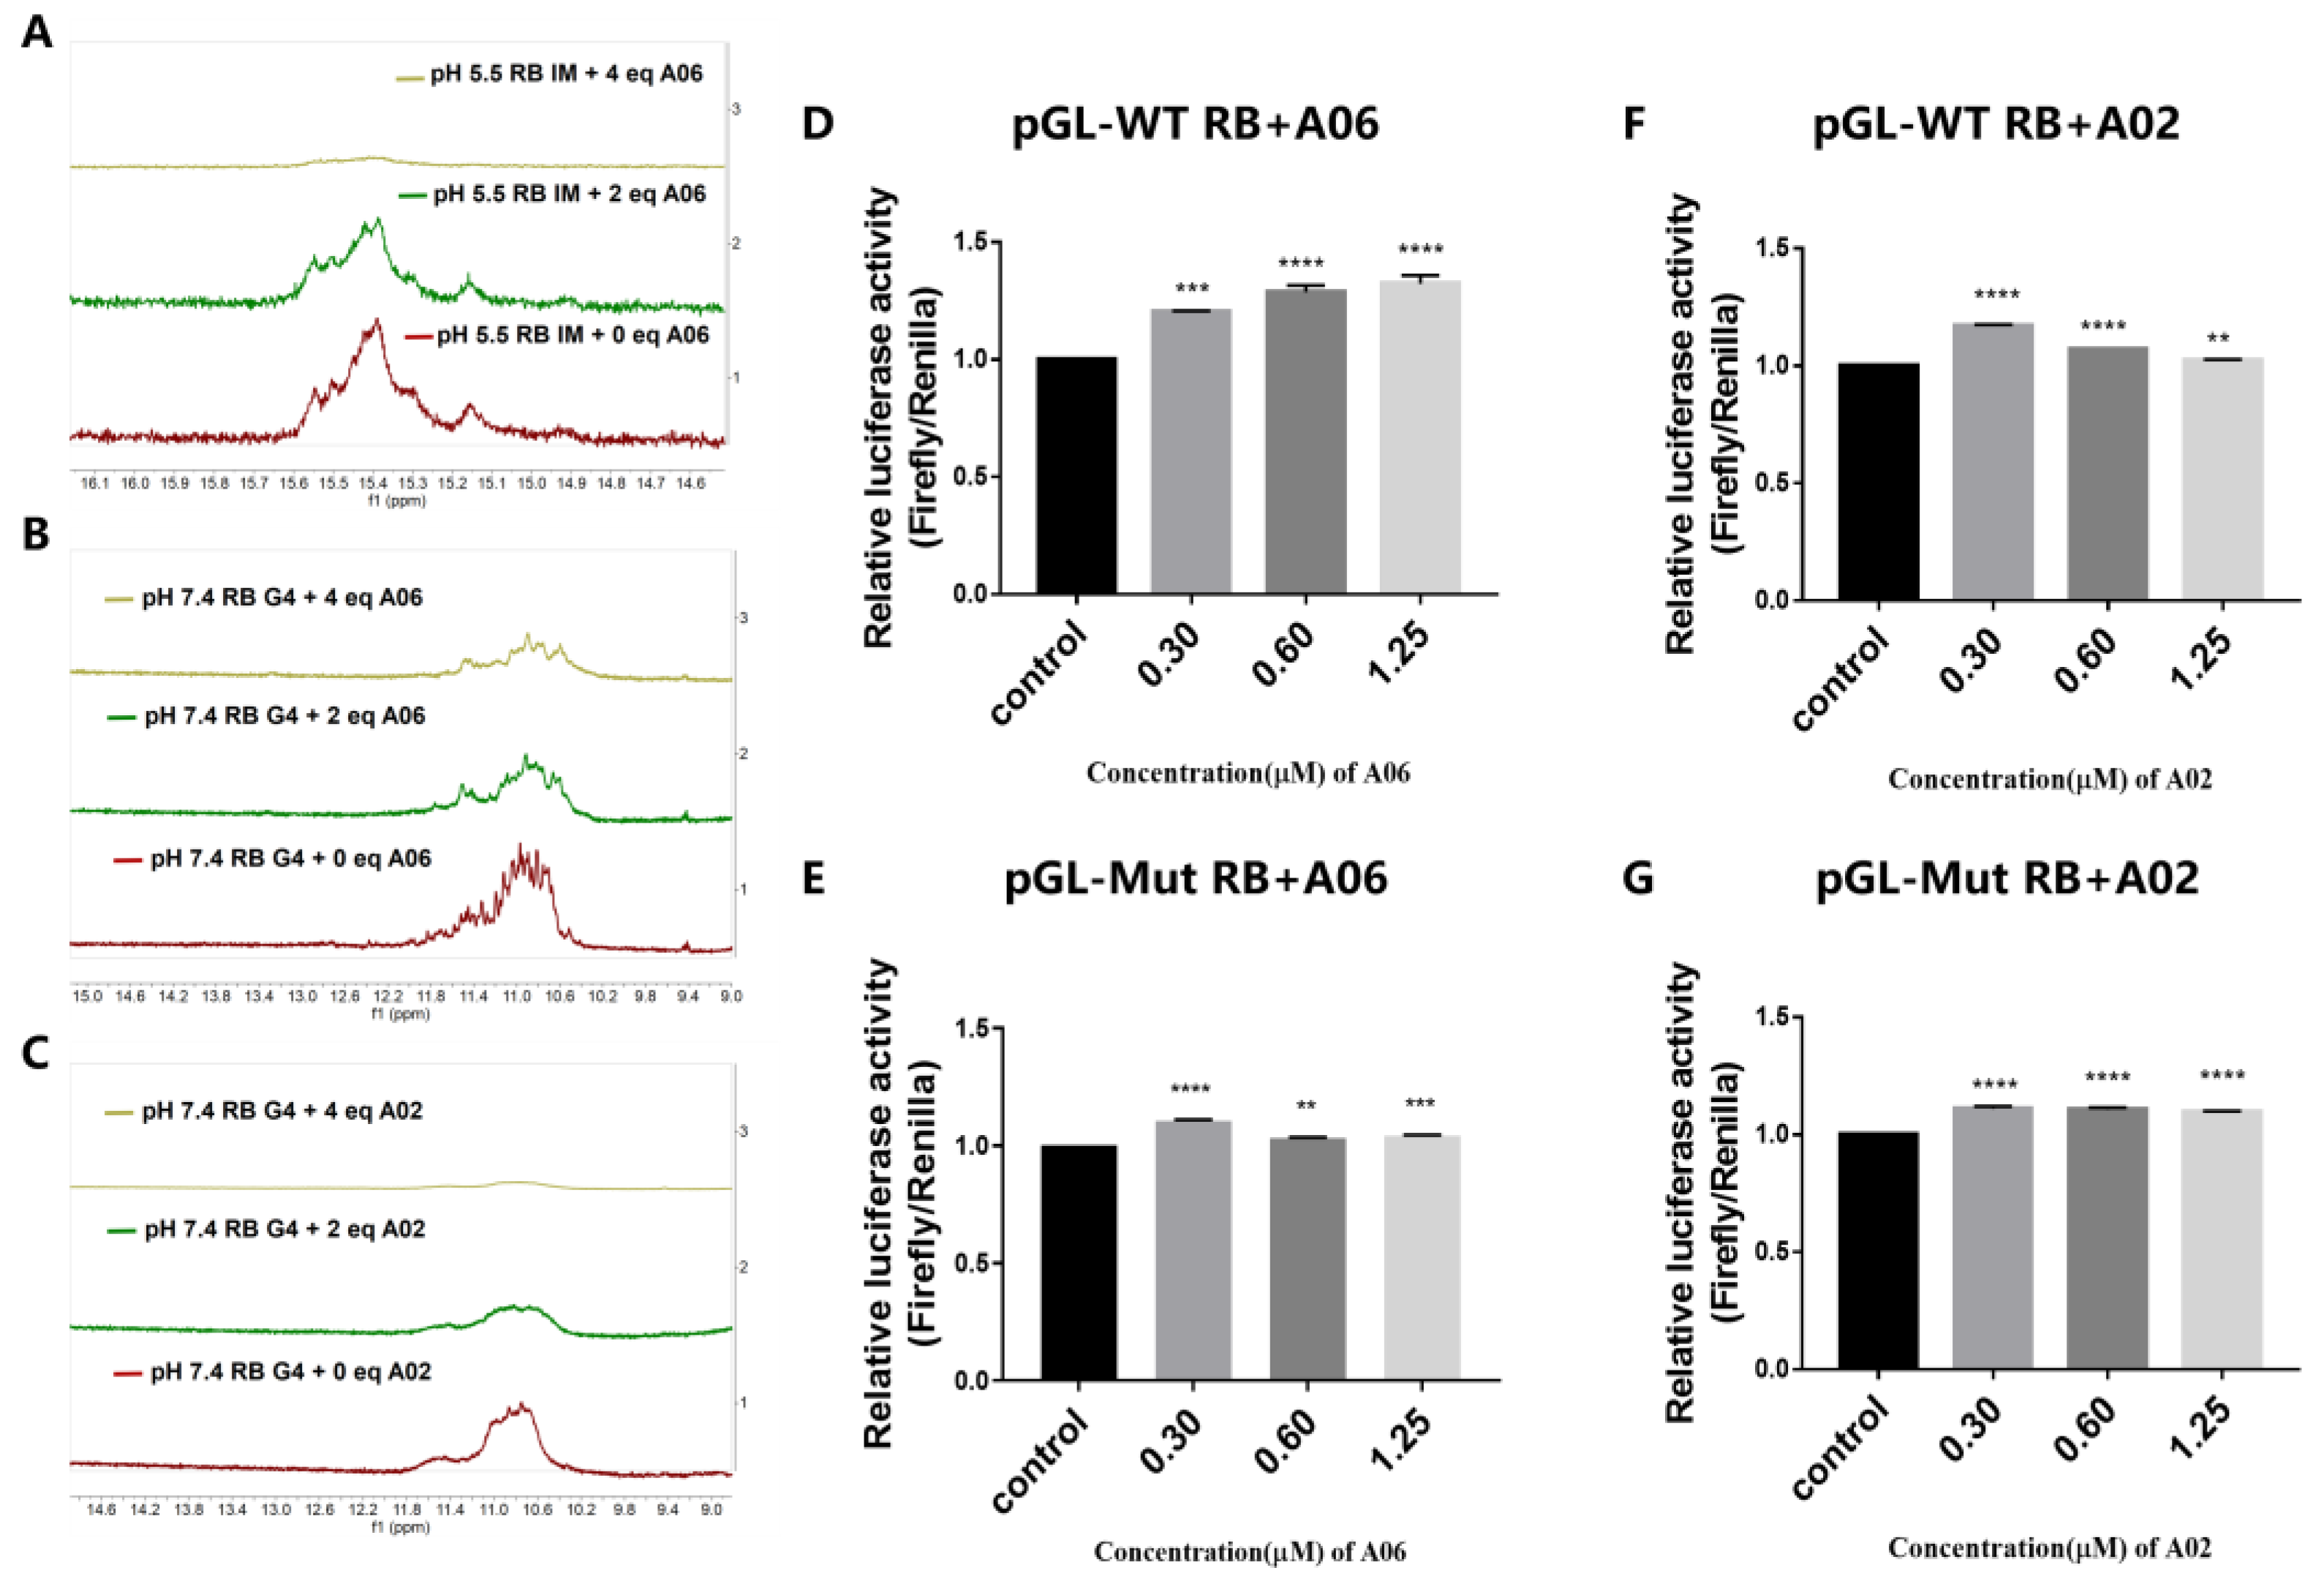
2.4. Further Studies of Interactions Between Bisacridine Derivative A06 and RB Promoter Quadruplex Structures
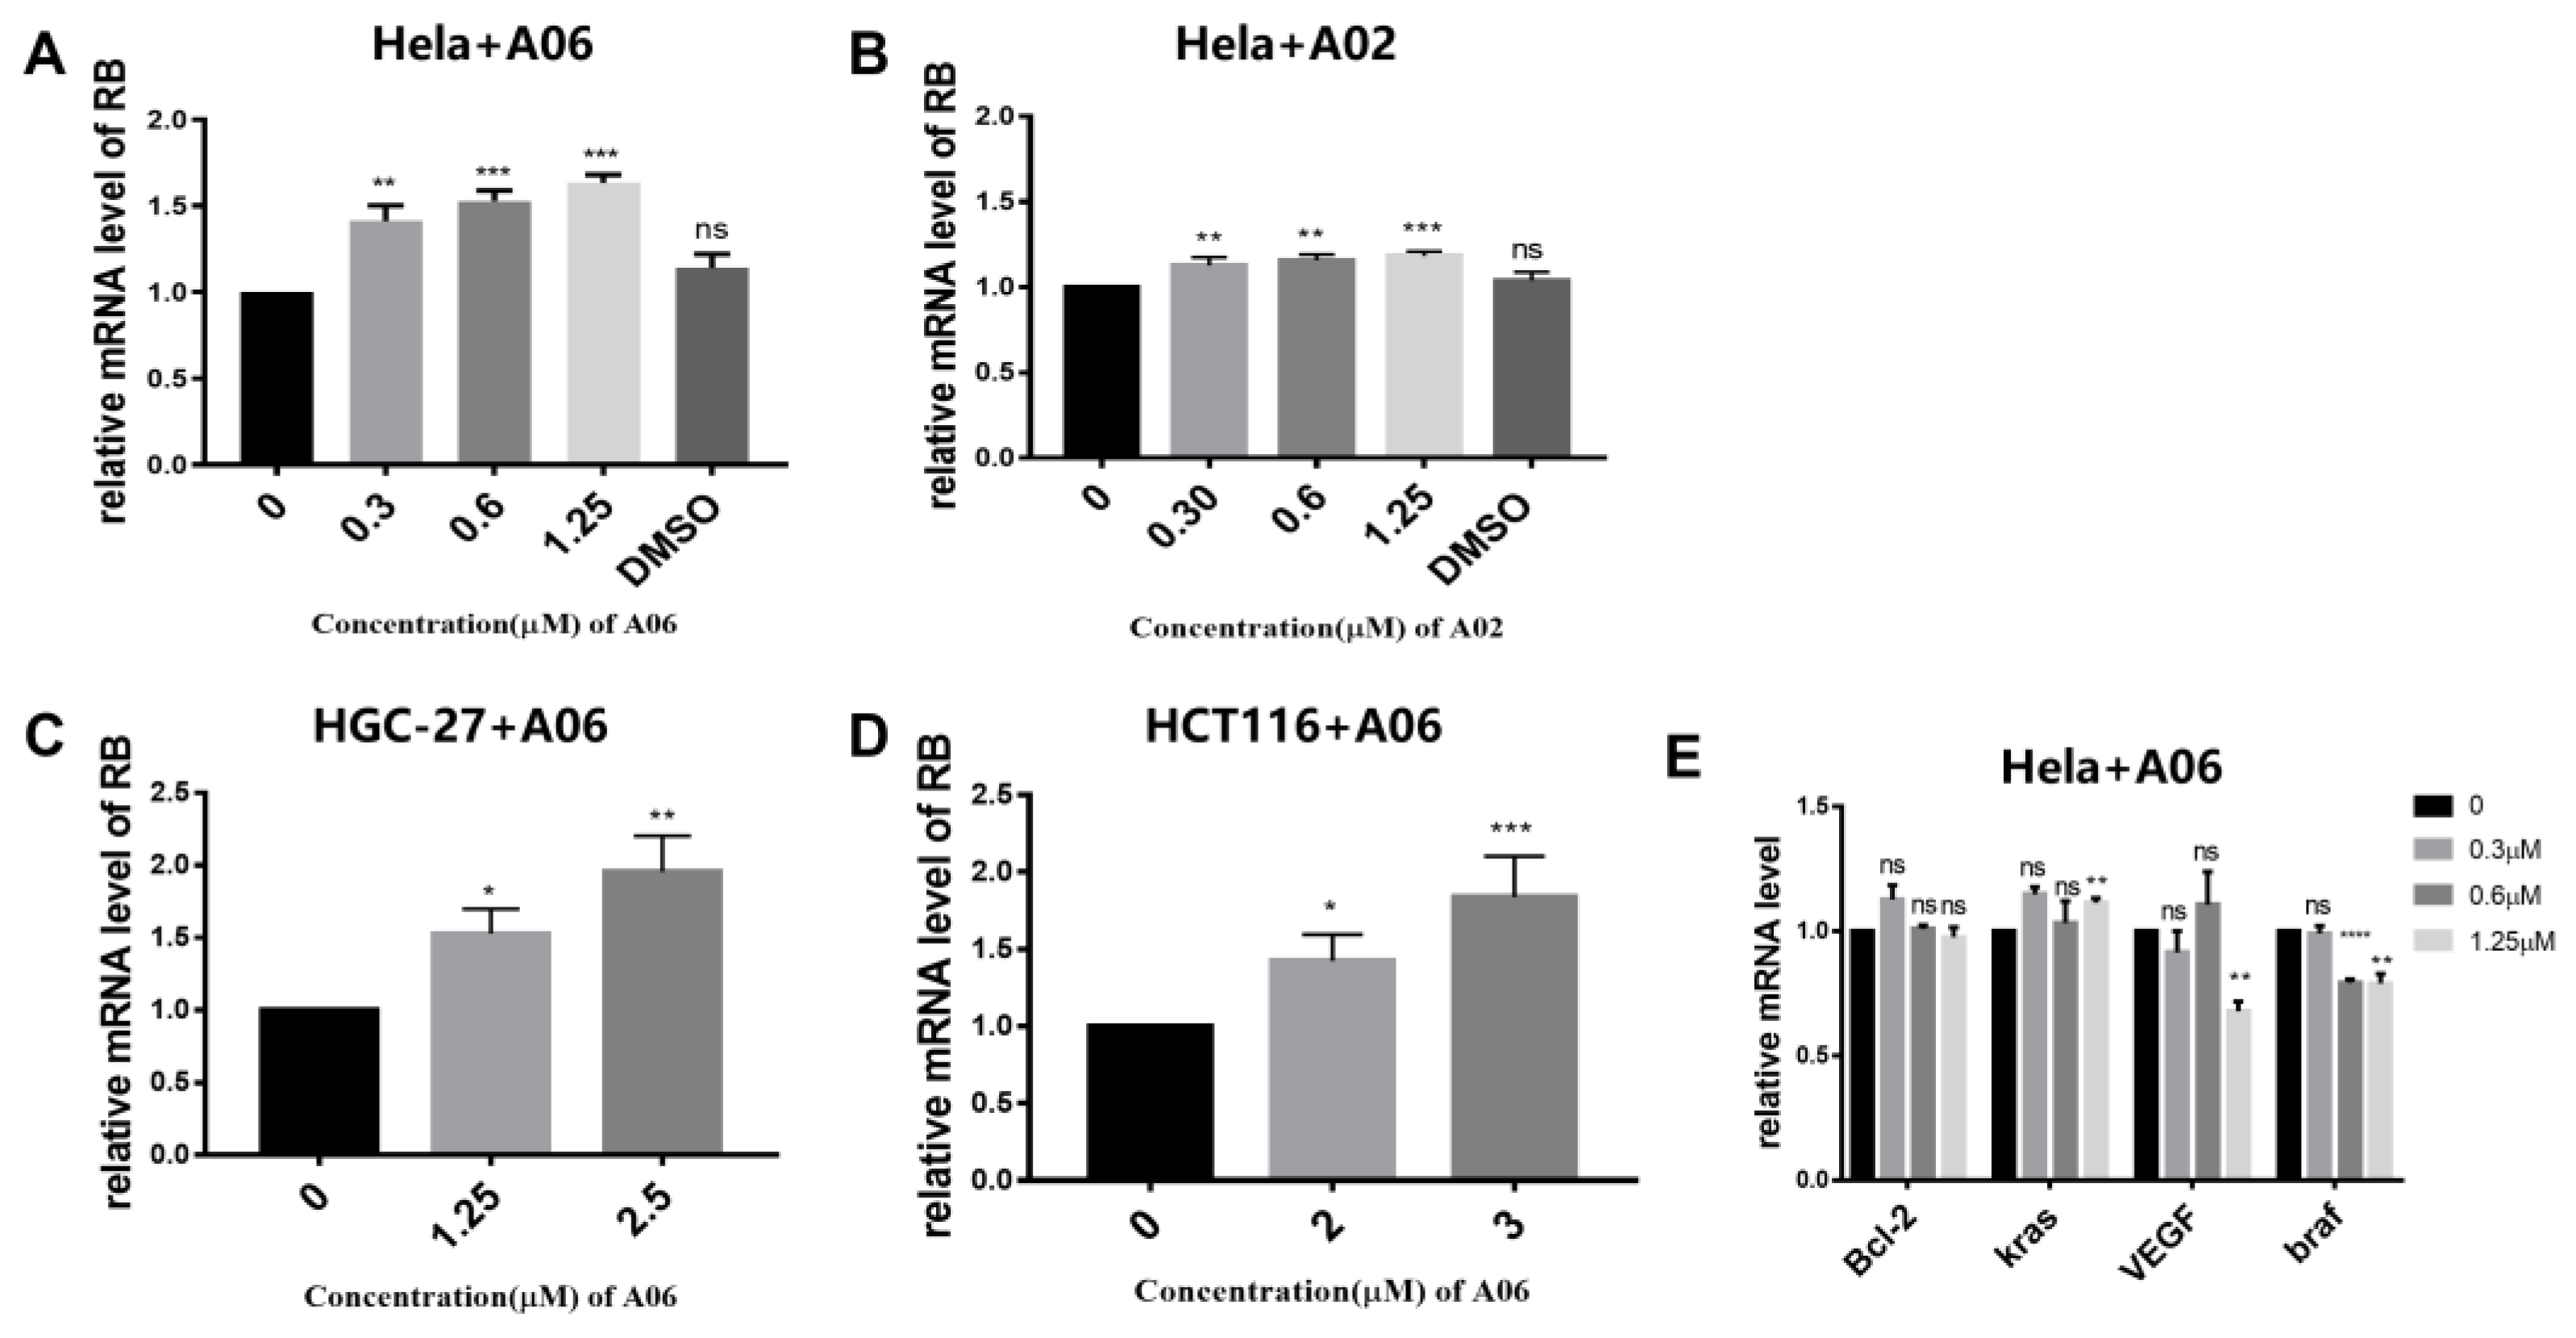
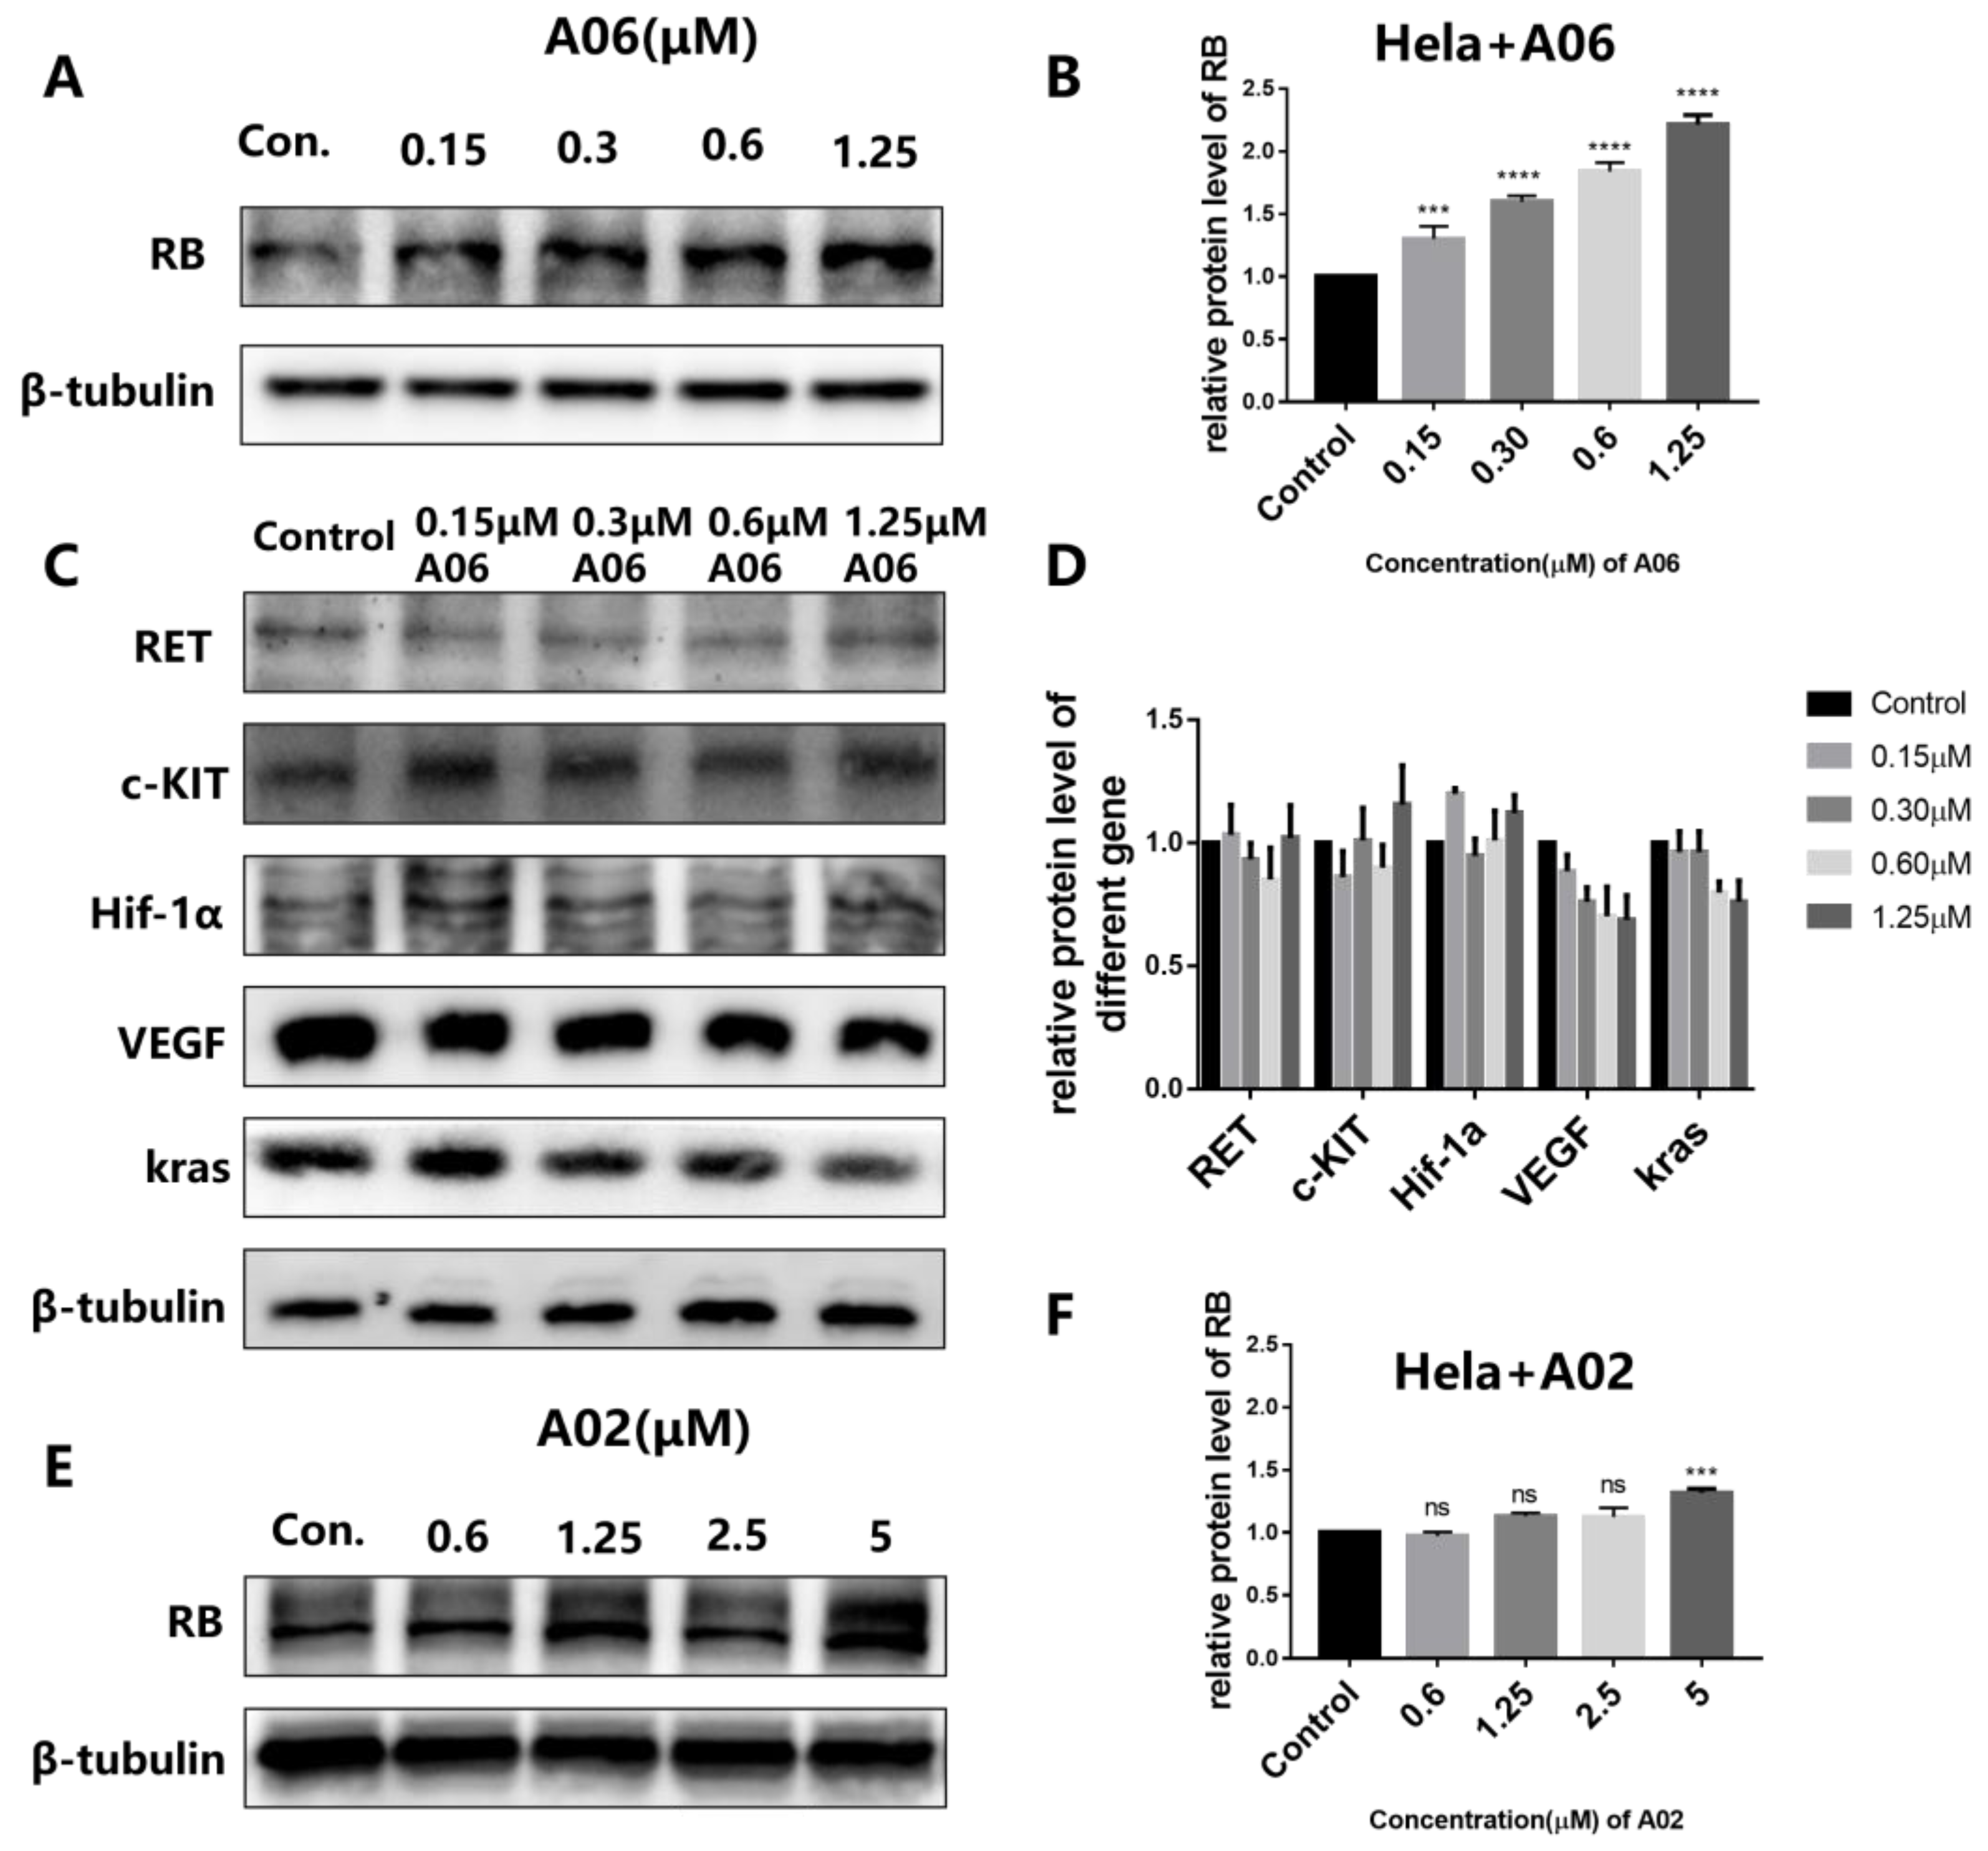
2.5. A06 Up-Regulated RB Gene Transcription and Translation in Hela Cells
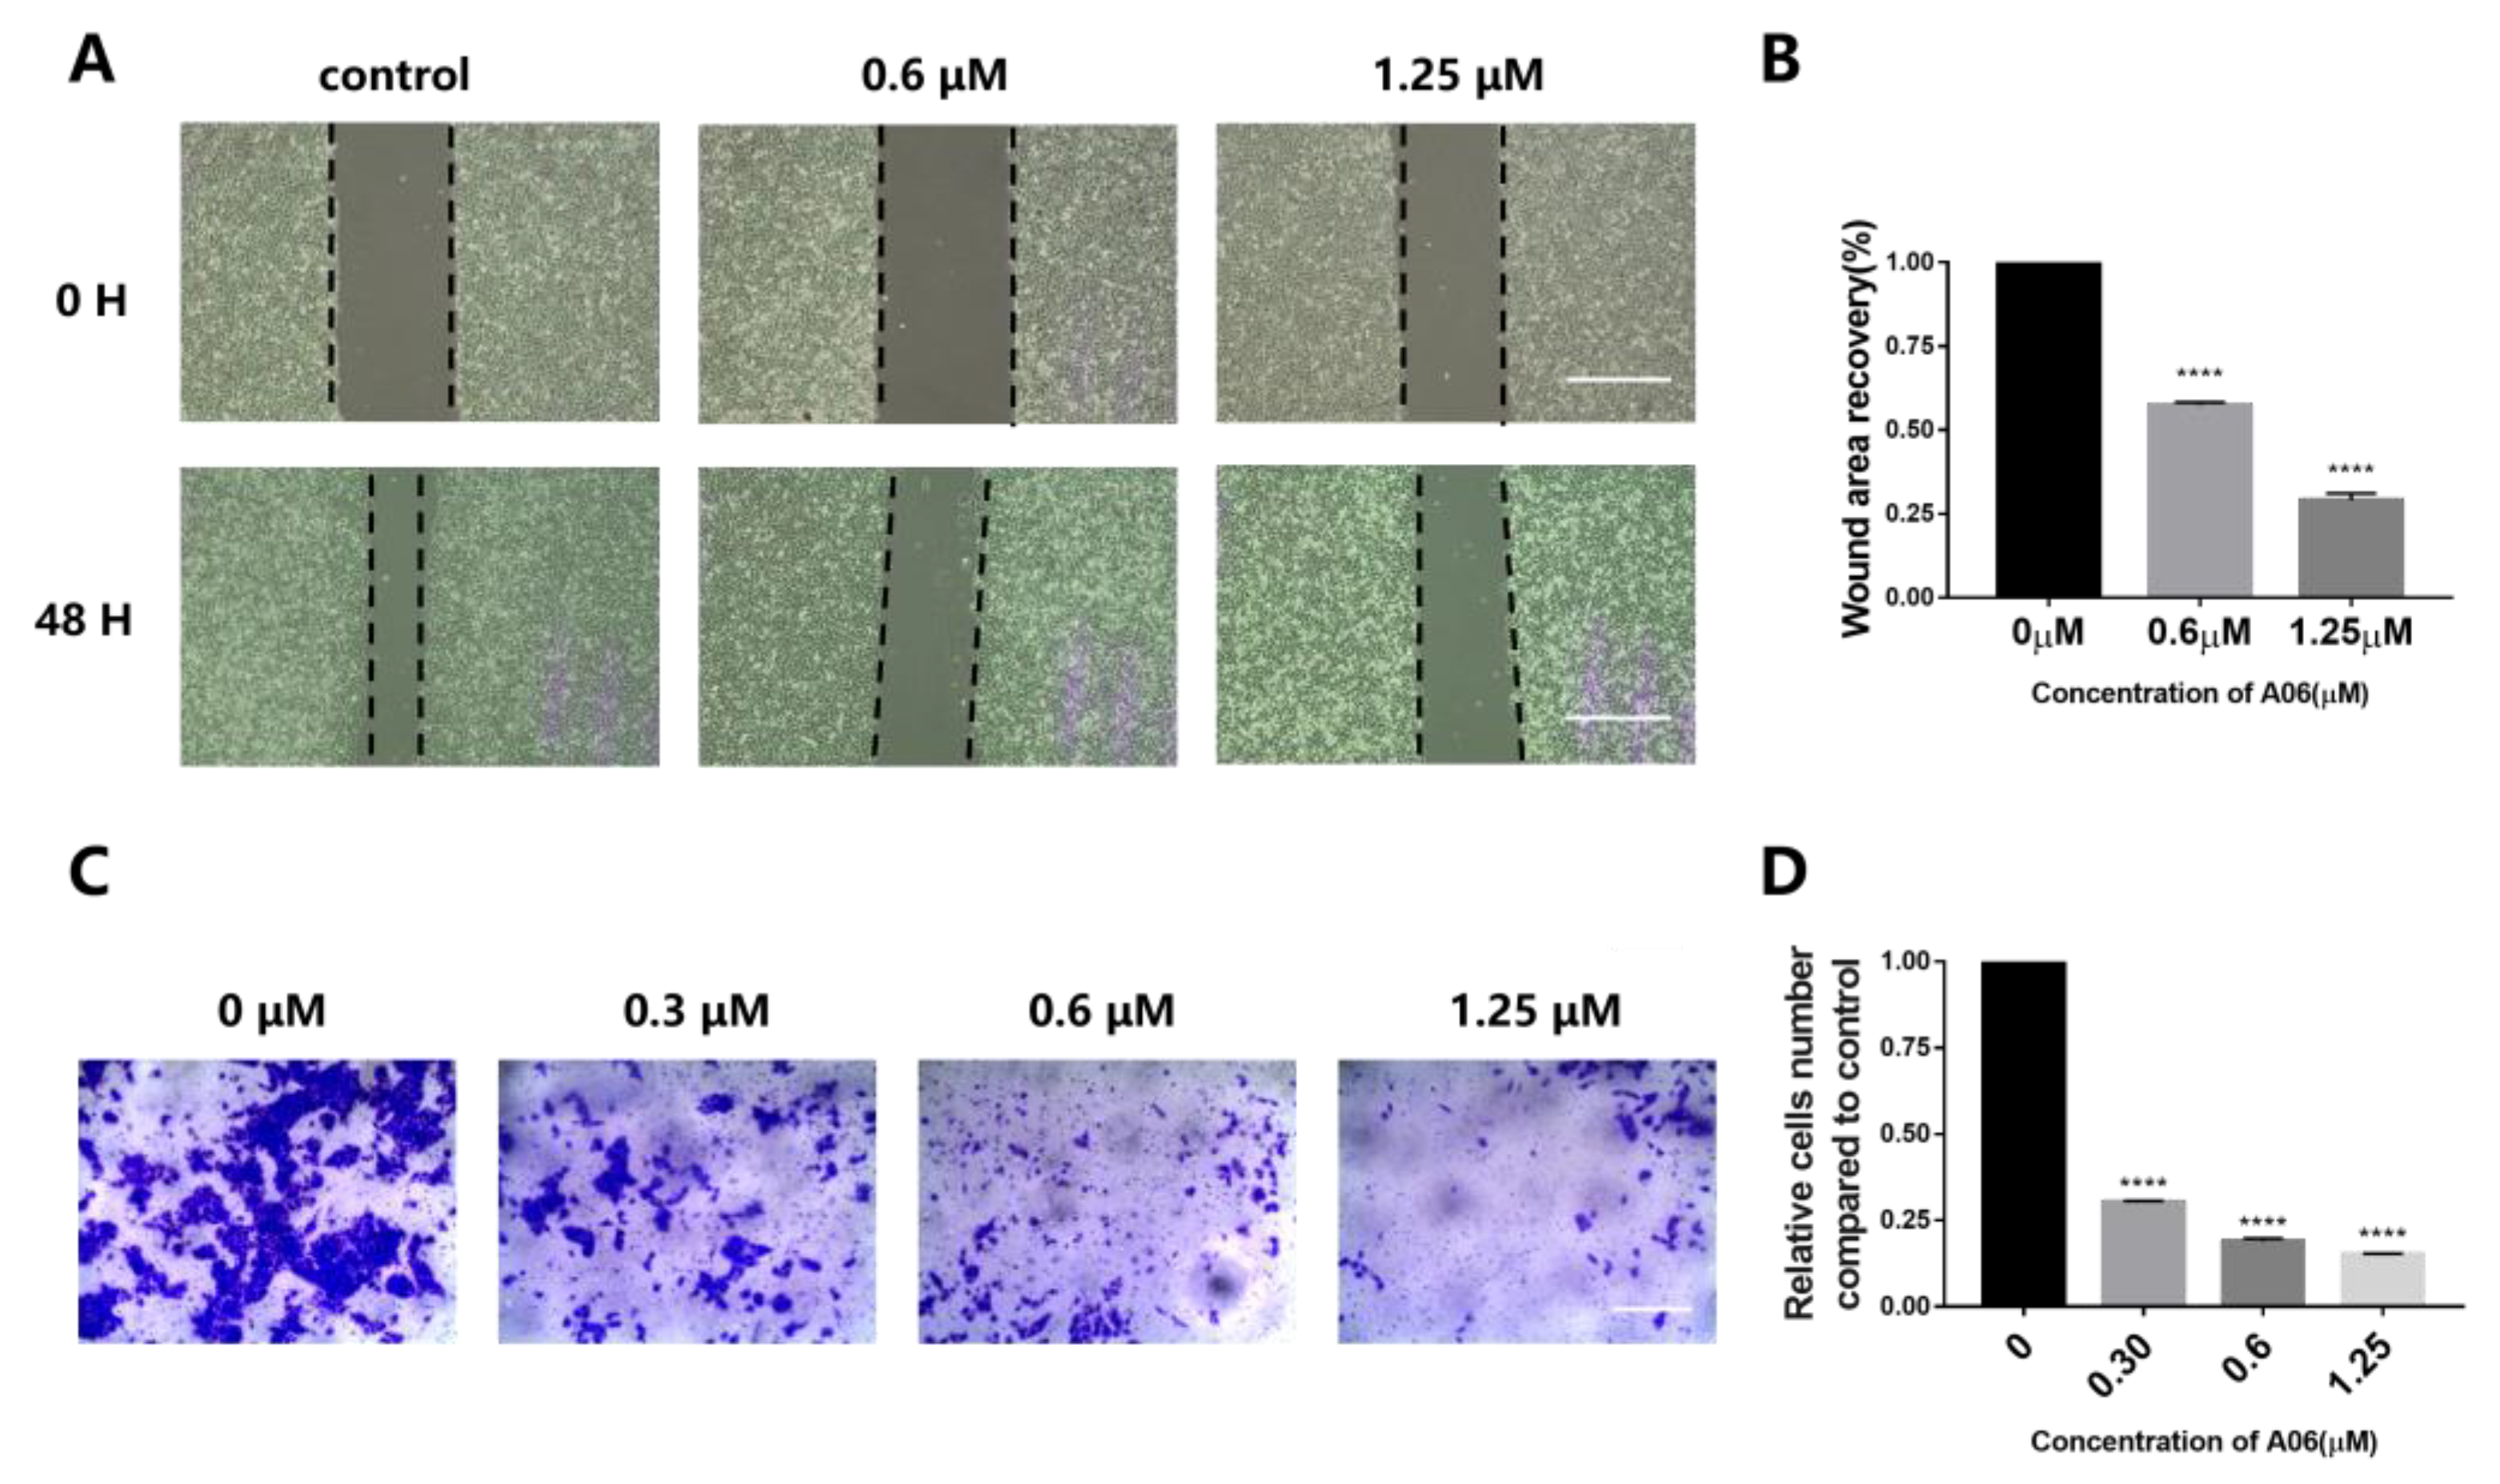
2.6. A06 Induced Cancer Cell Apoptosis and Inhibited Cell Proliferation and Metastasis
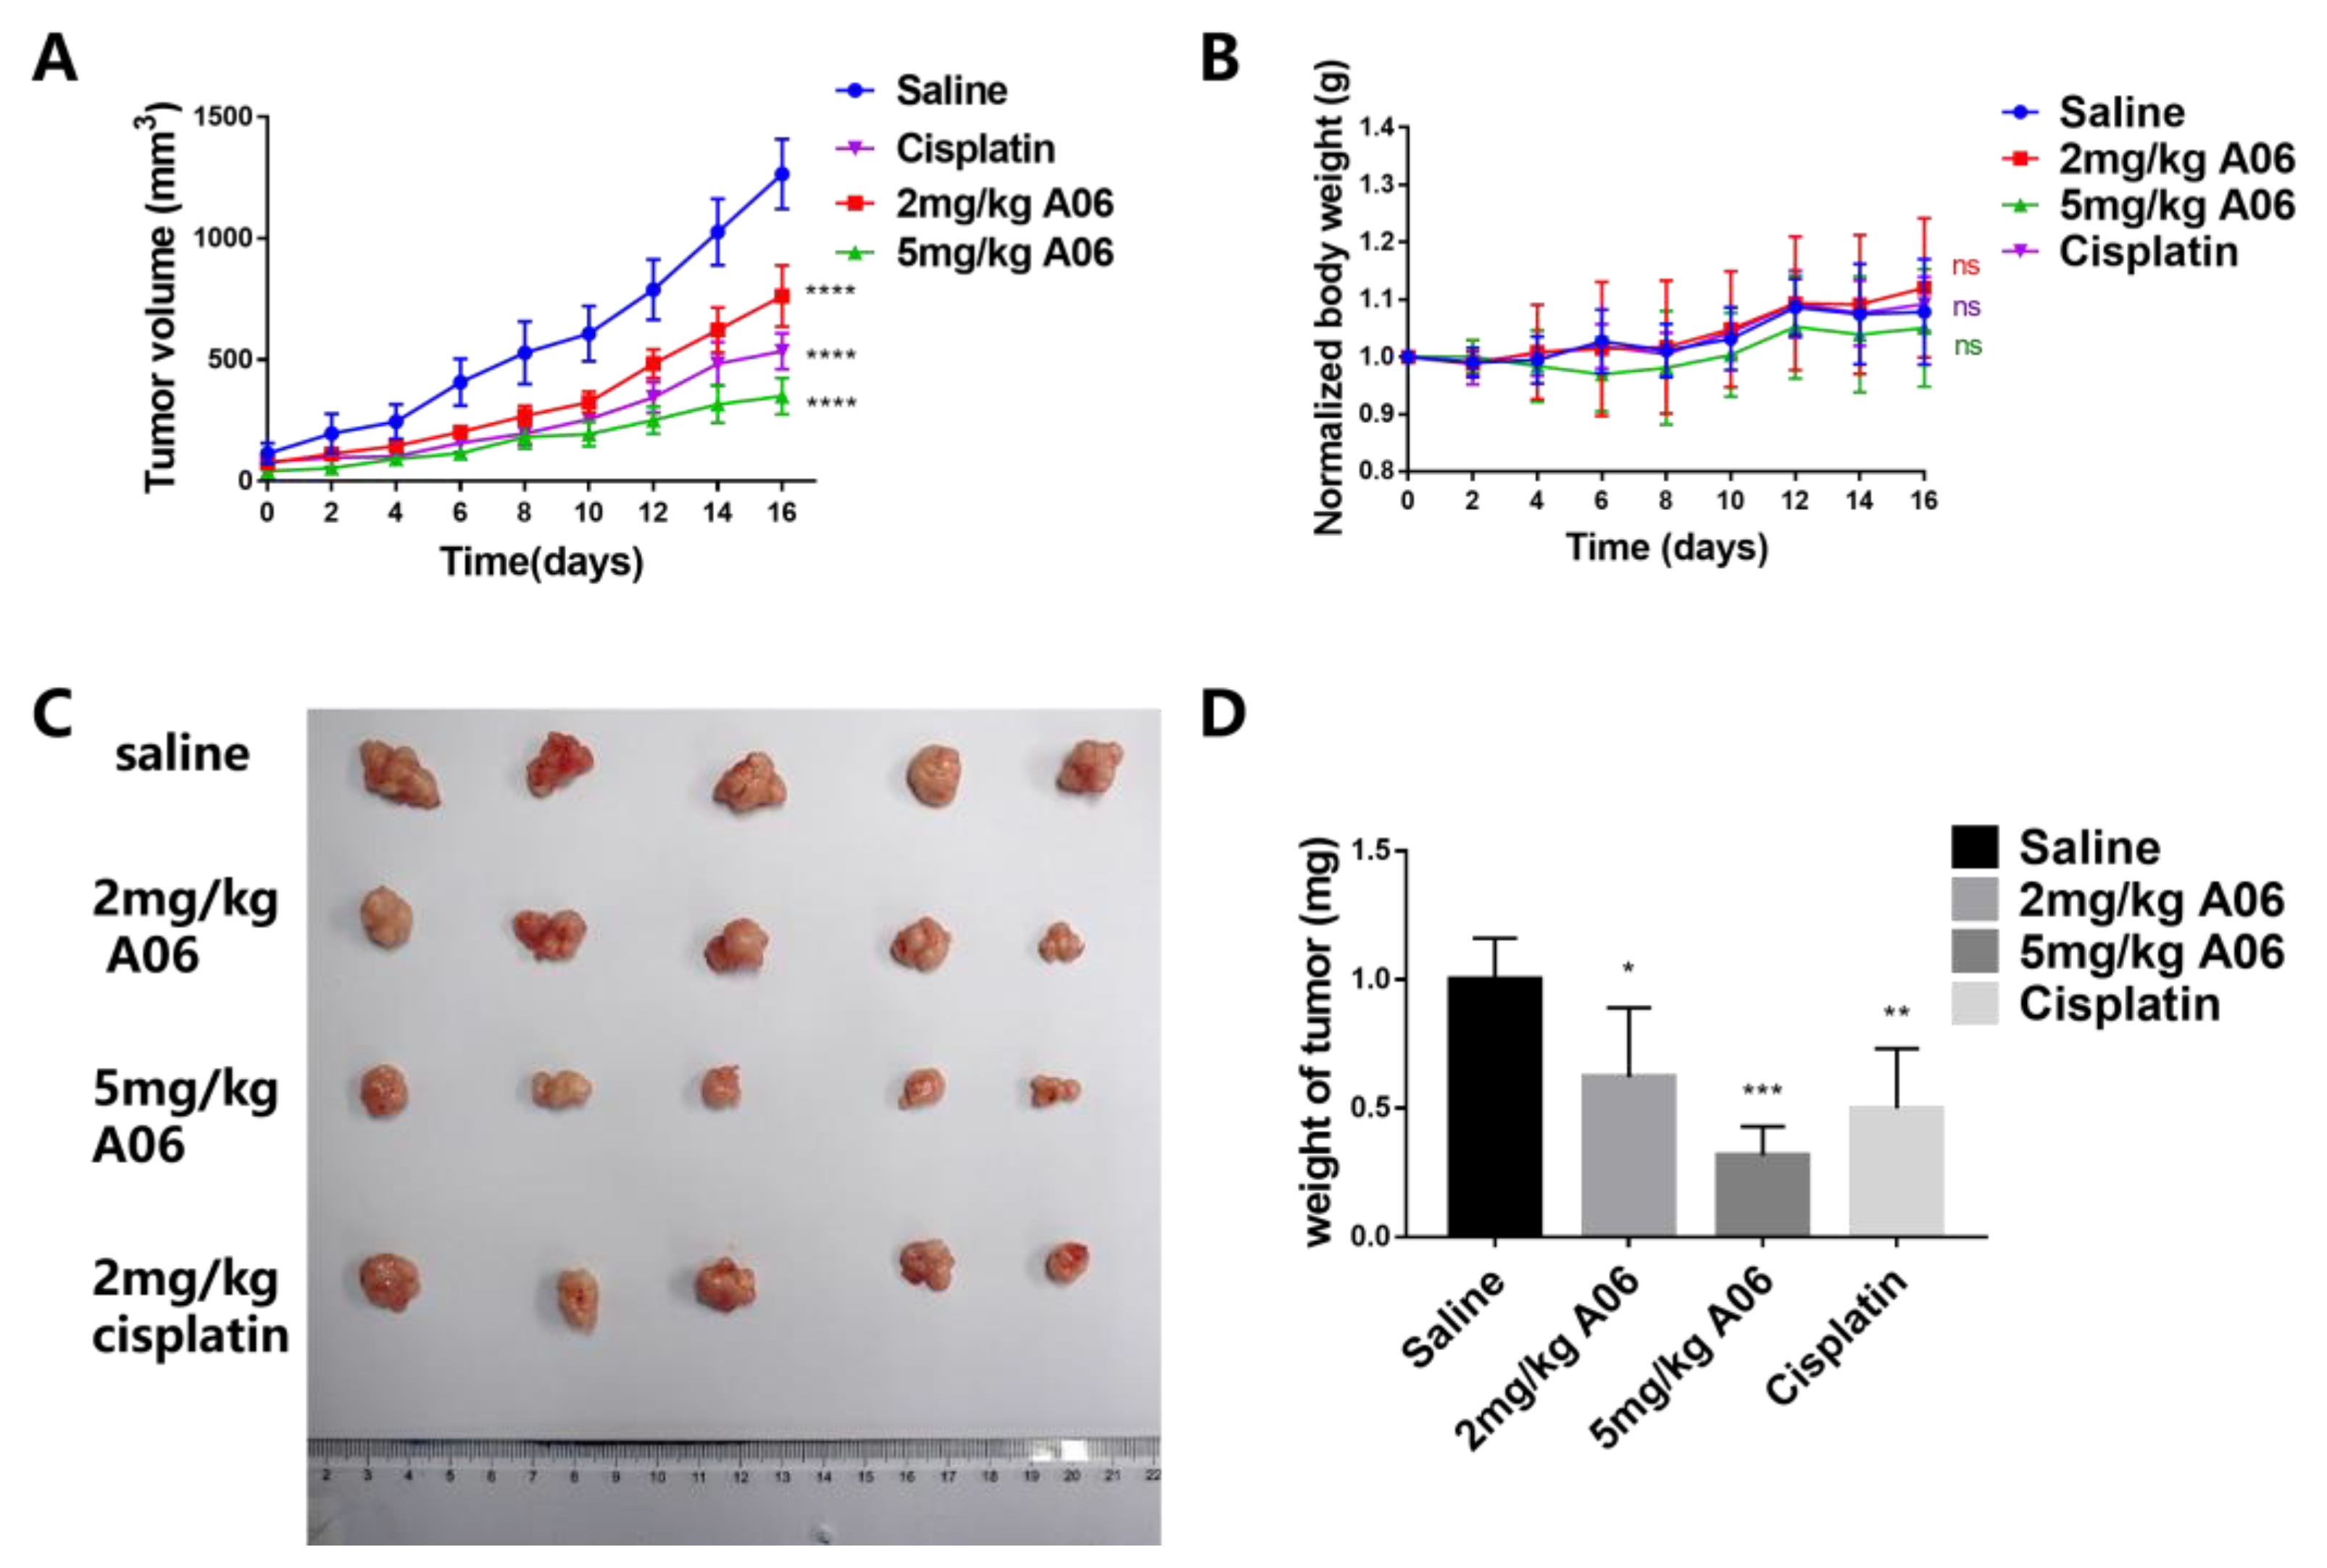
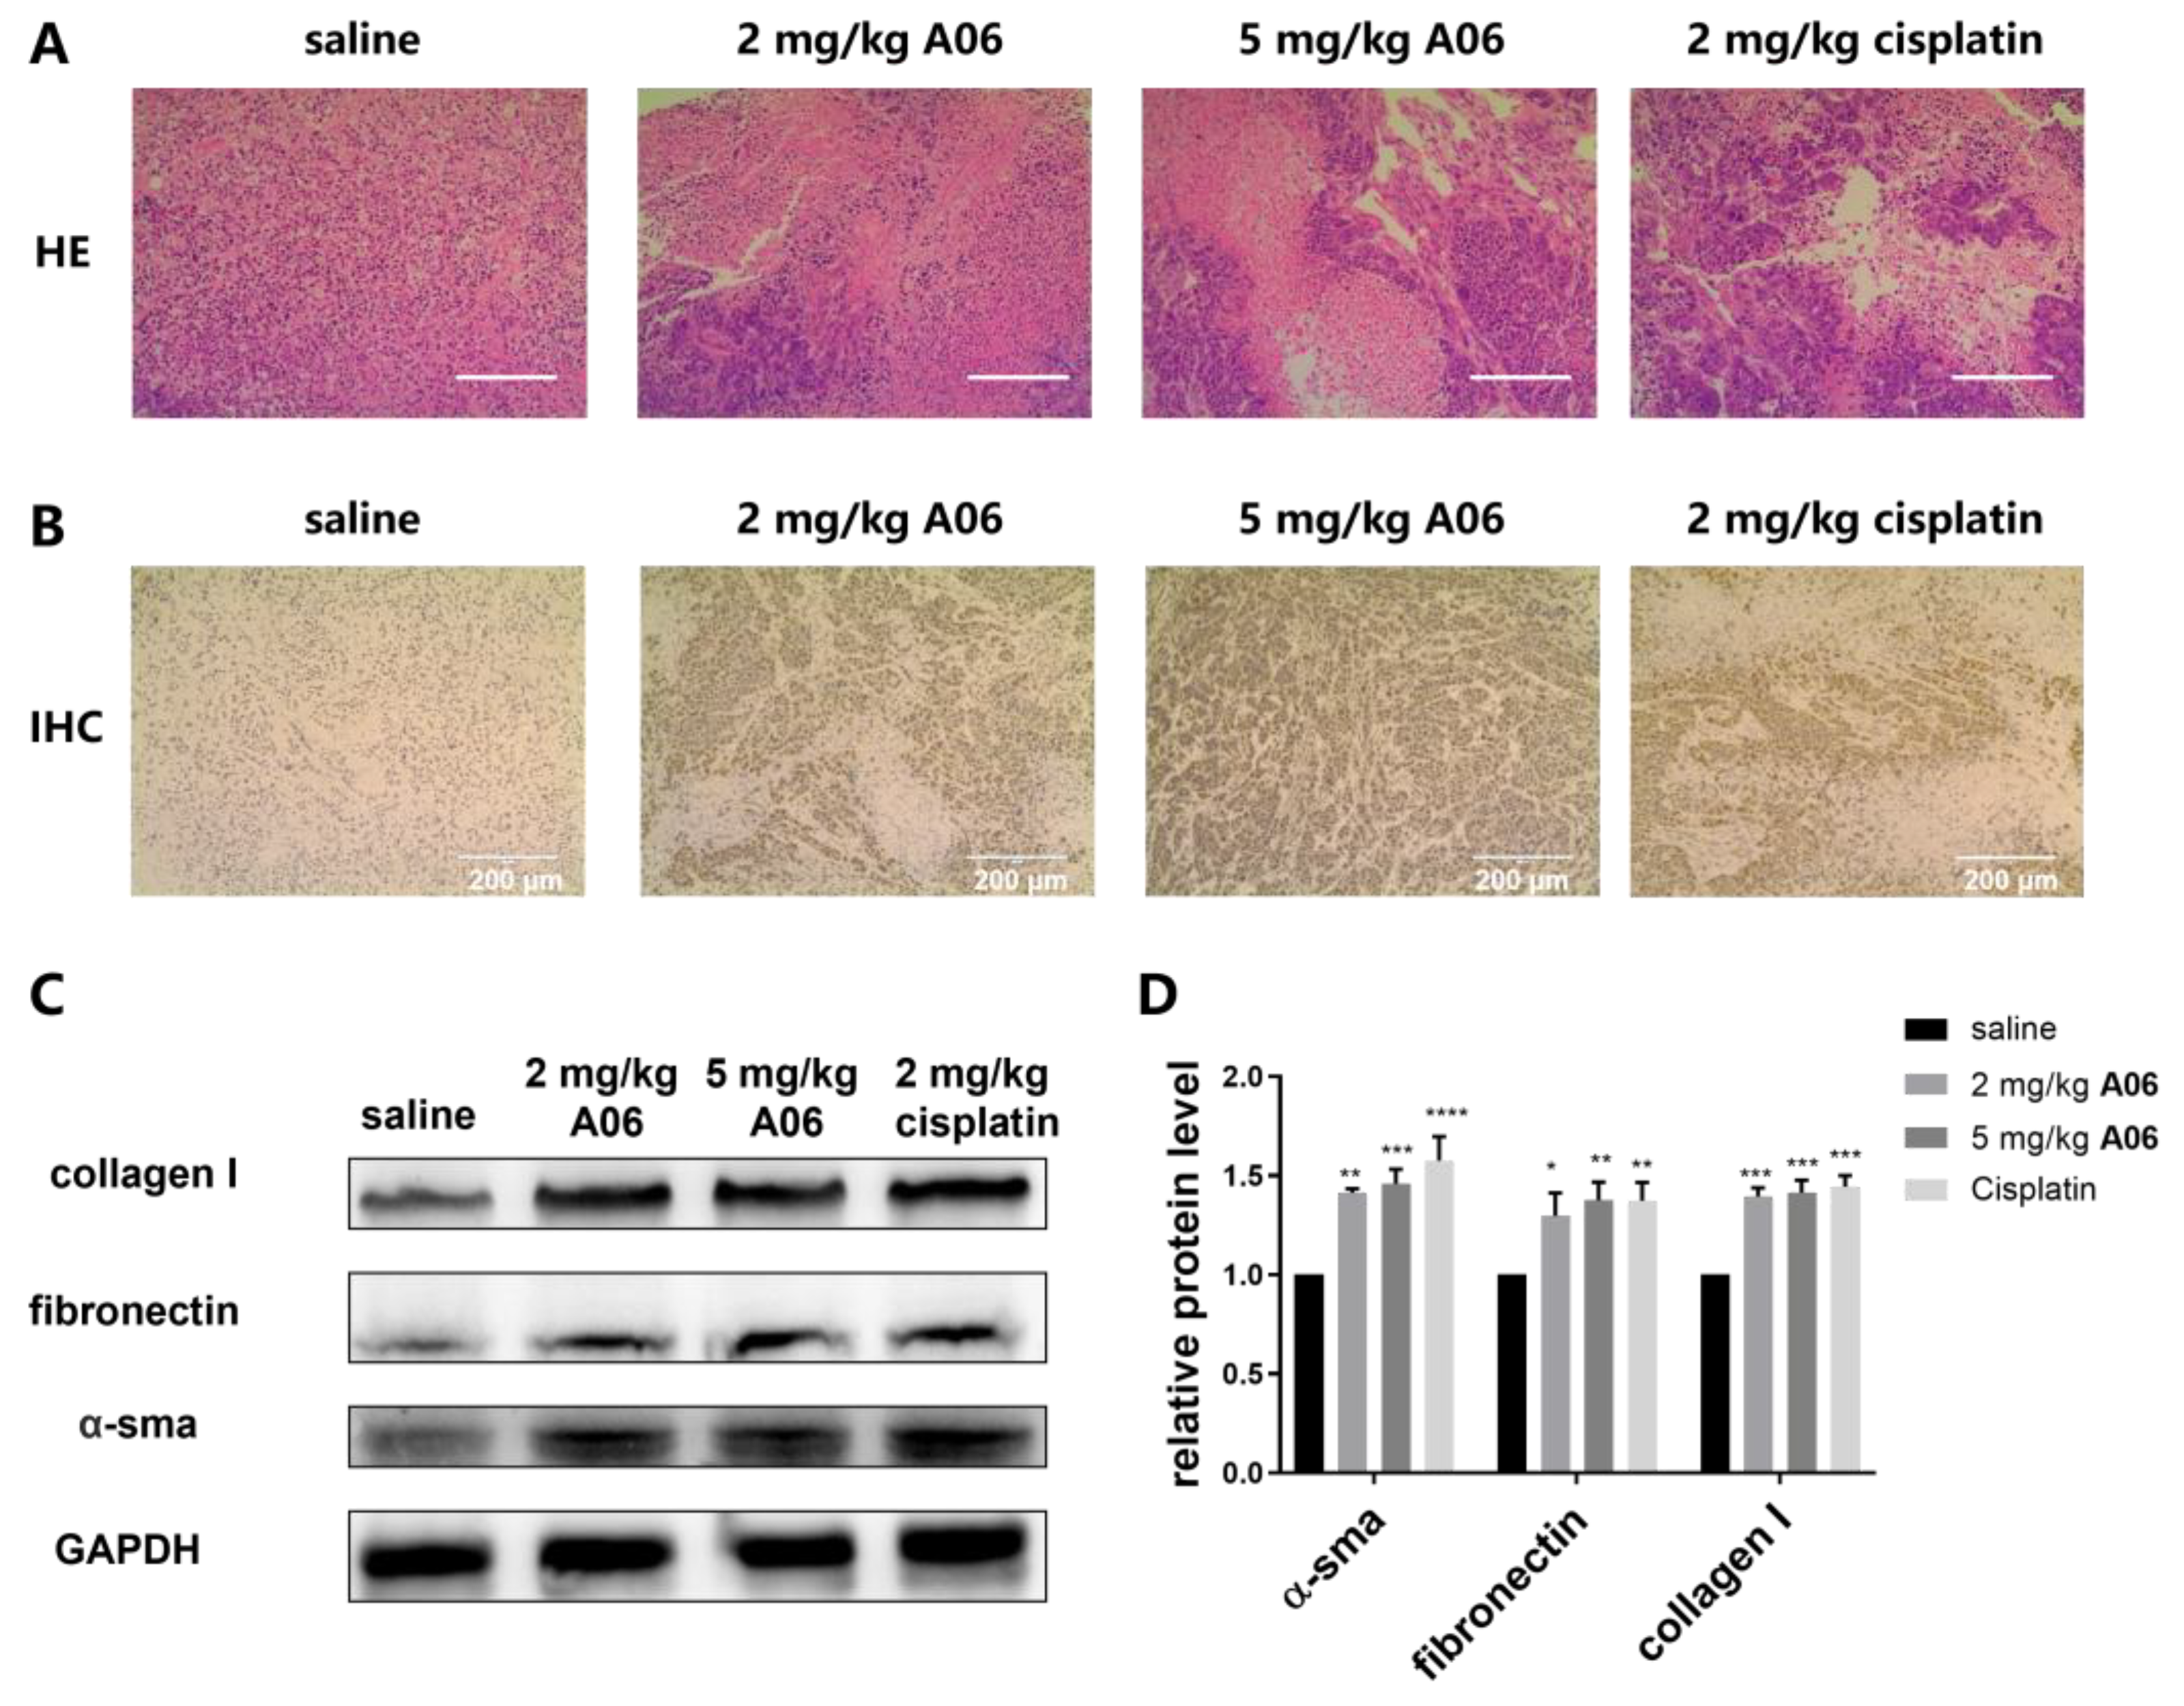
2.7. A06 Inhibited Tumor Growth in a Human Cervical Cancer Xenograft
3. Discussion
4. Materials and Methods
4.1. Oligonucleotides and Compounds
4.2. Cell Culture
4.3. Surface Plasmon Resonance (SPR) Experiment
4.4. Microscale Thermophoresis (MST) Experiment
4.5. TO Displacement Experiment
4.6. Circular Dichroism (CD) Spectroscopy and CD-Melting Experiment
4.7. Fluorescence Resonance Energy Transfer (FRET) Experiment
4.8. NMR Experiment
4.9. ESI-MS
4.10. Electrophoretic Mobility Shift (EMSA) Experiment
4.11. Ultraviolet–Visible (UV) Spectroscopy
4.12. Dual-Luciferase Reporter Assay
4.13. Reverse Transcription–Quantitative Polymerase Chain Reaction (RT-qPCR)
4.14. Western Blot
4.15. Immunofluorescence
4.16. Cytotoxic Assay
4.17. Colony Formation Assay
4.18. FITC Annexin V/PI Cell Apoptosis Analysis
4.19. Hoechst Staining
4.20. Cell Scrape Assay
4.21. Transwell Assay
4.22. Evaluation of In Vivo Anti-Tumor Activity
4.23. Statistical Analysis
Supplementary Materials
Author Contributions
Funding
Institutional Review Board Statement
Informed Consent Statement
Data Availability Statement
Conflicts of Interest
References
- Sung, H.; Ferlay, J.; Siegel, R.L.; Laversanne, M.; Soerjomataram, I.; Jemal, A.; Bray, F. Global Cancer Statistics 2020: GLOBOCAN Estimates of Incidence and Mortality Worldwide for 36 Cancers in 185 Countries. CA A Cancer J. Clin. 2021, 71, 209–249. [Google Scholar] [CrossRef] [PubMed]
- Bray, F.; Laversanne, M.; Weiderpass, E.; Soerjomataram, I. The ever-increasing importance of cancer as a leading cause of premature death worldwide. Cancer 2021, 127, 3029–3030. [Google Scholar] [CrossRef] [PubMed]
- Senga, S.S.; Grose, R.P. Hallmarks of cancer—The new testament. Open Biol. 2021, 11, 200358. [Google Scholar] [CrossRef] [PubMed]
- Flores, M.; Goodrich, D.W. Retinoblastoma Protein Paralogs and Tumor Suppression. Front. Genet. 2022, 13, 818719. [Google Scholar] [CrossRef]
- Mandigo, A.C.; Tomlins, S.A.; Kelly, W.K.; Knudsen, K.E. Relevance of pRB Loss in Human Malignancies. Clin. Cancer Res. Off. J. Am. Assoc. Cancer Res. 2022, 28, 255–264. [Google Scholar] [CrossRef]
- Lees, J.A.; Buchkovich, K.J.; Marshak, D.R.; Anderson, C.W.; Harlow, E. The retinoblastoma protein is phosphorylated on multiple sites by human cdc2. EMBO J. 1991, 10, 4279–4290. [Google Scholar] [CrossRef]
- Xiao, B.; Spencer, J.; Clements, A.; Ali-Khan, N.; Mittnacht, S.; Broceño, C.; Burghammer, M.; Perrakis, A.; Marmorstein, R.; Gamblin, S.J. Crystal structure of the retinoblastoma tumor suppressor protein bound to E2F and the molecular basis of its regulation. Proc. Natl. Acad. Sci. USA 2003, 100, 2363–2368. [Google Scholar] [CrossRef]
- Knudsen, E.S.; Wang, J.Y.J. Differential Regulation of Retinoblastoma Protein Function by Specific Cdk Phosphorylation Sites. J. Biol. Chem. 1996, 271, 8313–8320. [Google Scholar] [CrossRef]
- Burke, J.R.; Deshong, A.J.; Pelton, J.G.; Rubin, S.M. Phosphorylation-induced conformational changes in the retinoblastoma protein inhibit E2F transactivation domain binding. J. Biol. Chem. 2010, 285, 16286–16293. [Google Scholar] [CrossRef]
- Yao, Y.; Gu, X.; Xu, X.; Ge, S.; Jia, R. Novel insights into RB1 mutation. Cancer Lett. 2022, 547, 215870. [Google Scholar] [CrossRef]
- Klein, M.E.; Kovatcheva, M.; Davis, L.E.; Tap, W.D.; Koff, A. CDK4/6 Inhibitors: The Mechanism of Action May Not Be as Simple as Once Thought. Cancer Cell 2018, 34, 9–20. [Google Scholar] [CrossRef] [PubMed]
- Gehring, K.; Leroy, J.L.; Guéron, M. A tetrameric DNA structure with protonated cytosine.cytosine base pairs. Nature 1993, 363, 561–565. [Google Scholar] [CrossRef] [PubMed]
- Henderson, E.; Hardin, C.C.; Walk, S.K.; Tinoco, I., Jr.; Blackburn, E.H. Telomeric DNA oligonucleotides form novel intramolecular structures containing guanine-guanine base pairs. Cell 1987, 51, 899–908. [Google Scholar] [CrossRef]
- Sedghi Masoud, S.; Nagasawa, K. i-Motif-Binding Ligands and Their Effects on the Structure and Biological Functions of i-Motif. Chem. Pharm. Bull. 2018, 66, 1091–1103. [Google Scholar] [CrossRef]
- King, J.J.; Irving, K.L.; Evans, C.W.; Chikhale, R.V.; Becker, R.; Morris, C.J.; Peña Martinez, C.D.; Schofield, P.; Christ, D.; Hurley, L.H.; et al. DNA G-Quadruplex and i-Motif Structure Formation Is Interdependent in Human Cells. J. Am. Chem. Soc. 2020, 142, 20600–20604. [Google Scholar] [CrossRef]
- Kendrick, S.; Kang, H.-J.; Alam, M.P.; Madathil, M.M.; Agrawal, P.; Gokhale, V.; Yang, D.; Hecht, S.M.; Hurley, L.H. The Dynamic Character of the BCL2 Promoter i-Motif Provides a Mechanism for Modulation of Gene Expression by Compounds That Bind Selectively to the Alternative DNA Hairpin Structure. J. Am. Chem. Soc. 2014, 136, 4161–4171. [Google Scholar] [CrossRef]
- Shu, B.; Cao, J.; Kuang, G.; Qiu, J.; Zhang, M.; Zhang, Y.; Wang, M.; Li, X.; Kang, S.; Ou, T.-M.; et al. Syntheses and evaluation of new acridone derivatives for selective binding of oncogene c-myc promoter i-motifs in gene transcriptional regulation. Chem. Commun. 2018, 54, 2036–2039. [Google Scholar] [CrossRef]
- Hilton, J.; Gelmon, K.; Bedard, P.L.; Tu, D.; Xu, H.; Tinker, A.V.; Goodwin, R.; Laurie, S.A.; Jonker, D.; Hansen, A.R.; et al. Results of the phase I CCTG IND.231 trial of CX-5461 in patients with advanced solid tumors enriched for DNA-repair deficiencies. Nat. Commun. 2022, 13, 3607. [Google Scholar] [CrossRef]
- Xu, Y.; Sugiyama, H. Structural and functional characterizations of the G-quartet and i-motif elements in retinoblastoma susceptibility genes (Rb). Nucleic Acids Symp. Ser. 2005, 49, 177–178. [Google Scholar] [CrossRef]
- Xu, Y.; Sugiyama, H. Formation of the G-quadruplex and i-motif structures in retinoblastoma susceptibility genes (Rb). Nucleic Acids Res. 2006, 34, 949–954. [Google Scholar] [CrossRef]
- Guo, K.; Gokhale, V.; Hurley, L.H.; Sun, D. Intramolecularly folded G-quadruplex and i-motif structures in the proximal promoter of the vascular endothelial growth factor gene. Nucleic Acids Res. 2008, 36, 4598–4608. [Google Scholar] [CrossRef] [PubMed]
- Day, H.A.; Huguin, C.; Waller, Z.A.E. Silver cations fold i-motif at neutral pH. Chem. Commun. 2013, 49, 7696–7698. [Google Scholar] [CrossRef] [PubMed]
- Kendrick, S.; Akiyama, Y.; Hecht, S.M.; Hurley, L.H. The i-Motif in the bcl-2 P1 Promoter Forms an Unexpectedly Stable Structure with a Unique 8:5:7 Loop Folding Pattern. J. Am. Chem. Soc. 2009, 131, 17667–17676. [Google Scholar] [CrossRef] [PubMed]
- Choi, J.; Kim, S.; Tachikawa, T.; Fujitsuka, M.; Majima, T. pH-Induced Intramolecular Folding Dynamics of i-Motif DNA. J. Am. Chem. Soc. 2011, 133, 16146–16153. [Google Scholar] [CrossRef]
- Xu, L.; Hong, S.; Sun, N.; Wang, K.; Zhou, L.; Ji, L.; Pei, R. Berberine as a novel light-up i-motif fluorescence ligand and its application in designing molecular logic systems. Chem. Commun. 2016, 52, 179–182. [Google Scholar] [CrossRef]
- Uma, V.; Kanthimathi, M.; Weyhermuller, T.; Nair, B.U. Oxidative DNA cleavage mediated by a new copper (II) terpyridine complex: Crystal structure and DNA binding studies. J. Inorg. Biochem. 2005, 99, 2299–2307. [Google Scholar] [CrossRef]
- Pradhan, P.; Srivastava, A.; Singh, J.; Biswas, B.; Saini, A.; Siddique, I.; Kumari, P.; Khan, M.A.; Mishra, A.; Yadav, P.K.; et al. Prion protein transcription is auto-regulated through dynamic interactions with G-quadruplex motifs in its own promoter. Biochim. Biophys. Acta (BBA) Gene Regul. Mech. 2020, 1863, 194479. [Google Scholar] [CrossRef]
- Dhakal, S.; Schonhoft, J.D.; Koirala, D.; Yu, Z.; Basu, S.; Mao, H. Coexistence of an ILPR i-Motif and a Partially Folded Structure with Comparable Mechanical Stability Revealed at the Single-Molecule Level. J. Am. Chem. Soc. 2010, 132, 8991–8997. [Google Scholar] [CrossRef]
- Wang, H.; Shen, R.; Wu, J.; Tang, N. Antitumor activity and DNA-binding investigations of the Zn(II) and Cu(II) complexes with isoeuxanthone. Chem. Pharm. Bull. 2009, 57, 814–818. [Google Scholar] [CrossRef]
- Wang, H.F.; Shen, R.; Jia, L.; Wu, J.C.; Tang, N. Cytotoxic activity and DNA-binding investigations of two benzoxanthone derivatives. Chem. Pharm. Bull. 2009, 57, 808–813. [Google Scholar] [CrossRef]
- Kashanian, S.; Zeidali, S.H. DNA binding studies of tartrazine food additive. DNA Cell Biol. 2011, 30, 499–505. [Google Scholar] [CrossRef] [PubMed]
- Lieblein, A.L.; Buck, J.; Schlepckow, K.; Fürtig, B.; Schwalbe, H. Time-Resolved NMR Spectroscopic Studies of DNA i-Motif Folding Reveal Kinetic Partitioning. Angew. Chem. Int. Ed. 2012, 51, 250–253. [Google Scholar] [CrossRef] [PubMed]
- Catasti, P.; Chen, X.; Deaven, L.L.; Moyzis, R.K.; Bradbury, E.M.; Gupta, G. Cystosine-rich strands of the insulin minisatellite adopt hairpins with intercalated Cytosine+·Cytosine pairs11Edited by I. Tinoco. J. Mol. Biol. 1997, 272, 369–382. [Google Scholar] [CrossRef] [PubMed]
- Wang, F.; Wang, C.; Liu, Y.; Lan, W.; Han, H.; Wang, R.; Huang, S.; Cao, C. Colchicine selective interaction with oncogene RET G-quadruplex revealed by NMR. Chem. Commun. 2020, 56, 2099–2102. [Google Scholar] [CrossRef]
- Im, K.; Mareninov, S.; Diaz, M.F.P.; Yong, W.H. An Introduction to Performing Immunofluorescence Staining. Methods Mol. Biol. 2019, 1897, 299–311. [Google Scholar]
- Słoniecka, M.; Danielson, P. Substance P induces fibrotic changes through activation of the RhoA/ROCK pathway in an in vitro human corneal fibrosis model. J. Mol. Med. 2019, 97, 1477–1489. [Google Scholar] [CrossRef]
- Kim, M.Y.; Duan, W.; Gleason-Guzman, M.; Hurley, L.H. Design, synthesis, and biological evaluation of a series of fluoroquinoanthroxazines with contrasting dual mechanisms of action against topoisomerase II and G-quadruplexes. J. Med. Chem. 2003, 46, 571–583. [Google Scholar] [CrossRef]
- Drygin, D.; Siddiqui-Jain, A.; O’Brien, S.; Schwaebe, M.; Lin, A.; Bliesath, J.; Ho, C.B.; Proffitt, C.; Trent, K.; Whitten, J.P.; et al. Anticancer activity of CX-3543: A direct inhibitor of rRNA biogenesis. Cancer Res. 2009, 69, 7653–7661. [Google Scholar] [CrossRef]
- Kuang, G.; Zhang, M.; Kang, S.; Hu, D.; Li, X.; Wei, Z.; Gong, X.; An, L.-K.; Huang, Z.-S.; Shu, B.; et al. Syntheses and Evaluation of New Bisacridine Derivatives for Dual Binding of G-Quadruplex and i-Motif in Regulating Oncogene c-myc Expression. J. Med. Chem. 2020, 63, 9136–9153. [Google Scholar] [CrossRef]
- Zaimy, M.A.; Saffarzadeh, N.; Mohammadi, A.; Pourghadamyari, H.; Izadi, P.; Sarli, A.; Moghaddam, L.K.; Pascheparis, S.R.; Azizi, H.; Torkamandi, S.; et al. New methods in the diagnosis of cancer and gene therapy of cancer based on nanoparticles. Cancer Gene Ther. 2017, 24, 233–243. [Google Scholar] [CrossRef]
- Shu, B.; Zeng, P.; Kang, S.; Li, P.-H.; Hu, D.; Kuang, G.; Cao, J.; Li, X.; Zhang, M.; An, L.-K.; et al. Syntheses and evaluation of new Quinoline derivatives for inhibition of hnRNP K in regulating oncogene c-myc transcription. Bioorganic Chem. 2019, 85, 1–17. [Google Scholar] [CrossRef] [PubMed]
- Herkt, M.; Batkai, S.; Thum, T. Studying Interactions between 2′-O-Me-Modified Inhibitors and MicroRNAs Utilizing Microscale Thermophoresis. Mol. Ther. Nucleic Acids 2019, 18, 259–268. [Google Scholar] [CrossRef] [PubMed]
- Zhang, M.-L.; Xu, Y.-P.; Kumar, A.; Zhang, Y.; Wu, W.-Q. Studying the Potassium-Induced G-Quadruplex DNA Folding Process Using Microscale Thermophoresis. Biochemistry 2019, 58, 3955–3959. [Google Scholar] [CrossRef] [PubMed]
- Cavaliere, P.; Pagano, B.; Granata, V.; Prigent, S.; Rezaei, H.; Giancola, C.; Zagari, A. Cross-talk between prion protein and quadruplex-forming nucleic acids: A dynamic complex formation. Nucleic Acids Res. 2013, 41, 327–339. [Google Scholar] [CrossRef] [PubMed]
- Rajendran, A.; Nakano, S.-i.; Sugimoto, N. Molecular crowding of the cosolutes induces an intramolecular i-motif structure of triplet repeat DNA oligomers at neutral pH. Chem. Commun. 2010, 46, 1299–1301. [Google Scholar] [CrossRef]
- Iaccarino, N.; Cheng, M.; Qiu, D.; Pagano, B.; Amato, J.; Di Porzio, A.; Zhou, J.; Randazzo, A.; Mergny, J.-L. Effects of Sequence and Base Composition on the CD and TDS Profiles of i-DNA. Angew. Chem. Int. Ed. 2021, 60, 10295–10303. [Google Scholar] [CrossRef]
- Xiong, Y.-X.; Chen, A.-C.; Yao, P.-F.; Zeng, D.-Y.; Lu, Y.-J.; Tan, J.-H.; Huang, Z.-S.; Ou, T.-M. Blocking the binding of WT1 to bcl-2 promoter by G-quadruplex ligand SYUIQ-FM05. Biochem. Biophys. Rep. 2016, 5, 346–352. [Google Scholar] [CrossRef]
- Kang, H.-J.; Kendrick, S.; Hecht, S.M.; Hurley, L.H. The Transcriptional Complex Between the BCL2 i-Motif and hnRNP LL Is a Molecular Switch for Control of Gene Expression That Can Be Modulated by Small Molecules. J. Am. Chem. Soc. 2014, 136, 4172–4185. [Google Scholar] [CrossRef]
- Farooqi, S.I.; Arshad, N.; Channar, P.A.; Perveen, F.; Saeed, A.; Larik, F.A.; Javed, A. Synthesis, theoretical, spectroscopic and electrochemical DNA binding investigations of 1, 3, 4-thiadiazole derivatives of ibuprofen and ciprofloxacin: Cancer cell line studies. J. Photochem. Photobiol. B Biol. 2018, 189, 104–118. [Google Scholar] [CrossRef]


| Buffer | Ingredients |
|---|---|
| MES buffer | 20 mM MES, 100 mM KCl, pH 5.5 |
| BPES buffer | 30 mM (KH2PO4, K2HPO4), 1 mM EDTA, and 100 mM KCl |
| Tris–HCl buffer | 50 mM Tris–HCl, 100 mM KCl, pH 7.4 |
| Oligomer | Sequence |
|---|---|
| RB IM for RB promoter i-motif | 5′-GCCGCCCAAAACCCCCCG-3′ |
| RB G4 for RB promoter G-quadruplex | 5′-CGGGGGGTTTTGGGCGGC-3′ |
Disclaimer/Publisher’s Note: The statements, opinions and data contained in all publications are solely those of the individual author(s) and contributor(s) and not of MDPI and/or the editor(s). MDPI and/or the editor(s) disclaim responsibility for any injury to people or property resulting from any ideas, methods, instructions or products referred to in the content. |
© 2025 by the authors. Licensee MDPI, Basel, Switzerland. This article is an open access article distributed under the terms and conditions of the Creative Commons Attribution (CC BY) license (https://creativecommons.org/licenses/by/4.0/).
Share and Cite
Lin, X.; Zhang, J.; Liang, J.; Ji, D.; Huang, Z.-S.; Li, D. Selective Up-Regulation of Tumor Suppressor Gene Retinoblastoma by Bisacridine Derivative Through Gene Promoter Quadruplex Structures for Cancer Treatment. Int. J. Mol. Sci. 2025, 26, 1417. https://doi.org/10.3390/ijms26041417
Lin X, Zhang J, Liang J, Ji D, Huang Z-S, Li D. Selective Up-Regulation of Tumor Suppressor Gene Retinoblastoma by Bisacridine Derivative Through Gene Promoter Quadruplex Structures for Cancer Treatment. International Journal of Molecular Sciences. 2025; 26(4):1417. https://doi.org/10.3390/ijms26041417
Chicago/Turabian StyleLin, Xiaomin, Jiahui Zhang, Jihai Liang, Dongsheng Ji, Zhi-Shu Huang, and Ding Li. 2025. "Selective Up-Regulation of Tumor Suppressor Gene Retinoblastoma by Bisacridine Derivative Through Gene Promoter Quadruplex Structures for Cancer Treatment" International Journal of Molecular Sciences 26, no. 4: 1417. https://doi.org/10.3390/ijms26041417
APA StyleLin, X., Zhang, J., Liang, J., Ji, D., Huang, Z.-S., & Li, D. (2025). Selective Up-Regulation of Tumor Suppressor Gene Retinoblastoma by Bisacridine Derivative Through Gene Promoter Quadruplex Structures for Cancer Treatment. International Journal of Molecular Sciences, 26(4), 1417. https://doi.org/10.3390/ijms26041417