Article

Combining Sulfonylureas with Anticancer Drugs: Evidence of Synergistic Efficacy with Doxorubicin In Vitro and In Vivo

by
Mateusz D. Tomczyk
1,*,
Karolina Matczak
2,
Marta Denel-Bobrowska
3,
Grzegorz Dzido
4,
Anna Kubicka
2,
Daria Gendosz de Carrillo
5,6,
Tomasz Cichoń
7,
Marlena Golec
8,
Beata Powieczko
1,
Waldemar Rzetelny
9,
Agnieszka B. Olejniczak
3 and
Horacio Pérez-Sánchez
10
1
Department of Organic Chemistry, Bioorganic Chemistry and Biotechnology, Faculty of Chemistry, Silesian University of Technology, Krzywoustego 4, 44-100 Gliwice, Poland
2
Department of Medical Biophysics, Faculty of Biology and Environmental Protection, University of Łódź, 141/143, 90-236 Łódź, Poland
3
Screening Laboratory, Institute of Medical Biology, Polish Academy of Sciences, Lodowa 106, 93-232 Łódź, Poland
4
Department of Chemical Engineering and Process Design, Silesian University of Technology, Strzody 9, 44-100 Gliwice, Poland
5
Department of Physiology, Faculty of Medical Sciences, Medical University of Silesia, Medyków 18, 40-055 Katowice, Poland
6
Department of Histology and Cell Pathology, Faculty of Medical Sciences, Medical University of Silesia, Jordana 19, 41-808 Zabrze, Poland
7
Center for Translational Research and Molecular Biology of Cancer, Maria Skłodowska-Curie National Research Institute of Oncology, Gliwice Branch, Wybrzeże Armii Krajowej Street 15, 44-102 Gliwice, Poland
8
Department of Radiopharmacy and Preclinical PET Imaging, Maria Skłodowska-Curie National Research Institute of Oncology, Gliwice Branch, Wybrzeże Armii Krajowej Street 15, 44-102 Gliwice, Poland
9
Department of Chemotherapy, Hospital of the Ministry of Interior and Administration in Łódź, Północna 42, 91-425 Łódź, Poland
10
Structural Bioinformatics and High Performance Computing Research Group (BIO-HPC), Computer Engineering Department, Universidad Católica de Murcia (UCAM), Campus de los Jerónimos 135, 30107 Murcia, Spain
*
Author to whom correspondence should be addressed.
Int. J. Mol. Sci. 2025, 26(4), 1429; https://doi.org/10.3390/ijms26041429
Submission received: 28 December 2024 / Revised: 5 February 2025 / Accepted: 6 February 2025 / Published: 8 February 2025
(This article belongs to the Collection Anticancer Drug Discovery and Development)

Abstract

:
Sulfonylureas (SUs)—a class of drugs primarily used to treat type 2 diabetes—have recently attracted interest for their potential anticancer properties. While some studies have explored the chemical modification or design of new SU derivatives, our work instead centers on biological evaluations of all commercially available SUs in combination with doxorubicin (DOXO). These antidiabetic agents act by stimulating insulin secretion via KATP channel inhibition, and because KATP channels share structural features with ATP-binding cassette (ABC) transporters involved in multidrug resistance (e.g., P-glycoprotein, MRP1, and MRP2), SUs may also reduce cancer cell drug efflux. In this study, we systematically examined each commercially available SU for potential synergy with DOXO in a panel of human cancer cell lines. Notably, combining DOXO with glimepiride (GLIM), the newest SU, results in a 4.4-fold increase in cytotoxicity against MCF-7 breast cancer cells relative to DOXO alone. Mechanistic studies suggest that the observed synergy may arise from increased intracellular accumulation of DOXO. Preliminary in vivo experiments support these findings, showing that DOXO (5 mg/kg, i.v.) plus GLIM (4 mg/kg, i.p.) is more effective at inhibiting 4T1 tumor growth in mice than DOXO alone. Additionally, we show that adding a small amount of the surfactant Tween-80 to culture media affects SU binding to bovine serum albumin (BSA), potentially unmasking anticancer effects of SUs that strongly bind to proteins. Overall, these results underscore the potential of repurposing existing SUs to enhance standard chemotherapy regimens.

1. Introduction

The main goal of our study was to investigate the potential anticancer effects of combining standard chemotherapeutic agents with sulfonylureas (SUs). SUs are a class of oral antidiabetic drugs commonly used to treat type 2 diabetes mellitus (T2DM). We found that several SUs, particularly glimepiride (GLIM), exhibit strong synergistic cytotoxic effects when combined with doxorubicin (DOXO) in various cancer cell lines. Our interest in SUs was initially inspired by the promising results observed with metformin, another antidiabetic drug known to inhibit tumor growth and enhance the efficacy of standard chemotherapy [1,2,3]. Although metformin and SUs differ considerably in their chemical structures and primary mechanisms of action, both are frequently prescribed to diabetic patients, including those undergoing cancer treatment. Thus, research on SUs is important both for their use in new cancer treatments and for understanding their effects on diabetic patients receiving chemotherapy.
Recent epidemiological studies suggest a correlation between diabetes and elevated cancer risk [4,5,6,7], which has increased interest in the anticancer properties of antidiabetic drugs such as metformin and SUs. As of early 2024, more than 170 clinical trials investigating the effects of metformin in cancer patients were registered on the NIH’s ClinicalTrials.gov website. In contrast, no comparable trials were registered for GLIM or other SUs, even though preclinical data suggest these drugs also may have anticancer activity. This discrepancy underscores the urgent need to investigate the potential benefits of SUs in cancer treatment—a gap that our study aims to address.
SUs primarily function by mimicking the role of ATP in pancreatic beta cells, acting as insulin secretagogues to effectively lower blood glucose in patients with T2DM [8]. They bind to sulfonylurea receptors (SURs) on the surface of beta cells. These receptors, together with Kir6.x-type subunits and other proteins, form ATP-dependent potassium (KATP) channels. When SUs bind to SURs, they block the KATP channels, causing an intracellular accumulation of K+ ions, membrane depolarization, and the subsequent opening of voltage-gated calcium channels. The resulting increase in cytosolic Ca2+ levels stimulates insulin secretion and reduces hyperglycemia [9]. Beyond their glucose-lowering action, SUs are also reported to exhibit cytotoxic and anticancer effects.
Among SUs, glibenclamide (GLIB) has been studied most extensively for its anticancer properties. Preliminary data indicate that GLIB can directly inhibit the growth of various human cancer cells in vitro, such as melanoma, lung cancer, cervical cancer, hepatocellular carcinoma, bladder cancer, leukemia, breast cancer, prostate cancer, pancreatic cancer, and glioma [10,11,12,13,14,15,16]. One possible mechanism underlying its anticancer effect is the inhibition of KATP channels. Several studies have demonstrated that blocking KATP channels reduces cancer cell proliferation both in vitro and in vivo, especially in cells that overexpress these channels [17,18,19]. For example, Zhou et al. reported that inhibiting KATP channels with GLIB reduces proliferation in hepatocellular carcinoma cells [20]. Suzuki et al. found that GLIB enhances the sensitivity of melanoma cells to TRAIL-induced apoptosis by activating essential caspases and causing plasma membrane depolarization through the inhibition of KATP channels [21]. Pasello et al. later confirmed these synergistic apoptotic effects in malignant pleural mesothelioma cell lines [22].
Another possible mechanism for the anticancer activity of SUs is the inhibition of multidrug resistance proteins (MRPs). SURs belong to the ATP-binding cassette (ABC) transporter family, which also includes MRPs, such as P-glycoprotein (P-gp), MRP1, and MRP2. MRPs function as efflux pumps, actively removing drugs from cells and contributing to cancer multidrug resistance (MDR). Because SURs and MRPs have similar structures, SUs are also believed to inhibit MRPs and help overcome MDR. This inhibitory effect has been supported by several studies. For example, Golstein et al. demonstrated that GLIB and related sulfonylcyanoguanidines inhibit P-glycoprotein, leading to increased accumulation of colchicine in leukemia cells and enhanced its cytotoxic activity [23]. Similarly, Payen et al. showed that GLIB inhibits MRP1 in lung cancer cells, leading to increased intracellular accumulation of the MRP1 substrate vincristine. They also found that GLIB suppresses MRP2 activity in rat hepatocytes (which express only MRP2), resulting in higher levels of the MRP2 substrate carboxy-2′,7′-dichlorofluorescein [24]. Other studies have shown that GLIB can enhance the effectiveness of chemotherapeutic agents such as DOXO [11] and tamoxifen [25], both of which are substrates for different ABC transporters. These findings suggest that GLIB may act as a general inhibitor of ABC transporters, potentially improving cancer treatment efficacy by preventing drug efflux and increasing intracellular drug retention in cancer cells.
Evidence suggests that not only GLIB but also other SUs—such as GLIM [10,26,27,28,29,30,31] and glipizide (GLIP) [32,33,34,35,36]—can directly inhibit the growth of various human cancer cell lines and may also enhance the effectiveness of cancer therapies, potentially by inhibiting multidrug efflux pumps. However, the precise mechanisms underlying their synergy with chemotherapeutics remain unclear, and the anticancer potential of other SUs is still poorly understood. To help fill these gaps, we conducted the first comprehensive analysis of cytotoxic and synergistic effects of all commercially available SUs (glimepiride, gliquidone, glipizide, glibenclamide, carbutamide, chlorpropamide, tolazamide, tolbutamide) and one synthetic SU analog in combination with DOXO in a panel of human cell lines. The structures and names of all compounds tested are provided in the Supplementary Materials (Figure S1).

2. Results and Discussion

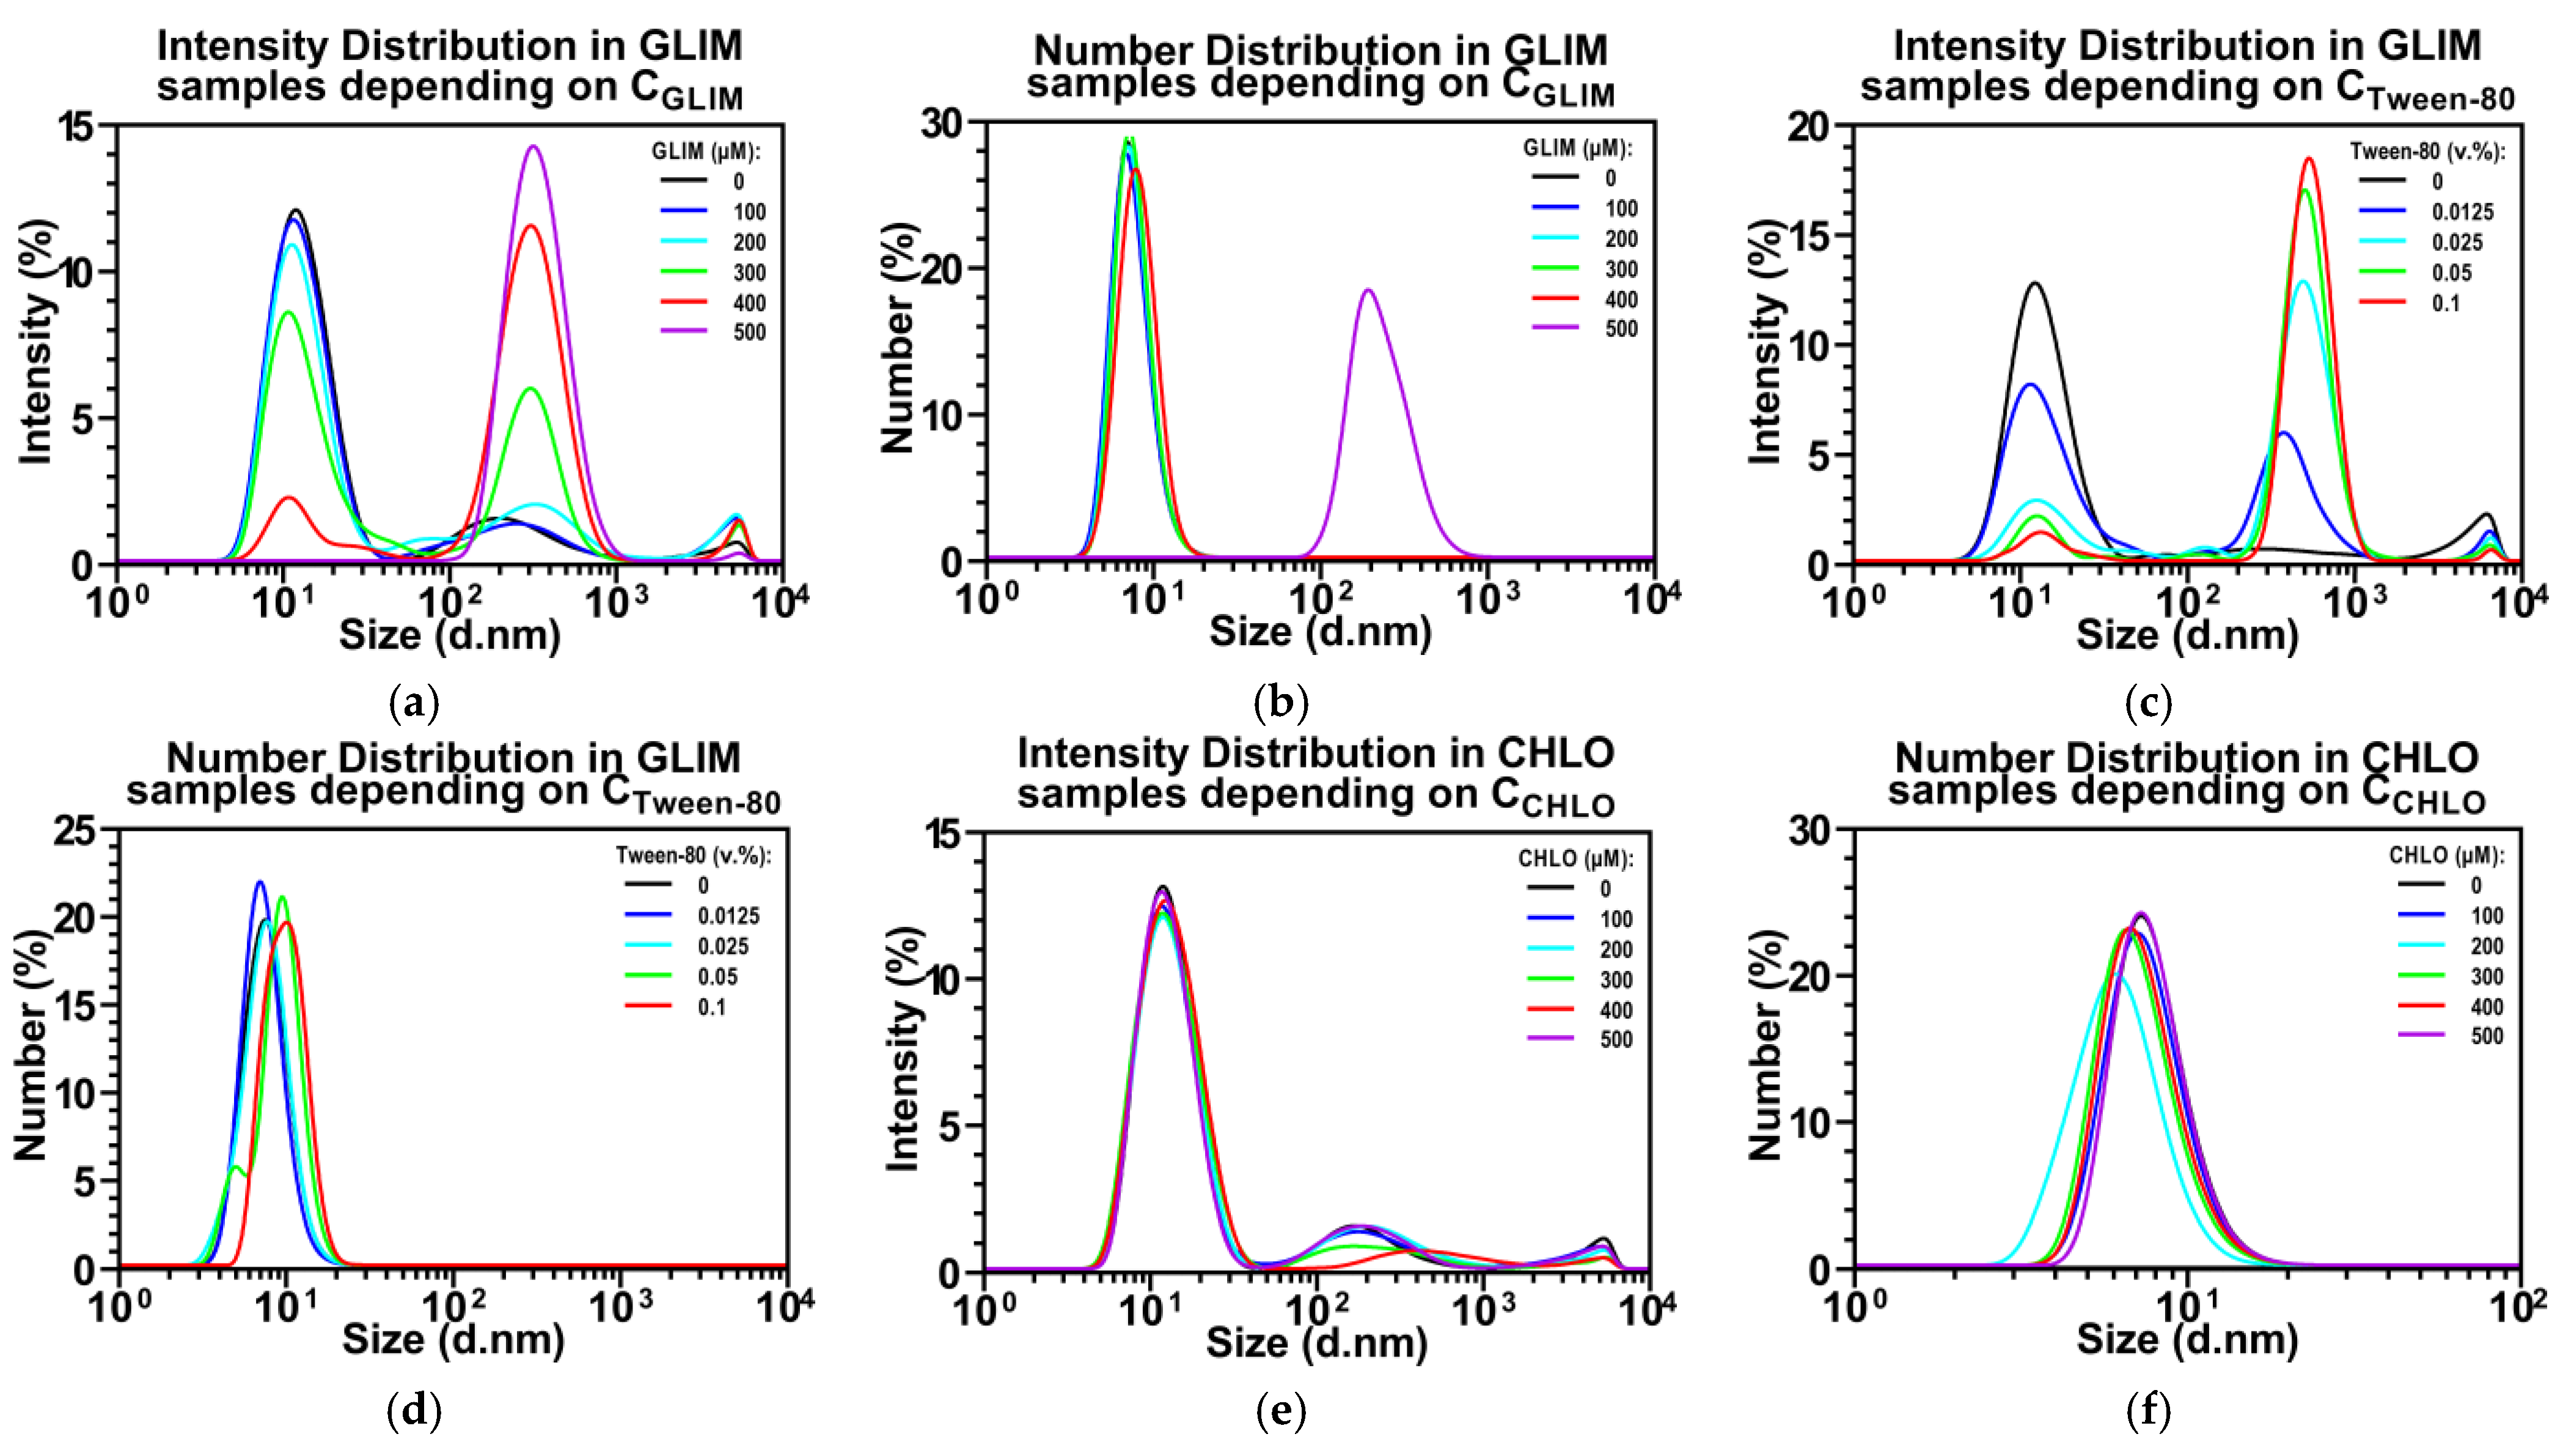
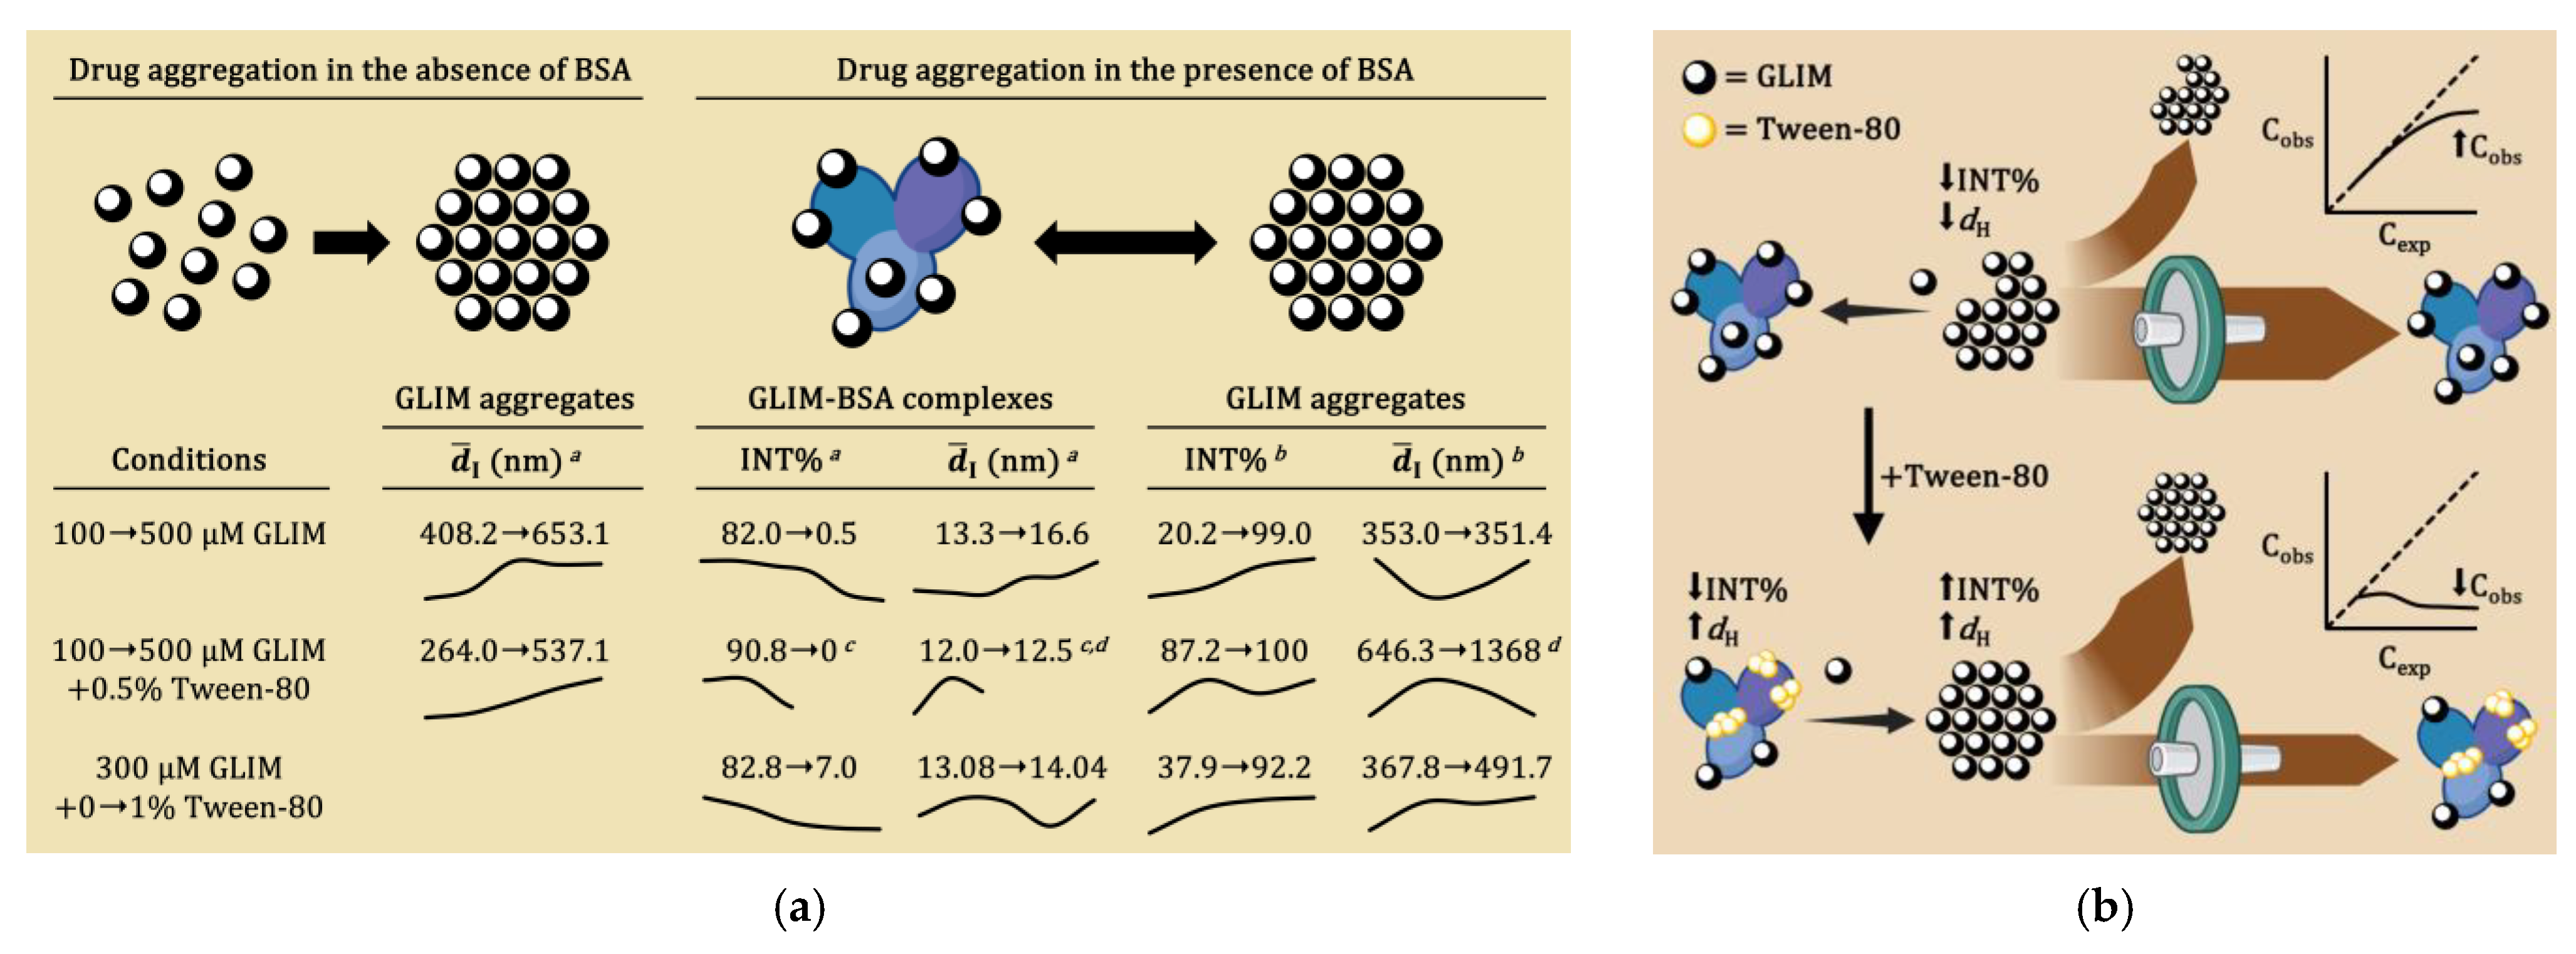
2.1. Effect of Tween-80 on Sulfonylurea Solubility

As noted by Hendriks et al., the interpretation of in vitro results on the anticancer activity of SUs is often complicated by several factors [37]. First, SUs tend to bind to proteins in the cell medium, which can result in lower free drug concentrations at the target site than reported. Second, the in vitro concentrations of SUs are often relatively high compared to the therapeutic concentrations achievable in patients’ serum. In addition, second-generation SUs can form colloidal aggregates in vitro, even at low micromolar ranges, due to their limited solubility. Shoichet’s team observed a significant reduction in the anticancer activity of many drugs when they were in colloidal form compared to their free form [38]. However, they also found that adding small amounts of non-ionic surfactants, such as Tween-80, to the cell medium can effectively disrupt the formation of large drug aggregates. This, in turn, can increase cell exposure to the drug and restore its activity.
Figure S2 in the Supplementary Materials presents literature data on the solubility of SUs and their binding affinity for human serum albumin (HSA) [39,40,41,42,43,44,45,46,47,48,49,50,51,52,53,54,55,56,57,58,59,60,61,62,63,64,65,66,67,68,69,70,71]. The data indicate that second-generation SUs have a higher binding affinity for HSA than first-generation SUs, but they are significantly less soluble. Given the similarity in size and shape between human and bovine serum albumins (BSA), it is likely that SUs will also bind to BSA in a similar manner. Indeed, Proks et al. demonstrated that high concentrations of BSA in the cell medium dramatically reduced GLIB’s ability to block KATP channels, while only moderately affecting the inhibitory effect of gliclazide (GLIC) [72]. This difference was attributed to the stronger binding of GLIB to BSA ( K d = 0.67 × 10⁻⁶ M) compared to GLIC ( K d = 1.55 × 10⁻⁴ M), resulting in a significant decrease in the concentration of free GLIB in the presence of BSA. This phenomenon could potentially cause false-negative results in in vitro studies, including our screening for synergistic effects.
With this in mind, we investigated the behavior of selected SUs when mixed with 4.5 mg/mL BSA (corresponding to the protein level in our cell medium) and varying amounts of Tween-80. Figure 1 illustrates how the particle size distribution changes with different mixture compositions. Literature reports that at low concentrations (<10 mg/mL), BSA primarily exists as monomers with an intensity-weighted mean hydrodynamic diameter ( d ¯ I ) of 10.5 nm [73], or a number-weighted mean hydrodynamic diameter ( d ¯ N ) of 7.8 nm [74]. In our study, we found a d ¯ I of 13.1 nm for BSA, with some larger agglomerates measuring 256.6 nm (Figure 1a). However, the number distribution showed a d ¯ N of 7.38 nm, indicating the presence of BSA monomers (Figure 1b). The larger agglomerates did not appear in the number distribution, indicating that they represent a negligible percentage of the sample.
Figure 1a shows that as the concentration of GLIM increases, the intensity of the BSA particles gradually decreases, while their d ¯ I increases from 13.01 nm to 16.59 nm. This increase in BSA size is likely due to protein unfolding upon interacting with multiple drug molecules. We observed the onset of BSA saturation with drug molecules at the expected GLIM concentration (Cexp) of 200 µM. Beyond this concentration, the amount of free GLIM in the sample exceeds the critical aggregation concentration, leading to the formation of a distinct fraction of drug aggregates with a d ¯ I of approx. 353 nm. As the GLIM concentration continues to rise, more drug aggregates are formed, eventually causing the BSA particles to disappear from the intensity distribution. A similar trend is observed in the number distribution (Figure 1b).
Figure 2a shows that after centrifugation of samples containing only GLIM (blue ▶), the observed concentration (Cobs) of the drug matches the expected concentration up to 100 µM. However, when this threshold is exceeded, Cobs drops to approx. 5 µM. Since the size of the drug aggregates remains relatively constant between 100 and 500 µM (Figure S3), the decrease in Cobs is likely due to the sedimentation of large clumps of precipitated drug that may be overlooked by DLS or considered artifacts. Using syringe filters with a 0.22 µm pore size to remove these aggregates stabilizes Cobs within the 8.6–16.6 µM range across all tested samples (Figure 2b).
In the presence of BSA (red ▲), solutions containing high concentrations of GLIM that were previously turbid become clear, and Cobs increases significantly (Figure 2a). We attribute these changes to the formation of drug–protein complexes that reduce the amount of free GLIM and limit its aggregation. These small-sized complexes remain suspended in the supernatant, which is then used for HPLC analysis, resulting in a higher observed Cobs. When we used 0.22 µm syringe filters, the resulting Cobs values were similar to those obtained from centrifuged samples (Figure 2b), probably due to minimal removal of BSA by the filters. HPLC results indicate that about 95% of the BSA particles pass through the 0.22 µm filter together with bound drug molecules (Figure S6). At a Cexp of 200 µM, BSA begins to saturate with drug molecules, leading to a gradual deviation between Cexp and Cobs (Figure 1a).
Increasing the concentration of Tween-80 results in a higher intensity of the drug particles (Figure 1c) and a larger diameter of the BSA fraction (Figure 1d). The presence of Tween-80 in samples containing BSA (purple ▼) significantly reduces Cobs values at Cexp above 100 µM, regardless of the filtration method used. These observations suggest that Tween-80 reduces the binding of GLIM molecules to BSA, causing the unbound drug molecules to rapidly form large aggregates. This aligns with literature reports indicating that surfactants can induce partial protein unfolding and disrupt drug–protein interactions [75,76,77]. Such effects should be carefully considered when interpreting in vitro results, as they may impact the observed activity of tightly binding drugs.
Ultrafiltration using a 3 kDa molecular weight cut-off (MWCO) membrane significantly reduces the Cobs of GLIM in samples containing BSA (Figure 2c). This is because the 3 kDa membrane removes approx. 97% of BSA particles, including those bound to drug molecules and large drug aggregates (Figure S6). Interestingly, ultrafiltration with a 10 kDa membrane (Figure 2d) also effectively removes BSA particles (Figure S6), but results in much higher Cobs of GLIM in BSA-containing samples. Given the consistently low Cobs levels in BSA-free samples filtered with both membranes, we suggest that the higher Cobs observed with the 10 kDa membrane in BSA-containing samples are due to larger drug–protein complexes passing through the membrane, carrying more drug molecules. The addition of Tween-80 to BSA-containing samples dramatically reduces the Cobs of GLIM without significantly altering the amount of BSA in the filtrate (Figure S6). This reduction in Cobs is not seen in BSA-free samples; instead, adding Tween-80 (cyan ◀) slightly increases Cobs after ultrafiltration, likely because Tween-80 partially reduces the size of aggregates.
For comparison, we performed DLS analysis on chlorpropamide (CHLO), a first-generation SU with better solubility (1.0 mM vs. 12.2 µM) but lower binding affinity to HSA compared to GLIM ( n K a = 0.62 × 10⁵ vs. 9.1 × 10⁵ M−1). Increasing the concentration of CHLO did not affect the intensity of the BSA particles or result in the formation of drug aggregates, as indicated by size distribution histograms (Figure 1e,f). The addition of Tween-80 also did not affect the concentration of free CHLO in the presence of BSA (Figure 2e,f). Furthermore, no differences between Cexp and Cobs were observed in BSA-free samples, regardless of the filtration method or the presence of surfactant (Figure 2e,f). These results suggest that Tween-80 has a less competitive effect on CHLO binding than on second-generation GLIM and that unbound CHLO molecules do not form aggregates, even at relatively high concentrations.
In summary, at high drug concentrations, multiple GLIM molecules can bind to BSA, reducing aggregate formation and increasing Cobs in samples filtered by methods that allow small drug–protein complexes to pass through. In the absence of BSA, GLIM readily forms large aggregates with diameters over 300 nm. The addition of Tween-80 significantly reduces the size of these aggregates in both the absence and presence of BSA, potentially enhancing drug uptake by cells. However, Tween-80 may also reduce the number of drug molecules bound to BSA, increasing the concentration of free drug molecules and potentially promoting the formation of aggregates not observed in surfactant-free samples. Since the effects of these phenomena on the biological activity of SUs is currently unknown, our next step is to investigate how Tween-80 affects cell viability and the activity of co-administered drugs.

2.2. Effect of Tween-80 on Drug-Induced Cytotoxicity

Recent studies suggest that the increased cytotoxicity of poorly soluble drugs in the presence of surfactants may result from enhanced drug solubility, disruption of large drug aggregates, or increased drug uptake by cells [78,79,80,81]. Additionally, some surfactants may increase the sensitivity of cancer cells to cytostatic drugs. For example, Tween-80 has been shown to increase the uptake of epirubicin, a structural analog of doxorubicin, by enhancing cell permeability and reducing its excretion by inhibiting P-gp activity [82].
Before examining how Tween-80 affects the cytotoxicity of co-administered drugs, we first evaluated its own impact on cancer cell survival, as high levels of surfactants can also exhibit cytotoxic effects. As shown in Figure 3a, Tween-80 significantly reduced the survival of MCF-7 cells at concentrations above 0.05% (v/v). Therefore, we limited our cell studies to this concentration range.
Figure 3b shows that co-administration of Tween-80 increases the cytotoxicity of second-generation GLIM in a dose-dependent manner, while having no significant effect on first-generation CHLO. The 24.6% decrease in cell viability observed with GLIM in the presence of 0.05% Tween-80 may be due to the disruption of its binding to BSA and the breakdown of large drug aggregates. In contrast, the lack of a similar effect on CHLO could be explained by its higher solubility and the minimal impact of Tween-80 on its interaction with BSA. Interestingly, CHLO significantly reduced the cytotoxicity of Tween-80 alone but did not affect the cytotoxicity of the GLIM + CHLO combination, which remained comparable to that of GLIM alone. This suggests that the cytoprotective effects of CHLO are primarily mediated through cellular mechanisms rather than interactions with surfactant molecules in the culture medium.
Figure 3b demonstrates that Tween-80 also enhances the cytotoxicity of DOXO in a dose-dependent manner, reducing MCF-7 cell viability by an additional 12.6% at a concentration of 0.05% Tween-80. Similar effects were observed for the DOXO + GLIM and DOXO + CHLO combinations, although these effects were less pronounced compared to GLIM alone. The increased cytotoxicity of drug combinations with Tween-80 can be partly attributed to the surfactant’s ability to prevent drug binding to BSA, which would otherwise diminish their activity (as observed with GLIM), and its potential influence on DOXO metabolism in cancer cells. Notably, both DOXO + GLIM and DOXO + CHLO exhibited greater cytotoxicity than their respective single agents, regardless of the presence of Tween-80. This suggests that the increased cytotoxicity is likely due to a synergistic interaction between the drugs themselves rather than the influence of the surfactant.
Although the exact mechanisms of the surfactant’s effects remain unclear and warrant further investigation, we believe that incorporating Tween-80 can improve the assessment of cytotoxicity and the potential synergistic effects of SUs by minimizing the likelihood of false-negative results in screening studies. Encouraged by these observations, we have decided to maintain 0.05% Tween-80 in the culture media for subsequent experiments.

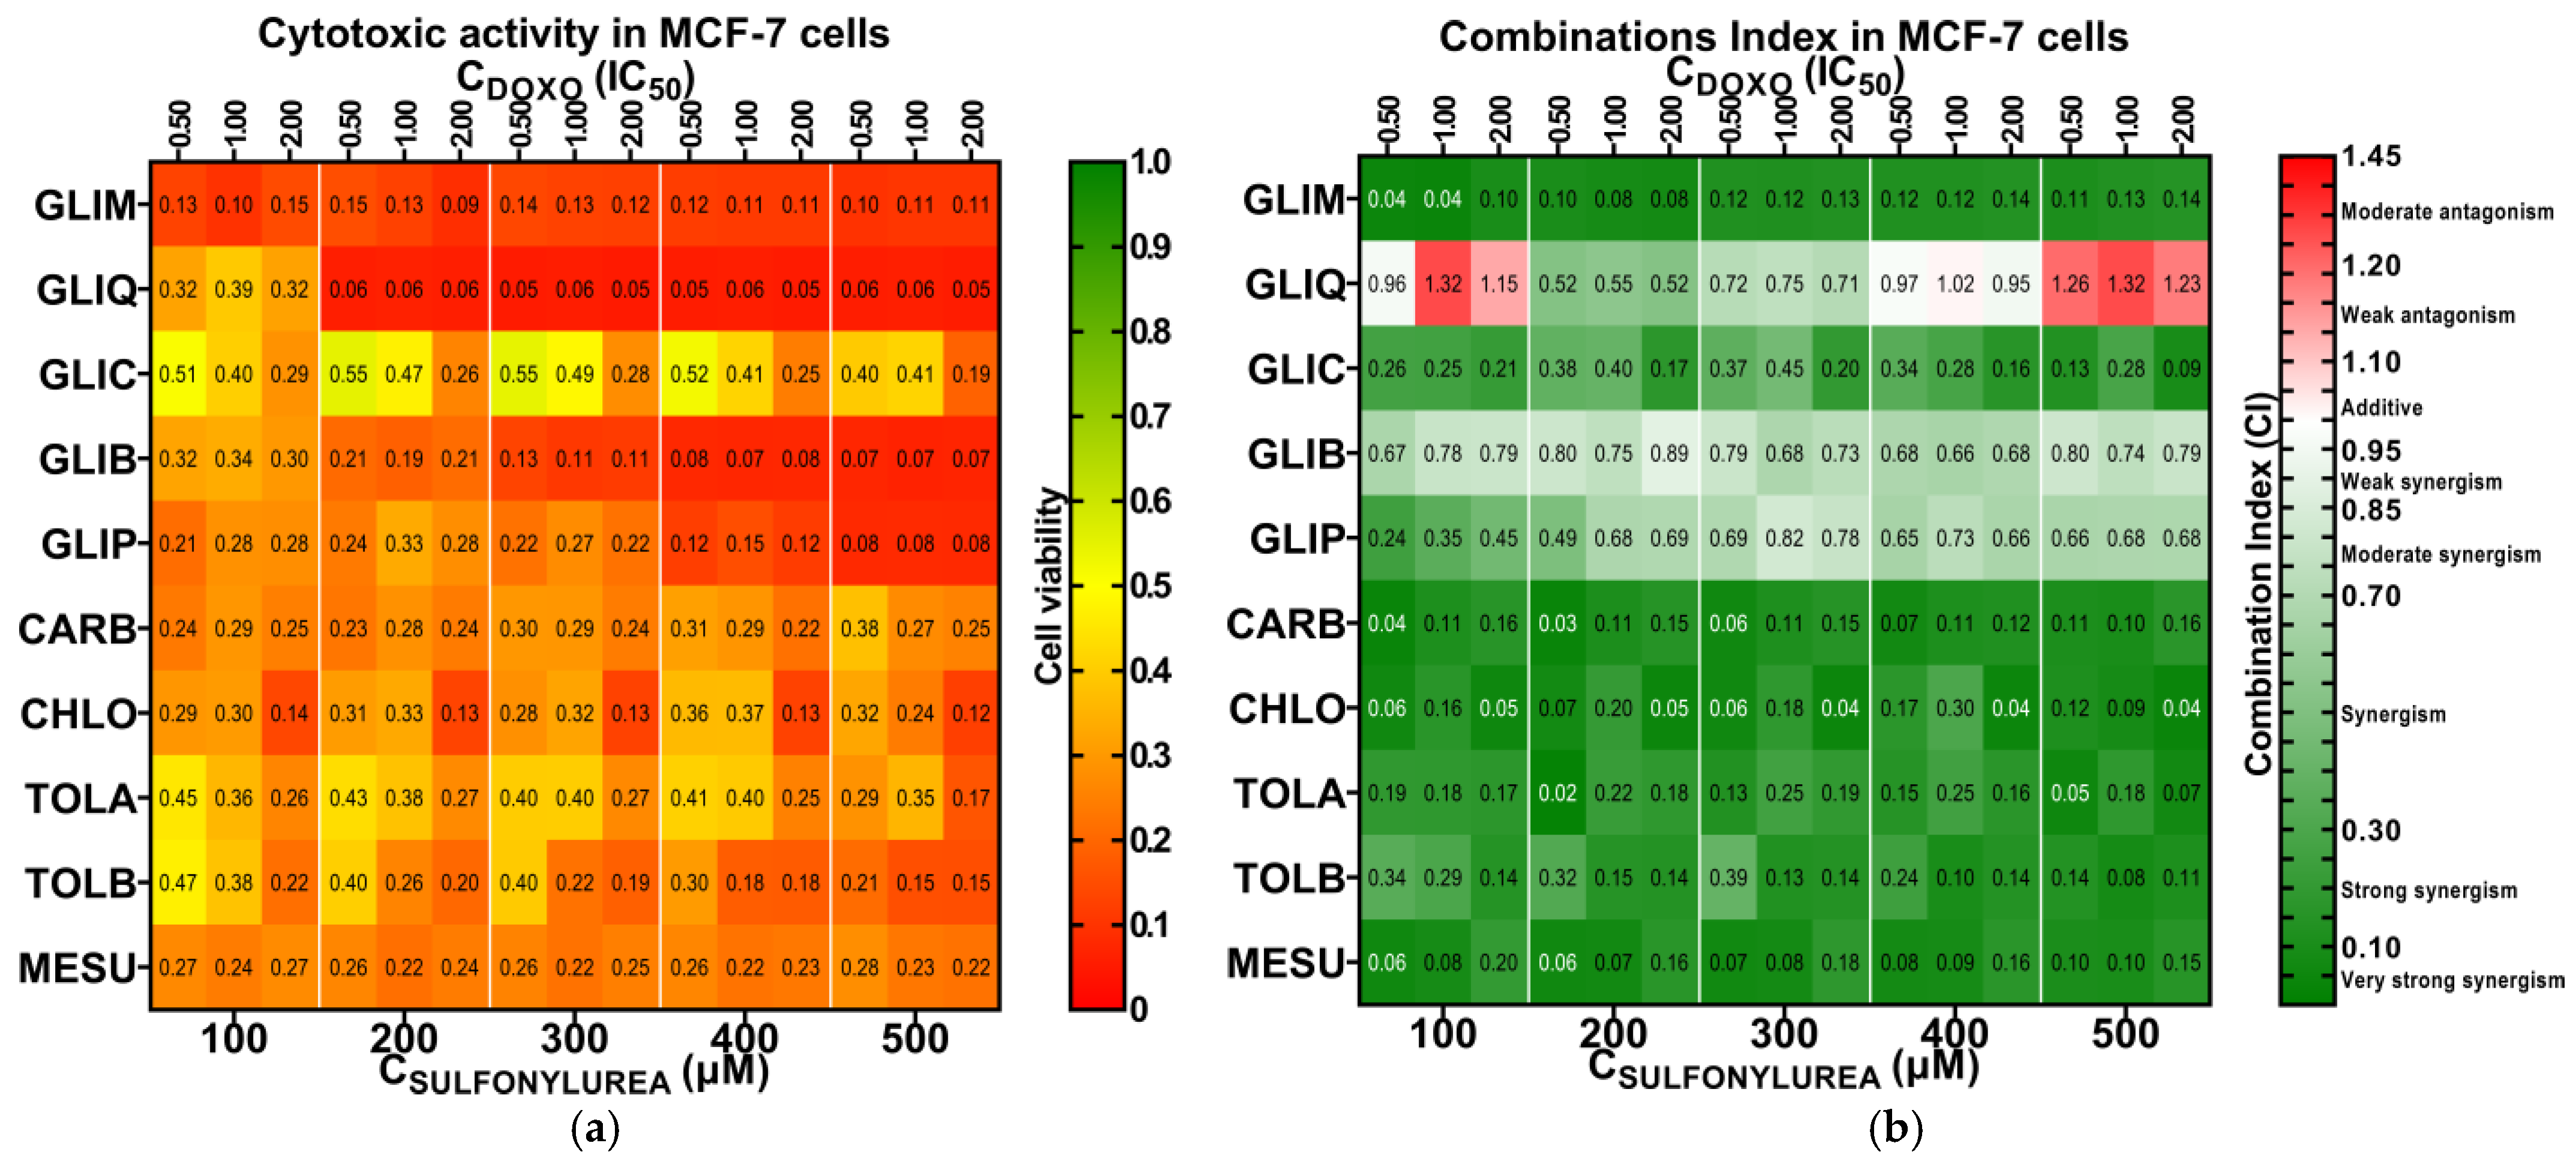
2.3. Preliminary Screening for Cytotoxic Synergy

Before studying the synergistic cytotoxic effects, we first evaluated the stability of SUs and their mixtures. We monitored their concentrations in equimolar mixtures with DOXO by incubating them in PBS (pH 7.4) at 37 °C for 7 to 14 days. Most SUs demonstrated high stability under these conditions, and no new adducts were detected in any of the samples. The only exceptions were gliclazide (GLIC) and tolazamide (TOLA), which exhibited slow but noticeable degradation. This finding is consistent with literature data suggesting that these two SUs may degrade over time [83,84]. However, the degradation rates were low enough that they are unlikely to significantly impact the in vitro studies. Detailed results and conclusions from the stability studies can be found in the Supplementary Materials (Figure S7).
Existing literature provides limited data on the cytotoxicity of SUs, focusing mainly on their impact on breast cancer cells. Alkhalil et al. showed that GLIM, GLIB, and GLIP exhibited relatively low cytotoxicity against MCF-7 cells, with IC50 values ranging from 216.3 to 325.2 µM [10]. Another study reported an IC50 = 50 µM for GLIM against MCF-7 cells [13]. Based on the results of Faridi et al., we calculated an IC50 = 79.8 µM for GLIM against MCF-7 cells [26]. Overall, SUs can be considered safe drugs with low toxicity, as reflected in their minimal in vitro cytotoxicity.
We first determined the IC50 values for all tested compounds after 72 h of incubation with MCF-7 cells. Detailed results and the response curves used to calculate the IC50 values are provided in the Supplementary Materials (Figure S8). The IC50 values obtained are summarized in Table 1. The IC50 value for DOXO treatment alone was determined to be 0.46 µM. Most SUs did not achieve IC50 values below 500 µM or achieved values close to this level. The highest cytotoxicity was observed with second-generation SUs, particularly GLIM and gliquidone (GLIQ).
We then examined the response of MCF-7 cells to combinations of DOXO and SUs using the Chou–Talalay method [85]. This method calculates the combination index (CI) for two drugs as follows:
CI = ( D ) 1 ( D x ) 1 + ( D ) 2 ( D x ) 2
where (Dx)1 and (Dx)2 are the doses of each drug required alone to achieve an x% effect, while (D)1 and (D)2 are the doses of the drugs when used together to achieve the same effect.
Figure 4a shows the fraction of viable cells relative to untreated controls, while Figure 4b illustrates the synergistic effects based on the Chou–Talalay method. A comparison of these two figures reveals that combination treatments generally result in increased cytotoxicity compared to single treatments (i.e., treatment involving only one drug), often accompanied by significant synergistic effects. Looking at the survival heat map (Figure 4a) from left to right, we observe that increasing the concentration of both drugs typically leads to a dose-dependent decrease in MCF-7 cell survival. In general, combinations of DOXO with second-generation SUs exhibited higher cytotoxicity than those with first-generation SUs, consistent with the differences in cytotoxicity observed between the SU generations (Table 1). The most pronounced cytotoxic effects in MCF-7 cells were observed with the DOXO + GLIM and DOXO + GLIQ combinations, which reduced cell viability to approx. 11% and 5%, respectively.
When analyzing the synergy heat map (Figure 4b) from top to bottom, we notice that first-generation SUs show very strong synergy with DOXO, as reflected by consistently low average combination index ( C I ¯ ) values. The strongest synergies were observed for DOXO + CARB ( C I ¯ = 0.10), DOXO + CHLO ( C I ¯ = 0.11), and DOXO + MESU ( C I ¯ = 0.11), followed by DOXO + TOLA ( C I ¯ = 0.16) and DOXO + TOLB ( C I ¯ = 0.19). In contrast, second-generation SUs generally showed moderate synergy with DOXO, with some combinations even displaying antagonistic effects. The exception was the DOXO + GLIM combination, which showed strong synergy ( C I ¯ = 0.11). Other second-generation combinations, such as DOXO + GLIC ( C I ¯ = 0.25), DOXO + GLIP ( C I ¯ = 0.65), DOXO + GLIB ( C I ¯ = 0.75), and DOXO + GLIQ ( C I ¯ = 0.93), exhibited weaker synergy. The strong synergy observed with first-generation SUs can likely be attributed to their ability to significantly enhance the cytotoxicity of DOXO relative to their own minimal activity, resulting in very low CI values. In contrast, second-generation SUs, which are more cytotoxic on their own, yield higher CI values when combined with DOXO, thus displaying weaker synergy.
We selected GLIM, GLIQ, and CHLO for further studies due to their diverse effects. GLIM alone exhibited low cytotoxicity in MCF-7 cells (IC50 = 186.2 μM), but its combination with DOXO resulted in strong synergy ( C I ¯ = 0.11) and significant cytotoxicity. In contrast, the DOXO + GLIQ combination effectively reduced MCF-7 cell viability but primarily showed additive to moderately antagonistic effects ( C I ¯ = 0.93). The DOXO + CHLO combination also showed strong synergy ( C I ¯ = 0.11), despite CHLO being cytotoxically inactive in MCF-7 cells (IC50 > 500 μM).

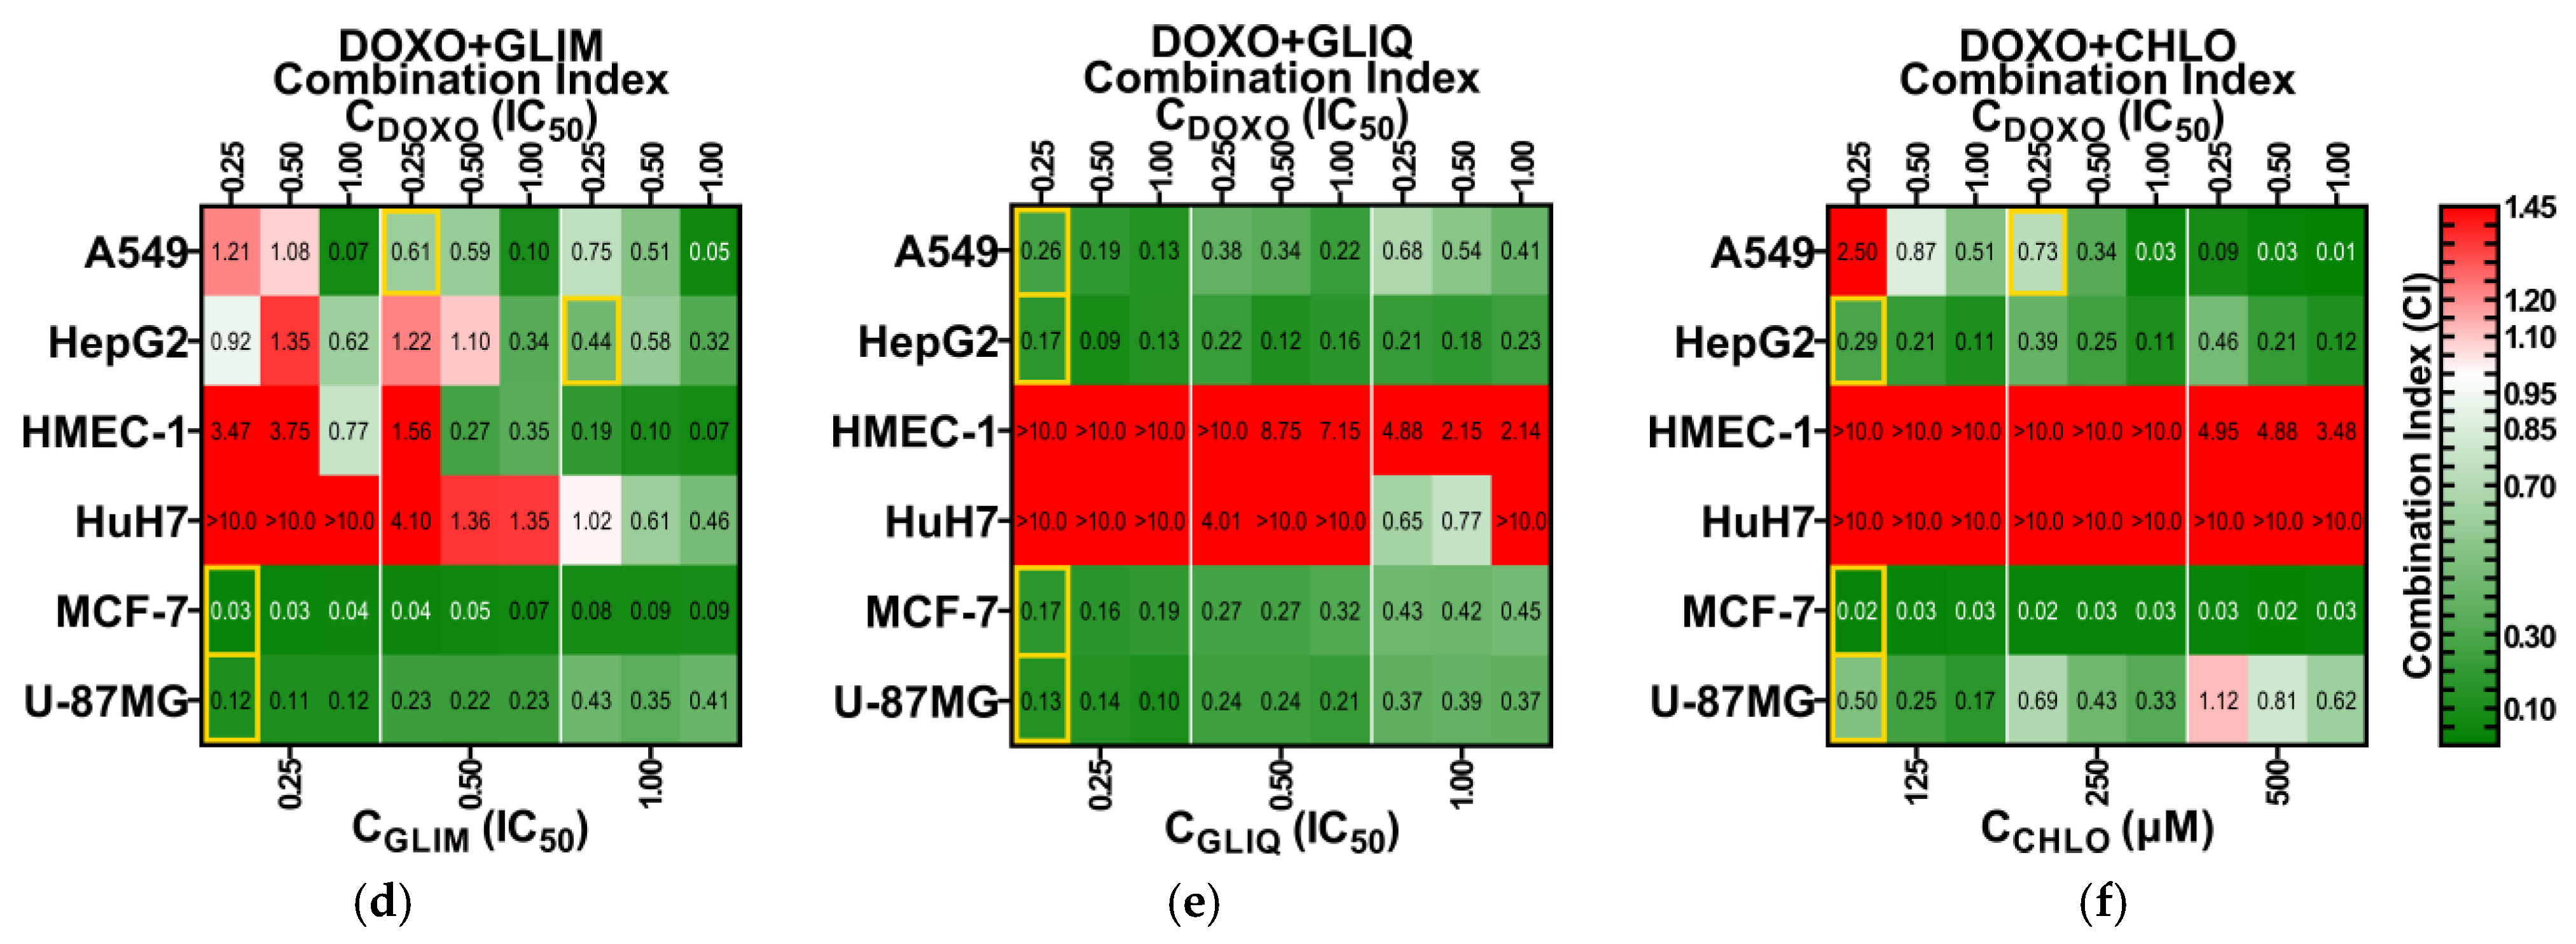
2.4. Expanded Screening of Selected Drug Combinations

In the second phase of our cytotoxicity synergy assessment, we used the same approach as in the initial study but administered lower doses of the drugs, corresponding to fractions of their IC50 values. The results of MTT assays on a panel of cell lines (Figure 5a–c) showed a predominant dose-dependent decrease in cell viability with increasing concentrations of both drugs. Combined treatment typically resulted in a synergistic increase in cytotoxicity compared to DOXO monotherapy (Figure S13), as indicated by low CI values on synergy heat maps (Figure 5d–f). Based on these values, we identified cells (highlighted in yellow) that represent the most effective combination treatments. These combinations correspond to the lowest doses of drugs that show synergistic cytotoxicity in their respective cell lines. Among these, the MCF-7 cell line showed exceptional sensitivity to the DOXO + GLIM combination. Specifically, administration of ¼ IC50 DOXO (0.12 µM) and ¼ IC50 GLIM (45.1 µM) resulted in a 4.4-fold improvement in cytotoxicity, reducing MCF-7 cell viability to 16.0% compared to 70.2% for DOXO alone (Figure S13).
When analyzing the heat maps from top to bottom, we observe diverse responses of cell lines to different drug combinations and doses. In some cases, these combinations proved to be ineffective or even antagonistic. Such opposing effects were particularly evident in HuH7 cells, where combination treatments led to a significant increase in proliferation compared to untreated controls. Cytoprotective effects of SUs were also observed in non-cancerous HMEC-1 cells, as a partial reduction in DOXO cytotoxicity resulted in a smaller decrease in proliferation compared to DOXO monotherapy. These varied cellular responses to identical combination treatments underscore the complexity and challenges in developing effective combination therapies that incorporate SUs.

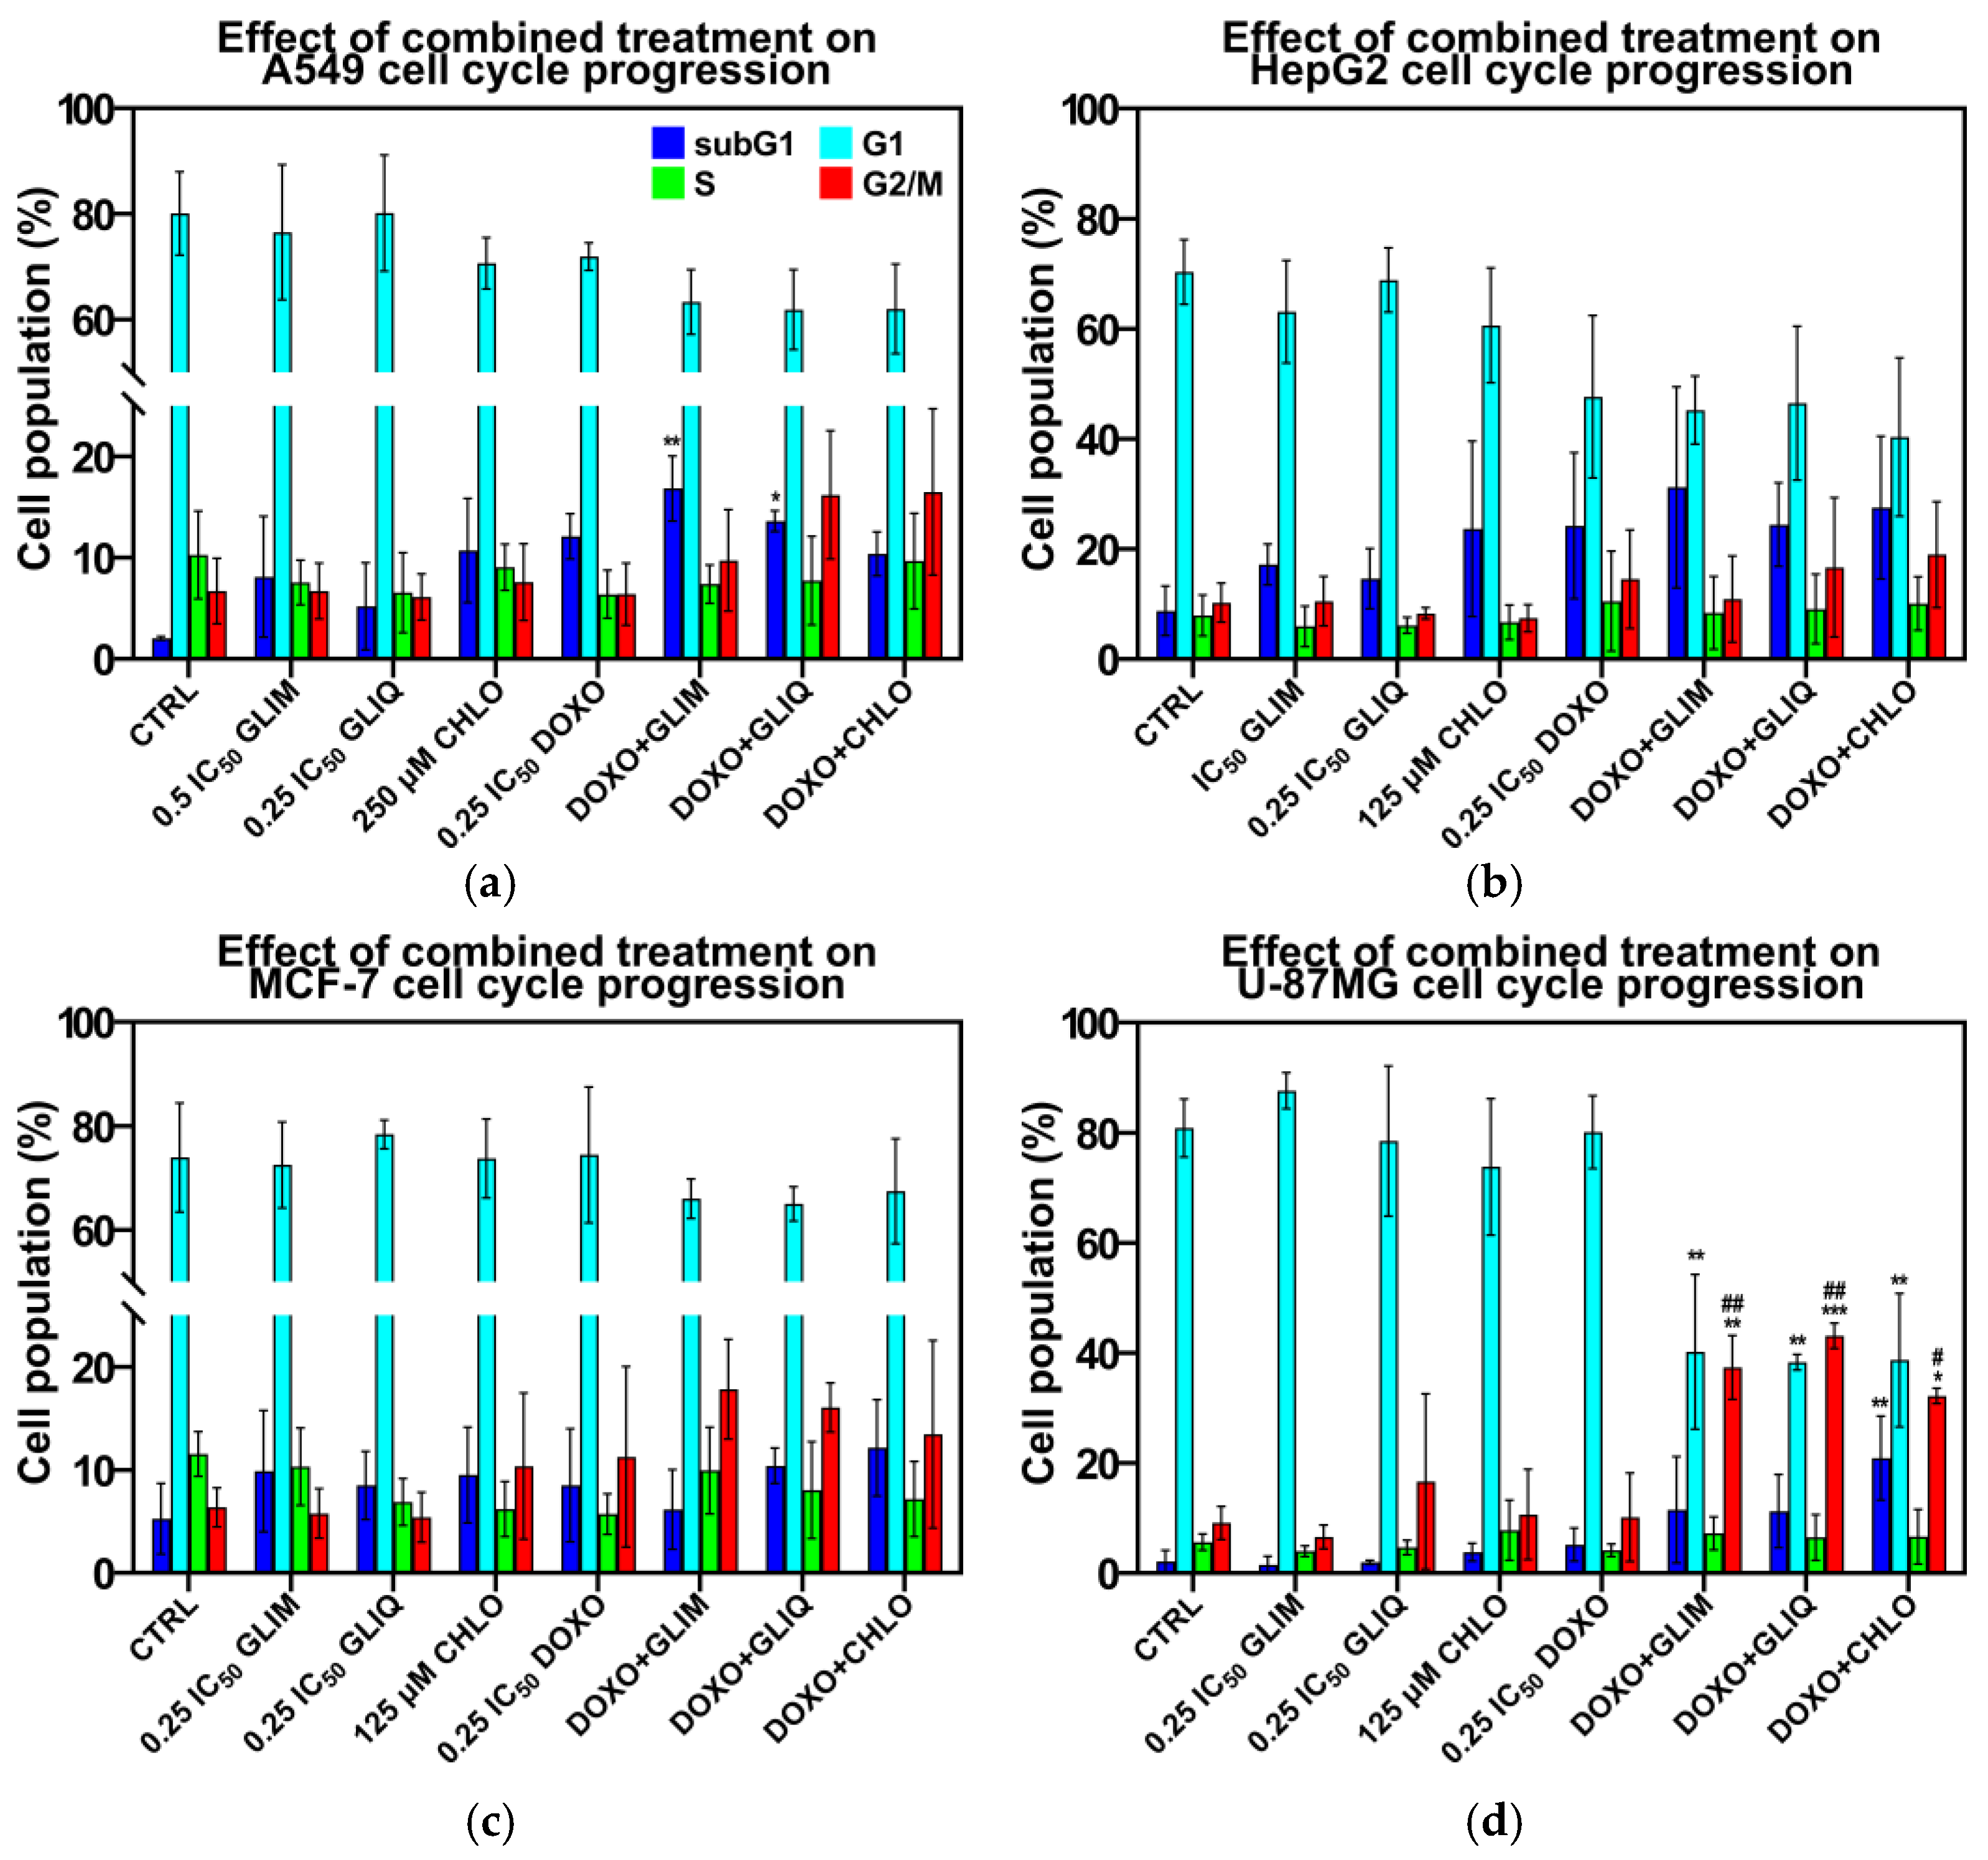
2.5. Effect of Combined Treatment on Cell Cycle Progression

Combined treatments with DOXO and SUs can inhibit cell growth by affecting specific cellular processes. To better understand these effects, we performed flow cytometry studies on the most effective combinations previously identified (highlighted in yellow in Figure 5d–f). Figure 6a–d show the cell cycle distribution after 72 h of treatment with these regimens.
In general, the combined treatments had a more pronounced effect on cell cycle arrest, particularly in the subG1 and G2/M phases, compared to single treatments with either DOXO or SUs. In the U-87MG cell line, the combined treatments significantly increased the population of cells in the G2/M phase, from 9.1% in the control to 32.2–43.1%, and the population in the subG1 phase, from 2.1% in the control to 11.5–20.9%. Similar effects were observed in the MCF-7 and A549 cell lines, where combined treatments induced a strong G2/M arrest and an even more pronounced increase in the subG1 phase population. However, the increase in the subG1 phase was less pronounced than the sum of the effects of single treatments. In HepG2 cells, combined treatments resulted in a less pronounced G2/M arrest compared to other cell lines, but caused a significant increase in the subG1 phase population, from 8.8% in control to 24.4–31.2%.
Cell cycle arrest in the G2/M phase may indicate an apoptotic mode of cell death, while the consistency of these effects across different cell lines suggests a potential common mechanism behind the synergy of DOXO and SUs. However, this mechanism remains uncertain and requires further investigation. The effects observed for SUs in our study are similar to those reported for structurally related diarylsulfonylureas, which have demonstrated antiproliferative effects by inhibiting tubulin polymerization and causing cell cycle arrest at the G2/M phase [86].

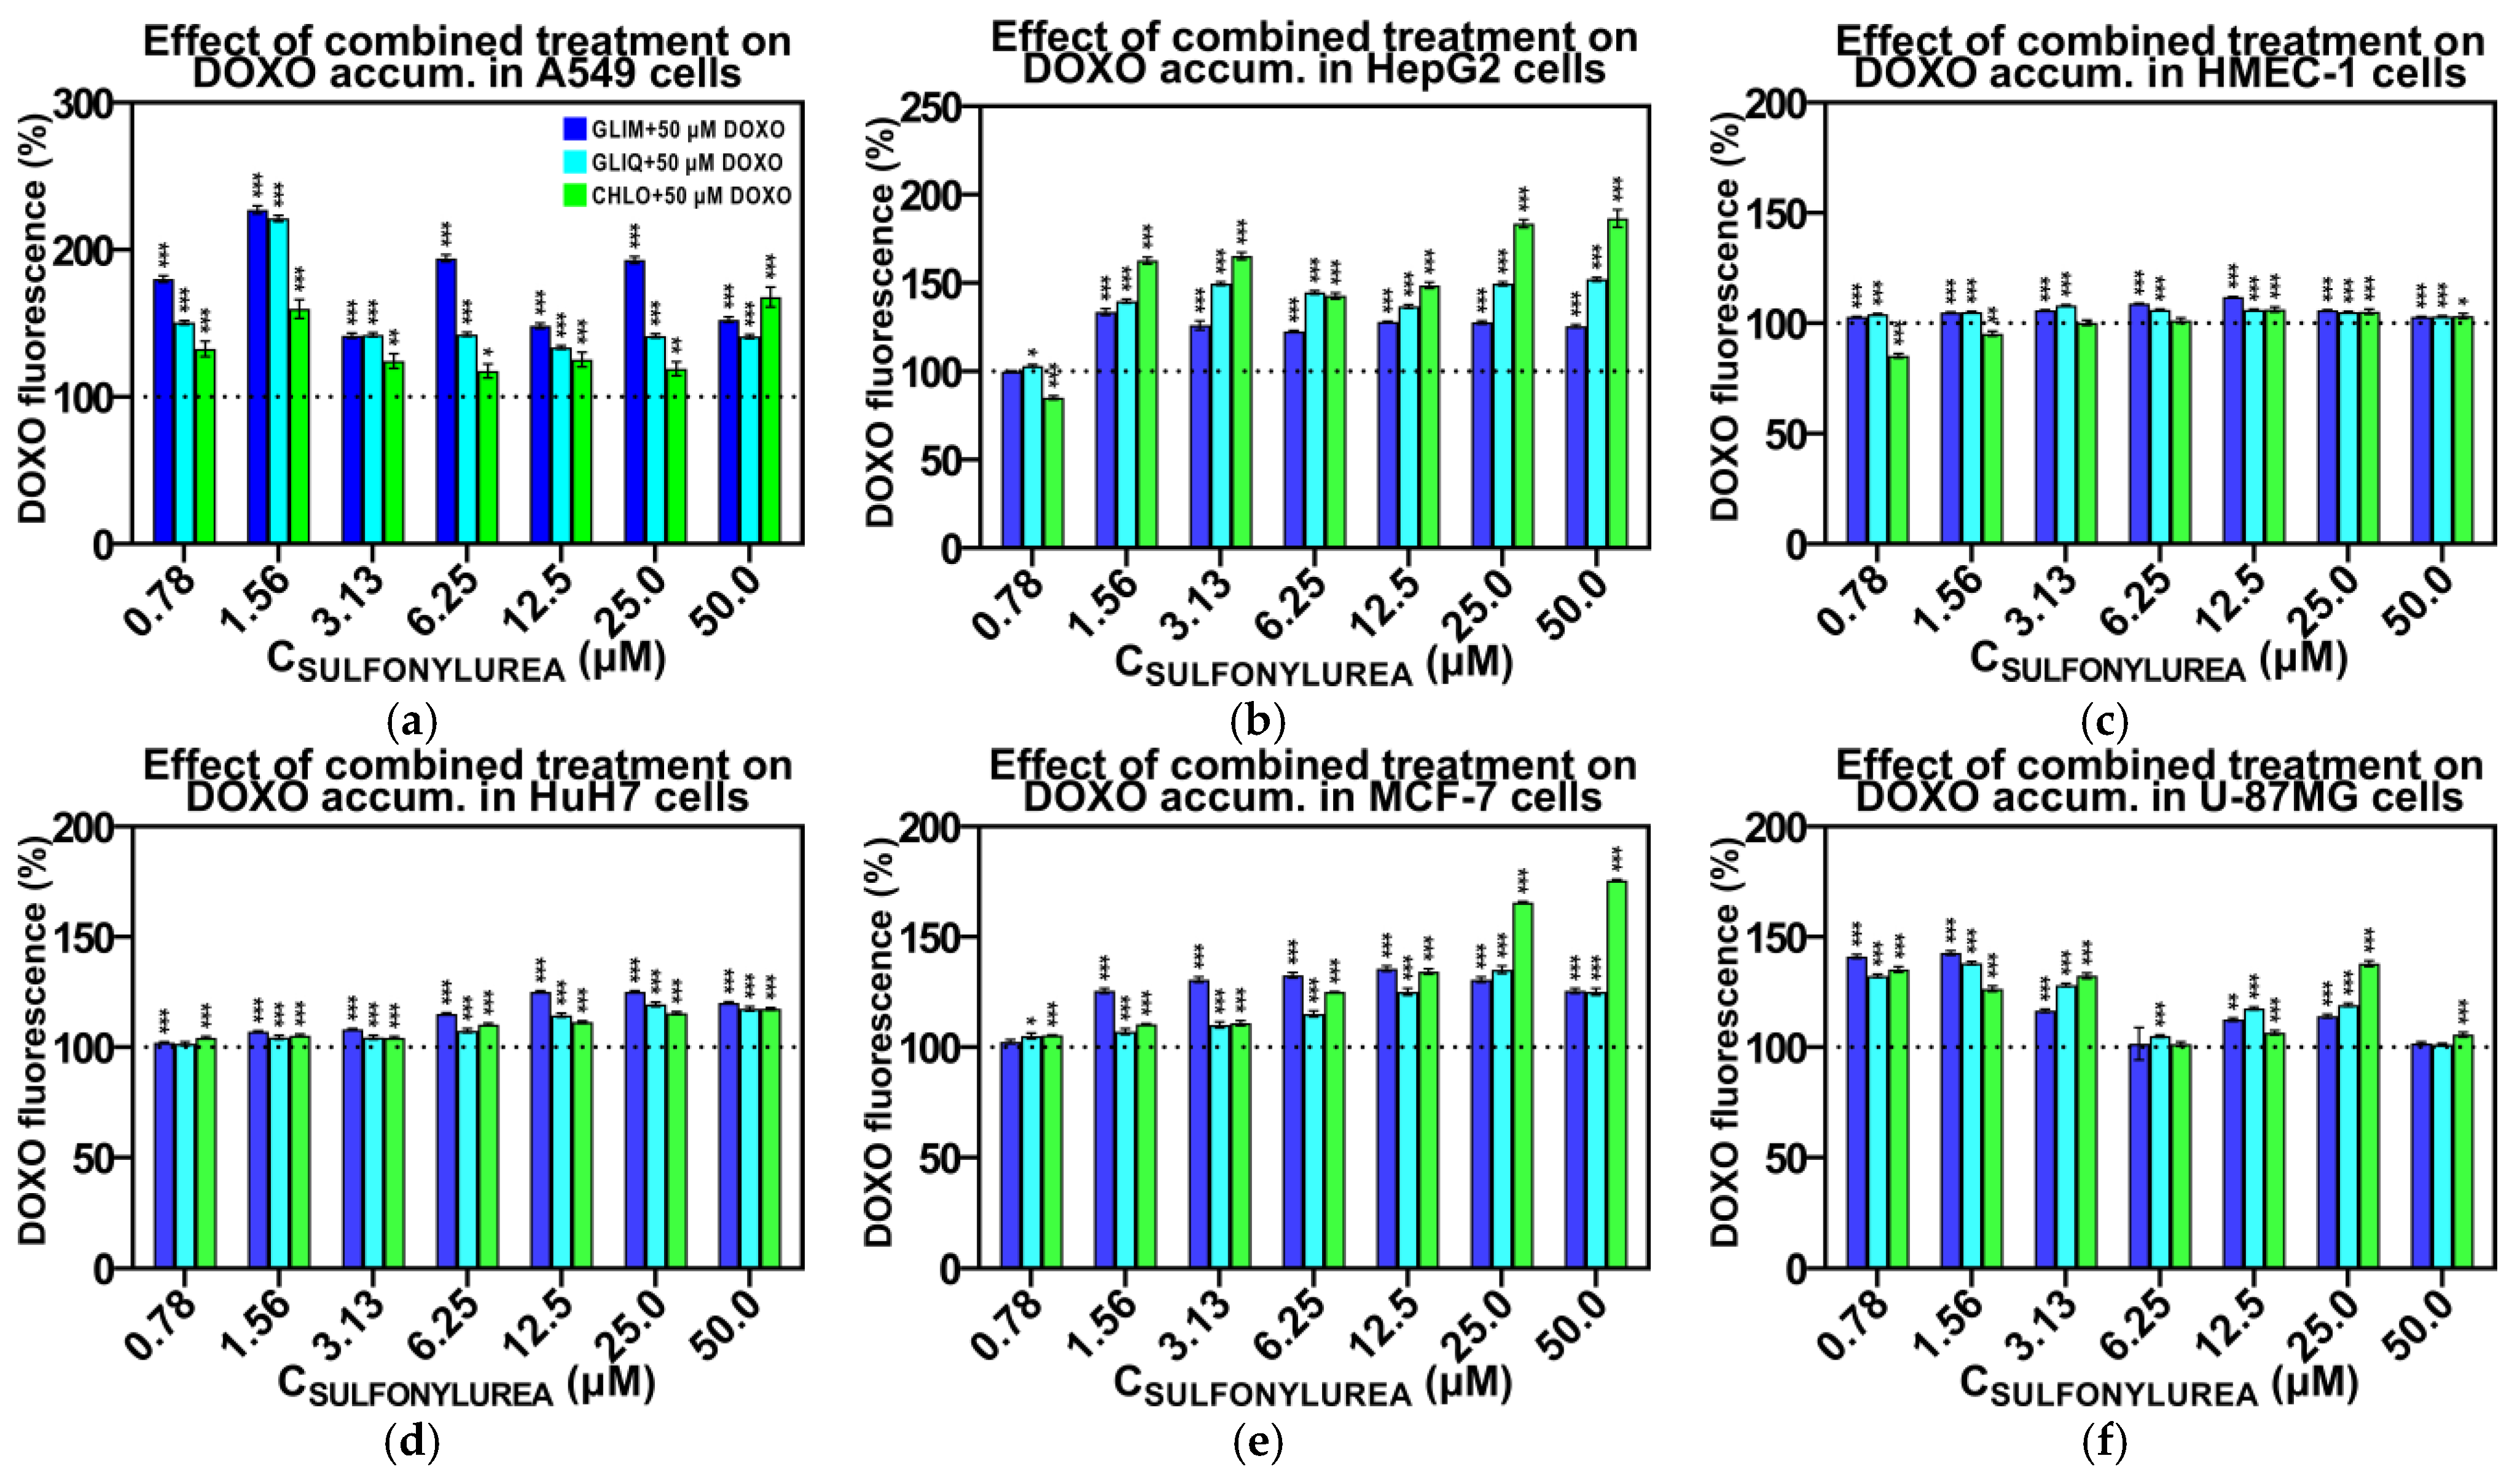
2.6. Effect of Combined Treatment on Doxorubicin Accumulation

Previous studies indicate that GLIB may act as a general inhibitor of ABC transporters, potentially leading to increased accumulation of anticancer drugs [23,24]. Payen et al. observed that GLIB induced a dose-dependent increase in the intracellular accumulation of calcein, an MRP1 substrate, at concentrations as low as 3.12 µM [24]. However, this effect was not observed with all SUs. For example, TOLB did not increase calcein accumulation, even at concentrations as high as 500 µM. This suggests that the inhibitory effect of SUs may depend on specific structural features of each drug, rather than being a general trait of all SUs. To determine if the differences in synergistic effects observed in our studies were related to increased DOXO accumulation, we tested the effect of various concentrations of GLIM, GLIQ, and CHLO on DOXO accumulation in whole-cell assays.
Figure 7a–f show that the co-administration of SUs significantly increased DOXO levels in the synergistic cell lines A549, HepG2, MCF-7, and U-87MG. However, no similar effect was observed in the antagonistic cell lines HMEC-1 and HuH7. Interestingly, the effect of DOXO accumulation in sensitive cell lines was consistent for different SUs and started at relatively low concentrations of 0.78–1.56 µM, similar to those found in patients’ blood samples (Figure S2). Higher doses of SUs did not further increase DOXO accumulation. On average, DOXO accumulation in the sensitive cell lines increased by 120–150%. In some cases, the effects were even more pronounced—for example, co-administration of 50 µM DOXO and 1.56 µM GLIM in A549 cells resulted in a 227% increase in DOXO level compared to DOXO monotherapy. Although we did not observe a clear dose–response relationship, our results suggest a close correlation between increased DOXO levels and the synergistic effects observed in the MTT assay.

2.7. Ex Vivo Toxicity and Microscopy

Ex vivo erythrocyte membrane toxicity studies serve as a bridge between in vitro and in vivo research, providing a more physiologically relevant assessment of a compound’s effects and identifying potential toxic interactions before in vivo trials. Figure 8a shows hemolysis results using Drabkin’s method [87]. The negative control (CTRL−), consisting of RBCs incubated for 4 h in PBS, exhibited 11.6% hemolysis with preserved erythrocyte shape. The positive control (CTRL+), consisting of RBCs incubated in demineralized water, showed complete cell lysis, which was considered as 100% hemolysis.
The observed morphological changes in erythrocytes provide valuable insights into the effects of the tested substances on cellular structures (Figure 8b–f). In CTRL−, erythrocytes maintained their characteristic biconcave shape, indicating membrane stability under experimental conditions, consistent with previous studies on erythrocyte morphology in isotonic environments [88]. In contrast, CTRL+ exhibited complete hemolysis and total membrane disruption, confirming the method’s capability to evaluate extreme toxic effects.
Slight erythrocyte shrinkage was observed in the 0.5% DMSO sample (Figure 8c), but the level of hemolysis by DMSO (12.2%) remained comparable to CTRL− (11.6%). This is consistent with previous studies suggesting that DMSO has minimal effect on hemolysis under controlled conditions while potentially altering osmotic balance [89]. Reported hemolytic concentrations of DMSO vary widely due to differences in experimental conditions. For example, Yi et al. observed hemolysis at 0.2% DMSO [90], whereas other studies found no significant hemolysis even at 25% DMSO in 0.6% saline [91]. Such discrepancies may be due to differences in the extracellular environment; in our case, PBS (containing 0.9% NaCl) may mitigate hemolytic effects of 0.5% DMSO. In contrast, naïve DOXO caused significant erythrocyte rupture and morphological changes (Figure 8c), consistent with its known high toxicity. These effects, likely due to disruption of membrane and cytoskeletal structures, have been extensively documented [92]. The observed hemolysis rate of 32.3% is also consistent with literature data [93,94].
Hemolysis is a known side effect of SUs. The most common cause is extravascular hemolysis associated with G6PD deficiency (e.g., for GLIB) [95] or immune complex-mediated mechanisms (e.g., for CHLO, GLIB, and TOLB) [96,97]. In addition, there are reports of in vitro photohemolytic properties induced by exposure to sunlight (e.g., for CHLO, GLIP, GLIQ, and TOLB) [98]. In our study, we incubated RBCs with GLIM, GLIQ, and CHLO at clinically relevant concentrations (Figure S2) for 4 h at RT in the dark. There was no substantial increase in hemolysis (11.2–11.9%) compared to the negative control (Figure 8a), except for changes in cell morphology with GLIQ (Figure 8e), which remain unexplained. When SUs were co-administered with DOXO, the levels of hemolysis (32.1–35.6%) and cell shape changes were similar to those observed with naïve DOXO (32.3%), indicating no synergistic effect of SUs on erythrocyte toxicity

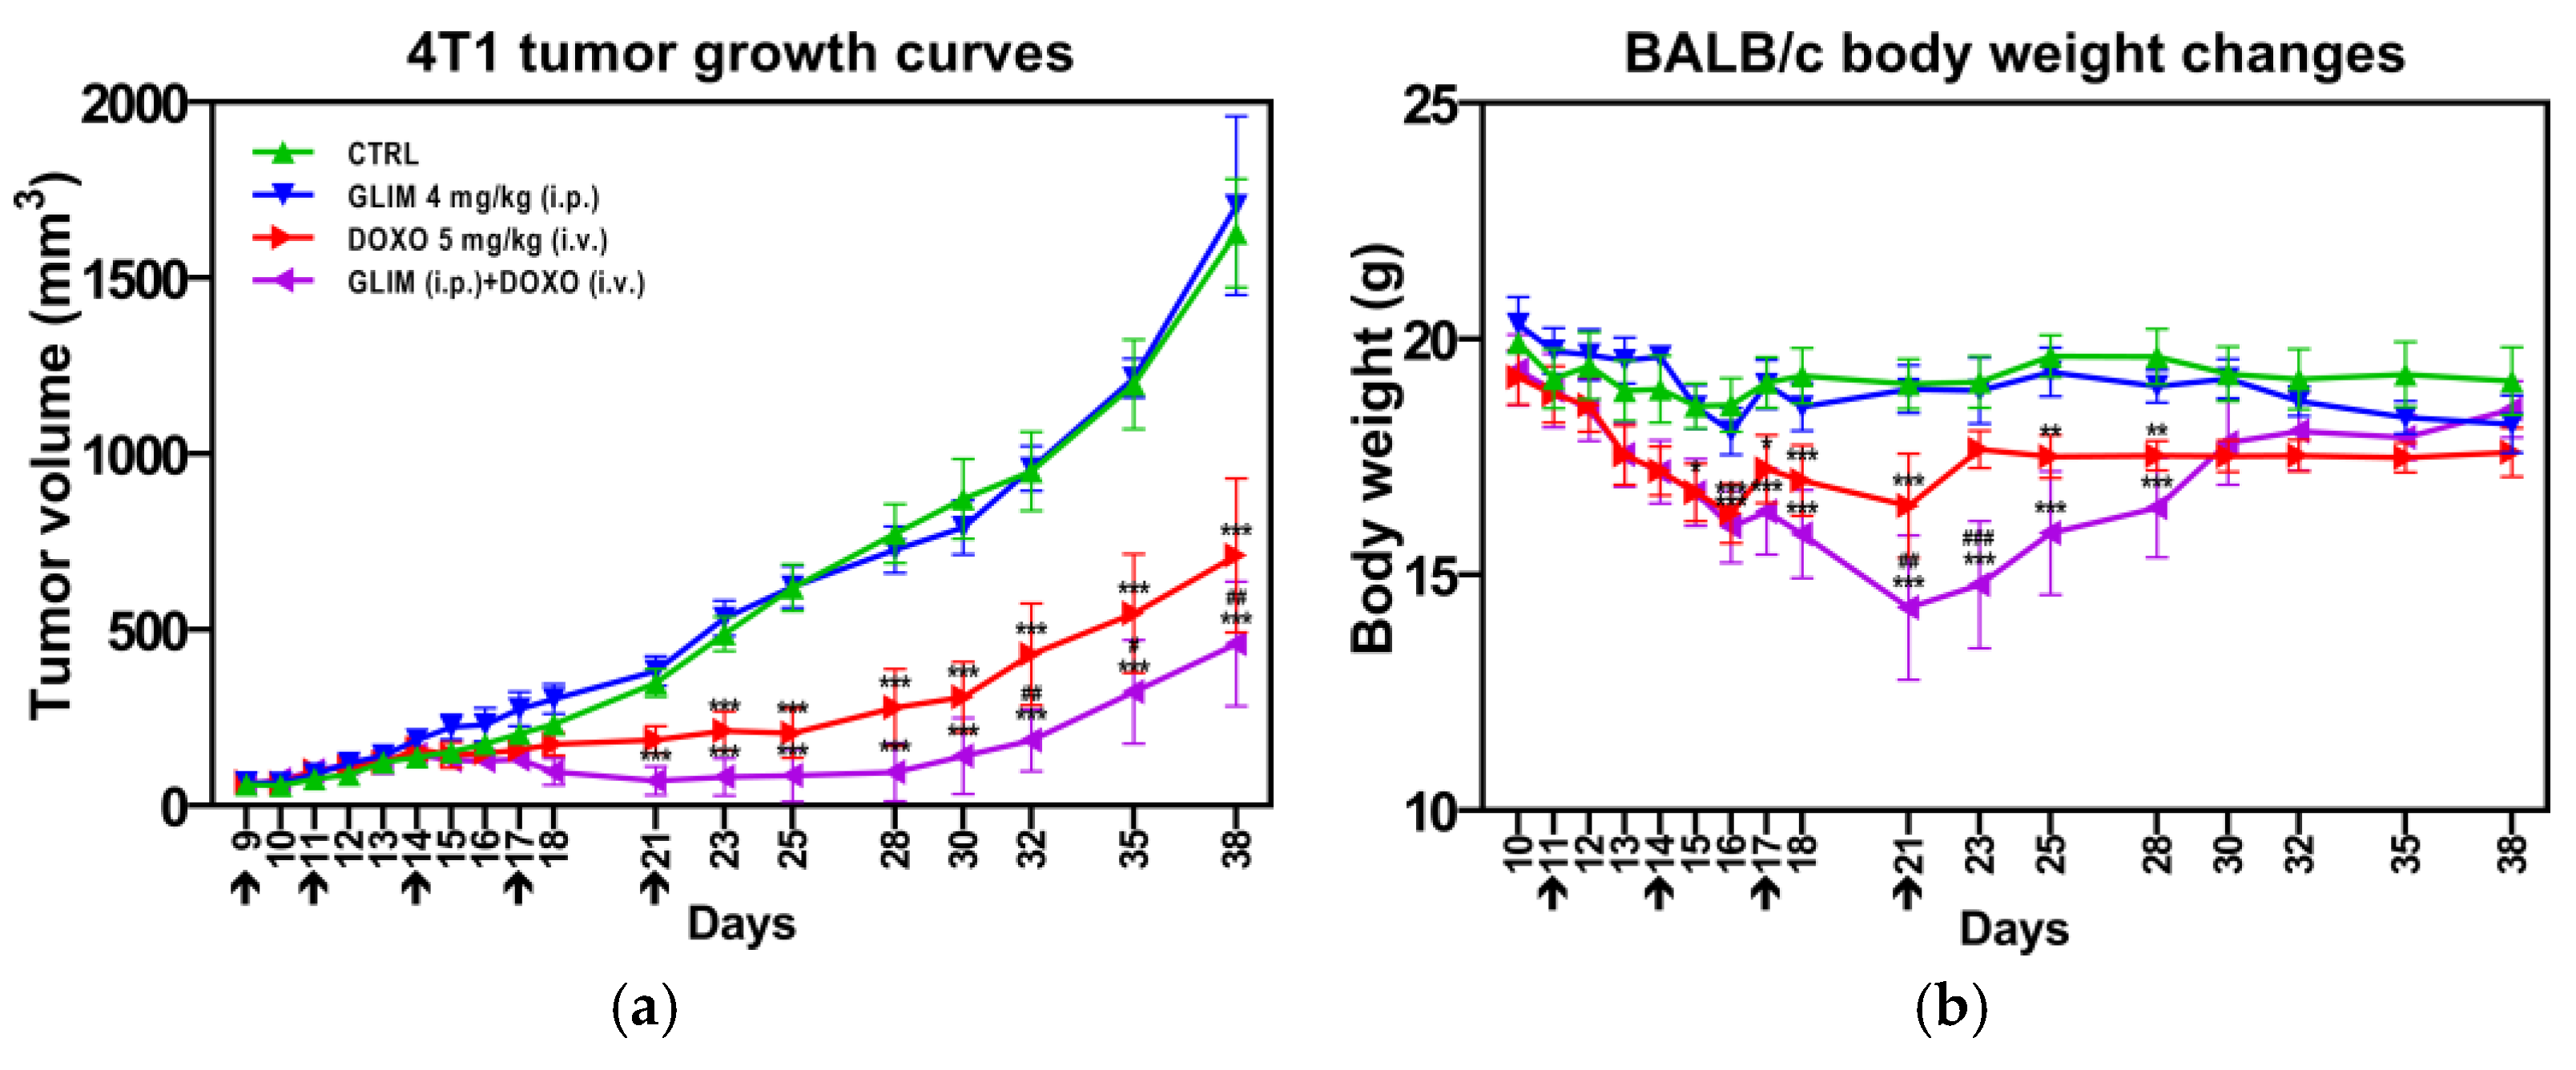
2.8. Findings from In Vivo Studies

Evidence that SUs can enhance the anticancer activity of other cytostatics in vivo remains limited, and available studies lack systematic comparisons among different SUs. To date, only two such studies have been published. Cocca et al. were the first to examine the anticancer effect of GLIB (0.06 mg/kg/day, orally), alone or combined with tamoxifen (1 mg/kg/day, s.c.), on mammary tumors in non-diabetic and diabetic rats [25]. After 20 days of treatment, in non-diabetic rats, 64% of tumors responded to GLIB (they either regressed or remained stable), 57% of tumors responded to tamoxifen, and all tumors responded to the combined treatment (58% regressed and 42% remained stable). In diabetic rats, no response to GLIB alone was observed, while 75% of tumors responded to tamoxifen, and 89% of tumors responded to the combined treatment (68% regressed and 21% remained stable). The reason for the lack of GLIB response in diabetic rats is unclear, but it may be linked to distinct histological tumor features and differences in K+ channel expression between diabetic and non-diabetic animals.
A recent study by Zhan et al. investigated how combining GLIM (5 mg/kg every 2 days, i.p.) with anti-PD1 therapy affects colon and melanoma tumors in mice [30]. In the CT26 colon cancer model, GLIM alone increased CD8+ T cell infiltration by about 100% and reduced tumor mass by 45%, while anti-PD1 alone reduced tumor mass by about 56%. However, when GLIM and anti-PD1 were combined, the treatment unexpectedly resulted in only a 2% decrease in tumor mass. In contrast, in the MC38 melanoma model, GLIM alone had little effect on CD8+ T cell numbers (<10% increase) but still reduced tumor mass by 57%, which was greater than the 33% reduction achieved by anti-PD1 alone. The combination therapy in this model reduced tumor mass by 34% and increased CD8+ T cells to levels similar to anti-PD1 therapy alone. These results suggest that combining GLIM with anti-PD1 or other chemotherapies may produce different outcomes depending on the tumor type.
Notably, sulfonylureas can exhibit differential effects not only across various cancer types but also within the same cancer model. For example, Qi et al. demonstrated that GLIP, but not GLIM, inhibited tumor growth and metastasis in 4T1 breast cancer and B16F10 melanoma xenografts, as well as in transgenic MMTV-PyMT mouse models of breast cancer [32].
In our in vivo study, we observed a significant inhibition of tumor growth in the group treated with the DOXO + GLIM combination compared to those receiving monotherapies (Figure 9a). By the end of this study, tumor volume in the combination group was 35% smaller than in the DOXO-only group and 72% smaller than in the control group. In contrast, mice treated with GLIM alone showed no reduction in tumor size compared to untreated controls, consistent with previous findings by Qi et al. [32], who also observed no effect of GLIM on 4T1 tumors in BALB/c mice. During the treatment phase, we noted substantial weight loss in the combination therapy group; however, the mice fully regained their initial weight after the cessation of compound administration (Figure 9b). We also found that mice treated with GLIM alone showed no significant change in body weight compared to controls, in agreement with other mouse and rat studies [99,100].

3. Materials and Methods

3.1. HPLC Analysis

The drug content in the samples was determined using a previously described HPLC method [101]. The analysis was performed on an Ultimate 3000 HPLC system (Dionex Co., Germering, Germany), equipped with a UV–Vis detector and a TSKgel ODS-100V column (particle size: 5 µm; dimensions: 4.6 mm i.d. × 15 cm; Tosoh Co., Tokyo, Japan). The mobile phase consisted of MeCN and 20 mM KH2PO4 buffer (pH 3.0) in an appropriate ratio. The flow rate was maintained at 1.0 mL/min, with the column temperature set to 30 °C. All compounds were detected at 228 nm.
Detailed information, including retention time (tR), the linear equation, and the correlation coefficient (R2) for each drug, along with the specific mobile phase compositions, is provided in the Supplementary Materials (Figure S17). Standard curves were generated by linear regression analysis of peak area versus analyte concentration within a range of 15.63–1000 µM. Stock solutions were prepared by dissolving solid drugs in DMSO to a concentration of 100 mM, and standard curve samples were prepared through serial half-dilutions in DMSO. Additional details on the analysis of DOXO are provided in Figure S18, and information on the analysis of BSA can be found in Figure S19.

3.2. DLS Measurements

Dynamic light scattering (DLS) measurements were performed using a Zetasizer Nano ZS instrument (Malvern Instruments, Malvern, UK). Samples of 2 mL were placed in disposable PMMA cuvettes (cat. #634-0677; VWR, Gdańsk, Poland) and measured at 37 °C. To ensure accuracy, each sample was measured at least three times. The data were processed using DTS v6.2 software (Malvern Instruments).

3.3. Analysis of Drug Solubility

Drug solubility was analyzed by preparing samples where 1–5 µL of a 100 mM drug stock in DMSO was added to 995 µL of PBS (pH 7.4). Some samples included 0.05% (v/v) Tween-80. For experiments involving BSA, a separate solution was prepared by dissolving 4.5 mg/mL of BSA (cat. #422381B, VWR) in the same PBS (pH 7.4), with or without 0.05% (v/v) Tween-80. All samples were incubated at 37 °C with shaking for 24 h. After incubation, the samples were either centrifuged at 13,500 rpm (RCF = 12,225 g) for 15 min using a Micro Star 12 microcentrifuge (VWR), and 150 µL of the supernatant was collected for HPLC analysis, or filtered using 0.22 µm PVDF syringe filters (13 mm i.d., cat. #514-1251, VWR) or AcroPrep™ Advance 96-well filter plates (Pall Corporation, Dreieich, Germany) with various molecular weight cut-offs.

3.4. Analysis of Drug Stability

To evaluate drug interactions and stability, 1.5 mL samples were prepared with either a combination of SUs and DOXO, each at a concentration of 100 µM, or with each drug individually at the same concentration. The samples were prepared in PBS (pH 7.4) containing 0.05% (v/v) Tween-80 and 0.5% (v/v) DMSO. Additionally, the stability of DOXO was analyzed under different pH conditions. The samples were placed into 2 mL HPLC vials, sealed, and incubated at 37 °C for 7 to 14 days. Every 24 h, 20 µL aliquots were taken for HPLC analysis.

3.5. Preliminary Cytotoxic Assay

MCF-7 human breast cancer cells were obtained from the American Type Culture Collection (ATCC; Rockville, MD, USA) and cultured in Eagle’s Minimum Essential Medium (MEM; Sigma-Aldrich, Darmstadt, Germany) supplemented with 10% fetal bovine serum (FBS; Sigma-Aldrich) and 1% penicillin/streptomycin mixture (10,000 U/mL penicillin and 10 mg/mL streptomycin; Sigma-Aldrich).
Stock solutions of the tested compounds were first prepared in DMSO at 200-fold the intended final concentration. They were then diluted in MEM supplemented with 10% (v/v) FBS, antibiotics and 0.00625–0.05% Tween 80 (v/v), resulting in a final DMSO concentration of 0.5%. Once the cells reached 80–90% confluence, they were harvested using 0.25% trypsin in 1 mM EDTA (Life Technologies, Warsaw, Poland) and seeded into 96-well plates at a density of 8 × 10³ cells per well. After overnight incubation at 37 °C in a humidified atmosphere with 5% CO2, the medium was replaced with 100 µL of freshly prepared medium containing the tested compounds. The cells were treated for 72 h under the same conditions.
Following treatment, 25 μL of MTT solution was added to each well, and the plates were incubated for 2 h at 37 °C. Subsequently, 100 µL of solubilizing solution (45 mL DMF, 13.5 g SDS, and 55 mL distilled water) was added to each well [102]. After overnight incubation at 37 °C, optical density was measured at 550 nm with a reference wavelength of 670 nm using a Varioskan Lux reader (Thermo Fisher Scientific, Waltham, MA, USA). IC₅₀ values, indicating the concentration required to reduce cell viability by 50% compared to untreated controls (set as 100% viability), were calculated using GraphPad Prism 9 software (GraphPad Software, San Diego, CA, USA). All data from this preliminary cytotoxic assay were analyzed by ANOVA followed by Tukey’s post hoc test for multiple comparisons, with significance set at p < 0.05. A similar statistical approach was used for the rest of the experimental work presented in this study.

3.6. Synergistic Cytotoxicity Assay

The synergistic effects of drug combinations were studied in various cancer cell lines, including MCF-7 (human breast cancer), A549 (human lung cancer), U-87 MG (human malignant glioma), HepG2 (human liver cancer), and HUH7 (human liver cancer). HMEC-1, an immortalized human microvascular endothelial cell line, was used as a model for normal cells. All cell lines were purchased from ATCC (Rockville, MD, USA).
The cancer cell lines were cultured in Dulbecco’s Modified Eagle’s Medium (DMEM; Sigma-Aldrich) supplemented with 10% FBS and 1% penicillin/streptomycin mixture (10,000 U/mL penicillin and 10 mg/mL streptomycin; Sigma-Aldrich) at 37 °C in a humidified atmosphere with 5% CO2. HMEC-1 cells were grown in MCDB 131 medium containing 10% FBS, 10 ng/mL EGF, 1 µg/mL hydrocortisone, and 1% penicillin/streptomycin mixture under the same incubation conditions. All cultures were routinely checked for mycoplasma contamination and passaged three times a week using 0.25% trypsin in 1 mM EDTA.
For the MTT assay, exponentially growing cells were seeded into 96-well plates at a density of 5 × 10³ cells per well. After 24 h of incubation, the medium was replaced with 100 µL of fresh medium containing the tested compounds. After 72 h of treatment, cell viability was assessed using the MTT assay as described earlier. Absorbance was measured at 580 nm with a reference wavelength of 720 nm using a PowerWave HT microplate reader (BioTek Instruments, Winooski, VT, USA). Synergistic effects were evaluated using CompuSyn v1.0 software [103]. IC50 values were calculated using GraphPad Prism 9 software (GraphPad Software).

3.7. Flow Cytometric Measurements

Cells were seeded in 60 mm diameter dishes at a density of 1 × 10⁶ cells per dish in 3 mL of DMEM supplemented with 10% FBS and 1% penicillin/streptomycin mixture (10,000 U/mL penicillin and 10 mg/mL streptomycin). After 24 h of incubation at 37 °C in a humidified atmosphere with 5% CO2, the medium was replaced with fresh medium containing the test drugs, prepared as described earlier.
After 72 h of drug treatment, cells were detached using 0.25% trypsin in 1 mM EDTA, centrifuged at 1000 rpm (RCF = 173 g) for 5 min at 4 °C in a Sigma 3K15 centrifuge (SIGMA Laborzentrifugen, Osterode am Harz, Germany), resuspended in 100 µL of ice-cold PBS (pH 7.4), and fixed with 1 mL of cold 70% ethanol. After fixation, cells were centrifuged at 2000 rpm (RCF = 693 g) for 10 min at 4 °C to remove the ethanol, washed with PBS, and centrifuged again under the same conditions. The final pellet was resuspended in 300 µL of PBS containing 4 mg/mL propidium iodide and 20 µg/mL RNase A.
Cell cycle analysis was performed using a BD LSR II™ flow cytometer (Becton Dickinson, San Jose, CA, USA), analyzing 10,000 cells to determine their distribution across different cell cycle phases. Data were analyzed using FlowJo v7.6 software (FlowJo, LLC, Ashland, OR, USA).

3.8. Doxorubicin Accumulation Assay

Intracellular accumulation of DOXO was measured based on its autofluorescent properties. Cells were seeded at a density of 2 × 10⁴ cells per well in black 96-well plates as described in Section 3.6. After 24 h of incubation at 37 °C in a humidified atmosphere with 5% CO₂, the medium was replaced with fresh medium containing 50 μM DOXO, varying concentrations of SUs (from 0 to 50 μM), 0.05% (v/v) Tween-80, and 0.5% (v/v) DMSO. After 3 h of incubation, the cells were washed twice with 100 µL of PBS (pH 7.4) and intracellular DOXO levels were quantified by measuring total fluorescence in each well using a Fluoroskan Ascent FL microplate reader (Labsystem, Stockholm, Sweden). The excitation and emission wavelengths were set at 485 nm and 538 nm, respectively, to closely match the absorption at 470 nm and emission at 560 nm of DOXO in biological systems [104].

3.9. Hemolysis and Membrane Integrity Evaluation

Blood samples were collected from healthy human volunteers into Vacutainer tubes containing 3% sodium citrate (BD Biosciences, Warsaw, Poland). Whole blood was centrifuged at 1500 rpm (RCF = 214 g) for 10 min in a CompactStar CS4 centrifuge (VWR) at RT to separate erythrocytes, which were washed twice with PBS (pH 7.4) and centrifuged at 1500 rpm for 5 min at RT after each wash. Hematocrit was measured to adjust the final RBC concentration in PBS (pH 7.4) to 40%. The drugs were then dissolved in the RBC suspension at the final concentrations outlined in Figure 8. RBCs incubated in dH2O were used as a positive control (100% hemolysis), while RBCs in PBS were used as the negative control. A blank sample of PBS without RBCs or drugs provided a baseline for absorbance measurements. Experimental samples, along with positive, negative, and vehicle (0.5% DMSO) controls, were incubated for 4 h at RT in the dark. After incubation, the samples were centrifuged at 1500 rpm for 5 min at RT, and the supernatant was collected to measure hemoglobin release using Drabkin’s method [87]. Absorbance was measured at 540 nm with a Jenway 6305 UV/Vis spectrophotometer (Bibby Scientific, Staffordshire, UK). This study was conducted in triplicate. The percentage of hemolysis was calculated by comparing the absorbance at 540 nm (OD540) of the test sample with that of the positive control using the following formula:
%   Hemolysis = O D 540 T e s t O D 540 ( B l a n k ) O D 540 T o t a l   L y s i s O D 540 ( B l a n k ) × 100 %

3.10. In Vivo Experimental Procedures

Six- to eight-week-old female BALB/c mice (Charles River Breeding Laboratories, Wilmington, MA, USA) were bred at the Maria Sklodowska-Curie National Research Institute of Oncology, Gliwice Branch (Gliwice, Poland), under a HEPA-filtered Allentown’s IVC System (Allentown Caging Equipment Co., Allentown, NJ, USA). All efforts to minimize animal suffering were made by qualified personnel. This study was carried out in strict accordance with the recommendations in the Guide for the Care and Use of Laboratory Animals of the National Institutes of Health. The protocols were approved by the Committee on the Ethics of Animal Experiments of the Local Ethics Commission (Medical University of Silesia, Katowice, Poland; Permit No. 22/2024).
BALB/c mice were injected subcutaneously in the lower flank with 2 × 10⁵ 4T1 cells suspended in 100 μL PBS. Growing tumors were measured with calipers, and tumor volumes were determined using the following formula:
Volume = W i d t h 2 × L e n g t h × 0.52
Mice with well-developed tumors were randomly divided into four treatment groups: control (untreated), GLIM (4 mg/kg, i.p.), DOXO (5 mg/kg, i.v.) alone, and combination therapy with GLIM (4 mg/kg, i.p.) and DOXO (5 mg/kg, i.v.). Each treatment was administered a total of five times.

4. Conclusions

SUs are generally considered safe drugs, with minimal cytotoxicity even at high micromolar concentrations. Our findings show that second-generation SUs are more cytotoxic than first-generation ones, with the latter often failing to reach IC50 values below 500 µM. To date, only Alkhalil et al. [10] have performed a comparative cytotoxicity evaluation of selected second-generation SUs (GLIM, GLIB, and GLIP) in multiple cell lines. In Figure S20, we compare their results with the limited data from other studies [11,16,26], and our own findings. The cytotoxicity of GLIM in our study (135.2–472.9 µM) aligns with the range reported by Alkhalil et al. and others (89.4–426.1 µM); however, we observed some cell line-specific differences. Such differences may be due to variations in culture media composition. For example, the surfactant we used to prevent drug aggregation may also influence cytotoxicity by affecting drug retention in certain cell lines.
To explore the anticancer potential of SUs, we tested them in vitro at relatively high concentrations (100–500 µM) in culture media supplemented with 0.05% Tween-80 to prevent the formation of large drug aggregates. GLIM has a strong tendency to aggregate and precipitate in buffers and culture media, forming particles exceeding 300 nm in diameter (Figure 10a). Previous research by Shoichet demonstrated that such large aggregates can limit cellular availability and disrupt the biological activity of drugs. Similarly, our results suggest that BSA in the culture medium may also decrease the availability of strongly binding drugs like GLIM, thereby diminishing their biological activity and potentially leading to false-negative results.
We began investigating drug aggregation after observing that GLIM, which forms a visibly cloudy suspension in PBS at low micromolar levels, appeared to dissolve completely in culture medium even at high concentrations. Surprisingly, when we added 0.05% Tween-80 to this medium to prevent anticipated aggregation, the drug precipitated again, creating a cloudy mixture. Figure 10b proposes the potential mechanism for these observations. GLIM is quite lipophilic (logP = 3.81) [105] and binds extensively to plasma proteins (99.4% protein-bound in plasma) [106]. In culture media containing BSA, GLIM forms soluble drug–protein complexes of about 13.3–14.9 nm ( d ¯ I ) , which increase its observed concentration (Cobs) and reduce tendency to aggregate compared to free (unbound) molecules. However, in media containing Tween-80, the surfactant competes with GLIM for binding to BSA, displacing the drug and increasing its free concentration. This increase in free drug concentration promotes aggregation due to overreaching critical aggregation concentration, ultimately decreasing the Cobs of the soluble drug. Like other researchers, we also found that BSA binding can diminish the activity of certain SUs in cell assays, such as cytotoxicity or the ability to block KATP channels [72]. In one of our experiments, the addition of 0.05% Tween-80 effectively displaced GLIM from BSA, resulting in a lower Cobs but significantly increasing its cytotoxicity against MCF-7 cells (viability dropped from 95.9% to 71.2%). In contrast, 0.05% Tween-80 had minimal impact on the cytotoxicity of CHLO (viability decrease by only 3.2%), likely due to its weaker binding to BSA. Although the effects of surfactants on the bioavailability of poorly soluble drugs are not fully understood, we suggest that their use may help avoid false-negative results and improve the reliability of drug screening assays for strongly protein-binding compounds.
We investigated the combined cytotoxic effects of DOXO and SUs in two stages. First, various combinations of DOXO with commercially available SUs were tested on MCF-7 breast cancer cells. While all combinations significantly reduced cell viability compared to DOXO alone, not all demonstrated synergistic effects. Combinations with first-generation SUs generally showed better combination indices with DOXO but were less cytotoxic compared to combinations involving second-generation SUs. In the second stage, we examined DOXO combined with selected SUs—specifically GLIM, GLIQ, and CHLO—across a broader panel of cell lines. Most cancer cell lines (A549, HepG2, MCF-7, and U-87MG) became more sensitive to the combined treatments, but some (HMEC-1 and HuH7) primarily showed antagonistic responses.
The observed synergy may result from SUs inhibiting MRPs, which normally expel anticancer drugs like DOXO from cancer cells. Since MRPs belong to the same ABC transporter subfamily (ABCC) as SURs—the clinical targets of SUs—it is plausible that SUs may also inhibit MRPs, thereby increasing DOXO retention inside cells. This mechanism has been previously demonstrated for GLIB, which inhibits MRP1 and MRP2, resulting in higher accumulation of their substrates in cancer cells [24]. Although this mechanism has not yet been confirmed for GLIM, GLIQ, and CHLO, our study showed that these SUs increased DOXO levels (up to 2.3 times) in sensitive cell lines, suggesting a similar mode of action. Synergistic effects were also seen in changes to the cell cycle—combinations with DOXO significantly increased the SubG1 and G2/M populations in sensitive cell lines, surpassing the effects of SUs or DOXO alone.
The most promising result in our study was observed with the DOXO + GLIM combination. Treatment with 0.12 µM DOXO and 45.1 µM GLIM resulted in a 4.4-fold increase in cytotoxicity against MCF-7 breast cancer cells, while also exhibiting cytoprotective effects in non-cancerous HMEC-1 cells. Preliminary in vivo studies demonstrated that this combination was significantly more effective at inhibiting 4T1 tumor growth in mice than monotherapies or the control group. Administering 5 mg/kg DOXO and 4 mg/kg GLIM improved efficacy by 32% compared to DOXO monotherapy. However, the combination therapy group experienced a 13% greater body weight loss than the DOXO-alone group by the end of treatment, indicating increased systemic toxicity. Importantly, this weight loss was reversible upon cessation of treatment.
We observed that co-administration of SUs and DOXO does not increase hemolysis. The combinations of GLIM, GLIQ, and CHLO with DOXO did not raise hemolysis above the level induced by DOXO alone (32.3%), indicating that SUs do not enhance DOXO’s toxicity to red blood cells. Clinically, this finding suggests that such combination therapies do not increase the risk of hemolytic anemia associated with DOXO, even in patients with underlying conditions such as diabetes or those receiving concurrent treatments.
Another clinically significant consideration when discussing combination therapies involving SUs is their potential to increase the risk of hypoglycemia, even in healthy individuals. Because SUs stimulate the pancreas to release insulin, they can lower blood sugar levels in both diabetic and non-diabetic individuals. However, not all SUs carry the same risk of hypoglycemia. In our study, the DOXO + GLIM combination demonstrated the most effective anticancer activity. At the same time, GLIM was associated with a lower risk of hypoglycemia compared to other SUs, both in diabetic patients (1–8 mg/day) [107,108] and in non-diabetic individuals [109]. In non-diabetic individuals, GLIM (4 mg) can still increase insulin and C-peptide levels even when blood sugar levels are normal, but it does not significantly interfere with the body’s natural hormonal defenses against low blood sugar. As a result, important counterregulatory responses—such as glucagon release and sympathetic activation—remain more intact if hypoglycemia occurs [110]. In other words, while GLIM lowers blood sugar in both groups, it poses a lower risk of severe hypoglycemia compared to other SUs. Moreover, GLIM may be a safer option for patients with cardiovascular disease because, unlike other SUs, it does not impair the ischemic preconditioning of cardiac myocytes [110].
SUs are widely used and popular treatments for T2DM, and the clinical use of newer agents like glimepiride is expected to continue, including in patients with concurrent cancers. While SUs are associated with drawbacks—including an increased risk of hypoglycemia, weight gain, and potential β-cell dysfunction—their potential to enhance the effectiveness of chemotherapeutic agents may outweigh these limitations. Our findings suggest that the synergistic effects of SUs, particularly GLIM, can improve the efficacy of DOXO-based cancer therapies and/or reduce their side effects. Future in vivo studies are planned to evaluate this therapeutic strategy in a human breast cancer model using immunodeficient BALB/c nude mice and to explore alternative formulations to minimize systemic toxicity. Additionally, further research is needed to confirm whether SUs can enhance the efficacy of other anticancer agents and to better understand the underlying mechanisms of their synergistic effects.

Supplementary Materials

The following supporting information can be downloaded at: https://www.mdpi.com/article/10.3390/ijms26041429/s1.

Author Contributions

Conceptualization, M.D.T. and K.M.; methodology, M.D.T., K.M., M.D.-B., D.G.d.C., T.C. and M.G.; investigation, M.D.T., K.M., M.D.-B., G.D., A.K., D.G.d.C., T.C., M.G. and B.P.; formal analysis, M.D.T. and K.M.; writing—original draft preparation, M.D.T., K.M., M.D.-B., A.K., D.G.d.C., T.C. and M.G.; writing—review and editing, M.D.T., W.R., H.P.-S. and A.B.O.; visualization, M.D.T.; supervision, M.D.T.; project administration, M.D.T.; funding acquisition, M.D.T. All authors have read and agreed to the published version of the manuscript.

Funding

This research was funded by the National Centre for Research and Development (NCBR)—Poland, grant number TANGO-V-A/0008/2021-00.

Institutional Review Board Statement

The animal study protocol was approved by the Local Ethical Committee for Animal Experiments in Katowice (protocol No. 22/2024, approved on 26 April 2024).

Informed Consent Statement

Not applicable.

Data Availability Statement

The raw data supporting the conclusions of this article will be made available by the authors on request.

Conflicts of Interest

The authors declare no conflicts of interest.

Abbreviations

BSA—Bovine serum albumin, CARB—Carbutamide, CDCF—5(6)-Carboxy-2′,7′-dichlorofluorescein, Cexp—Concentration resulting from the total amount of drug added to the mixture, CHLO—Chlorpropamide, CI—Combination Index, Cobs—Concentration measured after separation process, dH—hydrodynamic diameter, d ¯ I —intensity-weighted mean hydrodynamic diameter, d ¯ N —number-weighted mean hydrodynamic diameter, DCR—Derived Count Rate, DOXO—Doxorubicin, GLIB—Glibenclamide, GLIC—Gliclazide, GLIM—Glimepiride, GLIP—Glipizide, GLIQ—Gliquidone, HSA—Human serum albumin, i.p.—intraperitoneal, i.v.—intravenous, MCR—Mean Count Rate, MESU—N-(3-methoxy-propyl)-N’-(toluene-4-sulfoyl)-urea, RT—room temperature, s.c.—subcutaneous, T80—Tween-80, TOLA—Tolazamide, TOLB—Tolbutamide, n K a —Global affinity constant.

References

  1. Sahra, I.B.; Marchand-Brustel, Y.L.; Tanti, J.-F.; Bost, F. Metformin in Cancer Therapy: A New Perspective for an Old Antidiabetic Drug? Mol. Cancer Ther. 2010, 9, 1092–1099. [Google Scholar] [CrossRef] [PubMed]
  2. Vancura, A.; Bu, P.; Bhagwat, M.; Zeng, J.; Vancurova, I. Metformin as an Anticancer Agent. Trends Pharmacol. Sci. 2018, 39, 867–878. [Google Scholar] [CrossRef] [PubMed]
  3. Aljofan, M.; Riethmacher, D. Anticancer activity of metformin: A systematic review of the literature. Future Sci. OA 2019, 5, FSO410. [Google Scholar] [CrossRef] [PubMed]
  4. Stattin, P.; Björ, O.; Ferrari, P.; Lukanova, A.; Lenner, P.; Lindahl, B.; Hallmans, G.; Kaaks, R. Prospective study of hyperglycemia and cancer risk. Diabetes Care 2007, 30, 561–568. [Google Scholar] [CrossRef]
  5. Shikata, K.; Ninomiya, T.; Kiyohara, Y. Diabetes mellitus and cancer risk: Review of the epidemiological evidence. Cancer Sci. 2012, 104, 9–14. [Google Scholar] [CrossRef]
  6. Suh, S.; Kim, K.W. Diabetes and Cancer: Is Diabetes Causally Related to Cancer? Diabetes Metab. J. 2011, 35, 193–198. [Google Scholar] [CrossRef]
  7. Collins, K.K. The Diabetes-Cancer Link. Diabetes Spectr. 2014, 27, 276–280. [Google Scholar] [CrossRef]
  8. Kalra, S.; Bahendeka, S.; Sahay, R.; Ghosh, S.; Md, F.; Orabi, A.; Ramaiya, K.; Shammari, S.; Shrestha, D.; Shaikh, K.; et al. Consensus recommendations on sulfonylurea and sulfonylurea combinations in the management of type 2 diabetes mellitus—International Task Force. Indian J. Endocrinol. Metab. 2018, 22, 132–157. [Google Scholar] [CrossRef]
  9. Aubrey, A.B.; Aguilar-Bryan, L.; Nelson, D.A. Molecular mechanisms of action of glyburide on the beta cell. Am. J. Med. 1990, 89, 3S–10S. [Google Scholar] [CrossRef]
  10. Alkhalil, M.; Al-Hiari, Y.; Kasabri, V.; Arabiyat, S.; Al-Zweiri, M.; Mamdooh, N.; Telfah, A. Selected pharmacotherapy agents as antiproliferative and anti-inflammatory compounds. Drug Dev. Res. 2020, 81, 470–490. [Google Scholar] [CrossRef]
  11. Subramaniyam, N.; Arumugam, S.; Ezthupurakkal, P.B.; Ariraman, S.; Biswas, I.; Muthuvel, S.K.; Balakrishnan, A.; Alshammari, G.M.; Chinnasamy, T. Unveiling anticancer potential of glibenclamide: Its synergistic cytotoxicity with doxorubicin on cancer cells. J. Pharm. Biomed. Anal. 2018, 154, 294–301. [Google Scholar] [CrossRef] [PubMed]
  12. Kmita, H.; Stobienia, O.; Michejda, J. The access of metabolites into yeast mitochondria in the presence and absence of the voltage dependent anion selective channel [YVDAC1]. Acta Biochim. Pol. 1999, 46, 991–1000. [Google Scholar] [CrossRef] [PubMed]
  13. Wonderlin, W.F.; Woodfork, K.A.; Strobl, J.S. Changes in membrane potential during the progression of MCF-7 human mammary tumor cells through the cell cycle. J. Cell. Physiol. 1995, 165, 177–185. [Google Scholar] [CrossRef] [PubMed]
  14. Núñez, M.; Medina, V.; Cricco, G.; Croci, M.; Cocca, C.; Rivera, E.; Bergoc, R.; Martín, G. Glibenclamide inhibits cell growth by inducing G0/G1 arrest in the human breast cancer cell line MDA-MB-231. BMC Pharmacol Toxicol. 2013, 14, 6. [Google Scholar] [CrossRef]
  15. Abdul, M.; Hoosein, N. Expression and activity of potassium ion channels in human prostate cancer. Cancer Lett. 2002, 186, 99–105. [Google Scholar] [CrossRef]
  16. Ru, Q.; Tian, X.; Wu, Y.-X.; Wu, R.-H.; Pi, M.-S.; Li, C.-Y. Voltage-gated and ATP-sensitive K+ channels are associated with cell proliferation and tumorigenesis of human glioma. Oncol. Rep. 2014, 31, 842–848. [Google Scholar] [CrossRef]
  17. Zúñiga, L.; Cayo, A.; González, W.; Vilos, C.; Zúñiga, R. Potassium Channels as a Target for Cancer Therapy: Current Perspectives. OncoTargets Ther. 2022, 15, 783–797. [Google Scholar] [CrossRef]
  18. Li, M.; Tian, P.; Zhao, Q.; Ma, X.; Zhang, Y. Potassium channels: Novel targets for tumor diagnosis and chemoresistance. Front. Oncol. 2023, 12, 1074469. [Google Scholar] [CrossRef]
  19. Villalonga, N.; Ferrere, J.C.; Argiles, J.M.; Condom, E.; Felipe, A. Potassium Channels are a New Target Field in Anticancer Drug Design. Recent Pat. Anticancer Drug Discov. 2007, 2, 212–223. [Google Scholar] [CrossRef]
  20. Zhou, Q.; Kwan, H.Y.; Chan, H.C.; Jiang, J.L.; Tam, S.C.; Yao, X. Blockage of voltage-gated K+ channels inhibits adhesion and proliferation of hepatocarcinoma cells. Int. J. Mol. Med. 2003, 11, 261–266. [Google Scholar] [CrossRef]
  21. Suzuki, Y.; Inoue, T.; Murai, M.; Suzuki-Karasaki, M.; Ochiai, T.; Ra, C. Depolarization potentiates TRAIL-induced apoptosis in human melanoma cells: Role for ATP-sensitive K+ channels and endoplasmic reticulum stress. Int. J. Oncol. 2012, 41, 465–475. [Google Scholar] [CrossRef]
  22. Pasello, G.; Urso, L.; Conte, P.; Favaretto, A. Effects of sulfonylureas on tumor growth: A review of the literature. Oncologist 2013, 18, 1118–1125. [Google Scholar] [CrossRef] [PubMed]
  23. Golstein, P.E.; Boom, A.; van Geffel, J.; Jacobs, P.; Masereel, B.; Beauwens, R. P-glycoprotein inhibition by glibenclamide and related compounds. Pflugers Arch. 1999, 437, 652–660. [Google Scholar]
  24. Payen, L.; Delugin, L.; Courtois, A.; Trinquart, Y.; Guillouzo, A.; Fardel, O. The sulphonylurea glibenclamide inhibits multidrug resistance protein (MRP1) activity in human lung cancer cells. Br. J. Pharmacol. 2001, 132, 778–784. [Google Scholar] [CrossRef] [PubMed]
  25. Cocca, C.; Martín, G.; Núñez, M.; Gutiérrez, A.; Cricco, G.; Mohamad, N.; Medina, V.; Croci, M.; Crescenti, E.; Rivera, E.; et al. Effect of glibenclamide on N-nitroso-N-methylurea-induced mammary tumors in diabetic and nondiabetic rats. Oncol. Res. 2005, 15, 301–311. [Google Scholar] [CrossRef] [PubMed]
  26. Faridi, U.; Al-Mutairi, F.; Parveen, H.; Khateeb, S. An in-vitro and in Silico Anticancer Study of FDA Approved Antidiabetic Drugs Glimepiride and Empagliflozin: Life Sciences-Biochemistry for better diagnosis and therapy. Int. J. Life Sci. Biotechnol. Pharma Res. 2022, 10, 52–57. [Google Scholar] [CrossRef]
  27. Szymczak-Pajor, I.; Fleszar, K.; Kasznicki, J.; Gralewska, P.; Śliwińska, A. A potential role of calpains in sulfonylureas (SUs)-mediated death of human pancreatic cancer cells (1.2B4). Toxicol. Vitro 2021, 73, 105128. [Google Scholar] [CrossRef]
  28. Long, L.; Hu, X.; Li, X.; Zhou, D.; Shi, Y.; Wang, L.; Zeng, H.; Yu, X.; Zhou, W. The Anti-Breast Cancer Effect and Mechanism of Glimepiride-Metformin Adduct. OncoTargets Ther. 2020, 13, 3777–3788. [Google Scholar] [CrossRef]
  29. Kang, H.; Lee, S.; Kim, K.; Jeon, J.; Kang, S.; Youn, H.; Kim, H.Y.; Youn, B.H. Downregulated CLIP3 induces radioresistance by enhancing stemness and glycolytic flux in glioblastoma. J. Exp. Clin. Cancer Res. 2021, 40, 282. [Google Scholar] [CrossRef]
  30. Zhan, Z.-T.; Liu, L.; Cheng, M.-Z.; Gao, Y.; Zhou, W.-J. The Effects of 6 Common Antidiabetic Drugs on Anti-PD1 Immune Checkpoint Inhibitor in Tumor Treatment. J. Immunol. Res. 2022, 2022, 2651790. [Google Scholar] [CrossRef]
  31. Cairns, L.V.; Lappin, K.M.; Mutch, A.; Ali, A.; Matchett, K.B.; Mills, K.I. Multiplex Screening for Interacting Compounds in Paediatric Acute Myeloid Leukaemia. Int. J. Mol. Sci. 2021, 22, 10163. [Google Scholar] [CrossRef]
  32. Qi, C.; Zhou, Q.; Li, B.; Yang, Y.; Cao, L.; Ye, Y.; Li, J.; Ding, Y.; Wang, H.; Wang, J.; et al. Glipizide, an antidiabetic drug, suppresses tumor growth and metastasis by inhibiting angiogenesis. Oncotarget 2014, 5, 9966–9979. [Google Scholar] [CrossRef]
  33. Gu, Q.; Wang, C.; Wang, G.; Han, Z.; Li, Y.; Wang, X.; Li, J.; Qi, C.; Xu, T.; Yang, X.; et al. Glipizide suppresses embryonic vasculogenesis and angiogenesis through targeting natriuretic peptide receptor A. Exp. Cell Res. 2015, 333, 261–272. [Google Scholar] [CrossRef] [PubMed]
  34. Cevik, M.; Caker, S.; Deliorman, G.; Cagatay, P.; Gunduz, M.K.; Susleyici, B. The effects of glipizide on DNA damage and nuclear transport in differentiated 3T3-L1 adipocytes. Mol. Biol. Rep. 2022, 49, 1151–1159. [Google Scholar] [CrossRef] [PubMed]
  35. Mao, G.; Zheng, S.; Li, J.; Liu, X.; Zhou, Q.; Cao, J.; Zhang, Q.; Zheng, L.; Wang, L.; Qi, C. Glipizide Combined with ANP Suppresses Breast Cancer Growth and Metastasis by Inhibiting Angiogenesis through VEGF/VEGFR2 Signaling. Anticancer Agents Med. Chem. 2022, 22, 1735–1741. [Google Scholar] [CrossRef] [PubMed]
  36. Nazim, U.M.D.; Moon, J.-H.; Lee, Y.-J.; Seol, J.-W.; Kim, Y.J.; Park, S.-Y. Glipizide sensitizes lung cancer cells to TRAIL-induced apoptosis via Akt/mTOR/autophagy pathways. Oncotarget 2017, 8, 100021–100033. [Google Scholar] [CrossRef]
  37. Hendriks, A.M.; Schrijnders, D.; Kleefstra, N.; de Vries, E.; Bilo, H.J.G.; Jalving, M.; Landman, G.W.D. Sulfonylurea derivatives and cancer, friend or foe? Eur. J. Pharmacol. 2019, 861, 172598. [Google Scholar] [CrossRef]
  38. Owen, S.C.; Doak, A.K.; Wassam, P.; Shoichet, M.S.; Shoichet, B.K. Colloidal aggregation affects the efficacy of anticancer drugs in cell culture. ACS Chem. Biol. 2012, 7, 1429–1435. [Google Scholar] [CrossRef]
  39. Seedher, N.; Kanojia, M. Co-solvent solubilization of some poorly-soluble antidiabetic drugs. Pharm. Dev. Technol. 2009, 14, 185–192. [Google Scholar] [CrossRef]
  40. Rajesh, S.Y.; Singh, S.K.; Pandey, N.K.; Sharma, P.; Bawa, P.; Kumar, B.; Gulati, M.; Jain, S.K.; Gowthamarajan, K.; Singh, S. Impact of various solid carriers and spray drying on pre/post compression properties of solid SNEDDS loaded with glimepiride: In vitro-ex vivo evaluation and cytotoxicity assessment. Drug Dev. Ind. Pharm. 2018, 44, 1056–1069. [Google Scholar] [CrossRef]
  41. Pal, A.; Roy, S.; Kumar, A.; Mahmood, S.; Khodapanah, N.; Thomas, S.; Agatemor, C.; Ghosal, K. Physicochemical Characterization, Molecular Docking, and In Vitro Dissolution of Glimepiride-Captisol Inclusion Complexes. ACS Omega 2020, 32, 19968–19977. [Google Scholar] [CrossRef]
  42. Shukla, U.A.; Chi, E.M.; Lehr, K.-H. Glimepiride Pharmacokinetics in Obese Versus Non-Obese Diabetic Patients. Ann. Pharmacother. 2004, 38, 30–35. [Google Scholar] [CrossRef]
  43. Badian, M.; Korn, A.; Lehr, K.-H.; Malerczyk, V.; Waldhäusl, W. Absolute bioavailability of glimepiride (Amaryl) after oral administration. Drug Metabol. Drug Interact. 1994, 11, 331–339. [Google Scholar] [CrossRef] [PubMed]
  44. Yun, H.-Y.; Park, H.-C.; Kang, W.; Kwon, K.-I. Pharmacokinetic and pharmacodynamic modelling of the effects of glimepiride on insulin secretion and glucose lowering in healthy humans. J. Clin. Pharm. Ther. 2006, 31, 469–476. [Google Scholar] [CrossRef] [PubMed]
  45. Yang, B.; Zheng, X.; Hage, D.S. Binding studies based on ultrafast affinity extraction and single- or two-column systems: Interactions of second- and third-generation sulfonylurea drugs with normal or glycated human serum albumin. J. Chromatogr. B 2018, 1102–1103, 8–16. [Google Scholar] [CrossRef] [PubMed]
  46. Miro, A.; Quaglia, F.; Sorrentino, U.; Rotonda, M.L.; Bianca, R.D.D.V.; Sorrentino, R. Improvement of gliquidone hypoglycaemic effect in rats by cyclodextrin formulations. Eur. J. Pharm. Sci. 2004, 23, 57–64. [Google Scholar] [CrossRef]
  47. Jia, L.; Yu, Y.; Wang, M.; Ouyang, H.; Gong, J. Preparation and characterization for multicomponent crystals of the antidiabetic drug gliquidone based on crystal engineering. CrystEngComm 2019, 21, 1617–1625. [Google Scholar] [CrossRef]
  48. Kopitar, Z.; Koss, F.W. Pharmakokinetisches Verhalten von Gliquidone (AR-DF 26), einem neuen Sulfonylharnstoff (Zusammenfassung der bisherigen Untersuchungen) [Pharmacokinetic behaviour of gliquidone (AR-DF 26), a new sulfonyl urea. Summary of the studies so far (author’s transl)]. Arzneimittelforschung 1975, 25, 1933–1938. [Google Scholar]
  49. Chadha, R.; Rani, D.; Goyal, P. Novel cocrystals of gliclazide: Characterization and evaluation. CrystEngComm 2016, 18, 2275–2283. [Google Scholar] [CrossRef]
  50. Samie, A.; Desiraju, G.R.; Banik, M. Salts and Cocrystals of the Antidiabetic Drugs Gliclazide, Tolbutamide, an Glipizide: Solubility Enhancements through Drug–Coformer Interactions. Cryst. Growth Des. 2017, 17, 2406–2417. [Google Scholar] [CrossRef]
  51. Ibrahim, A.Y.; El-Malah, Y.; Abourehab, M.A.S.; Aldawsari, H. Solubility Enhancement of Gliclazide via Co-crystallization with Malonic Acid. Life Sci. J. 2019, 16, 49–53. [Google Scholar] [CrossRef]
  52. Davis, T.M.E.; Daly, F.; Walsh, J.P.; Ilett, K.F.; Beilby, J.P.; Dusci, L.J.; Barrett, P.H.R. Pharmacokinetics and pharmacodynamics of gliclazide in Caucasians and Australian Aborigines with type 2 diabetes. Br. J. Clin. Pharmacol. 2000, 49, 223–230. [Google Scholar] [CrossRef]
  53. Campbell, D.B.; Lavielle, R.; Nathan, C. The mode of action and clinical pharmacology of gliclazide: A review. Diabetes Res. Clin. Pract. 1991, 14, 21–36. [Google Scholar] [CrossRef] [PubMed]
  54. Zheng, X.; Matsuda, R.; Hage, D.S. Analysis of free drug fractions by ultrafast affinity extraction: Interactions of sulfonylurea drugs with normal or glycated human serum albumin. J. Chromatogr. A 2014, 1371, 82–89. [Google Scholar] [CrossRef] [PubMed]
  55. Poddar, S.; Woolfork, A.G.; Iftekhar, S.; Ovbude, S.T.; Hage, D.S. Characterization of binding by sulfonylureas with normal or modified human serum albumin using affinity microcolumns prepared by entrapment. J. Chromatogr. B Analyt. Technol. Biomed. Life Sci. 2023, 1226, 123798. [Google Scholar] [CrossRef] [PubMed]
  56. Goya, P.; Ran, D.; Chadha, R. Crystal Engineering: A Remedy to Tailor the Biopharmaceutical Aspects of Glibenclamide. Cryst. Growth Des. 2018, 18, 105–118. [Google Scholar] [CrossRef]
  57. Sartor, G.; Melander, A.; Scherstén, B.; Wåhlin-Boll, E. Comparative Single-Dose Kinetics and Effects of Four Sulfonylureas in Healthy Volunteers. Acta Med. Scand. 1980, 208, 301–307. [Google Scholar] [CrossRef]
  58. Jaber, L.A.; Antal, E.J.; Welshman, I.R. Pharmacokinetics and Pharmacodynamics of Glyburide in Young and Elderly Patients with Non-Insulin-Dependent Diabetes Mellitus. Ann. Pharmacother. 1996, 30, 472–475. [Google Scholar] [CrossRef]
  59. Shaheen, O.; Othman, S.; Jalal, I.; Awidi, A.; Al-Turk, W. Comparison of pharmacokinetics and pharmacodynamics of a conventional and a new rapidly dissolving glibenclamide preparation. Int. J. Pharm. 1987, 38, 123–131. [Google Scholar] [CrossRef]
  60. Batisai, E. Solubility Enhancement of Antidiabetic Drugs Using a Co-Crystallization Approach. ChemistryOpen 2021, 10, 1260–1268. [Google Scholar] [CrossRef]
  61. Pandey, N.K.; Sehal, H.R.; Garg, V.; Gaur, T.; Kumar, B.; Singh, S.K.; Gulati, M.; Gowthamarajan, K.; Bawa, P.; Rajesh, S.Y.; et al. Stable Co-Crystals of Glipizide with Enhanced Dissolution Profiles: Preparation and Characterization. AAPS PharmSciTech 2017, 18, 2454–2465. [Google Scholar] [CrossRef]
  62. Kradjan, W.A.; Kobayashi, K.A.; Bauer, L.A.; Horn, J.R.; Opheim, K.E.; Wood, F.J. Glipizide Pharmacokinetics: Effects of Age, Diabetes, and Multiple Dosing. J. Clin. Pharmacol. 1989, 29, 1121–1127. [Google Scholar] [CrossRef]
  63. Jaber, L.A.; Antal, E.J.; Slaughter, R.L.; Welshman, I.R. The pharmacokinetics and pharmacodynamics of 12 weeks of glyburide therapy in obese diabetics. Eur. J. Clin. Pharmacol. 1993, 45, 459–463. [Google Scholar] [CrossRef] [PubMed]
  64. Yalkowsky, S.H.; Dannenfelser, R.M. The AQUASOL dATAbASE of Aqueous Solubility, 5th ed.; University of Arizona, College of Pharmacy: Tucson, AZ, USA, 1992. [Google Scholar]
  65. Ridolfo, A.S.; Kirtley, W.R. Clinical experiences with carbutamide, an orally given hypoglycemic agent; preliminary report. JAMA 1956, 160, 1285–1288. [Google Scholar] [CrossRef] [PubMed]
  66. Sarraguça, M.C.; Ribeiro, P.R.S.; Nunes, C.; Seabra, C.L. Solids Turn into Liquids—Liquid Eutectic Systems of Pharmaceutics to Improve Drug Solubility. Pharmaceuticals 2022, 15, 279. [Google Scholar] [CrossRef] [PubMed]
  67. Dodge, A.; Gould, P.L. Dissolution of Chlorpropamide Tablets in A Methanol-Water Binary Solvent System. Drug Dev. Ind. Pharm. 1987, 13, 1817–1826. [Google Scholar] [CrossRef]
  68. Fadda, H.M.; Chen, X.; Aburub, A.; Mishra, D.; Pinal, R. A Novel Method for Determining the Solubility of Small Molecules in Aqueous Media and Polymer Solvent Systems Using Solution Calorimetry. Pharm. Res. 2014, 31, 1735–17453. [Google Scholar] [CrossRef]
  69. Taylor, J.A. Pharmacokinetics and biotransformation of chlorpropamide in man. Clin. Pharmacol. Ther. 1972, 13, 710–718. [Google Scholar] [CrossRef]
  70. Kuldipkumar, A.; Tan, Y.T.F.; Goldstein, M.; Nagasaki, Y.; Zhang, G.G.Z.; Kwon, G.S. Amphiphilic Block Copolymer as a Crystal Habit Modifier. Cryst. Growth Des. 2005, 5, 1781–1785. [Google Scholar] [CrossRef]
  71. Welling, P.G.; Patel, R.; Patel, U.R.; Gillespie, W.R.; Craig, W.A.; Albert, K.S. Bioavailability of tolazamide from tablets: Comparison of in vitro and in vivo results. J. Pharm. Sci. 1982, 71, 1259–1263. [Google Scholar] [CrossRef]
  72. Proks, P.; Kramer, H.; Haythorne, E.; Ashcroft, F.M. Binding of sulphonylureas to plasma proteins—A KATP channel perspective. PLoS ONE 2018, 13, e0197634. [Google Scholar] [CrossRef]
  73. Pawar, S.; Joshi, R.; Ottoor, D. Spectroscopic and molecular docking study to understand the binding interaction of rosiglitazone with bovine serum albumin in presence of valsartan. J. Lumin. 2018, 197, 200–210. [Google Scholar] [CrossRef]
  74. Ma, Y.; Acosta, D.M.; Whitney, J.R.; Podgornik, R.; Steinmetz, N.F.; French, R.H.; Parsegian, V.A. Determination of the second virial coefficient of bovine serum albumin under varying pH and ionic strength by composition-gradient multi-angle static light scattering. J. Biol. Phys. 2015, 41, 85–97. [Google Scholar] [CrossRef] [PubMed]
  75. Rout, D.; Sharma, S.; Agarwala, P.; Upadhyaya, A.K.; Sharma, A.; Sasmal, D.K. Interaction of Ibuprofen with Partially Unfolded Bovine Serum Albumin in the Presence of Ionic Micelles and Oligosaccharides at Different λex and pH: A Spectroscopic Analysis. ACS Omega 2023, 8, 3114–3128. [Google Scholar] [CrossRef] [PubMed]
  76. Sun, S.F.; Hsiao, C.L. Qualitative study of the competition of drugs in binding to serum albumin. Chromatographia 1993, 37, 329–335. [Google Scholar] [CrossRef]
  77. Shingada, S.R.; Ali, P.S.; Gandhare, N.V.; Pathan, N.B.; Ansari, N.H. Investigation of mechanistic interactions between Rifampicin and bovine serum albumin in the presence of different surfactants. J. Dispers. Sci. Technol. 2021, 44, 1075–1084. [Google Scholar] [CrossRef]
  78. Tsujino, I.; Yamazaki, T.; Masutani, M.; Sawada, U.; Horie, T. Effect of Tween-80 on cell killing by etoposide in human lung adenocarcinoma cells. Cancer Chemother. Pharmacol. 1999, 43, 29–34. [Google Scholar] [CrossRef]
  79. Pokhrel, D.R.; Sah, M.K.; Gautam, B.; Basak, H.K.; Bhattarai, A.; Chatterjee, A. A recent overview of surfactant–drug interactions and their importance. RSC Adv. 2023, 13, 17685–17704. [Google Scholar] [CrossRef]
  80. Jwalapuram, R.; Ahad, H.A.; Haranath, C.; Thadipatri, R.; Varshitha, C.V.H.; Kumar, Y.B. Solubility Enhancement of Drugs with Aid of Surfactants: Research Done Since Last Two Decades. Int. J. Life Sci. Biotechnol. Pharma Res. 2020, 5, 11–16. [Google Scholar] [CrossRef]
  81. Obata, T.; Suzuki, Y.; Ogawa, N.; Kurimoto, I.; Yamamoto, H.; Furuno, T.; Sasaki, T.; Tanaka, M. Improvement of the Antitumor Activity of Poorly Soluble Sapacitabine (CS-682) by Using Soluplus® as a Surfactant. Biol. Pharm. Bull. 2014, 37, 802–807. [Google Scholar] [CrossRef]
  82. Lo, Y.L.; Hsu, C.Y.; Huang, J.D. Comparison of effects of surfactants with other MDR reversing agents on intracellular uptake of epirubicin in Caco-2 cell line. Anticancer Res. 1998, 18, 3005–3009. [Google Scholar]
  83. Bansal, G.; Singh, M.; Jindal, K.C.; Singh, S. Characterization of Mass Ionizable Degradation Products of Gliclazide by LC/ESI-MS. J. Liq. Chromatogr. Relat. 2008, 31, 2174–2193. [Google Scholar] [CrossRef]
  84. Vargas, F.; Méndez, H.; Tropper, E.; Velázquez, M.; Fraile, G. Studies on the in vitro phototoxicity of the antidiabetes drug glipizide. In Vitr. Mol. Toxicol. 2000, 13, 17–24. [Google Scholar] [PubMed]
  85. Chou, T.-C. Preclinical versus clinical drug combination studies. Leuk. Lymphoma. 2008, 49, 2059–2080. [Google Scholar] [CrossRef] [PubMed]
  86. Piao, W.; Yoo, H.; Lee, D.K.; Hwang, H.J.; Kim, J.H. Induction of G(2)/M phase arrest and apoptosis by a new synthetic anti-cancer agent, DW2282, in promyelocytic leukemia (HL-60) cells. Biochem. Pharmacol. 2001, 62, 1439–1447. [Google Scholar] [CrossRef] [PubMed]
  87. Drabkin, D.L. The Standardization of Hemoglobin Measurement. Am. J. Med. Sci. 1949, 217, 710–711. [Google Scholar] [CrossRef] [PubMed]
  88. Rudenko, S.V. Erythrocyte morphological states, phases, transitions and trajectories. Biochim. Biophys. Acta 2010, 1798, 1767–1778. [Google Scholar] [CrossRef]
  89. Zemlianskykh, N.G. The Effect of Cryoprotective Agents on Proteins of the Erythrocyte Membrane-Cytoskeleton Complex. Biochem. (Mosc.) Suppl. B Biomed. Chem. 2021, 15, 132–138. [Google Scholar] [CrossRef]
  90. Yi, X.; Liu, M.; Luo, Q.; Zhuo, H.; Cao, H.; Wang, J.; Han, Y. Toxic effects of dimethyl sulfoxide on red blood cells, platelets, and vascular endothelial cells in vitro. FEBS Open Bio 2017, 7, 485–494. [Google Scholar] [CrossRef]
  91. Ansel, H.C.; Leake, W.F. Hemolysis of erythrocytes by antibacterial preservatives III: Influence of dimethyl sulfoxide on the hemolytic activity of phenol. J. Pharm. Sci. 1966, 55, 685–688. [Google Scholar] [CrossRef]
  92. Drvenica, I.; Mojsilović, S.; Stančić, A.; Marković, D.; Kovačić, M.; Maslovarić, I.; Rapajić, I.; Vučetić, D.; Ilić, V. The effects of incubation media on the assessment of the shape of human erythrocytes by flow cytometry: A contribution to mathematical data interpretation to enable wider application of the method. Eur. Biophys. J. 2021, 50, 829–846. [Google Scholar] [CrossRef]
  93. Khan, M.A.; Aljarbou, N.A.; Aldebasi, H.Y.; Alorainy, S.M.; Khan, A. Combination of glycosphingosomes and liposomal doxorubicin shows increased activity against dimethyl-α-benzanthracene-induced fibrosarcoma in mice. Int. J. Nanotechnol. 2015, 2015, 6331–6338. [Google Scholar] [CrossRef]
  94. Khan, I.; Joshi, G.; Nakhate, K.T.; Ajazuddin Kumar, R.; Gupta, U. Nano-Co-Delivery of Berberine and Anticancer Drug Using PLGA Nanoparticles: Exploration of Better Anticancer Activity and In Vivo Kinetics. Pharm. Res. 2019, 36, 149. [Google Scholar] [CrossRef] [PubMed]
  95. Meloni, G.; Meloni, T. Glyburide-induced acute haemolysis in a G6PD-deficient patient with NIDDM. Br. J. Haematol. 1996, 92, 159–160. [Google Scholar] [CrossRef] [PubMed]
  96. Kopicky, J.A.; Packman, C.H. The mechanisms of sulfonylurea-induced immune hemolysis: Case report and review of the literature. Am. J. Hematol. 1986, 23, 283–288. [Google Scholar] [CrossRef] [PubMed]
  97. Burden, A.C.; Samanta, A.K. Relationship of Maternal and Fetal Outcome to Glucose Tolerance During Pregnancy in Whites and Indian Asians. Diabetes Care 1990, 13, 904. [Google Scholar] [CrossRef] [PubMed]
  98. Bird, G.W.; Eeles, G.H.; Litchfield, J.A.; Rahman, M.; Wingham, J. Haemolytic anaemia associated with antibodies to tolbutamide and phenacetin. Br. Med. J. 1972, 1, 728–729. [Google Scholar] [CrossRef]
  99. Mori, Y.; Komiya, H.; Kurokawa, N.; Tajima, N. Comparison of the effects of glimepiride and glibenclamide on adipose tissue tumour necrosis factor-α mRNA expression and cellularity. Diabetes Obes. Metab. 2003, 6, 28–34. [Google Scholar] [CrossRef]
  100. Ishola, I.O.; Akataobi, O.E.; Alade, A.A.; Adeyemi, O.O. Glimepiride prevents paraquat-induced Parkinsonism in mice: Involvement of oxidative stress and neuroinflammation. Fundam. Clin. Pharmacol. 2018, 33, 277–285. [Google Scholar] [CrossRef]
  101. Bonina, F.P.; Arenare, L.; Palagiano, F.; Saija, A.; Nava, F.; Trombetta, D.; de Caprariis, P. Synthesis, stability, and pharmacological evaluation of nipecotic acid prodrugs. J. Pharm. Sci. 1999, 88, 561–567. [Google Scholar] [CrossRef]
  102. Lesnikowski, Z.J.; Paradowska, B.; Olejniczak, A.B.; Studzinska, M.; Seekamp, P.; Schüssler, U.; Gabel, D.; Shinazi, R.F.; Plesek, J. Towards new boron carriers for boron neutron capture therapy: Metallacarboranes and their nucleoside conjugates. Bioorg. Med. Chem. 2005, 13, 4168–4175. [Google Scholar] [CrossRef]
  103. Chou, T.C.; Martin, N. CompuSyn for Drug Combinations: PC Software and User’s Guide: A Computer Program for Quantitation of Synergism and Antagonism in Drug Combinations, and the Determination of IC50 and ED50 and LD50 Values; ComboSyn: Paramus, NJ, USA, 2005. [Google Scholar]
  104. Kauffman, M.K.; Kauffman, M.E.; Zhu, H.; Jia, Z.; Li, Y.R. Fluorescence-Based Assays for Measuring Doxorubicin in Biological Systems. React. Oxyg. Species 2016, 2, 432–439. [Google Scholar] [CrossRef]
  105. Seedher, N.; Kanojia, M. Mechanism of interaction of hypoglycemic agents glimepiride and glipizide with human serum albumin. Open Chem. 2009, 7, 96–104. [Google Scholar] [CrossRef]
  106. Rosenkranz, B.; Profozic, V.; Metelko, Z.; Mrzljak, V.; Lange, C.; Malerczyk, V. Pharmacokinetics and safety of glimepiride at clinically effective doses in diabetic patients with renal impairment. Diabetologia 1996, 39, 1617–1624. [Google Scholar] [CrossRef] [PubMed]
  107. Dills, D.G.; Schneider, J. Clinical evaluation of glimepiride versus glyburide in NIDDM in a double-blind comparative study. Glimepiride/Glyburide Research Group. Horm. Metab. Res. 1996, 28, 426–429. [Google Scholar] [CrossRef] [PubMed]
  108. Draeger, K.E.; Wernicke-Panten, K.; Lomp, H.J.; Schüler, E.; Rosskamp, R. Long-term treatment of type 2 diabetic patients with the new oral antidiabetic agent glimepiride (Amaryl): A double-blind comparison with glibenclamide. Horm. Metab. Res. 1996, 28, 419–425. [Google Scholar] [CrossRef]
  109. Joy, N.G.; Tate, D.B.; Davis, S.N. Counterregulatory responses to hypoglycemia differ between glimepiride and glyburide in non diabetic individuals. Metabolism 2015, 64, 729–737. [Google Scholar] [CrossRef]
  110. Mocanu, M.M.; Maddock, H.L.; Baxter, G.F.; Lawrence, C.L.; Standen, N.B.; Yellon, D.M. Glimepiride, a novel sulfonylurea, does not abolish myocardial protection afforded by either ischemic preconditioning or diazoxide. Circulation 2001, 103, 3111–3116. [Google Scholar] [CrossRef]
Figure 1. Effect of drug concentrations and Tween-80 on particle size distribution. Experiments were conducted in PBS (pH 7.4) at 37 °C, with 0.5% DMSO and 4.5 mg/mL BSA. This study examined 100–500 µM GLIM without Tween-80 (a,b); 300 µM GLIM with 0.0125–0.1% Tween-80 (c,d); and 100–500 µM CHLO with 0.05% Tween-80 (e,f). Size distribution histograms for GLIM samples in PBS alone and with 0.05% Tween-80, along with detailed DLS results, are provided in the Supplementary Materials (Figures S3–S5). Concentrations reported are expected concentrations (Cexp), based on the total drug added. This preliminary experiment was conducted once (n = 1) to evaluate feasibility; additional replicates are needed to confirm findings and ensure reproducibility.
Ijms 26 01429 g001
Figure 2. Impact of BSA and Tween-80 on observed drug concentrations (Cobs) determined by HPLC using different separation techniques. Cobs of GLIM under varying conditions (ad); Cobs of CHLO (e,f). In each panel, Tween-80(–) indicates the absence and Tween-80(+) the presence of the surfactant, while BSA(–) denotes the absence and BSA(+) the presence of the protein. The results are expressed as mean ± SD (n = 3).
Ijms 26 01429 g002
Figure 3. Effect of Tween-80 on the viability of MCF-7 breast cancer cells (a) and on the cytotoxicity of co-administered drugs (b). Cells were exposed to the compounds for 72 h. Results are presented as means ± SD (n = 3). *, p < 0.05 vs. Tween-80 alone; ***, p < 0.001 vs. Tween-80 alone.
Ijms 26 01429 g003
Figure 4. Heat maps illustrate the effects of combined treatment on the survival of MCF-7 cells (a) and the synergistic effects observed for these treatments (b). In the CI heat map, green indicates very strong synergy (CI < 0.1), strong synergy (0.1 ≤ CI < 0.3), and synergy (0.3 ≤ CI < 0.9), white indicates additive effects (0.9 ≤ CI < 1.1) and red indicates weak antagonism (1.1 ≤ CI < 1.2), moderate antagonism (1.2 ≤ CI < 1.45), and antagonism (CI > 1.45). Detailed information, including median effect plots and CI values, can be found in the Supplementary Materials (Figures S9–S12).
Ijms 26 01429 g004
Figure 5. Heat maps illustrate selected drug combinations’ effects on cell panel viability (ac) and the synergistic effects observed for these treatments (df). For CHLO, which did not achieve an IC50 below 500 µM, three successive drug dilutions were applied. In the CI heat maps, green indicates very strong synergism (CI < 0.1), strong synergism (CI < 0.3), and synergism (CI < 0.9). White indicates additive effects (0.9 < CI < 1.1), while red indicates weak antagonism (1.1 < CI < 1.2), moderate antagonism (1.2 < CI < 1.45), antagonism (1.45 < CI < 3.3), strong antagonism (3.3 < CI < 10), and very strong antagonism (CI > 10). Cells marked in yellow indicate dose combinations selected for the cell cycle studies discussed in the next section. Additional information on cytotoxicity and CI values can be found in the Supplementary Materials (Figures S13–S15).
Ijms 26 01429 g005aIjms 26 01429 g005b
Figure 6. Cell cycle phase distribution analysis in A549 (a), HepG2 (b), MCF-7 (c), and U-87MG (d) cells following treatment with single drugs and combinations for 72 h, assessed by propidium iodide staining and flow cytometry. Results are expressed as the mean ± SD (n = 3). *, p < 0.05 vs. CTRL; **, p < 0.01 vs. CTRL; ***, p < 0.001 vs. CTRL; #, p < 0.05 vs. 0.25 IC50 DOXO; ##, p < 0.01 vs. 0.25 IC50 DOXO. Detailed data can be found in the Supplementary Materials (Figure S16).
Ijms 26 01429 g006
Figure 7. Effects of selected SUs on intracellular DOXO accumulation in A549 (a), HepG2 (b), HMEC-1 (c), HUH7 (d), MCF-7 (e), and U-87MG cells (f). Cells were treated with 50 µM DOXO and various concentrations of SUs (from 0.78 to 50 µM) for 3 h. Intracellular DOXO levels were measured by fluorometry and are expressed as a percentage relative to the control (DOXO alone). The bars represent the mean ± SD (n = 3). *, p < 0.05 vs. control; **, p < 0.01 vs. control; ***, p < 0.001 vs. control.
Ijms 26 01429 g007
Figure 8. Percentage of hemolysis caused by SUs, naïve DOXO, and their combinations after 4 h of incubation at RT under open-air conditions (a). Microscopic images showing the impact of the drugs and their combinations on RBCs after 15 min of incubation at RT in open-air conditions (bf). The negative control (CTRL−) is untreated blood in PBS, while the positive control (CTRL+) is blood incubated in deionized water. Each experimental sample contains 0.5% DMSO, except for the control samples. The bars represent the mean ± SD (n = 3). ***, p < 0.0001 vs. CTRL− ###, p < 0.0001 vs. 0.5% DMSO.
Ijms 26 01429 g008
Figure 9. Therapeutic efficacy of DOXO alone and in combination with GLIM against 4T1 breast cancer in vivo. Tumor growth curves (a) and body weight changes (b) in BALB/c mice bearing 4T1 tumors. Beginning nine days after tumor inoculation, mice with well-developed tumors were treated with either monotherapies or combination therapy. GLIM was administered intraperitoneally (i.p.) at 4 mg/kg, and DOXO was administered intravenously (i.v.) at 5 mg/kg. Both treatments were given simultaneously on days 9, 11, 14, 17, and 21, as indicated by the arrows in the figure. Tumor volume and body weight were measured daily for the first 8 days and then three times per week. Data are presented as mean ± SD (n = 5–6). *, p < 0.05 vs. CTRL; **, p < 0.01 vs. CTRL; ***, p < 0.001 vs. CTRL; #, p < 0.05 vs. DOXO; ##, p < 0.01 vs. DOXO 5 mg/kg (i.v.); ###, p < 0.001 vs. DOXO 5 mg/kg (i.v.).
Ijms 26 01429 g009
Figure 10. Effects of Tween-80 on GLIM aggregation in the absence and presence of BSA, and potential in vitro implications. Panel (a) illustrates aggregation parameters as a function of mixture composition, with initial and final values indicated. a Changes observed within the range of 0–500 µM GLIM; b changes observed within the range of 100–500 µM GLIM; c at GLIM concentrations exceeding 200 µM, the contribution of the BSA fraction became negligible; d initial and maximum values on the curve are provided. INT%—the relative contribution of specific size distributions to the total scattered light intensity in the sample. Panel (b) illustrates the potential implications of these findings for in vitro studies.
Ijms 26 01429 g010
Table 1. Summary of IC50 values for SUs determined by MTT assays.
Drug NameIC50 Value in Specific Cell Line (µM)
A549HepG2HMEC-1HuH7MCF-7U-87MG
2nd-generation SUs
GLIM367.7 ± 16.4179.6 ± 21.6135.5 ± 5.1475.8 ± 7.0180.3 ± 7.6189.4 ± 14.8
GLIQ259.1 ± 16.339.6 ± 2.6156.6 ± 2.2400.7 ± 2.268.8 ± 2.557.1 ± 1.8
GLIC 419.3 ± 53.2447.7 ± 2.3n.d.n.d.
GLIB 46.1 ± 1.0248.0 ± 3.6493.2 ± 1.386.6 ± 3.2
GLIP 228.8 ± 10.9454.1 ± 1.8421.9 ± 0.5339.0 ± 18.8
1st-generation SUs
CARB 70.7 ± 1.4n.d.n.d.n.d.
CHLOn.d.480.3 ± 54.1218.2 ± 1.6n.d.n.d.n.d.
TOLA 469.8 ± 12.4468.6 ± 0.5n.d.n.d.
TOLB 232.2 ± 21.688.2 ± 4.1n.d.460.9 ± 53.9
Other compounds
MESU 63.1 ± 0.378.3 ± 2.4n.d.495.9 ± 0.8
DOXO0.27 ± 0.020.30 ± 0.010.08 ± 0.010.28 ± 0.020.46 ± 0.060.57 ± 0.11
n.d.—Not determinable; indicates that the compound did not achieve the IC50 value within the range of concentrations tested. Results are presented as means ± SD (n = 3).
Disclaimer/Publisher’s Note: The statements, opinions and data contained in all publications are solely those of the individual author(s) and contributor(s) and not of MDPI and/or the editor(s). MDPI and/or the editor(s) disclaim responsibility for any injury to people or property resulting from any ideas, methods, instructions or products referred to in the content.

