Abstract
Adaptive thermogenesis comprises shivering thermogenesis dependent on skeletal muscles and non-shivering thermogenesis (NST) mediated by uncoupling protein 1 (UCP1). Although the thermogenic function of UCP1 was adopted early in some placental mammals, positive selection predominantly occurred in the ancestral branches of small-bodied species. Some previous studies have revealed that rodents living in northern or high mountain regions adapt to cold environments by increasing NST, whereas those living in tropical and subtropical regions that are not exposed to cold stress express low concentrations of UCP1, indicating that UCP1 may have evolved to adapt to ambient temperatures. In this study, we explored the evolution of UCP1 and its significance to temperature adaptation by performing detailed evolutionary and statistical analyses on 64 rodents with known genomes. As a result, a total of 71 UCP1 gene sequences were obtained, including 47 intact genes, 22 partial genes, and 2 pseudogenes. Further, 47 intact genes and 3 previously published intact UCP1 genes were incorporated into evolutionary analyses, and correlation analyses between evolutionary rate and ambient temperatures (including average annual temperature, maximum temperature, and minimum temperature) of the rodent survives were conducted. The results show that UCP1 is under purifying selection (ω = 0.11), and among rodents with intact UCP1 sequences, Urocitellus parryii and Dicrostonyx groenlandicus—the two species with the lowest ambient temperatures among the rodents used here—have higher evolutionary rates than others. In the statistical analyses, in addition to ambient temperatures, body weight and weight at birth were also taken into account since weight was previously proposed to be linked to UCP1 evolution. The results showed that after controlling for the phylogenetic effect, the maximum temperature was significantly negatively correlated with the evolutionary rate of UCP1, whereas weight did not have a relationship with UCP1 evolutionary rate. Consequently, it is suggested that ambient temperature can drive the evolution of rodent UCP1, thereby enhancing NST adaptation to cold stress.
1. Introduction
Adaptive thermogenesis is generally divided into shivering thermogenesis (ST), which depends on skeletal muscles, and non-shivering thermogenesis (NST), which relies on brown adipose tissue (BAT) [1]. BAT takes charge of producing heat under cold stress through NST, and it is unique to mammals [2,3]. This tissue is rich in small-bodied species and neonates of large-bodied species [4], and it plays an essential role in maintaining high body temperature [2,5] or in facilitating rewarming after hibernation [1], which enables them to exploit cold environments. In some mammals (e.g., rodents), NST increasingly functions as a substitution for shivering thermogenesis when they are repeatedly subject to cold stress [6]. Uncoupling protein 1 (UCP1), a carrier protein with cold-inducible expression, is highly expressed in the mitochondria of BAT, and it governs the mechanism of NST by boosting the proton leakage in mitochondria, releasing the oxidation energy into heat [2].
The evolutionary rate of UCP1 in mammals is greater than that of other vertebrates (fish and amphibians) [7,8]. Some studies investigated the selective pressure imposed on eutherian branches with intact UCP1 sequences and found that UCP1 was under strong selection and coincided with keeping the adaptive function [5], agreeing with the suggestion that UCP1 plays a fundamental role in dealing with cold stress in eutherians [9,10,11]. Chronic cold stress stimulates BAT proliferation and activity [12]. Notably, although placental mammals recruited UCP1 for the thermogenic function in an early period, positive selection signatures are detected in the ancestral branches of both Glires (rodents and lagomorphs) and Afroinsectivores, respectively, indicating the critical role of UCP1 in these groups on thermogenesis [7]. Some studies investigated the thermogenesis of small-sized mammals and found that rodents living in northern or high mountain regions adapted to cold stress by increasing NST [13], whereas rodents living in tropical and subtropical regions that are not subjected to cold stress showed a low concentration of UCP1 in their mitochondria of BAT [6,13]. These results suggest that UCP1 may have evolved to respond to the changes of ambient temperature.
Uncoupling protein 1 can function in thermogenesis induced by cold or diet and body temperature maintenance, and it also has a significant impact on metabolism and energy balance [14,15,16]. The link between UCP1 evolution and body temperature, UCP1 evolution and body weight varies across species. For example, Gagnon et al. [17] explored the genetic variation of UCP1 in the population of savannah monkeys and found that the majority of derived allele frequencies correlated with solar irradiance but not overall low temperatures. In horses, it was reported that serum UCP1 concentration had no relationship with body weight [18]. However, in adult goats and growing kids, a negative correlation was suggested between rectal temperature and UCP1 concentration [16,18]. UCP1 and its orthologs not only exist in placental mammals but it is also identified in ectothermic animals [19]. In the common carp (Cyprinus carpio), the concentration of UCP1 is rich in the liver and less so in the kidneys [20]. Although the expression of UCP1 in murine brown fat was up-regulated when exposed to cold conditions [21,22], the expression of common carp hepatic UCP1 was lower at 8 °C when compared with those acclimated at 20 °C [23]. Similar results were detected in gilthead sea bream (Sparus aurata), with a lower level of hepatic expression in winter than in summer and autumn [20,24]. The distinct responses of UCP1 between mammals and ectothermic animals during cold exposure may be attributed to the different expressed tissues of UCP1 in these two kinds of animals. In mammals, UCP1 is highly expressed in brown adipocytes, but in carp, UCP1 is not found in adipose tissues, which indicates the potentially functional discrepancy between placental mammals and fish [20,23].
Uncoupling protein 1 is mainly expressed in small-sized mammals [25], and the dependence of some mammals on UCP1 for heat production may have begun to decrease or diminish as body weight increased [9,26]. For example, UCP1 merely momentarily appeared in the BAT of neonatal cattle [27] and pre-weaned harp seals (Pagophilus groenlandicus) [28], and it is also reported that in some larger-bodied animals (such as humans), BAT is present in neonates and disappears in adults [25]. This is also supported by the suggestion that body size is inversely related to NST capacity [1] and that UCP1 in eutherian mammals with higher body weight at birth tended to be pseudogenized [29]. In addition, in marine mammals, the pseudogenization of UCP1 is presumed to link with large body size (such as in elephant seals) [29,30], and lifestyle can affect UCP1 evolution to some extent, with UCP1 in most semiaquatic species (e.g., the harbor seal and Antarctic fur seal) being under strong selective pressure while being lost in fully aquatic mammals [29].
In sum, UCP1 evolution may primarily be driven by ambient temperature and body size. In previous studies, Gaudry et al. [5] demonstrated that the inactivation of UCP1 was a historical contingency in some mammals and among the 141 vertebrates used 22 rodents were included; meanwhile, Mendes et al. [7] investigated the evolution of UCP1 in 252 vertebrates (19 were rodents) and found that the evolutionary rate of UCP1 was increased in mammalians when compared with that of other UCPs. Of the rodents sampled in these two studies, 18 species are overlapped, and the sample size is small. At present, with the advances in sequencing technology, more and more genome data are accumulated, which provides the opportunity to investigate the evolution of UCP1 in rodents. In addition, data on ambient temperatures and body weight are convenient to obtain. Thus, exploring the relationship between the evolutionary rate of UCP1 and ambient temperature in rodents can be realized; and since it is suggested that UCP1-dependent thermogenesis may decrease with increasing body size, we will also examine the relationship between evolutionary rate of UCP1 and body weight. Therefore, in this study, we selected rodents as the research objects, and the aims are 1. to investigate the evolution of UCP1 and 2. to explore whether ambient temperature and body weight are related to the evolutionary rate of UCP1, by collecting rodent genomes and their related ambient temperatures and body weights as much as possible.
2. Results
2.1. Data Collection
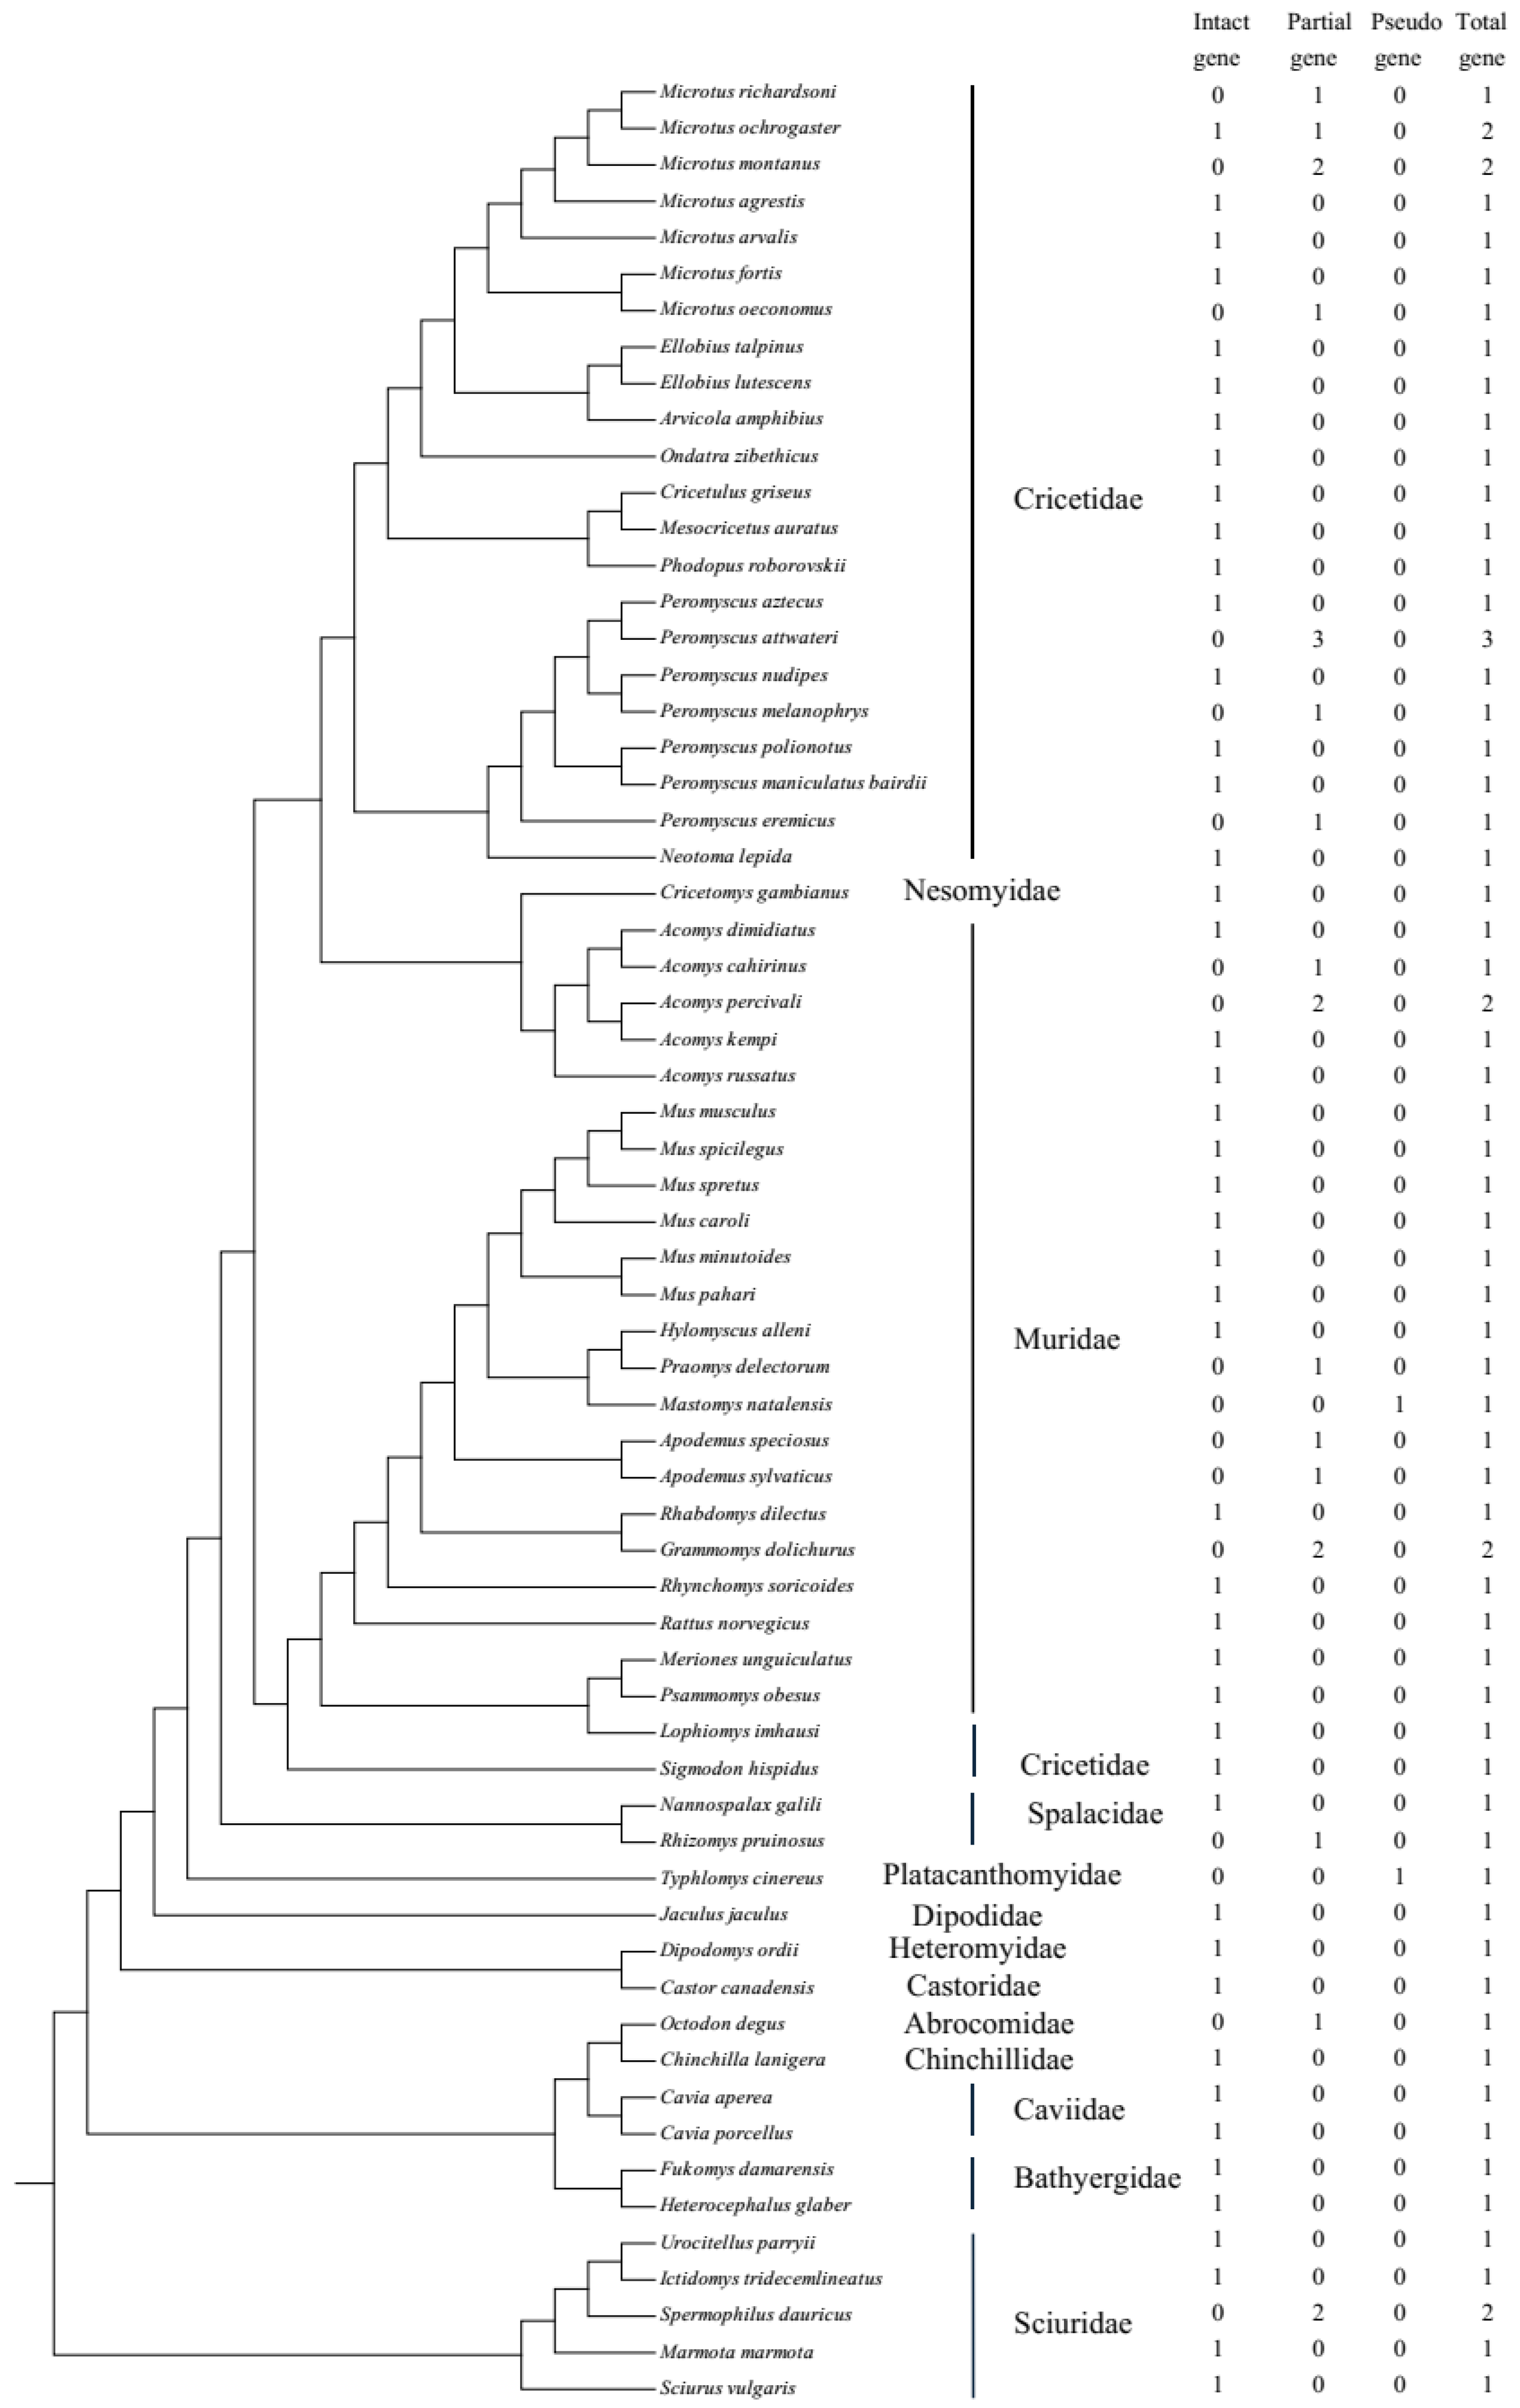
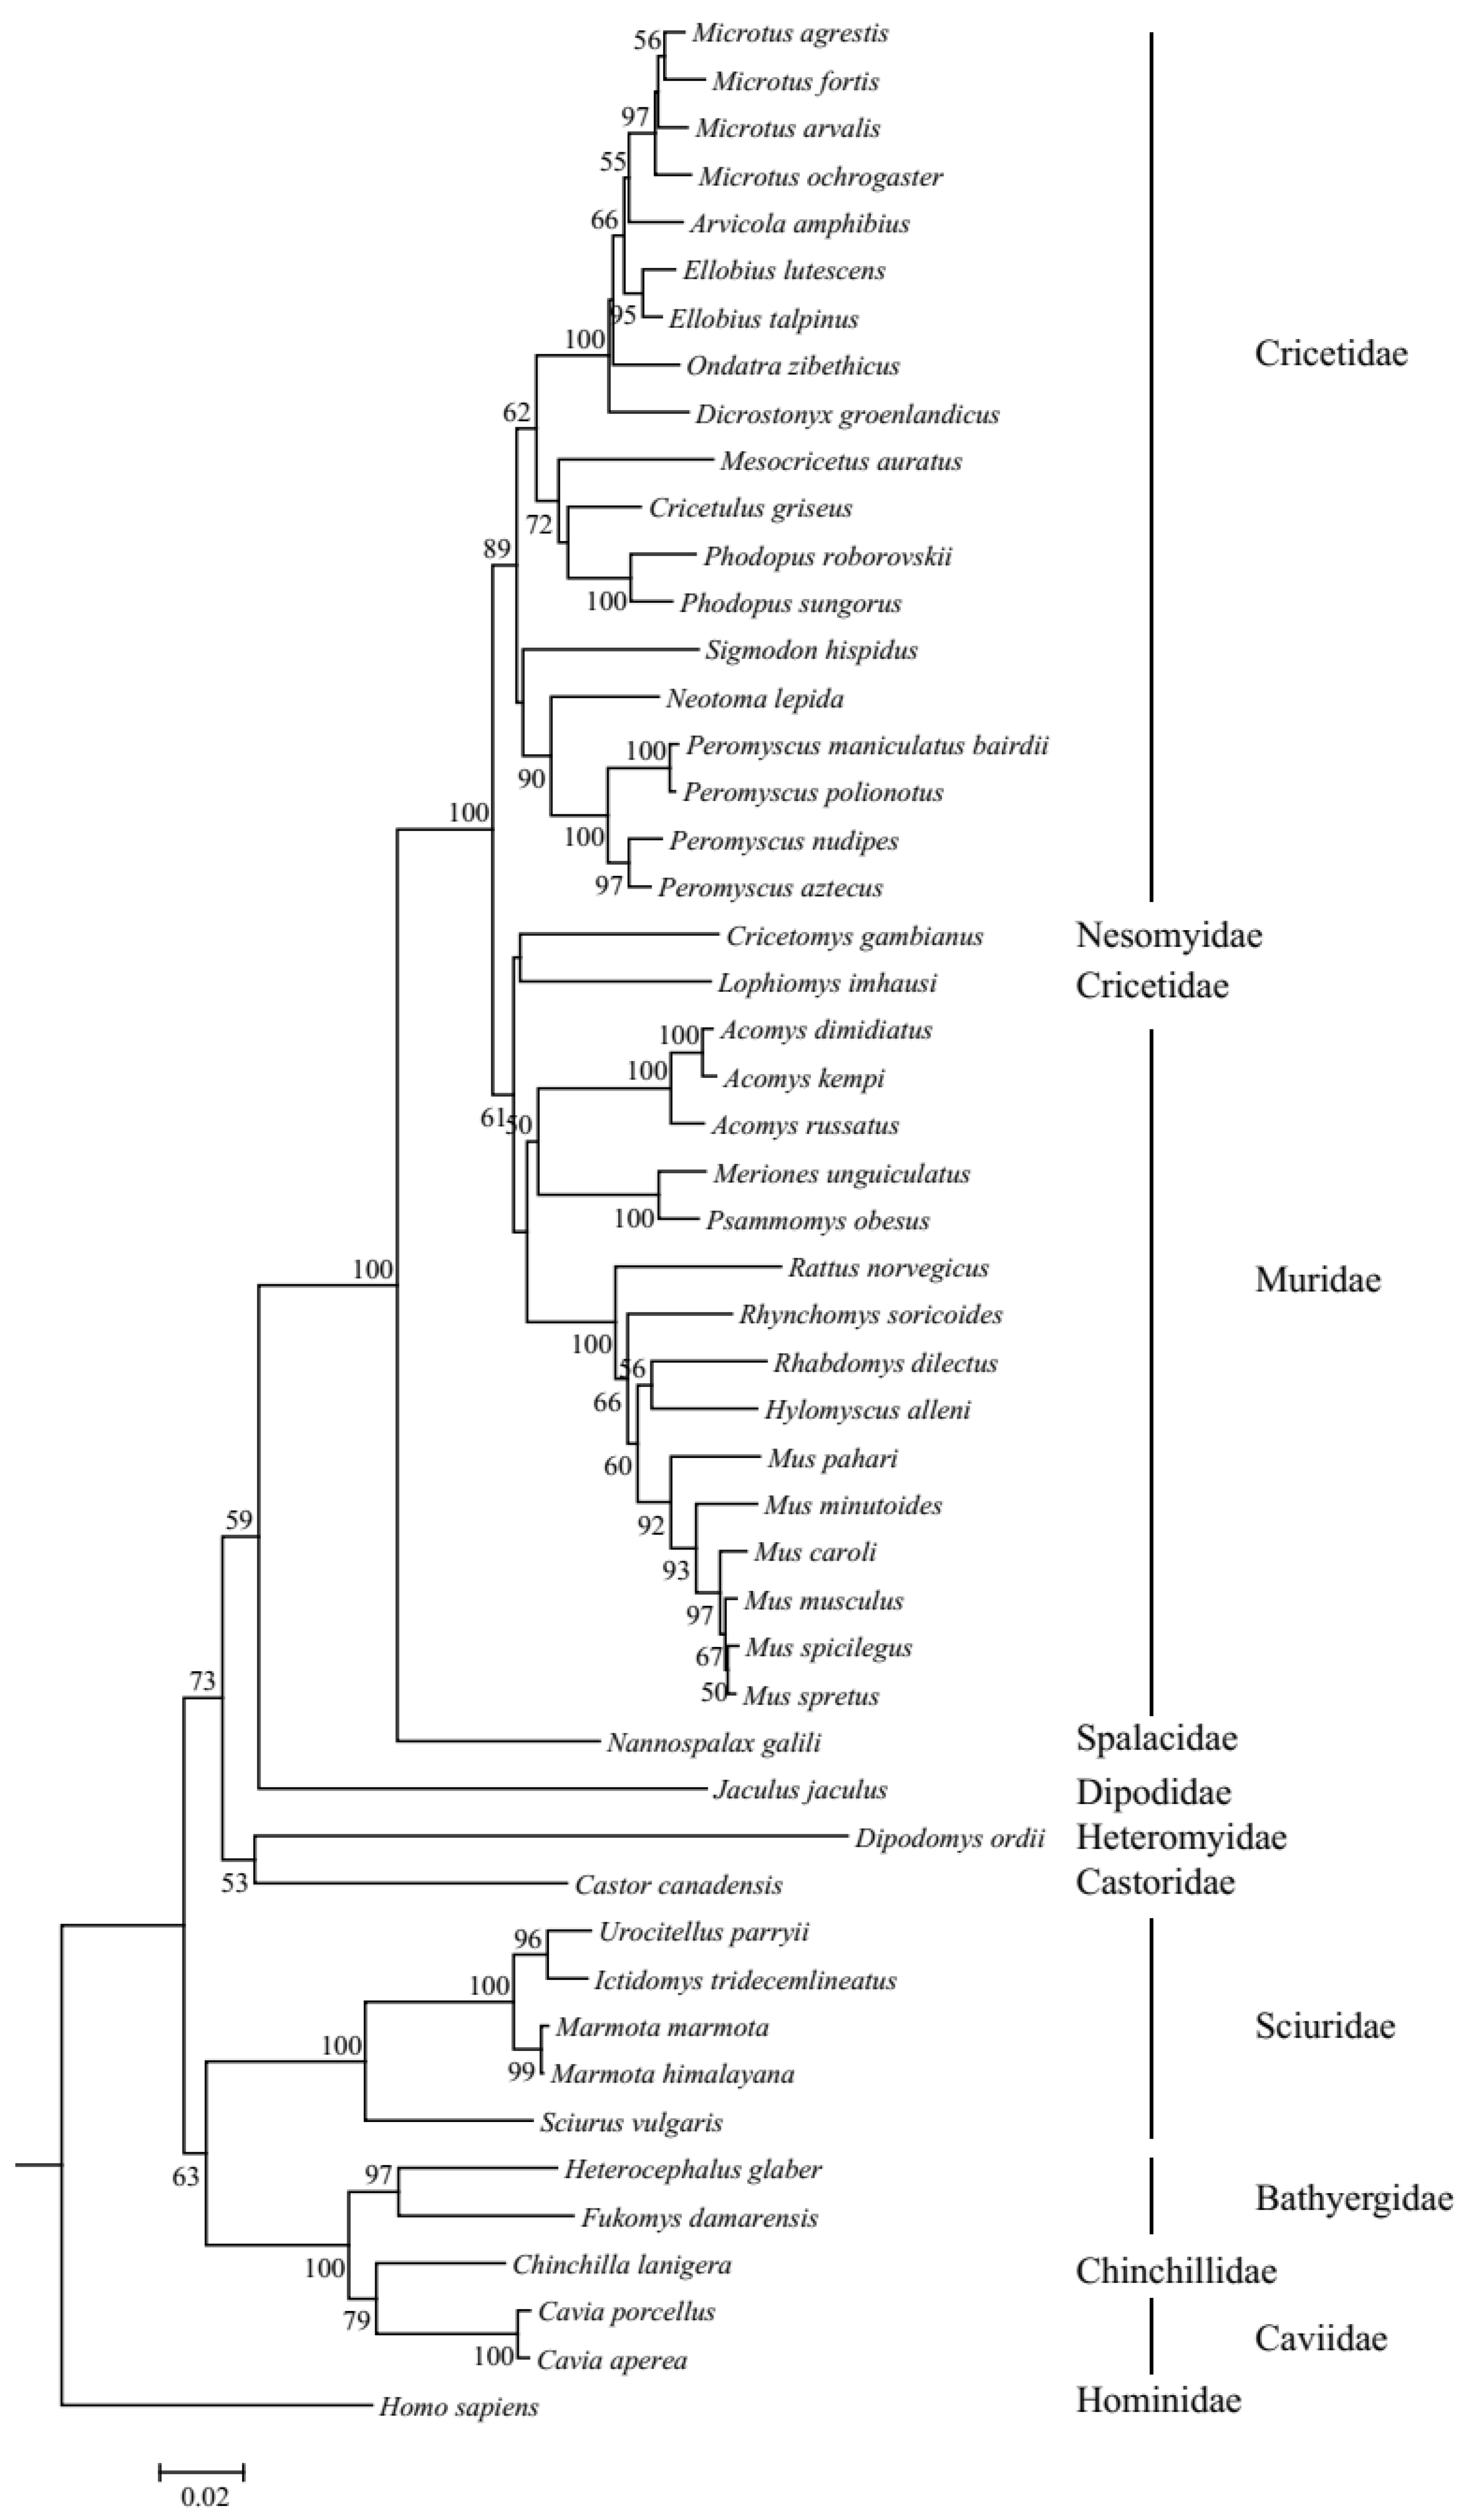
Sixty-four genomes of rodents from 13 families were downloaded, with the genome coverage from 1× to 8356.0× (two species had no genome coverage data) and contig N50 from 1 kb to 122.6 Mb (please see Table S1). After searching against 64 publicly available rodent genomes, 71 UCP1 gene sequences were obtained, including 47 intact genes, 22 partial genes, and 2 pseudogenes, and this distribution is displayed in Figure 1, with the phylogenetic tree referring to Alvarez-Carretero et al. [31]. The UCP1 gene obtained from rodents consists of six exons with a total length of 924 bp, and “Ns” (i.e., unsequenced nucleotide) in exon6 of Microtus oeconomus UCP1 was detected, which is due to either incomplete genome sequencing or poor genomic assembly in this region, whereas in Jaculus jaculus, a 3 bp insertion exists in exon1. In general, a rodent species has only one intact UCP1, if any; some species have more than one partial gene because gene fragments are identified in different scaffolds (Table S2). For example, in Grammomys dolichurus, exon5/6 and exon2/3 are from two scaffolds, respectively; thus, they are assumed to originate from two genes. In Microtus montanus and Acomys percivali, exon1/2/5/6 and exon3/4 are from two scaffolds, while in Apodemus sylvaticus, exon1/2/6 and exon3/4/5 are from two scaffolds; considering that these exons of the three species may be mismatched on different scaffolds, we tried to concatenate them by the order exon1-exon6 and found that they were either intact genes or pseudogenes, and it was hard to judge whether they were correct or not. Thus, we still viewed them as partial genes. As for the pseudogenes, Mastomys natalensis and Typhlomys cinereus each had one pseudogene, with 1 bp deletion in exon2 and 1 bp insertion in exon5, respectively. In addition, three intact UCP1 sequences (accession Nos. AF515781.1, AF271263.1, and MT114186.1) were downloaded from NCBI and then added into the intact gene mentioned above; thus, in total, 50 intact UCP1 genes were obtained and would be applied to the following phylogenetic tree reconstruction and selective analyses. All the intact sequences used in this study are listed in Supplementary Text S1.
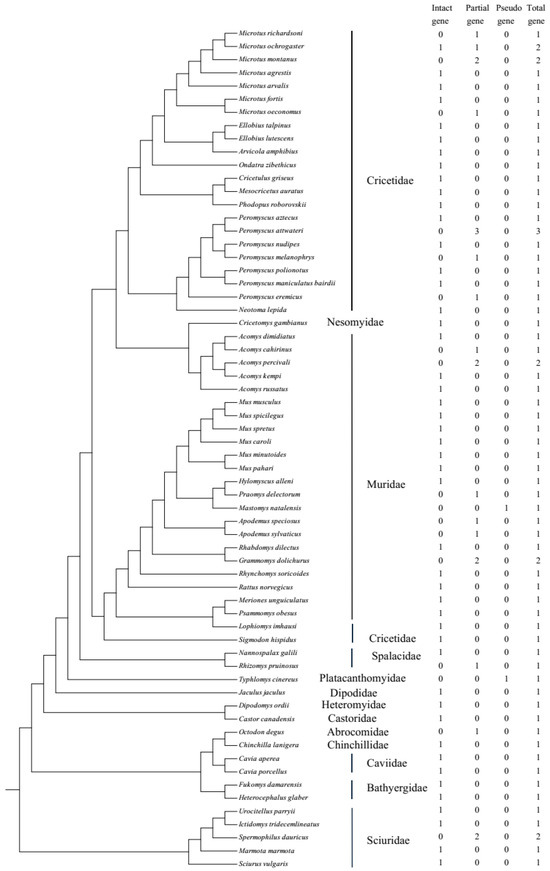
Figure 1.
The distribution of the UCP1 gene in rodents used in this study.
The resulting phylogenetic tree of UCP1 genes revealed that the ML tree (Figure S1) and NJ tree (Figure 2) were inconsistent in several species. Specifically, in the ML tree, Lophiomys imhausi, a species of Cricetidae, was mixed with species of the Muridae group; meanwhile, in the NJ tree, Lophiomys imhausi clustered with Cricetomys gambianus to form a sister group to the Muridae group. In addition, the position of the Sciuridae group is also different between the ML tree and NJ tree. Due to the fact that the bootstrap values of the NJ tree are higher than those of the ML tree, we used the NJ tree as the guide tree for the following selective analyses. The topology of the NJ tree is different from the tree shown in Figure 1, especially in the inner topology of the Cricetidae group, and this difference may be caused by incomplete lineage sorting [32,33]. The ambient temperatures that rodents survive vary frequently; thus, we collected them as average temperature, maximum temperature, and minimum temperature by primarily referring to Alhajeri et al. [34]; in brief, average temperature means average annual temperature and maximum temperature and minimum temperature refer to the highest temperature of the warmest month and the lowest temperature of the coldest month, respectively. As for the species that have no ambient temperature in Alhajeri et al. [34], Cavia porcellus’s temperature data were gathered from Animal Diversity Web (https://animaldiversity.org (accessed on 5 May 2023)), while Nannospalax galili’s data were collected from Sumbera et al. [35], though the average temperatures were absent in them. Body weights were mainly collected from Alhajeri et al. [34], in AnAge: The Animal Ageing and Longevity Database (https://genomics.senescence.info/species/index.html (accessed on 5 May 2023)), and sometimes from Animal Diversity Web and other sources (Table S3). Weights at birth were also collected, and they were from AnAge: The Animal Ageing and Longevity Database. In total, the weight at birth of 32 species was gathered. The data and references for temperature, body weight, and weight at birth are listed in Table S3.
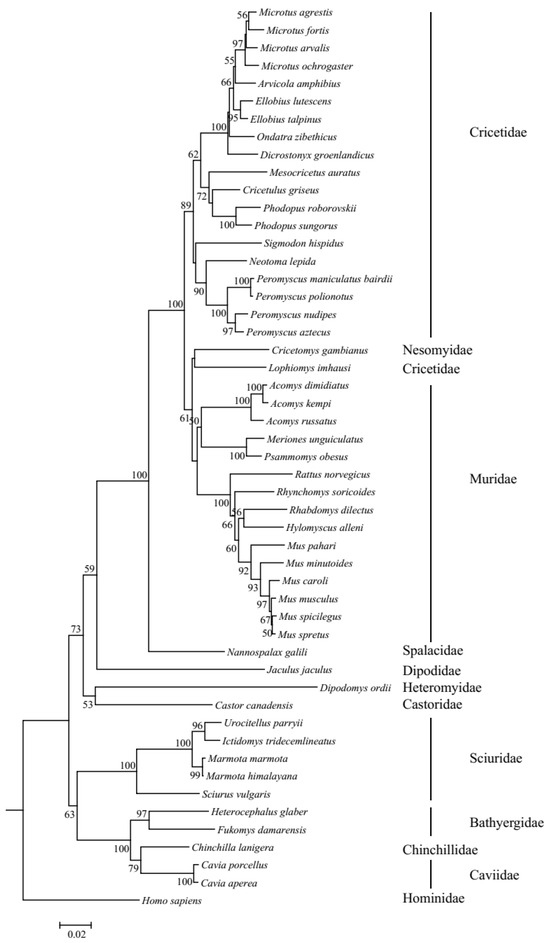
Figure 2.
NJ tree of UCP1 genes in rodents. Bootstrap value < 50 is not shown.
2.2. Selective Pressure Analyses on UCP1 Gene
The branch analyses implemented in Paml4 software allow the generation of different ω values for distinct branches in a given phylogenetic tree. The acquisition of BAT-mediated NST is related to the rodent UCP1 gene, which promotes the occurrence of futile cycles in the BAT mitochondria and the release of metabolic heat [36,37]. Hence, through the comparison of the obtained ω values, it is possible to evaluate the selective forces operating along different branches of rodents. In the selective analyses, the results showed that the ω value for Model0 (one ratio) was 0.11, and the comparison between Model0 (one ratio) and Model0 (ω = 1) suggested that Model0 (one ratio) fitted the dataset better (p < 0.05), indicating that the UCP1 gene was subject to purifying selection in rodents. In addition, comparative analyses of the three pairs of site models M1a vs. M2a, M7 vs. M8, and M8 vs. M8a revealed that no positively selected sites existed in UCP1 genes. Results are summarized in Table 1.

Table 1.
Selective pressure analyses of UCP1 gene in rodents.
In our free-ratio analyses, the results showed that the UCP1 sequences of most species were subject to strong purifying selection, with ω being small (Table S3). However, it is necessary to point out that the ω of UCP1 in Acomys dimidiatus was 999, which is due to the zero synonymous substitution rate in this gene; thus, ω of Acomys dimidiatus UCP1 was discarded in the subsequent statistical analyses. DN/ds for Urocitellus parryii, Cavia porcellus, and Peromyscus maniculatus bairdii was 0.61, 0.44, and 0.39, respectively, larger than that of many of the species used in this study. Considering that these species inhabit cold environments or occupy a wide range of thermal niches, we wonder whether the ω of the UCP1 gene is correlated with the ambient temperature of the habitat. It is worth mentioning that, among the species surveyed here, Urocitellus parryii and Dicrostonyx groenlandicus can survive under extreme cold conditions, which is different from other rodents. Therefore, to investigate whether the evolution of the Urocitellus parryii and Dicrostonyx groenlandicus UCP1 gene sequences is different from that of other species, a two-ratio model (Model A) analysis was conducted by assigning the branches leading to these species as the foreground branch with the rest as the background branch. The results showed that UCP1 of Urocitellus parryii and Dicrostonyx groenlandicus exhibited a nearly two-fold increment in the ω value in comparison with other rodents’ counterparts (ω1 = 0.28 vs. ω2 = 0.11, p < 0.05), suggesting an accelerated evolution of the UCP1 gene in Urocitellus parryii and Dicrostonyx groenlandicus. A further test was carried out to examine whether the foreground branches were under relaxed selection or not using Relax (www.datamonkey.org/RELAX (accessed on 3 June 2023)) [38], and the test found that selection relaxation (K = 0.47) was significant (p = 0.044, LR = 4.04).
2.3. Correlation Between Evolutionary Rate and Temperature, Evolutionary Rate and Body Weight
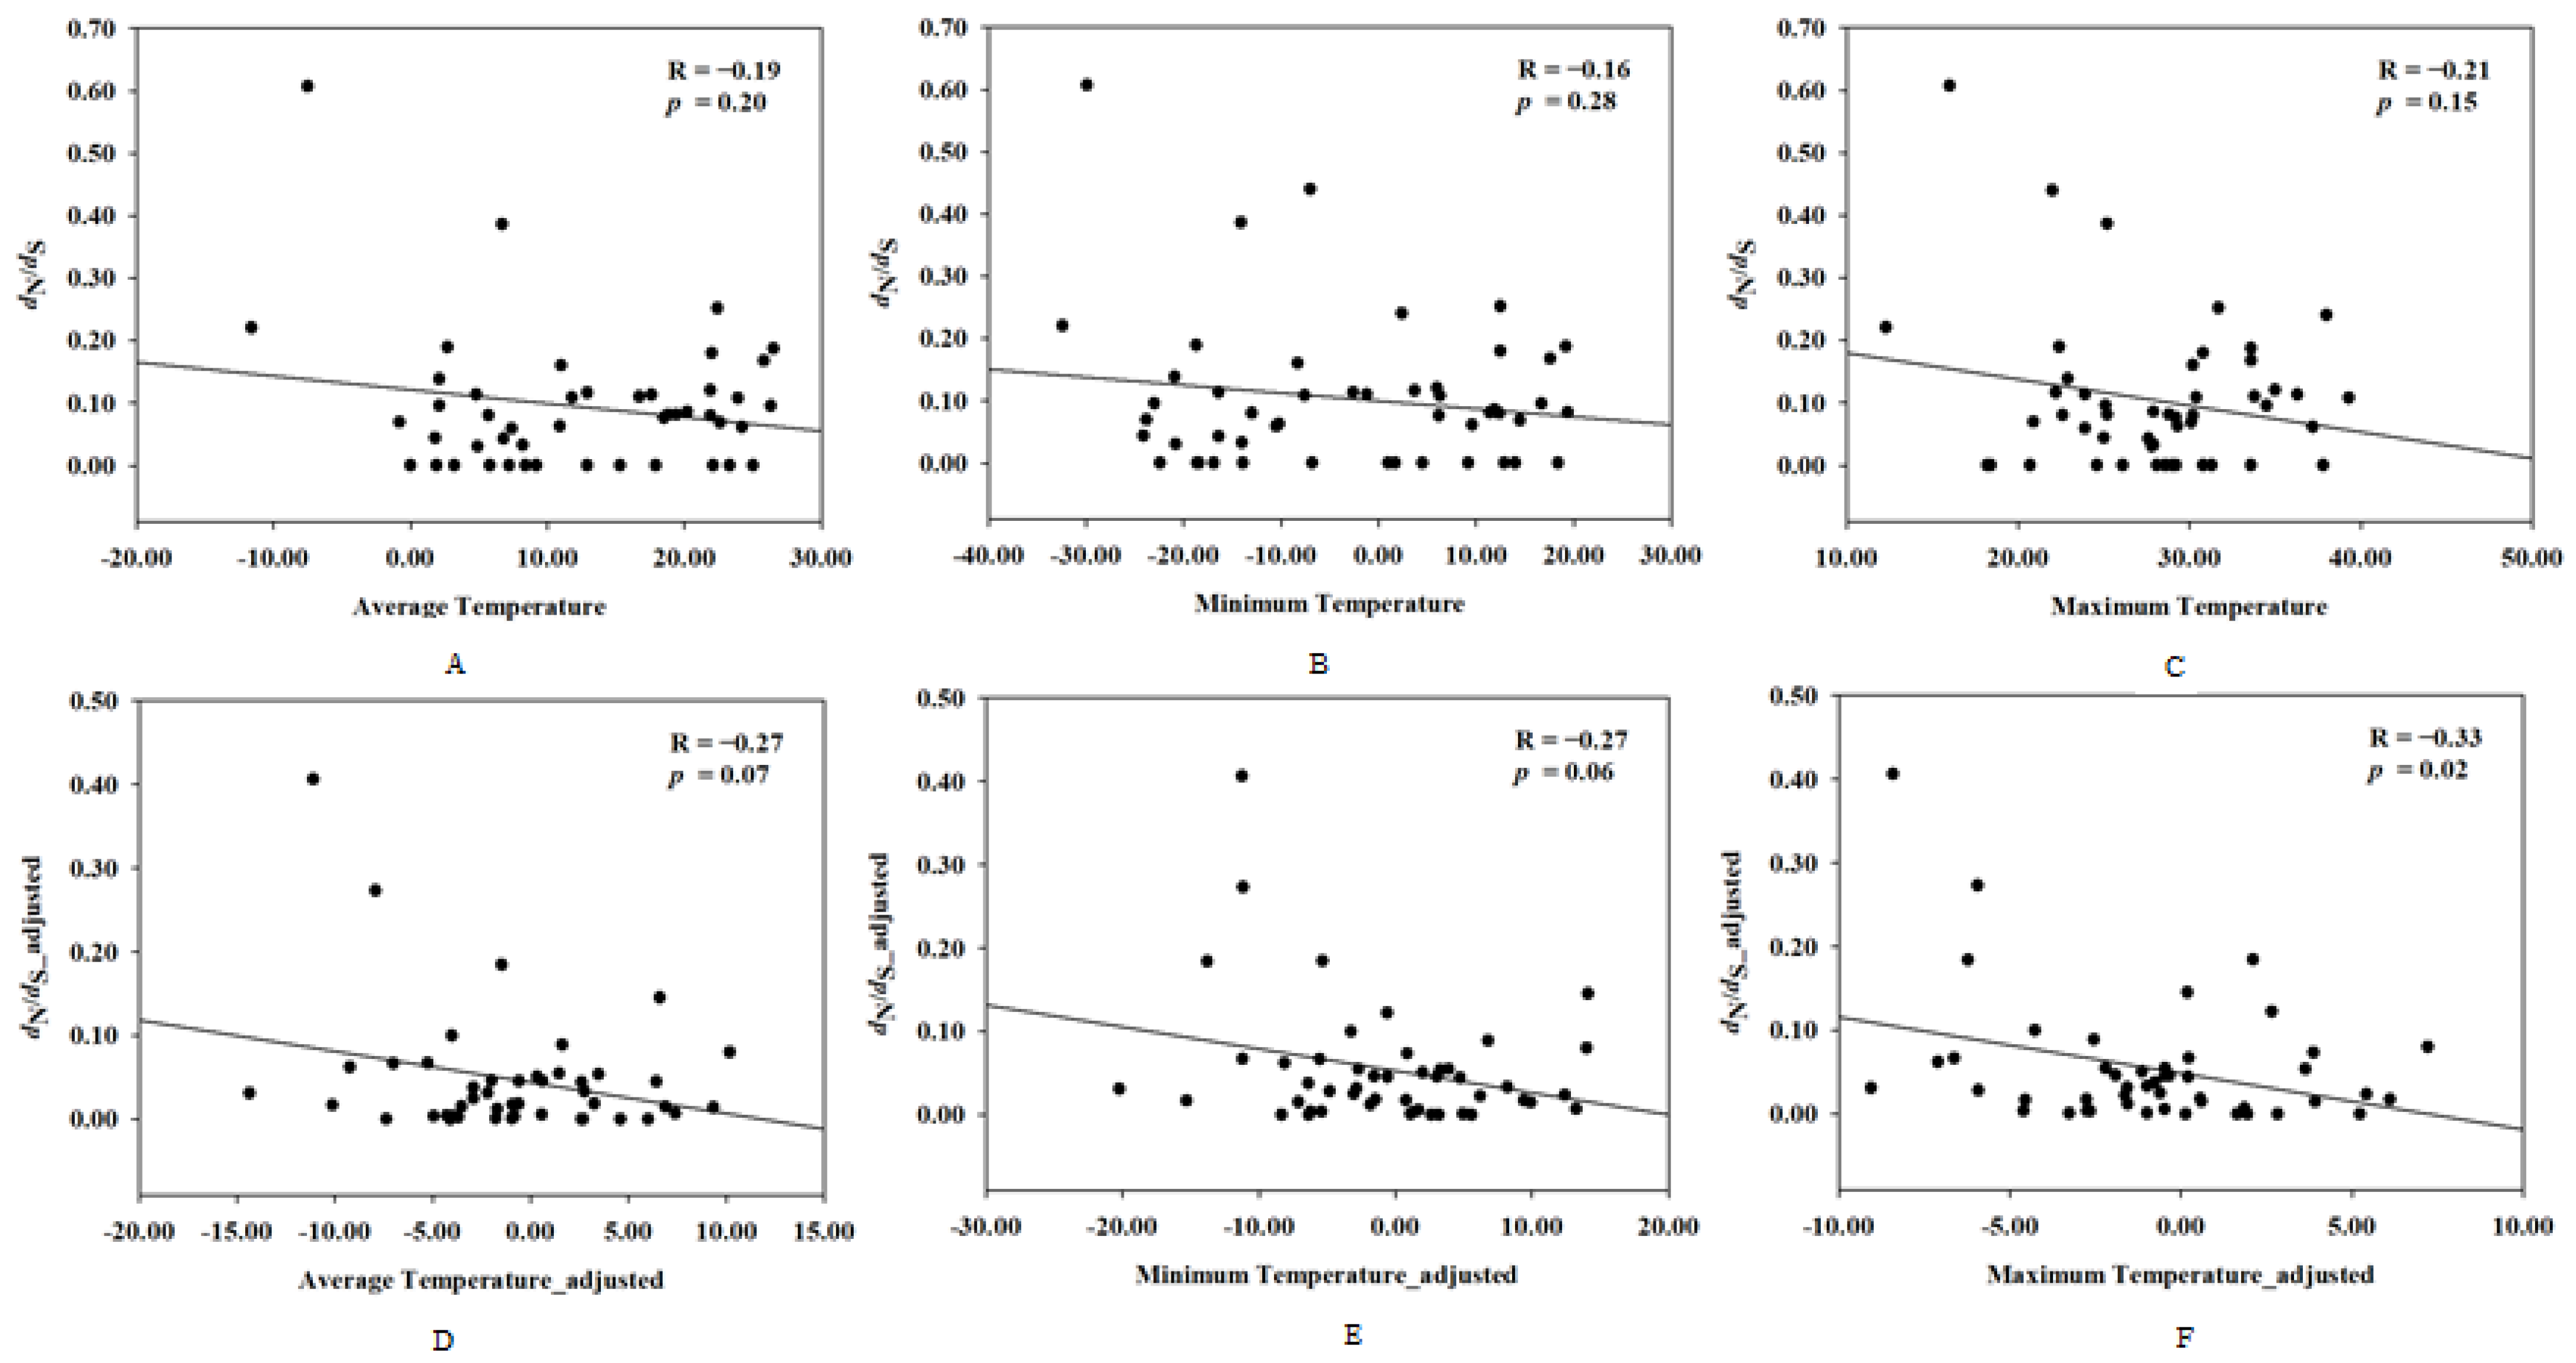
To investigate the correlation between the evolutionary rate of UCP1 and the rodents’ ambient temperature, correlation analyses were performed between the evolutionary rate of UCP1 and the mean temperature, maximum temperature, and minimum temperature, respectively, and the results showed that the evolutionary rate of UCP1 has no relationship with the ambient temperature in rodents (for average temperature: R = −0.19, p = 0.20; for minimum temperature: R = −0.16, p = 0.28; for maximum temperature: R = −0.21, p = 0.15); however, after controlling for the phylogenetic effect, the maximum temperature was negatively correlated to evolutionary rate of UCP1 (R = −0.33, p = 0.02), whereas no significant correlation existed between the average temperature and the evolutionary rate of UCP1 (R = −0.27, p = 0.07) or the minimum temperature and the evolutionary rate of UCP1 (R = −0.27, p = 0.06) (Figure 3).
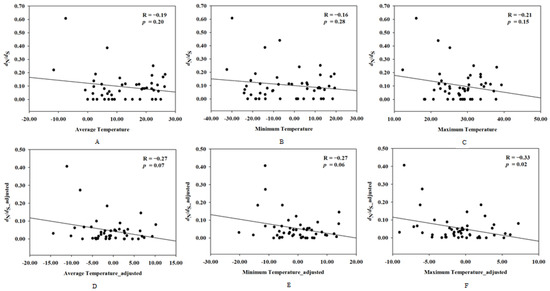
Figure 3.
The correlation between the evolutionary rate of UCP1 and ambient temperature before and after controlling for phylogenetic inertia. X-axis denotes dN/dS (ω) and dN/dS_adjusted, whereas Y-axis indicates (A) average temperature; (B) minimum temperature; (C) maximum temperature; (D) average temperature_adjusted; (E) minimum temperature_adjusted; (F) maximum temperature_adjusted.
Body weight data were primarily collected from Alhajeri et al. [34], and when the data were absent, we searched for them on AnAge: The Animal Ageing and Longevity Database. Meanwhile, we also collected the data of weight at birth for the species used in this study as much as possible. In total, 50 species had both UCP1 evolutionary rates and body weight data, and among them, the body weight of 33 and 17 species were collected from Alhajeri et al. [34] and AnAge: The Animal Ageing and Longevity Database, respectively. After removing Acomys dimidiatus due to a ω = 999 of UCP1, 49 species were used in the analysis. In addition, 32 species had weight at birth data, and they are from AnAge: The Animal Ageing and Longevity Database. Correlation analyses were conducted between body mass and evolutionary rate and weight at birth and evolutionary rate, and the results suggested that no significant association was found (Table S4), no matter whether controlling for the phylogenetic signal or not.
3. Discussion
In mammals, non-shivering thermogenesis mediated by UCP1 is a critical mechanism for coping with cold exposure [7,39]. In this study, we employed the recent release of rodent genomes to explore the evolution of UCP1 and its relationship to habitat temperature and body weight. After the investigation of the UCP1 gene distribution in rodents, we found that 17 of the 64 rodent species did not have any intact UCP1 genes, of which 15 species each had at least one partial gene whereas 2 species each had one pseudogene. Two pseudogenes were from Mastomys natalensis (1 bp deletion in exon2) and Typhlomys cinereus (1 bp insertion in exon5). The indels that were not a multiple of 3 resulted in an altered open reading frame (ORF) and premature stop codons, which are hallmarks of pseudogenes [40]. Considering that the mean temperature of the habitats of Mastomys natalensis and Typhlomys cinereus was 24.1 °C and 16.6 °C, respectively, the minimum temperature of the habitats of both species was above 2 °C [34], and UCP1 was mainly expressed to deal with cold pressure, we inferred that although they did not have an intact UCP1 gene, the ambient temperatures were relatively high and the disruption of UCP1 did not have a major impact on their lives.
Selective pressure analysis of 50 species with intact UCP1 genes showed that the overall selection pressure on the UCP1 gene in rodent species was estimated to be 0.11, suggesting that the gene was under purifying selection, which is in line with two previous studies using species from several taxonomic groups [7,41]. The two-ratio model showed that the ω values of foreground branches consisting of Urocitellus parryii and Dicrostonyx groenlandicus, respectively, which survived under extreme cold conditions, were significantly higher than those of the background branches of other rodents. This suggested that the evolution of the UCP1 genes of Urocitellus parryii and Dicrostonyx groenlandicus were under accelerated evolution compared with that of other rodents, which may allow more sensitivity to the mutations responsive to the environment. On the other hand, a higher UCP1 evolutionary rate may also appear to experience a relaxed constraint, which allows for more sensitivity to mutations resulting in neofunctionalization [7], followed by purifying selection, just as UCP1 is assumed to be relaxed in animals with large body weights due to its possible enhancement in muscle thermogenesis, such as in elephant seals [29]
Several factors were suggested to affect the energy expenditure of small-sized animals, including phylogeny, body size, and climate, of which microclimate and body size seem to be the most important [13]. In general, climate conditions have an impact on the temperature difference between mammal bodies and the environment [42]. UCP1-mediated NST, induced by the cold, is an essential manner of heat production in small mammals, and it is viewed as an important mechanism in contributing to the survival of animals in the cold [13]. NST varies with season and temperature, it is generally high in winter or cold [43], and the abilities of the thermogenesis of small-sized animals change according to the habitat environment [44]. In this study, we performed a linear regression analysis using ω and habitat temperature, and the results showed that after removing the phylogenetic effect, ω was negatively correlated with the maximum habitat temperature, indicating that selection pressure on UCP1 increased with decreasing habitat temperature. The significant correlation between ω and habitat temperature also demonstrated that habitat temperature is an important factor driving the evolution of UCP1. The results showed that the evolutionary rate of UCP1 is negatively correlated with the maximum temperature in rodents used here; that is, when the evolutionary rate is higher, the maximum temperature will be lower. This is consistent with the plateau pika (Ochotona curzoniae), a species that maintains body temperature through augmenting NST in response to the cold stress in the Qinghai–Tibet Plateau [13]. Also, species living in warm environments may lose UCP1 function due to the disappearance of selective pressure acting on NST [4]; in addition, the emergence of adaptive behavior such as building nests to protect the young from cold exposure can attenuate the burden of thermogenesis, compensating for UCP1 pseudogenization [2].
Urocitellus parryii mainly lives in high altitudes in the Arctic and tundra regions [45,46], where its habitat has a minimum temperature of −29.9 °C and a mean temperature of −7.5 °C [34]. The results in the two-ratio model (ω1 = 0.28, ω2 = 0.11, p = 0.04) also indicated that there was a faster evolutionary rate of the UCP1 gene in Urocitellus parryii and Dicrostonyx groenlandicus compared with other rodents and also suggested that habitat temperature may be an important factor driving the evolution of UCP1. In addition, Cavia porcellus is distributed in a large scope of elevations, ranging from sea level to 4000 m [47], and it can survive in a wide range of temperatures, from 22 °C to −7 °C, though it is suggested that it cannot tolerate extreme temperatures [48,49,50]. Peromyscus maniculatus bairdii has a wide distribution and is common in grasslands, scrublands, and woodlands [51,52], and the temperature range of its habitat is also wide, from 25.2 °C to −14.1 °C [34]. These two samples suggest that wide thermal niches may also drive the evolution of the UCP1 gene.
This study also examines the correlation between body weight and the evolutionary rate of UCP1, due to previous suggestions that the NST is inversely correlated to body weight [1] and that when the body weight is above 10 kg, it has no contribution to heat production [9]. The results of this study demonstrated that although NST has a correlation with body weight in some species, this relationship cannot be applied to the rodent group. In addition, data on weight at birth were also collected to test a previous conclusion stating that mammals with a UCP1 pseudogene have a greater weight at birth [29]. Despite the fact that a positive selection acted on the lineage leading to small-sized species, emphasizing its importance at the early stage of this lineage, not all the small-sized species used NST mediated by UCP1, and the partial genes or pseudogenes in some rodents may due to other NST strategies that link to body size, behavioral adaptation, or the warm habitat they inhabit, and such manners reduce the reliance on UCP1 and further lead to the loss or pseudogenization of UCP1 [7]. Furthermore, during the process of body weight collection, we found that the value of body weight varies among different sources in some species. Although we selected the data from the same source as much as possible, a single source is hard to cover all the body weight data of the rodents used here, and data from different sources will raise the problem of data inconsistency due to the criteria used in various sources. Thus, the relationship between body weight and evolutionary rate is roughly estimated. More data from the same source are expected in the future to further verify the result.
At last, for most small-sized species, the strategy of increasing heat production via NST to ensure a thermostatic life during chronic cold stress is particularly important [6], and higher UCP1 activity increases oxidative capacity, which is central to thermogenic processes [6], suggestive of the critical role on UCP1 gene. This study only explored the primary influencing factors on UCP1 evolution, and the conclusion that UCP1 evolutionary rate correlated with maximum temperature but not body weight enhances our understanding of the evolution of UCP1 in small-sized mammals. Other factors that have a driving force on the UCP1 evolution still need to be further explored and verified.
4. Materials and Methods
4.1. Data Sources
Genome assemblies of rodent species were downloaded from the National Center for Biotechnology Information (NCBI, https://www.ncbi.nlm.nih.gov/, accessed on 13 October 2022), and the published UCP1 sequences of rodents were also collected by searching NCBI and other sources. Information on ambient temperatures and body weight was collected from the Animal Diversity Web (https://animaldiversity.org/ (accessed on 5 May 2023)) and previously published literature [34]. Of note, body weight means adult weight, and during the data collection, weight at birth was also gathered when it was displayed in the above-mentioned sources.
4.2. Identification of UCP1 Gene
We used the published rodent UCP1 gene (accession No. AF515781.1) as the reference sequence and performed TblastN to search for UCP1 in rodents with known genome sequences. To identify all six exons that make up a UCP1 gene, we downloaded the specific genomic scaffold containing UCP1 and conducted Blast 2 between each exon from the reference sequence and the scaffold. Blast hit sequences were extended to both 5′ and 3′ directions along the genome scaffolds to attempt to identify the entire coding regions [40]. Subsequently, all 6 exons were assembled and compared with published UCP1 data from closely related species using ClustalX1.83 [53], and indels (insertions/deletions) were recorded during the process. Newly identified UCP1 sequences were classified into 3 categories: intact genes, partial genes, and pseudogenes. Intact genes refer to those that have full-length coding sequences and a proper start and stop codon; partial genes are those with a truncated open reading frame as a result of incomplete genome sequencing; and pseudogenes mean those with inactivated mutations [54].
4.3. Sequence Alignment and Phylogenetic Reconstruction
The resulting sequences were aligned with MEGA 6 [55] and checked by eye. The alignments of nucleotide sequencing were obtained according to protein sequence alignments and were subsequently used for selective pressure analyses. The phylogenetic tree of the UCP1 gene was reconstructed by both Neighbor-Joining (NJ) [56] and Maximum Likelihood (ML) approaches supplemented in MEGA 6, with a Homo sapiens UCP1 gene (accession No. NM_021833.5) as the outgroup gene. The NJ tree was reconstructed using the following settings: the Kimura 2-parameter model [57] was selected, the gaps/missing data were treated by complete deletion, and the number of bootstrap replicates was set to 1000 [58].
4.4. Selection Analyses
In order to investigate selective pressures acting on rodent UCP1, we estimated the ratio (ω) of the rate of nonsynonymous substitutions (dN) to the rate of synonymous substitutions (dS) using Paml4.7 [59]. When ω = 1, this means the gene is under neutral evolution; ω < 1 indicates negative or purifying selection whereas ω > 1 denotes positive selection. M0 (one ratio) assumes that all branches in the evolutionary tree have the same ω ratio; however, in M0 (ω = 1), the ω value is fixed to 1 [59]. A two-ratio model that allows the ω value to vary between the background and foreground branches was employed and then compared with M0 (one ratio). This approach was used to compare the evolutionary rates of UCP1 between specific rodent species and the rest using the likelihood ratio test (LRT), which uses twice the log likelihood difference (2 dL) and parameter numbers difference of the two models as degree freedom to calculate the p-value with a chi-square distribution [7,60]. Additionally, a free-ratio model allowing all branches to have different ω values was conducted.
In addition, site model analyses were also conducted to detect positively selected sites. In this section, three pair model (M1a-M2a, M7-M8, and M8a-M8) analyses were carried out and compared. Of these, M1a/M7/M8a is a null/neutral model whereas M2a/M8 an alternative/positive selection model [61]. Similar to the branch model analyses mentioned above, a likelihood ratio test (LRT) was also applied to determine which model was more appropriate to the data. A significant difference in LRT (p < 0.05) denotes a positive selection model fits the dataset better than the neutral model. For the dataset that displays a significant difference in the LRT, the Bayes Empirical Bayes (BEB) method [62] supplemented in PAML software was executed to detect potentially positive selection signatures in the sites, and only the sites with posterior probability (PP) > 0.95 were considered.
4.5. Statistical Analysis
We explored the relationship between the ω of the UCP1 gene and ambient temperature in rodents using correlation analysis in SPSS 27.0 (SPSS Inc., Chicago, IL, USA). Phylogenetic inertia must be considered during phylogenetic comparative analyses because closely related species are more likely to share similar characteristics. This shared inheritance can lead to data non-independence. To control for the effects of phylogenetic inertia, we additionally used phylogenetically independent contrasts [63], which were estimated by PDAP (Phenotypic Diversity Analysis Program, version 6.0) [64] implemented in Mesquite 2.74 [65] to transform the data before the correlation analyses. We used the species tree from Alvarez-Carretero et al. [31] as the guide tree. We also investigated the correlation between UCP1 evolutionary rate and body weight using the same method.
5. Conclusions
This study investigated the evolution of UCP1 and its related driving force in rodents. The results revealed that purifying selection governed the evolution of UCP1 and that ambient temperature can drive the evolution of UCP1, particularly in species that inhabit cold regions, whereas body weight has no effect on UCP1 evolution in rodents, which is probably due to their smaller sizes.
Supplementary Materials
The following supporting information can be downloaded at https://www.mdpi.com/article/10.3390/ijms26052155/s1. References [34,35,66,67,68] are cited in the Supplementary Materials.
Author Contributions
Writing—original draft preparation and data collection and analyses, X.L.; data analyses, and tables and figures preparation, M.W.; data collection, Q.N., S.Y. and T.K.; writing—review and editing, writing—original draft preparation, tables and figures preparation, supervision, and funding acquisition, P.F. All authors have read and agreed to the published version of the manuscript.
Funding
The study was financed and supported by the National Natural Science Foundation of China (32060111), the Guangxi Natural Science Foundation (2025GXNSFAA069151), the Innovation Project of Guangxi Graduate Education (JGY2022032), and the Key Laboratory of Ecology of Rare and Endangered Species and Environmental Protection (Guangxi Normal University), Ministry of Education, China (ERESEP2022Z02).
Institutional Review Board Statement
Not applicable.
Informed Consent Statement
Not applicable.
Data Availability Statement
Data are available in the Supplementary Materials.
Conflicts of Interest
The authors declare no conflicts of interest.
References
- Oelkrug, R.; Polymeropoulos, E.T.; Jastroch, M. Brown adipose tissue: Physiological function and evolutionary significance. J. Comp. Physiol. B 2015, 185, 587–606. [Google Scholar] [CrossRef] [PubMed]
- Fyda, T.J.; Spencer, C.; Jastroch, M.; Gaudry, M.J. Disruption of thermogenic UCP1 predated the divergence of pigs and peccaries. J. Exp. Biol. 2020, 223, jeb223974. [Google Scholar] [CrossRef] [PubMed]
- Jastroch, M.; Polymeropoulos, E.T.; Gaudry, M.J. Pros and cons for the evidence of adaptive non-shivering thermogenesis in marsupials. J. Comp. Physiol. B-Biochem. Syst. Environ. Physiol. 2021, 191, 1085–1095. [Google Scholar] [CrossRef] [PubMed]
- Berg, F.; Gustafson, U.; Andersson, L. The uncoupling protein 1 gene (UCP1) is disrupted in the pig lineage: A genetic explanation for poor thermoregulation in piglets. PLoS Genet. 2006, 2, e129. [Google Scholar] [CrossRef]
- Gaudry, M.J.; Jastroch, M.; Treberg, J.R.; Hofreiter, M.; Paijmans, J.L.A.; Starrett, J.; Wales, N.; Signore, A.V.; Springer, M.S.; Campbell, K.L. Inactivation of thermogenic UCP1 as a historical contingency in multiple placental mammal clades. Sci. Adv. 2017, 3, e1602878. [Google Scholar] [CrossRef]
- Gaudry, M.J.; Jastroch, M. Comparative functional analyses of UCP1 to unravel evolution, ecophysiology and mechanisms of mammalian thermogenesis. Comp. Biochem. Physiol. B Biochem. Mol. Biol. 2021, 255, 110613. [Google Scholar] [CrossRef]
- Mendes, T.; Silva, L.; Almeida, D.; Antunes, A. Neofunctionalization of the UCP1 mediated the non-shivering thermogenesis in the evolution of small-sized placental mammals. Genomics 2020, 112, 2489–2498. [Google Scholar] [CrossRef]
- Mezentseva, N.V.; Kumaratilake, J.S.; Newman, S.A. The brown adipocyte differentiation pathway in birds: An evolutionary road not taken. BMC Biol. 2008, 6, 17. [Google Scholar] [CrossRef]
- Jastroch, M.; Oelkrug, R.; Keipert, S. Insights into brown adipose tissue evolution and function from non-model organisms. J. Exp. Biol. 2018, 221, jeb169425. [Google Scholar] [CrossRef]
- Oelkrug, R.; Meyer, C.W.; Heldmaier, G.; Mzilikazi, N. Seasonal changes in thermogenesis of a free-ranging afrotherian small mammal, the Western rock elephant shrew (Elephantulus rupestris). J. Comp. Physiol. B 2012, 182, 715–727. [Google Scholar] [CrossRef]
- Saito, S.; Saito, C.T.; Shingai, R. Adaptive evolution of the uncoupling protein 1 gene contributed to the acquisition of novel nonshivering thermogenesis in ancestral eutherian mammals. Gene 2008, 408, 37–44. [Google Scholar] [CrossRef] [PubMed]
- Rafael, J.; Vsiansky, P.; Heldmaier, G. Increased contribution of brown adipose tissue to nonshivering thermogenesis in the Djungarian hamster during cold-adaptation. J. Comp. Physiol. B 1985, 155, 717–722. [Google Scholar] [CrossRef] [PubMed]
- Li, Q.; Sun, R.; Huang, C.; Wang, Z.; Liu, X.; Hou, J.; Liu, J.; Cai, L.; Li, N.; Zhang, S.; et al. Cold adaptive thermogenesis in small mammals from different geographical zones of China. Comp. Biochem. Physiol. A Mol. Integr. Physiol. 2001, 129, 949–961. [Google Scholar] [CrossRef] [PubMed]
- McManus, C.J.; Fitzgerald, B.P. Effects of a single day of feed restriction on changes in serum leptin, gonadotropins, prolactin, and metabolites in aged and young mares. Domest. Anim. Endocrinol. 2000, 19, 1–13. [Google Scholar] [CrossRef]
- Brondani, L.D.; Assmann, T.S.; Duarte, G.C.K.; Gross, J.L.; Canani, L.H.; Crispim, D. The role of the uncoupling protein 1 (UCP1) on the development of obesity and type 2. Arq. Bras. Endocrinol. Metab. 2012, 56, 215–225. [Google Scholar] [CrossRef]
- Arfuso, F.; Rizzo, M.; Giannetto, C.; Giudice, E.; Fazio, F.; Piccione, G. Age-related changes of serum mitochondrial uncoupling 1, rumen and rectal temperature in goats. J. Therm. Biol. 2016, 59, 47–51. [Google Scholar] [CrossRef]
- Gagnon, C.M.; Svardal, H.; Jasinska, A.J.; Cramer, J.D.; Freimer, N.B.; Grobler, J.P.; Turner, T.R.; Schmitt, C.A. Evidence of selection in the uncoupling protein 1 gene region suggests local adaptation to solar irradiance in savannah monkeys (spp.). P. Roy. Soc. B-Biol. Sci. 2022, 289, 20221254. [Google Scholar] [CrossRef]
- Arfuso, F.; Giannetto, C.; Panzera, M.F.; Fazio, F.; Piccione, G. Uncoupling protein-1 (UCP1) in the adult horse: Correlations with body weight, rectal temperature and lipid profile. Animals 2021, 11, 1836. [Google Scholar] [CrossRef]
- Gesta, S.; Tseng, Y.H.; Kahn, C.R. Developmental origin of fat: Tracking obesity to its source. Cell 2007, 131, 242–256. [Google Scholar] [CrossRef]
- Murakami, M.; Ohi, M.; Ishikawa, S.; Shirai, M.; Horiguchi, H.; Nishino, Y.; Funaba, M. Adaptive expression of uncoupling protein 1 in the carp liver and kidney in response to changes in ambient temperature. Comp. Biochem. Phys. A 2015, 185, 142–149. [Google Scholar] [CrossRef]
- Puigserver, P.; Wu, Z.; Park, C.W.; Graves, R.; Wright, M.; Spiegelman, B.M. A cold-inducible coactivator of nuclear receptors linked to adaptive thermogenesis. Cell 1998, 92, 829–839. [Google Scholar] [CrossRef] [PubMed]
- Barbatelli, G.; Murano, I.; Madsen, L.; Hao, Q.; Jimenez, M.; Kristiansen, K.; Giacobino, J.P.; De Matteis, R.; Cinti, S. The emergence of cold-induced brown adipocytes in mouse white fat depots is determined predominantly by white to brown adipocyte transdifferentiation. Am. J. Physiol. Endoc. M. 2010, 298, E1244–E1253. [Google Scholar] [CrossRef] [PubMed]
- Jastroch, M.; Wuertz, S.; Kloas, W.; Klingenspor, M. Uncoupling protein 1 in fish uncovers an ancient evolutionary history of mammalian nonshivering thermogenesis. Physiol. Genom. 2005, 22, 150–156. [Google Scholar] [CrossRef]
- Bermejo-Nogales, A.; Calduch-Giner, J.A.; Pérez-Sánchez, J. Gene expression survey of mitochondrial uncoupling proteins (UCP1/UCP3) in gilthead sea bream (Sparus aurata L.). J. Comp. Physiol. B Biochem. Syst. Environ. Physiol. 2010, 180, 685–694. [Google Scholar] [CrossRef]
- Cannon, B.; Nedergaard, J. Brown adipose tissue: Function and physiological significance. Physiol. Rev. 2004, 84, 277–359. [Google Scholar] [CrossRef]
- Clarke, A.; Portner, H.O. Temperature, metabolic power and the evolution of endothermy. Biol. Rev. Camb. Philos. Soc. 2010, 85, 703–727. [Google Scholar] [CrossRef]
- Alexander, G.; Bennett, J.W.; Gemmell, R.T. Brown adipose tissue in the new-born calf (Bos taurus). J. Physiol. 1975, 244, 223–234. [Google Scholar] [CrossRef]
- Pearson, L.E.; Liwanag, H.E.; Hammill, M.O.; Burns, J.M. Shifts in thermoregulatory strategy during ontogeny in harp seals (Pagophilus groenlandicus). J. Therm. Biol. 2014, 44, 93–102. [Google Scholar] [CrossRef]
- Gaudry, M.J.; Khudyakov, J.; Pirard, L.; Debier, C.; Crocker, D.; Crichton, P.G.; Jastroch, M. Terrestrial birth and body size tune UCP1 functionality in seals. Mol. Biol. Evol. 2024, 41, msae075. [Google Scholar] [CrossRef]
- Gaudry, M.J.; Fyda, T.J.; Jastroch, M. Evolution of pinniped UCP1 is not linked to aquatic life but to neonatal thermogenesis and body size. Proc. Natl. Acad. Sci. USA 2022, 119, e2118431119. [Google Scholar] [CrossRef]
- Alvarez-Carretero, S.; Tamuri, A.U.; Battini, M.; Nascimento, F.F.; Carlisle, E.; Asher, R.J.; Yang, Z.; Donoghue, P.C.J.; Dos Reis, M. A species-level timeline of mammal evolution integrating phylogenomic data. Nature 2022, 602, 263–267. [Google Scholar] [CrossRef] [PubMed]
- Knowles, L.L. Estimating species trees: Methods of phylogenetic analysis when there is incongruence across genes. Syst. Biol. 2009, 58, 463–467. [Google Scholar] [CrossRef] [PubMed]
- Pollard, D.A.; Iyer, V.N.; Moses, A.M.; Eisen, M.B. Widespread discordance of gene trees with species tree in Drosophila: Evidence for incomplete lineage sorting. PLoS Genet. 2006, 2, e173. [Google Scholar] [CrossRef]
- Alhajeri, B.H.; Fourcade, Y.; Upham, N.S.; Alhaddad, H. A global test of Allen’s rule in rodents. Glob. Ecol. Biogeogr. 2020, 29, 2248–2260. [Google Scholar] [CrossRef]
- Sumbera, R.; Lovy, M.; Nevo, E.; Okrouhlik, J. Thermal biology in the Upper Galili Mountain blind mole rat (Nannospalax galili) and an overview of spalacine energetics. J. Therm. Biol. 2023, 115, 103618. [Google Scholar] [CrossRef]
- Cedikova, M.; Kripnerova, M.; Dvorakova, J.; Pitule, P.; Grundmanova, M.; Babuska, V.; Mullerova, D.; Kuncova, J. Mitochondria in white, brown, and beige adipocytes. Stem Cells Int. 2016, 2016, 6067349. [Google Scholar] [CrossRef]
- Nowack, J.; Giroud, S.; Arnold, W.; Ruf, T. Muscle non-shivering thermogenesis and its role in the evolution of endothermy. Front. Physiol. 2017, 8, 889. [Google Scholar] [CrossRef]
- Wertheim, J.O.; Murrell, B.; Smith, M.D.; Pond, S.L.K.; Scheffler, K. RELAX: Detecting relaxed selection in a phylogenetic framework. Mol. Biol. Evol. 2015, 32, 820–832. [Google Scholar] [CrossRef]
- Nedergaard, J.; Golozoubova, V.; Matthias, A.; Asadi, A.; Jacobsson, A.; Cannon, B. UCP1: The only protein able to mediate adaptive non-shivering thermogenesis and metabolic inefficiency. Biochim. Biophys. Acta 2001, 1504, 82–106. [Google Scholar] [CrossRef]
- Feng, P.; Zhao, H.B. Complex evolutionary history of the vertebrate sweet/umami taste receptor genes. Chin. Sci. Bull. 2013, 58, 2198–2204. [Google Scholar] [CrossRef]
- Hughes, J.; Criscuolo, F. Evolutionary history of the UCP gene family: Gene duplication and selection. BMC Evol. Biol. 2008, 8, 306. [Google Scholar] [CrossRef] [PubMed]
- Bozinovic, F.; Rosenmamn, M. Comparative energetics of South American ricetid rodents. Comp. Biochem. Physiol. 1988, 91A, 195–202. [Google Scholar] [CrossRef] [PubMed]
- Heldmaier, G.; Klaus, S.; Wiesenger, H. Seasonal Adaptation of Thermoregulatory Heat Production in Small Mammals; Springer: Berlin/Heidelberg, Germany, 1990. [Google Scholar]
- Haim, A.; Izhaki, L. The ecological significance of resting metabolic rate and non-shivering thermogenesis for rodents. J. Ther. Biol. 1993, 18, 71–91. [Google Scholar] [CrossRef]
- Byrom, A.E.; Karels, T.J.; Krebs, C.J.; Boonstra, R. Experimental manipulation of predation and food supply of arctic ground squirrels in the boreal forest. Can. J. Zool. 2000, 78, 1309–1319. [Google Scholar] [CrossRef]
- Donker, S.A.; Krebs, C.J. Habitat-specific distribution and abundance of arctic ground squirrels (Urocitellus parryii plesius) in southwest Yukon. Can. J. Zool. 2011, 89, 570–576. [Google Scholar] [CrossRef]
- Morales, E. The guinea pig in the Andean economy: From household animal to market commodity. Lat. Am. Res. Rev. 1994, 29, 129–142. [Google Scholar] [CrossRef]
- Sandweiss, D.H.; Wing, E.S. Ritual rodents: The guinea pigs of Chincha, Peru. J. Field Archaeol. 1997, 24, 47–58. [Google Scholar] [CrossRef]
- Terril, L.A.; Suckow, M.A.; Clemons, D.J. The Laboratory Guinea Pig; CRC Press: Boca Raton, FL, USA, 1998. [Google Scholar]
- Vanderlip, S. The Guinea Pig Handbook; Sourceb Inc.: Lenexa, KS, USA, 2015. [Google Scholar]
- King, J.A. Biology of Peromyscus (Rodentia); University Chicago Press: Chicago, IL, USA, 1968; pp. xiii + 594. [Google Scholar]
- Bedford, N.L.; Hoekstra, H.E. Peromyscus mice as a model for studying natural variation. eLife 2015, 4, e06813. [Google Scholar] [CrossRef]
- Thompson, J.D.; Gibson, T.J.; Plewniak, F.; Jeanmougin, F.; Higgins, D.G. The CLUSTAL_X windows interface: Flexible strategies for multiple sequence alignment aided by quality analysis tools. Nucleic Acids Res. 1997, 25, 4876–4882. [Google Scholar] [CrossRef]
- Jiao, H.W.; Zhang, L.B.; Xie, H.W.; Simmons, N.B.; Liu, H.; Zhao, H.B. Trehalase gene as a molecular signature of dietary diversification in mammals. Mol. Biol. Evol. 2019, 36, 2171–2183. [Google Scholar] [CrossRef]
- Tamura, K.; Stecher, G.; Peterson, D.; Filipski, A.; Kumar, S. MEGA6: Molecular evolutionary genetics analysis version 6.0. Mol. Biol. Evol. 2013, 30, 2725–2729. [Google Scholar] [CrossRef] [PubMed]
- Saitou, N.; Nei, M. The neighbor-joining method: A new method for reconstructing phylogenetic trees. Mol. Biol. Evol. 1987, 4, 406–425. [Google Scholar] [CrossRef] [PubMed]
- Nei, M.; Kumar, S. Molecular Evolution and Phylogenetics; Oxford University Press: New York, NY, USA, 2000; pp. 87–103. [Google Scholar]
- Felsenstein, J. Confidence limits on phylogenies: An approach using the bootstrap. Evolution 1985, 39, 783–791. [Google Scholar] [CrossRef] [PubMed]
- Yang, Z. PAML 4: Phylogenetic analysis by maximum likelihood. Mol. Biol. Evol. 2007, 24, 1586–1591. [Google Scholar] [CrossRef]
- Dong, X.; Liang, Q.; Li, J.; Feng, P. Positive selection drives the evolution of a primate bitter taste receptor gene. Ecol. Evol. 2021, 11, 5459–5467. [Google Scholar] [CrossRef]
- Dasmeh, P.; Serohijos, A.W.; Kepp, K.P.; Shakhnovich, E.I. The influence of selection for protein stability on dN/dS estimations. Genome Biol. Evol. 2014, 6, 2956–2967. [Google Scholar] [CrossRef]
- Yang, Z.; Wong, W.S.; Nielsen, R. Bayes empirical bayes inference of amino acid sites under positive selection. Mol. Biol. Evol. 2005, 22, 1107–1118. [Google Scholar] [CrossRef]
- Felsenstein, J. Phylogenies and the comparative method. Am. Nat. 1985, 125, 1–15. [Google Scholar] [CrossRef]
- PDAP: PDTREE: A Translation of the PDTREE Application of Garland et al.’s Phenotypic Diversity Analysis Programs, Version 6.0. Available online: https://biology.ucr.edu/people/faculty/Garland/PDAP.html (accessed on 8 June 2023).
- Maddison, W.P.; Maddison, D.R. Mesquite: A Modular System for Evolutionary Analysis, Version 2.6.; Mesquite Software, Inc.: Austin, TX, USA, 2009. Available online: http://mesquiteproject.org (accessed on 8 June 2023).
- Thomas, H.G.; Swanepoel, D.; Bennett, N.C. Burrow architecture of the Damaraland mole-rat (Fukomys damarensis) from South Africa. Afr. Zool. 2016, 51, 29–36. [Google Scholar] [CrossRef]
- Luo, Z.X.; Chen, W.; Gao, W. Zoology of China; Theroidea; Volume VI, Rodentia (Part II) Hamsters; Science Press: Beijing, China, 2000; pp. 1–522. [Google Scholar]
- Pinheiro, G.; Prata, D.F.; Araújo, I.M.; Tiscornia, G. The African spiny mouse (Acomys spp.) as an emerging model for development and regeneration. Lab Anim. 2018, 52, 565–576. [Google Scholar] [CrossRef]
Disclaimer/Publisher’s Note: The statements, opinions and data contained in all publications are solely those of the individual author(s) and contributor(s) and not of MDPI and/or the editor(s). MDPI and/or the editor(s) disclaim responsibility for any injury to people or property resulting from any ideas, methods, instructions or products referred to in the content. |
© 2025 by the authors. Licensee MDPI, Basel, Switzerland. This article is an open access article distributed under the terms and conditions of the Creative Commons Attribution (CC BY) license (https://creativecommons.org/licenses/by/4.0/).