Article

PD-L1+ Regulatory B Cells from Rheumatoid Arthritis Patients Have Impaired Function in Suppressing IFN-ү and IL-21 Production

1
Department of Immunology, Eötvös Loránd University, 1053 Budapest, Hungary
2
Rheumatology-Rehabilitation Department, Buda Hospital of the Hospitaller Order of Saint John of God, 1027 Budapest, Hungary
3
Department of Rheumatology and Immunology, Semmelweis University, 1023 Budapest, Hungary
4
Heart and Vascular Center, Semmelweis University, 1122 Budapest, Hungary
5
Department of Genetics, Cell- and Immunobiology, Semmelweis University, 1089 Budapest, Hungary
*
Author to whom correspondence should be addressed.
Current address: Department of Biochemistry and Molecular Biology, Semmelweis University, 1094 Budapest, Hungary.
Int. J. Mol. Sci. 2025, 26(7), 2998; https://doi.org/10.3390/ijms26072998
Submission received: 22 February 2025 / Revised: 18 March 2025 / Accepted: 20 March 2025 / Published: 25 March 2025
(This article belongs to the Special Issue Rheumatoid Arthritis: From Molecular Basis to Therapies)

Abstract

:
Rheumatoid arthritis (RA) is a systemic inflammatory autoimmune disease. The pathomechanism of RA depends on both B and T cells. Regulatory B cells (Breg) have been shown to suppress T-cell immune responses and play a key role in modulating autoimmune processes. We aimed to investigate the possibility of utilizing PD-L1+ Breg cells in downregulating the Th cells’ immune response in healthy individuals and RA patients. We hypothesized that the PD-1/PD-1L interaction plays a key role in this process, which may be defective in autoimmune diseases. We separated T and B cells from the peripheral blood of healthy volunteers and RA patients by magnetic cell sorting, and Th cells and Treg cells were isolated by fluorescence-activated cell sorting. The cytokine production by CD4+ Th cells was detected by intracellular flow cytometry. CpG and CD40L stimulations were applied to induce PD-L1hi expressing Breg cells. We found that the frequency of PD-L1hi cells is significantly lower in all B-cell subsets in RA compared to healthy controls. Functional analysis of induced PD-L1+ Breg cells in coculture with activated autologous Th cells has shown that healthy control samples containing higher levels of PD-L1hi Breg cells significantly inhibit IFN-ү and IL-21 production by Th cells. In contrast, RA patients’ samples with lower levels of PD-L1hi Breg cells failed to do so. Since the expression of PD-L1 on B cells can be modulated in vitro to induce Breg cell suppressive capacity, these data may provide new perspectives for future therapy for RA.

1. Introduction

Regulatory B cells (Bregs) represent a functionally distinct and phenotypically diverse subset of B cells responsible for inhibiting inflammatory responses by suppressing T cell activation and inducing regulatory T cell (Tregs) differentiation [1,2]. Although Bregs were primarily described as exerting their regulatory function via an IL-10-dependent pathway, IL-10-independent mechanisms, including transforming growth factor-β (TGF-β) and IL-35, are also implied. Additionally, Bregs can perform their function via cell–cell contact by using immune checkpoint molecules such as Programmed cell death ligand-1 (PD-L1) [3,4,5,6]. The lack of exclusive phenotypic markers for Bregs identification significantly impairs the comparability of studies, as nearly all B-cell subsets might have regulatory features depending on the context and various signals they receive [3]. In humans, Bregs were phenotyped as CD19+CD24hiCD38hi transitional B cells [7,8,9], CD19+CD27intCD38+ plasmablasts [10], CD19+CD25+CD71+CD73B regulatory 1 (Br1) cells [11], CD19+CD24hiCD27+B10 cells [12,13] CD19+CD25+ B cells [4], and Tim-1+ Bregs [14], all of which at least release either IL-10, TGF-β, or IL-35.
The importance of Bregs in inflammatory autoimmune diseases stems from their role in controlling inflammation. In multiple sclerosis (MS) patients, helminth infection increases the frequency of CD19+CD1dhi IL-10+ Breg cells that suppress the proliferation and IFN-γ production by T cells, resulting in an improved clinical outcome compared to patients experiencing relapsing-remitting MS (RRMS) [15,16]. The functional and numerical deficiency of immature CD19+CD24hiCD38hi B cells in systemic lupus erythematosus (SLE) results in their failure to differentiate into Bregs due to an elevated level of IFN-α, which favors plasmablast formation and consequently enhances autoantibody production and disease pathogenesis [16,17]. A similar phenomenon has been observed in rheumatoid arthritis (RA), where the frequency of IL-10+CD5+CD1dhi B cells, IL-10+TIM1+ B cells, and CD24hiCD38hi Bregs was reduced and accompanied by an inability to repress Th17 responses and convert CD4+ T cells into Tregs [9,18,19]. In our previous study, we also noticed a reduced number of CD27+IL-10+ B cells in RA patients, which were functionally impaired in suppressing CD4+ IFN-γ+ T cells in co-culture [20]. Accordingly, dysfunction of Bregs in RA may lead to persistent inflammation, which significantly worsens the prognosis of the disease.
Treatment of RA is mainly focused on reducing the inflammatory response. Recently, biologic therapies, such as rituximab (anti-CD20), have been used to deplete various B-cell subsets, significantly reducing the frequency and function of Bregs [21]. However, others have reported that the PD-L1hi B-cell population in humans can suppress cTfh cell expansion and is refractory to B-cell depletion therapy [22]. Other therapeutic strategies used to treat RA are aimed at reducing inflammation, such as non-steroidal anti-inflammatory drugs (NSAIDs); disease-modifying anti-rheumatic drugs (DMARDs); new-generation biologic therapies designed to target-specific pathways, such as costimulatory signaling or the Janus kinase pathways; and combinations of these [23]. However, these treatments are associated with several adverse effects, and on the other hand, a significant proportion, around 30–40% of RA patients, are refractory and difficult to treat. Further research is, therefore, needed to develop more effective therapeutic strategies [24,25,26,27].
Loss of immune tolerance has been identified as a major factor in the development of autoimmune diseases, including RA. Breg and Treg cells play a critical role in restoring the balance of the immune system (see Supplementary Figure S1) [28]. Therefore, a better approach to treating RA would be to restore immune homeostasis by enhancing the function of regulatory cells that suppress B- and T-cell activation. However, due to their intermittent and multifunctional action, immunosuppressive cytokines, such as IL-10, may exacerbate RA pathogenesis by inducing B cell differentiation into IgM- and IgG-secreting plasmablasts, resulting in increased autoantibody titers [29]. Alternatively, a direct cell contact approach to modulate immune responses through checkpoint receptors, such as the PD-1/PD-L1 interaction—known to downregulate effective immune responses in the cancer microenvironment—may solve the problem. PD-1 is predominantly expressed on a variety of cells, including activated T cells, and the binding of PD-L1 would downregulate T cell activation [30]. Induction of PD-L1-expressing B cells (PD-L1+ Bregs) would likely improve the control of Th cell activation and restore immune tolerance. Accordingly, we aimed to evaluate the effect of in vitro-induced PD-L1+ Bregs on CD4+ Th-cell activity from RA patients and healthy controls (HCs) by monitoring CD4+ Th cell activation, proliferation, and cytokine production.

2. Results

2.1. B-Cell Subsets and PD-L1 Expression Are Differentially Distributed Among HCs and RA Patients

Breg cells serve a protective role in autoimmune disorders, and their frequency is inversely correlated with the disease severity of RA patients [18,19,31]. These cells are commonly known to downregulate T-cell activity by secreting anti-inflammatory cytokines such as IL-10 as well as repressing the inflammatory response in autoimmune disorders by expressing high levels of PD-L1 molecules [22,32]. In the current study, we evaluated the frequency of PD-L1 expressing B cells among the total CD19+ B cell population, CD19+CD24hiCD38hi B cells (immature), CD19+CD24intCD38int B cells (mature, naive), CD19+CD24CD38+ B cells (plasmablasts), CD19+CD24+CD38B cells (memory), and CD19+CD24CD38-activated naïve/activated memory B cells (aNaïve/aMB) [33] from RA patients and healthy individuals. First, we assessed the frequency of B-cell subsets before and after the stimulation with CpG+C40L; the gating strategy is shown at Supplementary Figure S2. The total CD19+ B cells were not significantly different between the two study groups (Figure 1a,d). However, healthy donors’ samples before stimulation show a higher frequency of mature, naive B cells. In contrast, the RA patients’ samples exhibit an abundant aNaïve/aMB-cell subset both before and after stimulation (Figure 1a,d). The frequency of PD-L1+ B cells, representing B cells with high and intermediate expressions of PD-L1, was not significant among the B-cell subset from healthy donors and RA patients before CpG stimulation. However, the frequencies of the PD-L1+ B cells were drastically increased within all B-cell subsets in both healthy and RA samples after the stimulation, and significantly fewer PD-L1+ B cells were observed among immature B cells from RA patients (Figure 1b,e).
PD-L1hi Breg cells were reported to modulate Th-cell activity by IL-10-independent mechanism via interacting with PD-1 and were resistant to rituximab (anti-CD20) depletion [22]. Generally, we detected a very low level of PD-L1hi Breg cells in both healthy and RA subjects with a higher frequency among memory B cells from healthy donors as compared to RA samples before stimulation (Figure 1c). After stimulation, PD-L1hi Breg cells were significantly represented among different B-cell subsets from healthy donors (Figure 1f), while their frequencies were significantly lower among immature B cells, plasmablasts, and memory B cells from RA patients. Due to the scarcity of PD-L1hi Breg cells, we investigated their regulatory effect as a part of the PD-L1+ B cell population without further purification.
We tested the correlation of PD-L1 expression with RA disease parameters, CRP, RF, aCCP, and DAS28. We found that PD-L1 expression on stimulated mature and memory B cells was negatively correlated with CRP (Figure 1g,h), and no correlation was observed with other RA disease parameters.

2.2. Expression of PD-1 on CD4+ Th and Treg Cells

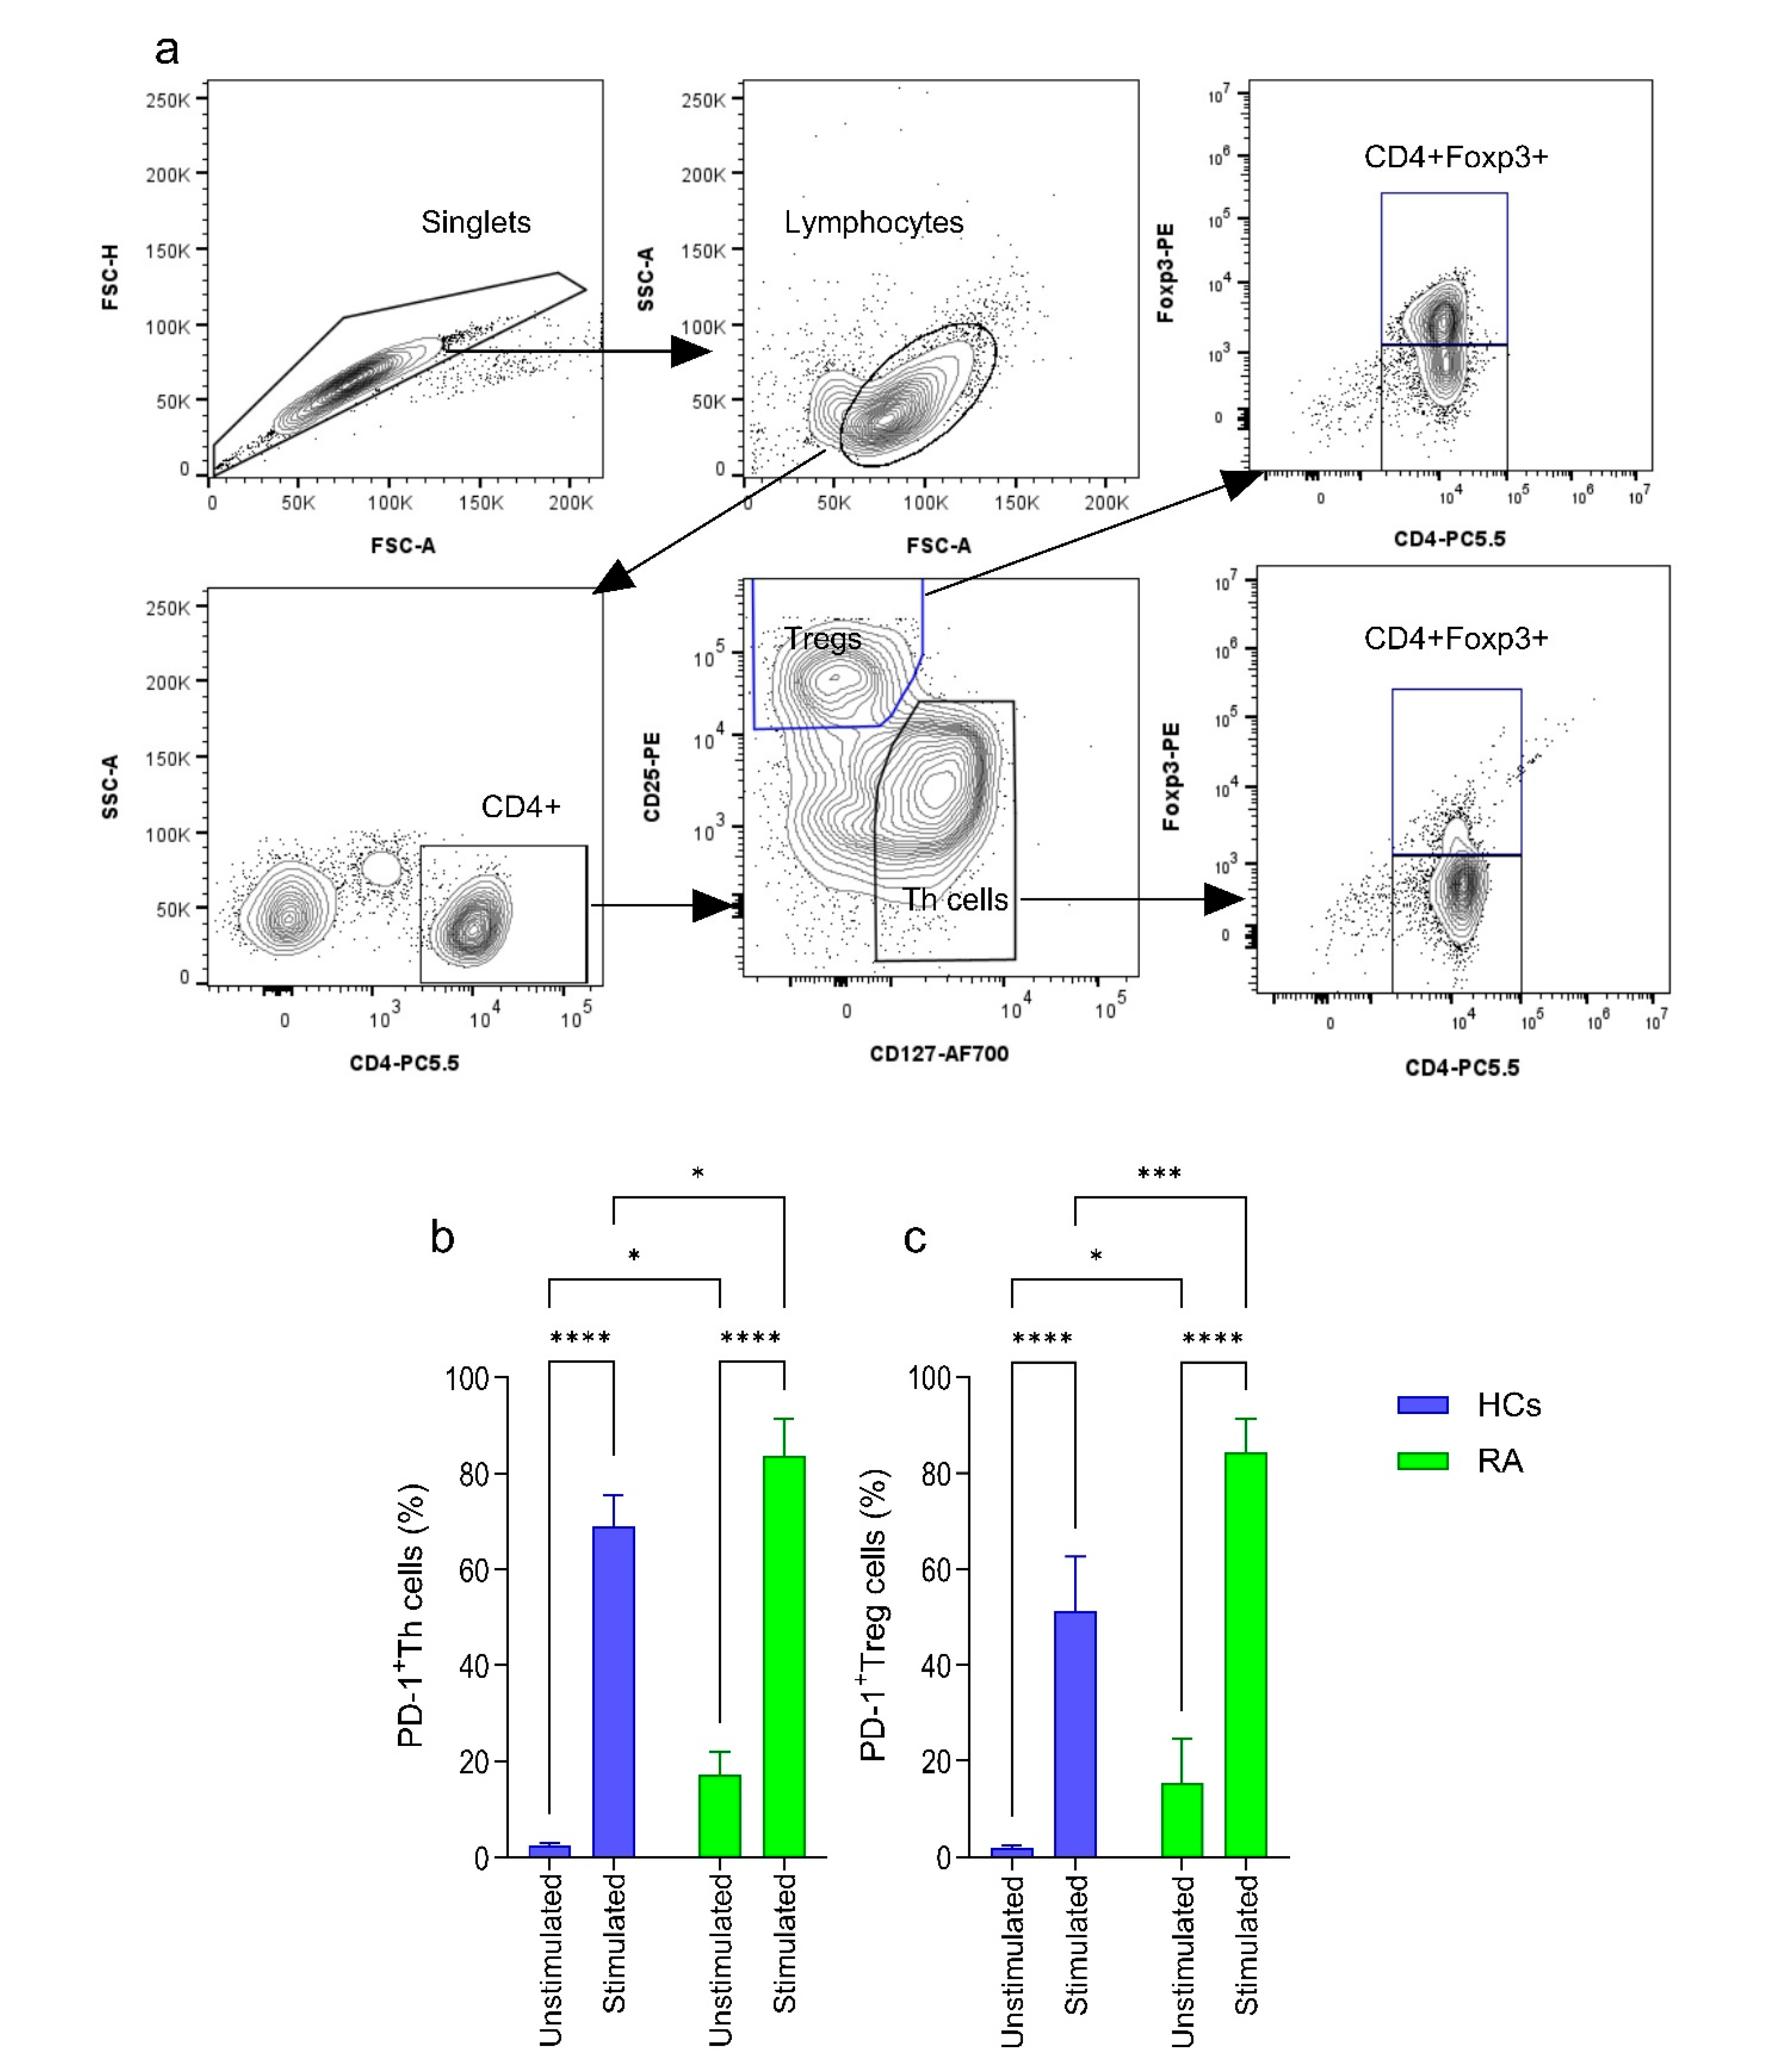
PD-1 expression on T cells plays an important role in modulating their activity by mediating coinhibitory signals that suppress T cell activation when associated with their ligands PD-L1 or PD-L2 [29]. It has been reported that Th cells from RA patients express higher levels of PD-1 compared to healthy individuals [34], exposing them to the PD-L1 positive cells should downregulate their functional activity. We evaluated the expression of PD-1 on CD4+CD25lo/−CD127+ Th cells and CD4+CD25hiCD127lo/−Treg cells from RA patients and healthy controls. Th cells and Treg cells were sorted from MACS-enriched pan-T cells using fluorescent activating cell sorting and analyzed for the expression of the transcription factor Foxp3 (Figure 2a). As expected, unstimulated Th and Treg cells from RA patients expressed higher levels of PD-1 molecule compared to Th/Treg in healthy donor samples (Figure 2b,c). We induced PD-1 expression by stimulating Th and Treg cells using anti-CD3 + anti-CD28 coated plate, the frequency of PD-1+Th/Treg cells was robustly increased in both RA patients and healthy individual samples, but the highest frequency was observed in samples from RA patients (Figure 2b,c; Supplementary Figure S3). Accordingly, Th and Treg cells should be susceptible to the modulatory effect of PD-L1+ Breg cells.

2.3. Th and Treg Cell Proliferation Is Not Significantly Affected by PD-L1+ Breg Cells

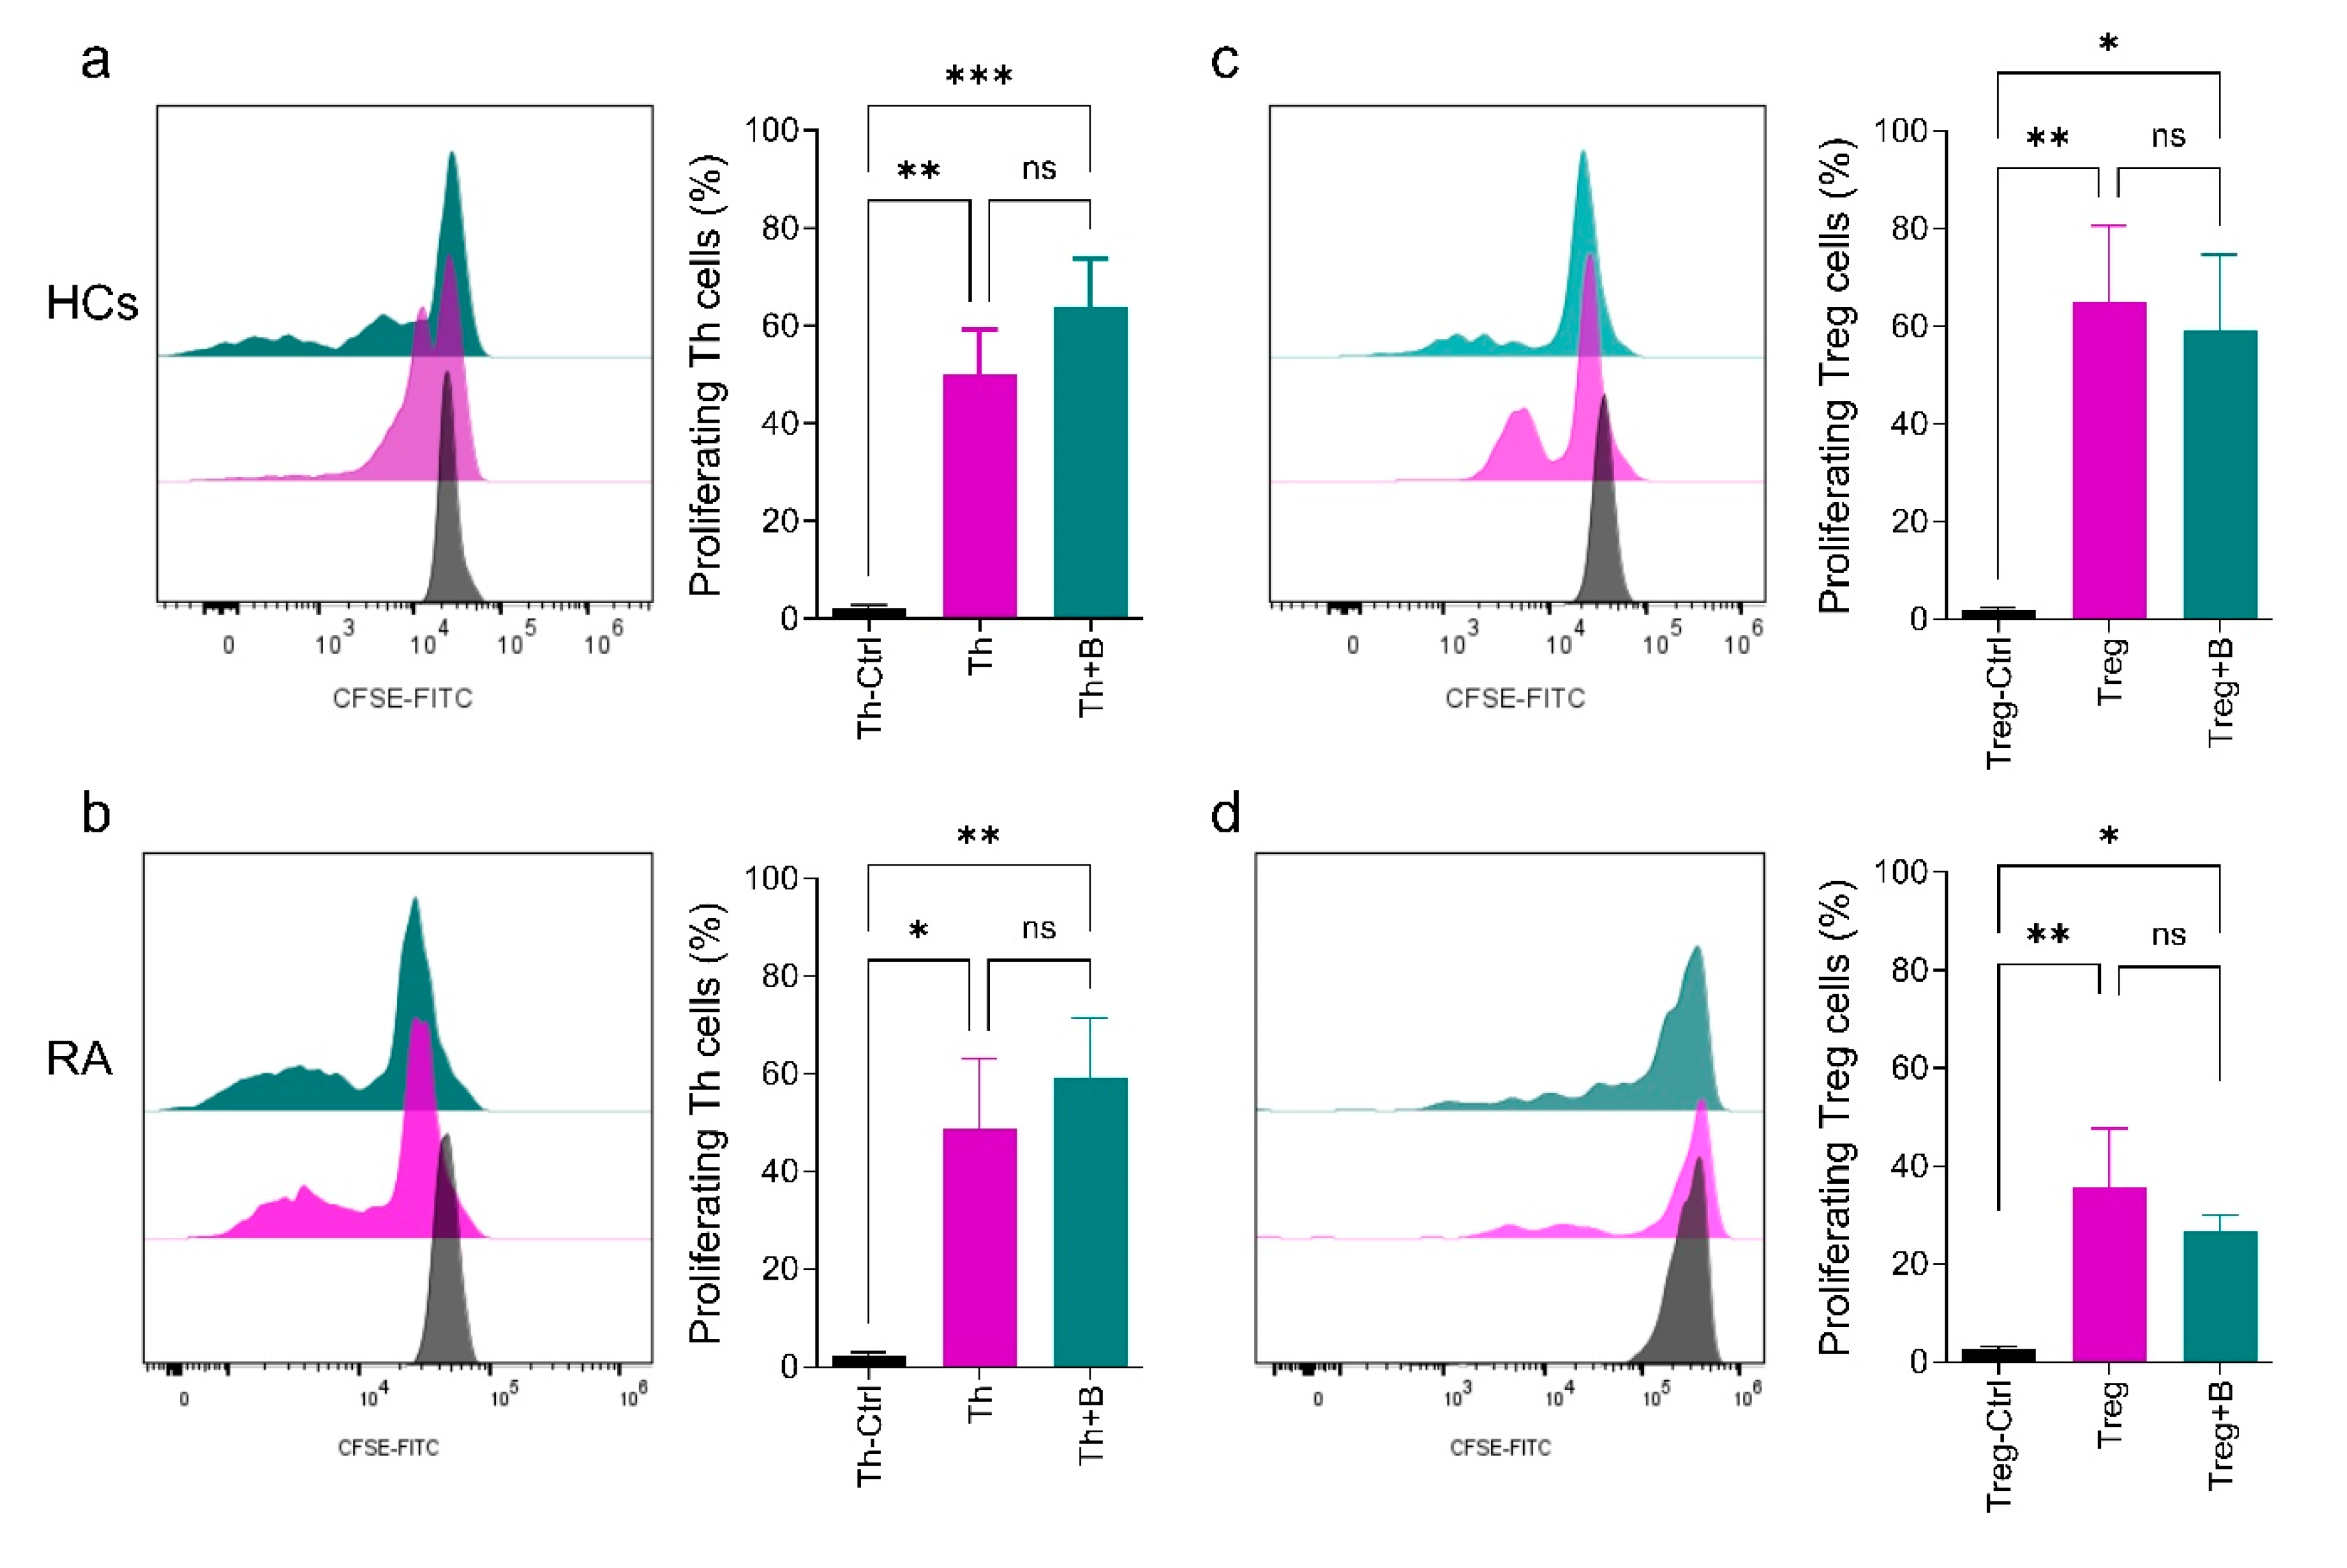
Previous works have demonstrated an impaired function of Breg cells in inhibiting CD4+ T cell proliferation and cytokine production in RA patients [9,20]. To test our hypothesis that the induction of PD-L1 expression in B cells from RA patients might enhance their regulatory effect, we evaluated the effect of PD-L1+ Breg cells on modulating the Th and Treg cells cell proliferation in an in vitro cell culture setting. The proliferation was assessed after Th or Treg cells were loaded with CFSE dye and stimulated in monoculture for 48 h before introducing the pre-stimulated PD-L1+ Breg cells for an additional 48 h. Following the dilution of CFSE in Th/Treg cells stimulated in monocultures and co-cultures (Th/Treg + B) as well as unstimulated Th/Treg cells (control), we observed that PD-L1+ Breg cells were unable to decrease Th cell proliferation in both RA and HC samples (Figure 3a,b, Supplementary Figure S4). However, the proliferation of Treg cells was insignificantly decreased in the samples from both donors (Figure 3c,d).

2.4. Functional Analysis of PD-L1+ Breg Cells by Comparing Cytokine Production

To further explore the induced PD-L1+ Breg cells’ role in manipulating the Th cells’ activity, we measured the production of IFN-γ, TNF-α, and IL-21, as these cytokines play a major role in triggering inflammation in RA and support antibody production by GC B cells as well as enhances local T cell activation in the synovium of RA patients [35].
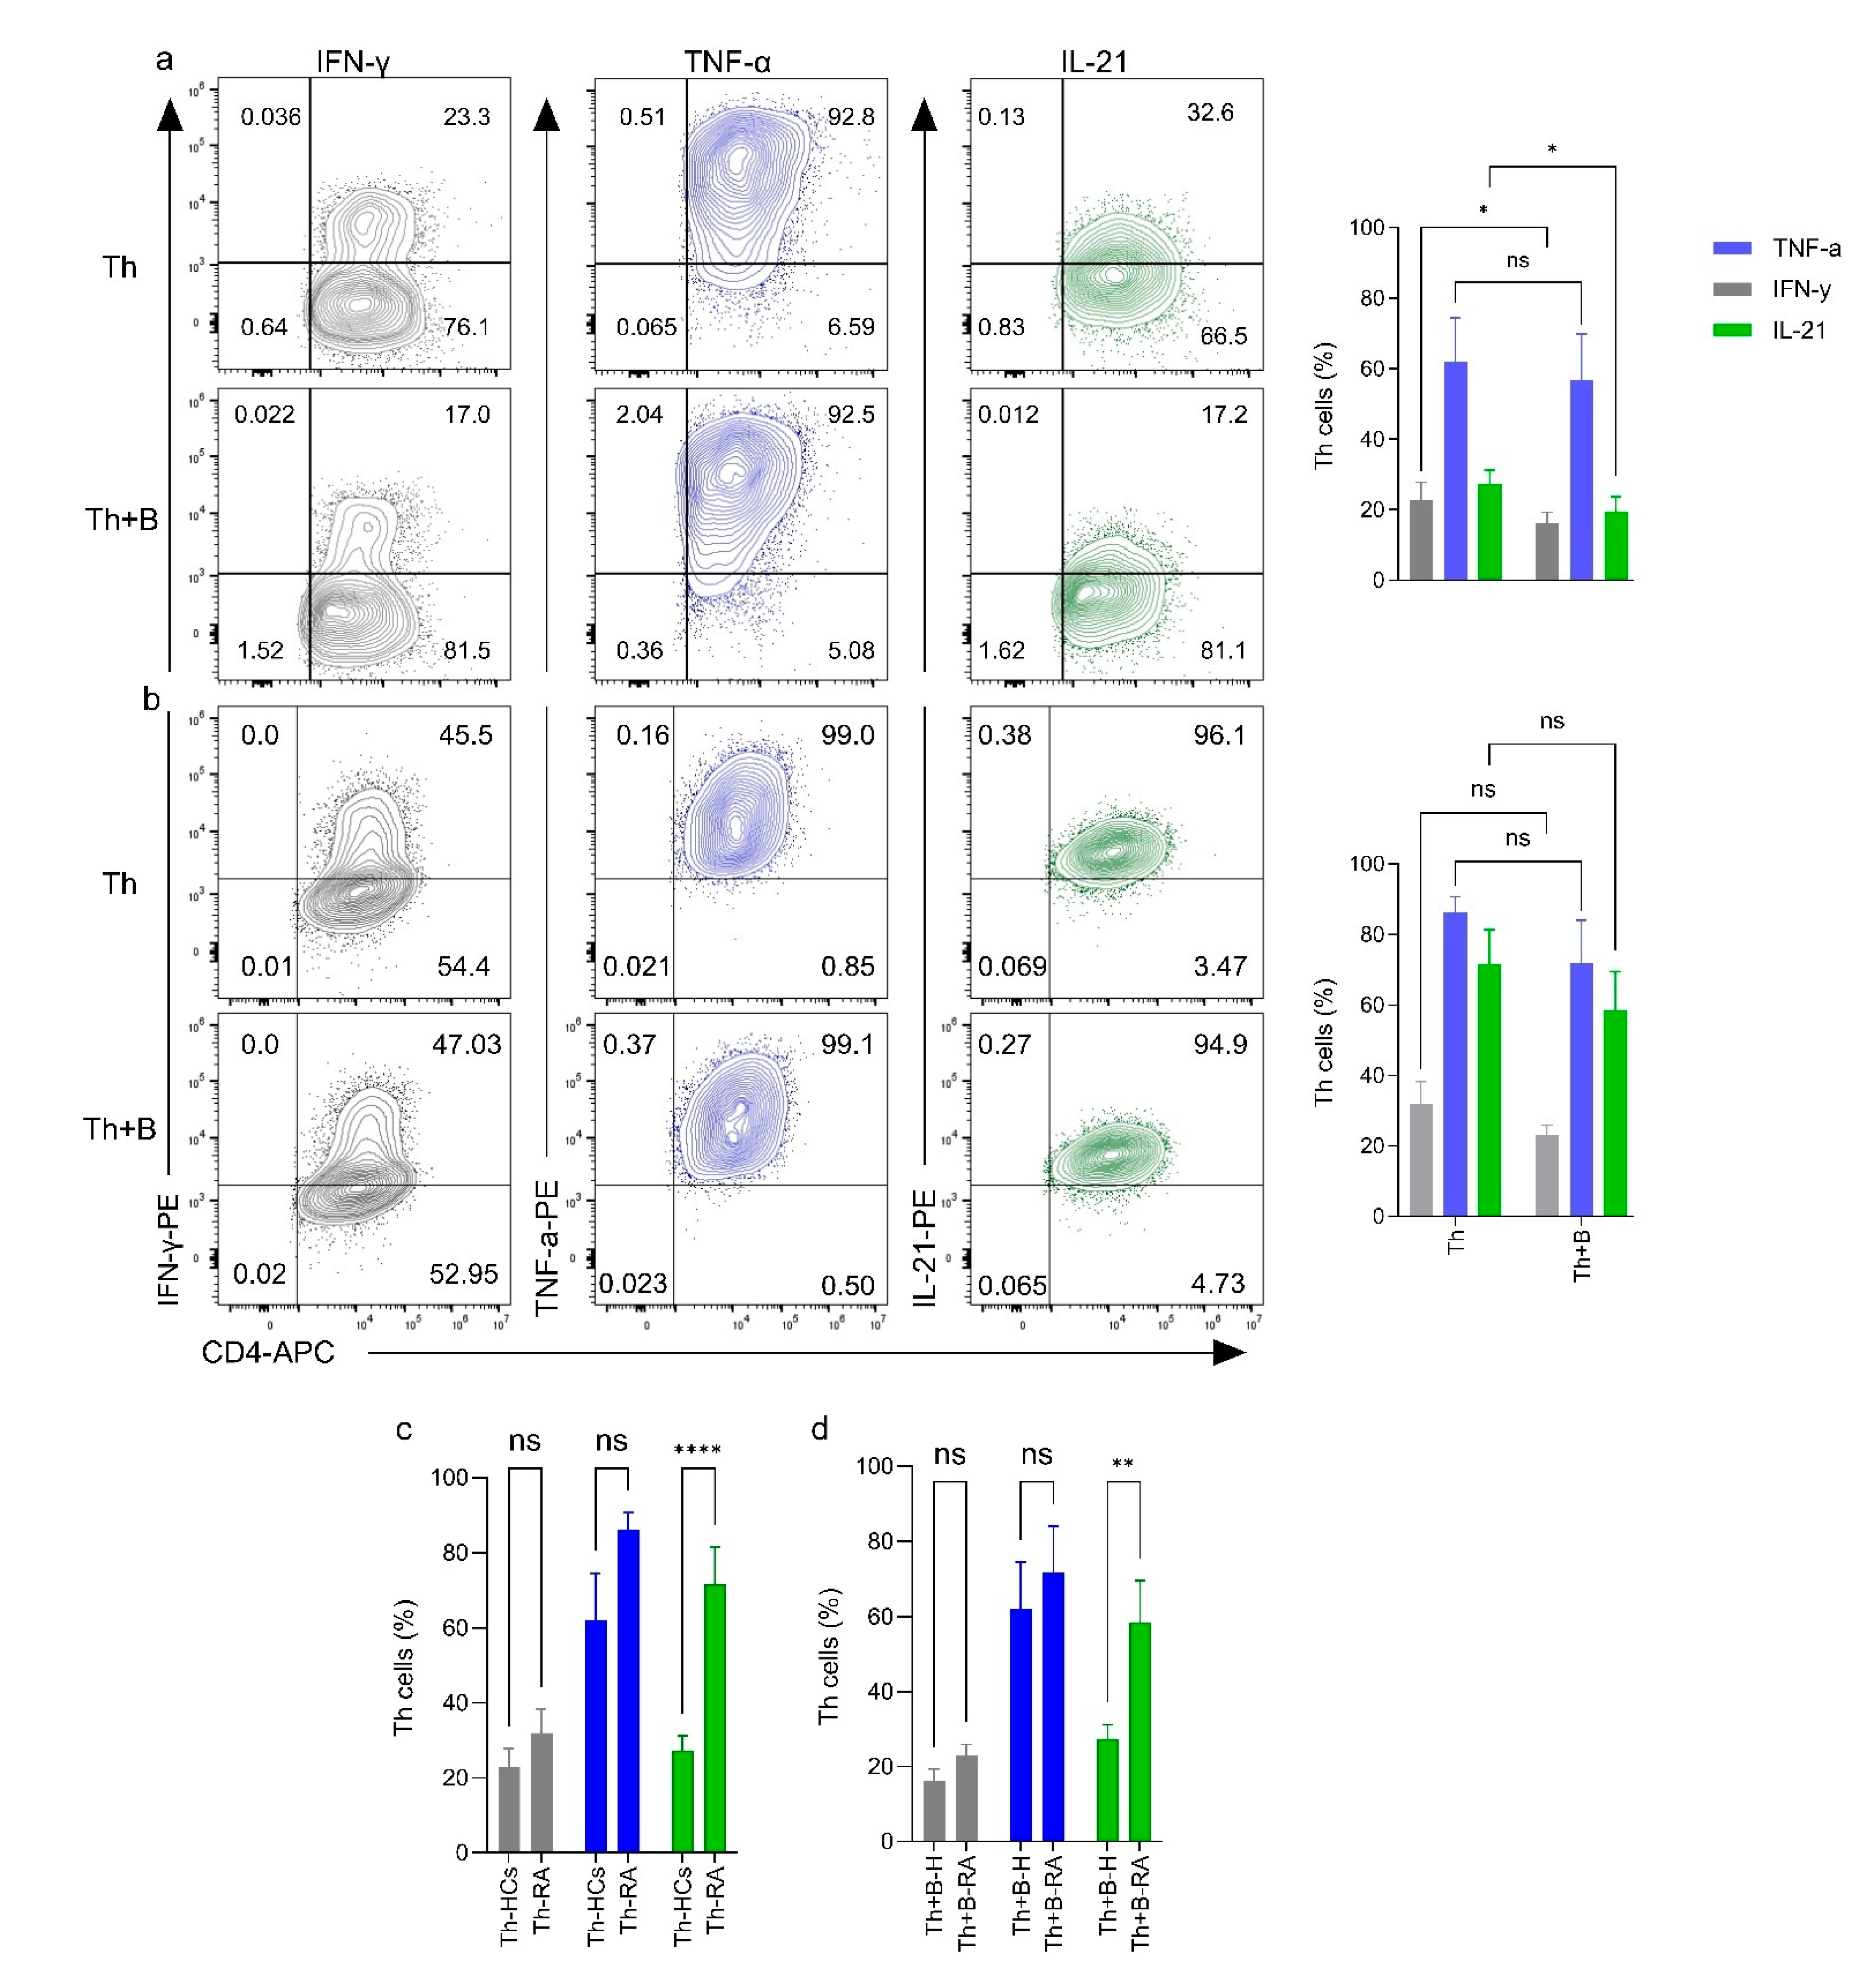
The production of these cytokines in the monoculture of activated Th cells and in their co-cultures with PD-L1+ Breg cells was monitored using intracellular staining protocol (Supplementary Figure S5). The frequency of TNF-α+ Th cells in monocultures from healthy donors was 62.0% ± 12.4%, and no significant reduction was detected by incorporating the autologous PD-L1+ Breg cells in the co-culture (mean ± s.e.m, 56.8% ± 12.9%, Figure 4a). Th cells from RA patients in monoculture produced a higher frequency of TNF-α+ (mean ± s.e.m, 86.2% ± 4.4% Figure 4c) compared to the corresponding monoculture from healthy donors. Similarly, the addition of PD-L1+ Breg cells did not significantly influence the frequency of TNF-α+ cells in the RA samples (mean ± s.e.m, 71.7% ± 12.2%, Figure 4b). The frequencies of IFN-ү+ Th cells in the monoculture were slightly different between healthy donors and RA patients (mean ± s.e.m, 22.9% ± 5.0% and 32.0% ± 6.3%, respectively, Figure 4a,b), and the addition of PD-L1+ Breg cells in co-cultures of healthy donors significantly reduced the frequency of IFN-ү producing Th cells (mean ± s.e.m, 16.1% ± 3.2%); this feature was not observed in RA patients’ samples (mean ± s.e.m, 23.1% ± 2.9%) (Figure 4a,b). Finally, IL-21+ Th cells were abundantly present in Th cells monocultures from RA patients compared to healthy controls (mean ± s.e.m, 71.5% ± 9.9% and 27.3% ± 3.8%, Figure 4c, respectively), and the autologous PD-L1+ Breg cells significantly reduced the frequency of IL-21+ Th cells in healthy donors’ samples but not in RA samples (mean ± s.e.m, 19.3% ± 4.4% and 58.5% ± 10.9%, Figure 4a,b, respectively). We further compared IFN-ү-, TNFα-, and IL-21-producing Th cells in T cell monocultures and in the co-cultures between the two groups; the frequency of IL-21-producing Th cells was significantly higher in both the monocultures and in the cocultures of RA patients’ samples (Figure 4c,d).

3. Discussion

Regulatory B cells are a subset of B cells that exert immunosuppressive activity mainly through the production of IL-10, TGF-β, and/or IL-35 or by highly expressing PD-L1 molecules [2,3,36]. As shown by Khan et al., the adoptive transfer of PD-L1hi Breg cells into mice suppresses follicular T cell (Tfh) activity whereas the absence of these cells leads to increased Tfh responses [22]. The importance of Breg cells in rheumatoid arthritis stems from their role in manipulating the inflammatory immune response. We and others have previously shown that the frequency of IL-10+ Breg cells and their function are impaired in RA and negatively correlated with disease progression [20,37]. Disease management in RA patients primarily focuses on controlling the inflammatory response by administering synthetic or biological Disease Modifying Anti-Rheumatic Drugs (DMARDs) with target-specific immune system pathways. However, an alternative therapeutic approach to cure the disease would be to induce immune homeostasis by restoring regulatory mechanisms, such as modifying the functional activity of regulatory T and B cells. The present study investigates the efficacy of downregulating Th-cell activities by exploiting the expression of PD-1 and PD-L1 molecules on activated Th and Breg cells, respectively.
Breg function has been identified within multiple human B-cell subtypes [32]. However, in RA and several autoimmune disorders, B-cell subsets are abnormally distributed resulting in a skewed distribution of Breg cells [38,39,40,41,42]. In the current study, the aNaïve/aMB cells were the most prominent B-cell subset in the peripheral blood of RA patients, and their frequency was significantly higher in RA as compared to healthy controls. These CD19+CD38CD24 B-cell subset was previously detected at higher frequencies in the elderly population, and they were associated with TNF production, suggesting a possible link between this specific B-cell subset and the increased inflammatory status [42]. In vitro stimulation of B cells by CpG to generate PD-L1+ B (Bregs) cells resulted in the expansion of plasmablasts in both RA and healthy samples; however, aNaïve/aMB cells persisted as the most prominent B-cell subset in stimulated samples of RA patients. The abundance of aNaïve/aMB cells in both non-stimulated and stimulated RA samples suggests that the patients have a high risk of having uncontrolled inflammation. This is in concert with the high level of TNFα production even in the unstimulated RA samples (Figure 4).
Breg cells can modulate CD4+ T-cell activity by expressing high PD-L1 molecules [22,31], and they have been well documented among immature B cells and memory B cells [43,44]. However, for a comprehensive analysis, we have monitored the PD-L1hi Breg cells among all our B-cell subsets including immature and mature B cells, plasmablasts, memory, and aNaïve/aMB cells. Although no significant difference in PD-L1 expression was observed, except in immature B cells of stimulated samples, we detected a significantly lower frequency of PD-L1hi Breg cells among memory B cells of unstimulated RA samples. Furthermore, this low frequency was also observed in the immature B cell, plasmablast, and in the memory B-cell subset of CpG-stimulated RA samples compared to healthy controls. This is consistent with case–control reports from Luo et al. [45], who found that the proportions of CD19+CD24hiCD38hi and CD19+CD24hiCD27+ Breg cells were significantly decreased in RA. We also described that PD-L1hiBreg cells were abundant among immature and memory B-cell subsets in CpG-stimulated samples from healthy controls, but their frequency was significantly decreased in RA samples, which may contribute to the uncontrolled inflammation in patients.
Th and Treg cells are key players in the pathogenesis of RA, as their functional activity significantly influences disease outcome [44]. We evaluated the activation status of Th and Treg cells from RA patients and healthy controls by measuring PD-1 expression. We found a significantly higher expression level of PD-1 molecule in RA compared to healthy controls both before and after CD3/CD28 stimulation indicating their active state [46]. High PD-1 expression should increase the possibility to interact with PD-L1+ Breg cells, which can downregulate Th cell functions, such as in the tumor microenvironment, where the interaction between PD-1/PD-L1 interaction leads to impaired antitumor immunity [9,22,47,48]. We, therefore, tested this hypothesis in co-cultures of CpG-stimulated PD-L1+ Breg cells and CD3/CD28-activated autologous Th cells. PD-L1+ Breg cells from both healthy and RA donors failed to inhibit Th cell proliferation in cocultures. This may be due to the heterogeneity of the CD4+CD25lo/−CD27+ Th cell subtype, as it may include different subsets at different developmental stages, and they may respond differently [49]. As PD-L1 interactions have been shown to modulate Treg-cell activity in mice, and Breg cells were supposed to promote differentiation of Tregs [50] thus we tested if Tregs proliferation is influenced by PD-1+ Breg cells in cocultures, but the difference in Treg proliferation in the presence and absence of Bregs was insignificant.
We further investigated the effects of induced PD-L1+ Breg cells on the IFN-γ, TNF-α, and IL-21 production by activating Th cells. PD-L1+ Breg cells from healthy individuals significantly downregulated both IFN-γ and IL-21 production in cocultures, whereas they did not reduce the production of any of the cytokines studied in RA patient samples, consistent with our previous study [46]. IL-21 production in activated Th cell monocultures from RA samples was approximately three times higher than in healthy controls and a similar difference was observed in cocultures with PD-L1+ Breg cells. These data suggest high functional activity of IL-21-producing Th cells in RA. As IL-21 is a key Tfh cytokine and plays a central role in supporting IgG production, targeting IL-21 could be an important factor in inhibiting autoantibody synthesis.
Taken together, these findings support the notion of impaired Breg cell function in RA patients [20,45] and shed light on the possibility of enhancing or restoring the regulatory function of Breg cells by inducing checkpoint molecule PD-L1 to downregulate the functional activity of Th cells in RA patients.
This research, however, is subject to some limitations. First, we had limited amounts of blood from the patients, which did not allow us to separate small subsets of cells, such as pTh, cTfh, and Bregs, for functional studies. Second, a larger number of patients in future studies would significantly improve the current results by minimizing the variance between donors, which would improve the power of the statistical analysis.

4. Methods

4.1. Patients and Controls

Peripheral blood samples were taken from 34 RA patients who did not receive biological therapy three months before sampling and met the American College of Rheumatology/European League Against Rheumatism Classification Criteria for rheumatoid arthritis [51] and 42 HCs. Patients and controls provided written informed consent. The blood samples were collected in heparinized VACUETTE® TUBE (Greiner Bio-One, Mosonmagyaróvár, Hungary). The demographic and clinical characteristics of RA are summarized in Table 1. This study was conducted following the Declaration of Helsinki and ethically approved by the Scientific and Research Ethics Committee of the Health Science Council and the National Center for Public Health and Pharmacy (NCPHP) (42578-6-2018/EÜIG).

4.2. B and T Cell Isolation

Peripheral blood mononuclear cells (PBMCs) were isolated from 50 mL of fresh heparinized whole blood using density gradient centrifugation. The whole blood was diluted with 2 µM EDTA-PBS in a 1:1 ratio, and 30 mL was layered in Leucosep tubes (Greiner Bio-One, Mosonmagyaróvár, Hungary) containing 15 mL of PBMC Spin Medium (PluriSelect, Leipzig, Germany) and centrifuged for 15 min at 800× g at room temperature (RT) using a swing-out bucket rotor with soft stop brakes. The suspension above the porous barrier was transferred to a new 50 mL flacon tube and filled up to 50 mL with 2 µM EDTA-PBS, centrifuged at 300× g for 10 min, and the pelleted PBMCs were washed twice with 2 µM EDTA-PBS. Finally, the PBMCs were counted and stored at 4 °C overnight in 50 mL of complete RPMI-1640 medium (10% FCS, RPMI-1640 with L-glutamine, 1% streptomycin/penicillin (Sigma-Aldrich, St. Louis, MI, USA).
B and T cells were separated from PBMCs by magnetic sorting using negative selection with Pan B cell (Lot No. 5211003043, BioLegend, Merck Life Science Kft., an affiliate of Merck KGaA, Darmstadt, Germany) or Pan T cell (Lot No. 5220205924, BioLegend) isolation kits following the manufacturer’s instructions. The purity of B and T cells was evaluated by CytoFlex LX flow cytometry after staining with Brilliant Violet 421™ conjugated anti-human CD19 mAbs, BV421™ (Clone: HIB19, BioLegend), and phycoerythrin (PE) conjugated anti-human CD3 mAbs (Clone: UCHT1, BioLegend).

4.3. Flow Cytometry and Cell Sorting

CD4+ Th cells (CD4+CD127+CD25low/−Foxp3) and Treg cells (CD4+CD127low/−CD25hi Foxp3+) were sorted by FACSAria III cell sorter (Becton–Dickinson, Franklin Lakes, NJ, USA). For the identification of Treg cells, anti-CD4 PC5.5 (clone. RPA-T4), anti-CD25 PE (clone. BC96), anti-CD127 AF700 (clone. A019D5), and anti-mouse/rat/human Foxp3 AF488 (clone 150D) were used, all from BioLegend. The T cells were blocked for 20 min with 10% mouse serum-PBS (MS-PBS). The staining master mix from the antibody conjugates, except the Foxp3-specific antibody prepared in 5% FCS-PBS, was added to the blocked T cells and incubated for 30 min on ice. The stained T cells were washed twice with 10 mL 2% FCS-PBS, resuspended in 5% FCS-PBS, and filtered through a 70 µm strainer for sorting. Immediately after sorting, the Th and Treg cells were tested for Foxp3 expression using anti-mouse/rat/human Foxp3 Alexa Fluor 488 with the True-Nuclear™ Transcription Factor kits (BioLegend) according to manufacturer guidelines. Anti-CD25 PE and anti-CD279 AF488 (clone. NAT105, BioLegend) were used to evaluate the expression level of CD25 and PD-1. Intracellular cytokine production by Th cells was measured by using the BD cytofix/cytopermTM Plus Fixation/Permeabilization kits (cat: 555028, Becton–Dickinson) and the anti-IL-21 PE (clone: 3A3-N2), anti-IFNγ PE (clone: 4S.B3), or anti-TNFα PE (clone: Mab11) antibodies, all from BioLegend. The B cells were characterized by using anti-CD19 BV421™ (clone: HIB19, Biolegend), anti-CD24 FITC (clone: MI.5, BioLegend), anti-CD38 AF700 (clone: HIT2, ImmunoTools, Friesoythe, Germany), and anti-PD-L1 PE (clone:29E.2A3, BioLegend) antibodies.

4.4. B and Th Cell Activation

The isolated B cells were stimulated for 48 h in a RPMI-1640 medium with L-glutamine (BioWhittaker®, Lonza, Basel, Switzerland) supplemented with 10% fetal calf serum (FCS) and 1% streptomycin/penicillin (Sigma-Aldrich) at 5 × 10⁴ cells per well using round-bottom 96-well culture plates (cat: 83.392.500, SARSTEDT AG & Co.KG, Sarstedt, Germany) at 37 °C and 5% CO2 in the presence of 1 μg/mL phosphorothioated unmethylated CpG oligodeoxynucleotide (ODN-2006) 59-TCGTCGTTTTGTCGTTTTGTCGT-39; (Sigma-Aldrich) and 1 μg/mL rh-sCD40L (animal-free, Cat No.712904, Biolegend) to induce PD-L1+ Breg cells.
Th cells and Tregs, either stained with (5-(6) Carboxyfluorescein diacetate Succinimidyl ester “mixed isomer”), (CFSE) dye (Invitrogen TM, Waltham, MA, USA), or unstained, were stimulated for 48 h in flat-bottom 96-well culture plates (cat: 83.3924.500, SARSTEDT AG & Co.KG) pre-coated with 1 µg/mL Ultra-LEAFTM Purified anti-human CD3 (clone. UCHT1, Cat. 300438, BioLegend) and 1 ug/mL Ultra-LEAFTM Purified anti-human CD28 (clone. CD28.2, Cat: 302934, BioLegend). The Th cells and Tregs were added at 5 × 10⁴ cells/50 µL density, and 1 µg/mL rh-IL-2 (Cat:11340023, ImmunoTools, Friesoythe, Germany) was added to Tregs culture.

4.5. Proliferation Assay

The pre-stimulated CFSE-uploaded Th cells and Tregs were either assigned for monoculture or co-culture with the autologous PD-L1+ B (Bregs) cells, which were washed twice with complete RPMI 1640 to minimize any direct effect of preexisting cytokines from B cells culture supernatant, such as IL-10. The coculture was prepared at a one-to-one ratio and incubated for an additional 48 h to evaluate the immunomodulatory effect of induced Breg cells on Th cells and Treg cell proliferation. In parallel, unstimulated control from Th and Treg cell monocultures were prepared. The proliferation was evaluated by monitoring the CFSE dilution using flow cytometry after staining the cells with 7AAD to exclude the dead cells. The B cells were removed from the analysis by placing the gate on the CD4 positive region when applying anti-human CD4-APC (clone: EDU-2, ImmunoTools, Friesoythe, Germany) or CD19 negative gate when anti-human CD19 BV421™ was used.

4.6. Evaluation of Cytokine Production

We assessed intracellularly the production of TNF-α, IFN-γ, and IL-21 by Th cells derived from monoculture and in coculture with B cells. Th cell monoculture was prepared by seeding 5 × 10⁴ Th cells on a 96-well F-bottom plate, which was pre-coated with ant-CD3 and anti-CD28 monoclonal antibodies for up to 96 h, and the coculture was prepared by adding the induced Breg cells into the Th cell monoculture after 48 h stimulation. By the end of the stimulation period, the cells were stimulated for the last 5 h with 50 ng/mL Phorbol 12-myristate 13-acetate (PMA) (Sigma-Aldrich); 1 μg/mL Ionomycin (Sigma-Aldrich); and BD GolgiPlug™ protein transporter inhibitor containing Brefeldin A; 1:1000 (Becton–Dickinson). The cultures were harvested into 96-well U-bottom plates and washed twice with 200 µL staining buffer (FACS buffer) and further blocked with 10% mouse serum for 20 min on ice. Subsequently, the cells were washed twice before adding 100 µL of 2.5 µg/mL anti-human CD4-APC. The mixture was incubated in the dark for 30 min and washed twice with staining buffer before applying fixation and permeabilization steps using the BD Cytofix/cytopermTM Plus Fixation/Permeabilization kits (Becton–Dickinson) following the manufacturer's instruction. Finally, 2.5 µg/mL of anti-TNFα PE, anti-IFNγ PE, or anti-IL-21 PE was added for 30 min. After washing twice, the samples were resuspended into 200 µL staining buffer and measured by flow cytometry.

4.7. Statistical Analysis

The data were analyzed using an ordinary one- or two-way ANOVA, followed by an uncorrected Fisher’s LSD test using Prism 9 for Windows version 9.0.0 (121). The results were represented as mean ± SEM, and p < 0.05 was considered a significant difference.

Supplementary Materials

The following supporting information can be downloaded at https://www.mdpi.com/article/10.3390/ijms26072998/s1.

Author Contributions

M.T. conducted the research, performed the acquisition, analysis, and interpretation of the data, performed statistical analysis of the results, and drafted the manuscript. B.G. developed and performed multiparametric flow cytometry assays and cell sorting and participated in the acquisition and analysis of data. A.F. and A.M. participated in the separation and flow cytometric analysis of T and B-cell subsets from healthy controls and RA patients, set up cell cultures, and monitored PD1 and PD-L1 expressions. K.B.V. and L.G.B. participated in cell separation and flow cytometric analysis of lymphocyte subsets, as well as in measuring T cell proliferation and intracellular cytokine production. B.R. and G.N. provided blood samples from RA patients, collected and provided clinical and demographic data on patients, and provided clinical expertise. G.S. provided the conception and design of the study and contributed to the drafting and revising of the manuscript. All authors have read and agreed to the published version of the manuscript.

Funding

This work was supported by the National Research, Development, and Innovation Office [K 128546, 2018]. The funders had no role in the study design, data collection and analysis, the decision to publish, or the preparation of the manuscript.

Institutional Review Board Statement

The study was conducted in accordance with the Declaration of Helsinki and ethically approved by the Scientific and Research Ethics Committee of the Health Science Council and the National Center for Public Health and Pharmacy (NCPHP) (42578-6-2018/EÜIG).

Informed Consent Statement

Informed consent was obtained from all subjects involved in the study.

Data Availability Statement

The data will be available upon request.

Acknowledgments

The authors would like to thank all the participants for their contributions. Special thanks to the healthy controls and RA patients for the donation of their blood. The authors also want to express their profound appreciation to Omdurman Islamic University, Sudan, and Tempus Public Foundation (TPF), Hungary, for their steadfast support for Mustafa Talib.

Conflicts of Interest

The authors declare that they have no competing interests.

Abbreviations

7AAD7-AminoactinomycinD
ACPAAnti-citrullinated protein antibody
CFSECarboxyfluorescein diacetate Succinimidyl ester “mixed isomer”
MACSMagneticactivating cells sorting
MBMemory B cells
PBPlasma blast cells
PBMCsPeripheral blood mononuclear cells
PCPlasma B cells
PD-1Programmed cell death protein 1
PMAPhorbol 12-myristate 13-acetate
RFRheumatoid factor
Tfhfollicular T helper cells
Tphperipheral T helper cells

References

  1. Yang, C.; Zhang, Y.; Wang, R.; Cheng, B.; Wu, Y.; Fu, X. IL-10+ CD19+ regulatory B cells induce CD4+ Foxp3+ regulatory T cells in serum of cervical cancer patients. Autoimmunity 2024, 57, 2290909. [Google Scholar] [CrossRef]
  2. Catalán, D.; Mansilla, M.A.; Ferrier, A.; Soto, L.; Oleinika, K.; Aguillón, J.C.; Aravena, O. Immunosuppressive mechanisms of regulatory B cells. Front. Immunol. 2021, 12, 611795. [Google Scholar]
  3. Wortel, C.M.; Heidt, S. Regulatory B cells: Phenotype, function and role in transplantation. Transpl. Immunol. 2017, 41, 1–9. [Google Scholar] [CrossRef]
  4. Kessel, A.; Haj, T.; Peri, R.; Snir, A.; Melamed, D.; Sabo, E.; Toubi, E. Human CD19+ CD25high B regulatory cells suppress proliferation of CD4+ T cells and enhance Foxp3 and CTLA-4 expression in T-regulatory cells. Autoimmun. Rev. 2012, 11, 670–677. [Google Scholar] [CrossRef] [PubMed]
  5. Zhang, S.; Wang, L.; Li, M.; Zhang, F.; Zeng, X. The PD-1/PD-L pathway in rheumatic diseases. J. Formos. Med. Assoc. 2021, 120, 48–59. [Google Scholar] [PubMed]
  6. Ray, A.; Wang, L.; Dittel, B.N. IL-10-independent regulatory B-cell subsets and mechanisms of action. Int. Immunol. 2015, 27, 531–536. [Google Scholar] [CrossRef]
  7. Das, A.; Ellis, G.; Pallant, C.; Lopes, A.R.; Khanna, P.; Peppa, D.; Chen, A.; Blair, P.; Dusheiko, G.; Gill, U.; et al. IL-10-producing regulatory B cells in the pathogenesis of chronic hepatitis B virus infection. J. Immunol. 2012, 189, 3925–3935. [Google Scholar] [CrossRef]
  8. Blair, P.A.; Norena, L.Y.; Flores-Borja, F.; Rawlings, D.J.; Isenberg, D.A.; Ehrenstein, M.R.; Mauri, C. CD19+CD24hiCD38hi B cells exhibit regulatory capacity in healthy individuals but are functionally impaired in systemic Lupus Erythematosus patients. Immunity 2010, 32, 129–140. [Google Scholar] [CrossRef]
  9. Flores-Borja, F.; Bosma, A.; Ng, D.; Reddy, V.; Ehrenstein, M.R.; Isenberg, D.A.; Mauri, C. CD19+ CD24hiCD38hi B cells maintain regulatory T cells while limiting TH1 and TH17 differentiation. Sci. Transl. Med. 2013, 5, 173ra23. [Google Scholar] [CrossRef]
  10. Matsumoto, M.; Baba, A.; Yokota, T.; Nishikawa, H.; Ohkawa, Y.; Kayama, H.; Kallies, A.; Nutt, S.L.; Sakaguchi, S.; Takeda, K. Interleukin-10-producing plasmablasts exert regulatory function in autoimmune inflammation. Immunity 2014, 41, 1040–1051. [Google Scholar]
  11. van de Veen, W.; Stanic, B.; Yaman, G.; Wawrzyniak, M.; Söllner, S.; Akdis, D.G.; Rückert, B.; Akdis, C.A.; Akdis, M. IgG4 production is confined to human IL-10–producing regulatory B cells that suppress antigen-specific immune responses. J. Allergy Clin. Immunol. 2013, 131, 1204–1212. [Google Scholar] [CrossRef] [PubMed]
  12. Zha, B.; Wang, L.; Liu, X.; Liu, J.; Chen, Z.; Xu, J.; Sheng, L.; Li, Y.; Chu, Y. Decrease in proportion of CD19+ CD24hiCD27+ B cells and impairment of their suppressive function in Graves’ disease. PLoS ONE 2012, 7, e49835. [Google Scholar]
  13. van der Vlugt, L.E.P.M.; Mlejnek, E.; Ozir-Fazalalikhan, A.; Janssen Bonas, M.; Dijksman, T.R.; Labuda, L.A.; Schot, R.; Guigas, B.; Möller, G.M.; Hiemstra, P.S. CD 24hi CD 27+ B cells from patients with allergic asthma have impaired regulatory activity in response to lipopolysaccharide. Clin. Exp. Allergy 2014, 44, 517–528. [Google Scholar] [PubMed]
  14. Aravena, O.; Ferrier, A.; Menon, M.; Mauri, C.; Aguillón, J.C.; Soto, L.; Catalán, D. TIM-1 defines a human regulatory B cell population that is altered in frequency and function in systemic sclerosis patients. Arthritis Res. Ther. 2017, 19, 8. [Google Scholar] [PubMed]
  15. Correale, J.; Farez, M.; Razzitte, G. Helminth infections associated with multiple sclerosis induce regulatory B cells. Ann. Neurol. 2008, 64, 187–199. [Google Scholar]
  16. Mauri, C.; Menon, M. Human regulatory B cells in health and disease: Therapeutic potential. J. Clin. Investig. 2017, 127, 772–779. [Google Scholar] [CrossRef]
  17. Menon, M.; Blair, P.A.; Isenberg, D.A.; Mauri, C. A regulatory feedback between plasmacytoid dendritic cells and regulatory B cells is aberrant in systemic lupus erythematosus. Immunity 2016, 44, 683–697. [Google Scholar]
  18. Daien, C.I.; Gailhac, S.; Mura, T.; Audo, R.; Combe, B.; Hahne, M.; Morel, J. Regulatory B10 cells are decreased in patients with rheumatoid arthritis and are inversely correlated with disease activity. Arthritis Rheumatol. 2014, 66, 2037–2046. [Google Scholar] [CrossRef]
  19. Ma, L.; Liu, B.; Jiang, Z.; Jiang, Y. Reduced numbers of regulatory B cells are negatively correlated with disease activity in patients with new-onset rheumatoid arthritis. Clin. Rheumatol. 2014, 33, 187–195. [Google Scholar]
  20. Bankó, Z.; Pozsgay, J.; Szili, D.; Tóth, M.; Gáti, T.; Nagy, G.; Rojkovich, B.; Sármay, G. Induction and differentiation of IL-10–producing regulatory B cells from healthy blood donors and rheumatoid arthritis patients. J. Immunol. 2017, 198, 1512–1520. [Google Scholar]
  21. Buch, M.H.; Smolen, J.S.; Betteridge, N.; Breedveld, F.C.; Burmester, G.; Dörner, T.; Ferraccioli, G.; Gottenberg, J.E.; Isaacs, J.; Kvien, T.K.; et al. Updated consensus statement on the use of rituximab in patients with rheumatoid arthritis. Ann. Rheum. Dis. 2011, 70, 909–920. [Google Scholar] [CrossRef]
  22. Khan, A.R.; Hams, E.; Floudas, A.; Sparwasser, T.; Weaver, C.T.; Fallon, P.G. PD-L1hi B cells are critical regulators of humoral immunity. Nat. Commun. 2015, 6, 5997. [Google Scholar] [PubMed]
  23. Radu, A.-F. and S.G. Bungau, Management of rheumatoid arthritis: An overview. Cells 2021, 10, 2857. [Google Scholar]
  24. Abbasi, M.; Mousavi, M.J.; Jamalzehi, S.; Alimohammadi, R.; Bezvan, M.H.; Mohammadi, H.; Aslani, S. Strategies toward rheumatoid arthritis therapy; the old and the new. J. Cell. Physiol. 2019, 234, 10018–10031. [Google Scholar] [PubMed]
  25. Nagy, G.; Roodenrijs, N.M.T.; Welsing, P.M.J.; Kedves, M.; Hamar, A.; Van Der Goes, M.C.; Kent, A.; Bakkers, M.; Blaas, E.; Senolt, L. EULAR definition of difficult-to-treat rheumatoid arthritis. Ann. Rheum. Dis. 2021, 80, 31–35. [Google Scholar] [PubMed]
  26. Nagy, G.; Roodenrijs, N.M.T.; Welsing, P.M.J.; Kedves, M.; Hamar, A.; van der Goes, M.C.; Kent, A.; Bakkers, M.; Pchelnikova, P.; Blaas, E. EULAR points to consider for the management of difficult-to-treat rheumatoid arthritis. Ann. Rheum. Dis. 2022, 81, 20–33. [Google Scholar]
  27. Nagy, G.; Gunkl-Tóth, L.; Dorgó, A.M.; McInnes, I.B. The concept of difficult-to-treat disease in rheumatology: Where next? Lancet Rheumatol. 2025, 7, e274–e289. [Google Scholar] [CrossRef]
  28. Ding, T.; Su, R.; Wu, R.; Xue, H.; Wang, Y.; Su, R.; Gao, C.; Li, X.; Wang, C. Frontiers of Autoantibodies in Autoimmune Disorders: Crosstalk Between Tfh/Tfr and Regulatory B Cells. Front. Immunol. 2021, 12, 641013. [Google Scholar] [CrossRef]
  29. Heine, G.; Drozdenko, G.; Grün, J.R.; Chang, H.D.; Radbruch, A.; Worm, M. Autocrine IL-10 promotes human B-cell differentiation into IgM- or IgG-secreting plasmablasts. Eur. J. Immunol. 2014, 44, 1615–1621. [Google Scholar] [CrossRef]
  30. Lin, X.; Kang, K.; Chen, P.; Zeng, Z.; Li, G.; Xiong, W.; Yi, M.; Xiang, B. Regulatory mechanisms of PD-1/PD-L1 in cancers. Mol. Cancer 2024, 23, 108. [Google Scholar]
  31. Cui, D.; Zhang, L.; Chen, J.; Zhu, M.; Hou, L.; Chen, B.; Shen, B. Changes in regulatory B cells and their relationship with rheumatoid arthritis disease activity. Clin. Exp. Med. 2015, 15, 285–292. [Google Scholar] [CrossRef]
  32. Guan, H.; Wan, Y.; Lan, J.; Wang, Q.; Wang, Z.; Li, Y.; Zheng, J.; Zhang, X.; Wang, Z.; Shen, Y. PD-L1 is a critical mediator of regulatory B cells and T cells in invasive breast cancer. Sci. Rep. 2016, 6, 35651. [Google Scholar] [CrossRef] [PubMed]
  33. Sanz, I.; Wei, C.; Jenks, S.A.; Cashman, K.S.; Tipton, C.; Woodruff, M.C.; Hom, J.; Lee, F.E.-H. Challenges and opportunities for consistent classification of human B cell and plasma cell populations. Front. Immunol. 2019, 10, 2458. [Google Scholar] [CrossRef] [PubMed]
  34. Straube, J.; Bukhari, S.; Lerrer, S.; Winchester, R.J.; Gartshteyn, Y.; Henick, B.S.; Dragovich, M.A.; Mor, A. PD-1 signaling uncovers a pathogenic subset of T cells in inflammatory arthritis. Arthritis Res. Ther. 2024, 26, 32. [Google Scholar] [CrossRef] [PubMed]
  35. Peng, B.; Ming, Y.; Yang, C. Regulatory B cells: The cutting edge of immune tolerance in kidney transplantation. Cell Death Dis. 2018, 9, 109. [Google Scholar] [CrossRef]
  36. Zacca, E.R.; Onofrio, L.I.; Acosta, C.D.V.; Ferrero, P.V.; Alonso, S.M.; Ramello, M.C.; Mussano, E.; Onetti, L.; Cadile, I.I.; Stancich, M.I. PD-L1+ regulatory B cells are significantly decreased in rheumatoid arthritis patients and increase after successful treatment. Front. Immunol. 2018, 9, 2241. [Google Scholar]
  37. Hansen, A.; Odendahl, M.; Reiter, K.; Jacobi, A.M.; Feist, E.; Scholze, J.; Burmester, G.R.; Lipsky, P.E.; Dörner, T. Diminished peripheral blood memory B cells and accumulation of memory B cells in the salivary glands of patients with Sjögren’s syndrome. Arthritis Rheum. 2002, 46, 2160–2171. [Google Scholar] [CrossRef]
  38. Fekete, A.; Soos, L.; Szekanecz, Z.; Szabo, Z.; Szodoray, P.; Barath, S.; Lakos, G. Disturbances in B-and T-cell homeostasis in rheumatoid arthritis: Suggested relationships with antigen-driven immune responses. J. Autoimmun. 2007, 29, 154–163. [Google Scholar] [CrossRef]
  39. Souto-Carneiro, M.M.; Mahadevan, V.; Takada, K.; Fritsch-Stork, R.; Nanki, T.; Brown, M.; Fleisher, T.A.; Wilson, M.; Goldbach-Mansky, R.; Lipsky, P.E. Alterations in peripheral blood memory B cells in patients with active rheumatoid arthritis are dependent on the action of tumour necrosis factor. Arthritis Res. Ther. 2009, 11, R84. [Google Scholar] [CrossRef]
  40. Jacobi, A.M.; Reiter, K.; Mackay, M.; Aranow, C.; Hiepe, F.; Radbruch, A.; Hansen, A.; Burmester, G.R.; Diamond, B.; Lipsky, P.E. Activated memory B cell subsets correlate with disease activity in systemic lupus erythematosus: Delineation by expression of CD27, IgD, and CD95. Arthritis Rheum. 2008, 58, 1762–1773. [Google Scholar] [CrossRef]
  41. Wang, H.; Liu, C.; Chen, W.; Ding, G. The skewed frequency of B-cell subpopulation CD19+ CD24 hiCD38 hi cells in peripheral blood mononuclear cells is correlated with the elevated serum sCD40L in patients with active systemic lupus erythematosus. J. Cell. Biochem. 2019, 120, 11490–11497. [Google Scholar] [CrossRef] [PubMed]
  42. Buffa, S.; Pellicanò, M.; Bulati, M.; Martorana, A.; Goldeck, D.; Caruso, C.; Pawelec, G.; Colonna-Romano, G. A novel B cell population revealed by a CD38/CD24 gating strategy: CD38− CD24− B cells in centenarian offspring and elderly people. Age 2013, 35, 2009–2024. [Google Scholar] [CrossRef]
  43. Khoder, A.; Sarvaria, A.; Alsuliman, A.; Chew, C.; Sekine, T.; Cooper, N.; Mielke, S.; De Lavallade, H.; Muftuoglu, M.; Fernandez Curbelo, I. Regulatory B cells are enriched within the IgM memory and transitional subsets in healthy donors but are deficient in chronic GVHD. Blood J. Am. Soc. Hematol. 2014, 124, 2034–2045. [Google Scholar]
  44. Wang, C.; Xu, H.; Gao, R.; Leng, F.; Huo, F.; Li, Y.; Liu, S.; Xu, M.; Bai, J. CD19+ CD24hiCD38hi regulatory B cells deficiency revealed severity and poor prognosis in patients with sepsis. BMC Immunol. 2022, 23, 54. [Google Scholar]
  45. Luo, J.; Su, Q.Y.; Li, Q.; Zhang, X.; Yang, S.Q.; Liu, Y.R.; Gao, H.Y.; Yu, Q.; He, P.F.; Li, X. POS0455 The Status of Breg Cells and Breg-Related Cytokines in Patients with Rheumatoid Arthritis; BMJ Publishing Group Ltd.: London, UK, 2023. [Google Scholar]
  46. Talib, M.; Gyebrovszki, B.; Bőgér, D.; Csomor, R.; Mészáros, A.; Fodor, A.; Rojkovich, B.; Sármay, G. Helper T Cells are Hyperactive and Contribute to the Dysregulation of Antibody Production in Patients with Rheumatoid Arthritis. Int. J. Mol. Sci. 2024, 25, 10190. [Google Scholar] [CrossRef]
  47. Sarvaria, A.; Madrigal, J.A.; Saudemont, A. B cell regulation in cancer and anti-tumor immunity. Cell. Mol. Immunol. 2017, 14, 662–674. [Google Scholar] [PubMed]
  48. Sun, L.; Su, Y.; Jiao, A.; Wang, X.; Zhang, B. T cells in health and disease. Signal Transduct. Target. Ther. 2023, 8, 235. [Google Scholar] [PubMed]
  49. Baker, K.F.; McDonald, D.; Hulme, G.; Hussain, R.; Coxhead, J.; Swan, D.; Schulz, A.R.; Mei, H.E.; MacDonald, L.; Pratt, A.G. Single-cell insights into immune dysregulation in rheumatoid arthritis flare versus drug-free remission. Nat. Commun. 2024, 15, 1063. [Google Scholar]
  50. Wong, M.; La Cava, A.; Hahn, B.H. Blockade of programmed death-1 in young (New Zealand Black× New Zealand White) F1 mice promotes the suppressive capacity of CD4+ regulatory T cells protecting from lupus-like disease. J. Immunol. 2013, 190, 5402–5410. [Google Scholar] [CrossRef]
  51. Felson, D.T.; Smolen, J.S.; Wells, G.; Zhang, B.; Van Tuyl, L.H.D.; Funovits, J.; Aletaha, D.; Allaart, C.F.; Bathon, J.; Bombardieri, S. American College of Rheumatology/European League Against Rheumatism provisional definition of remission in rheumatoid arthritis for clinical trials. Arthritis Rheum. 2011, 63, 573–586. [Google Scholar]
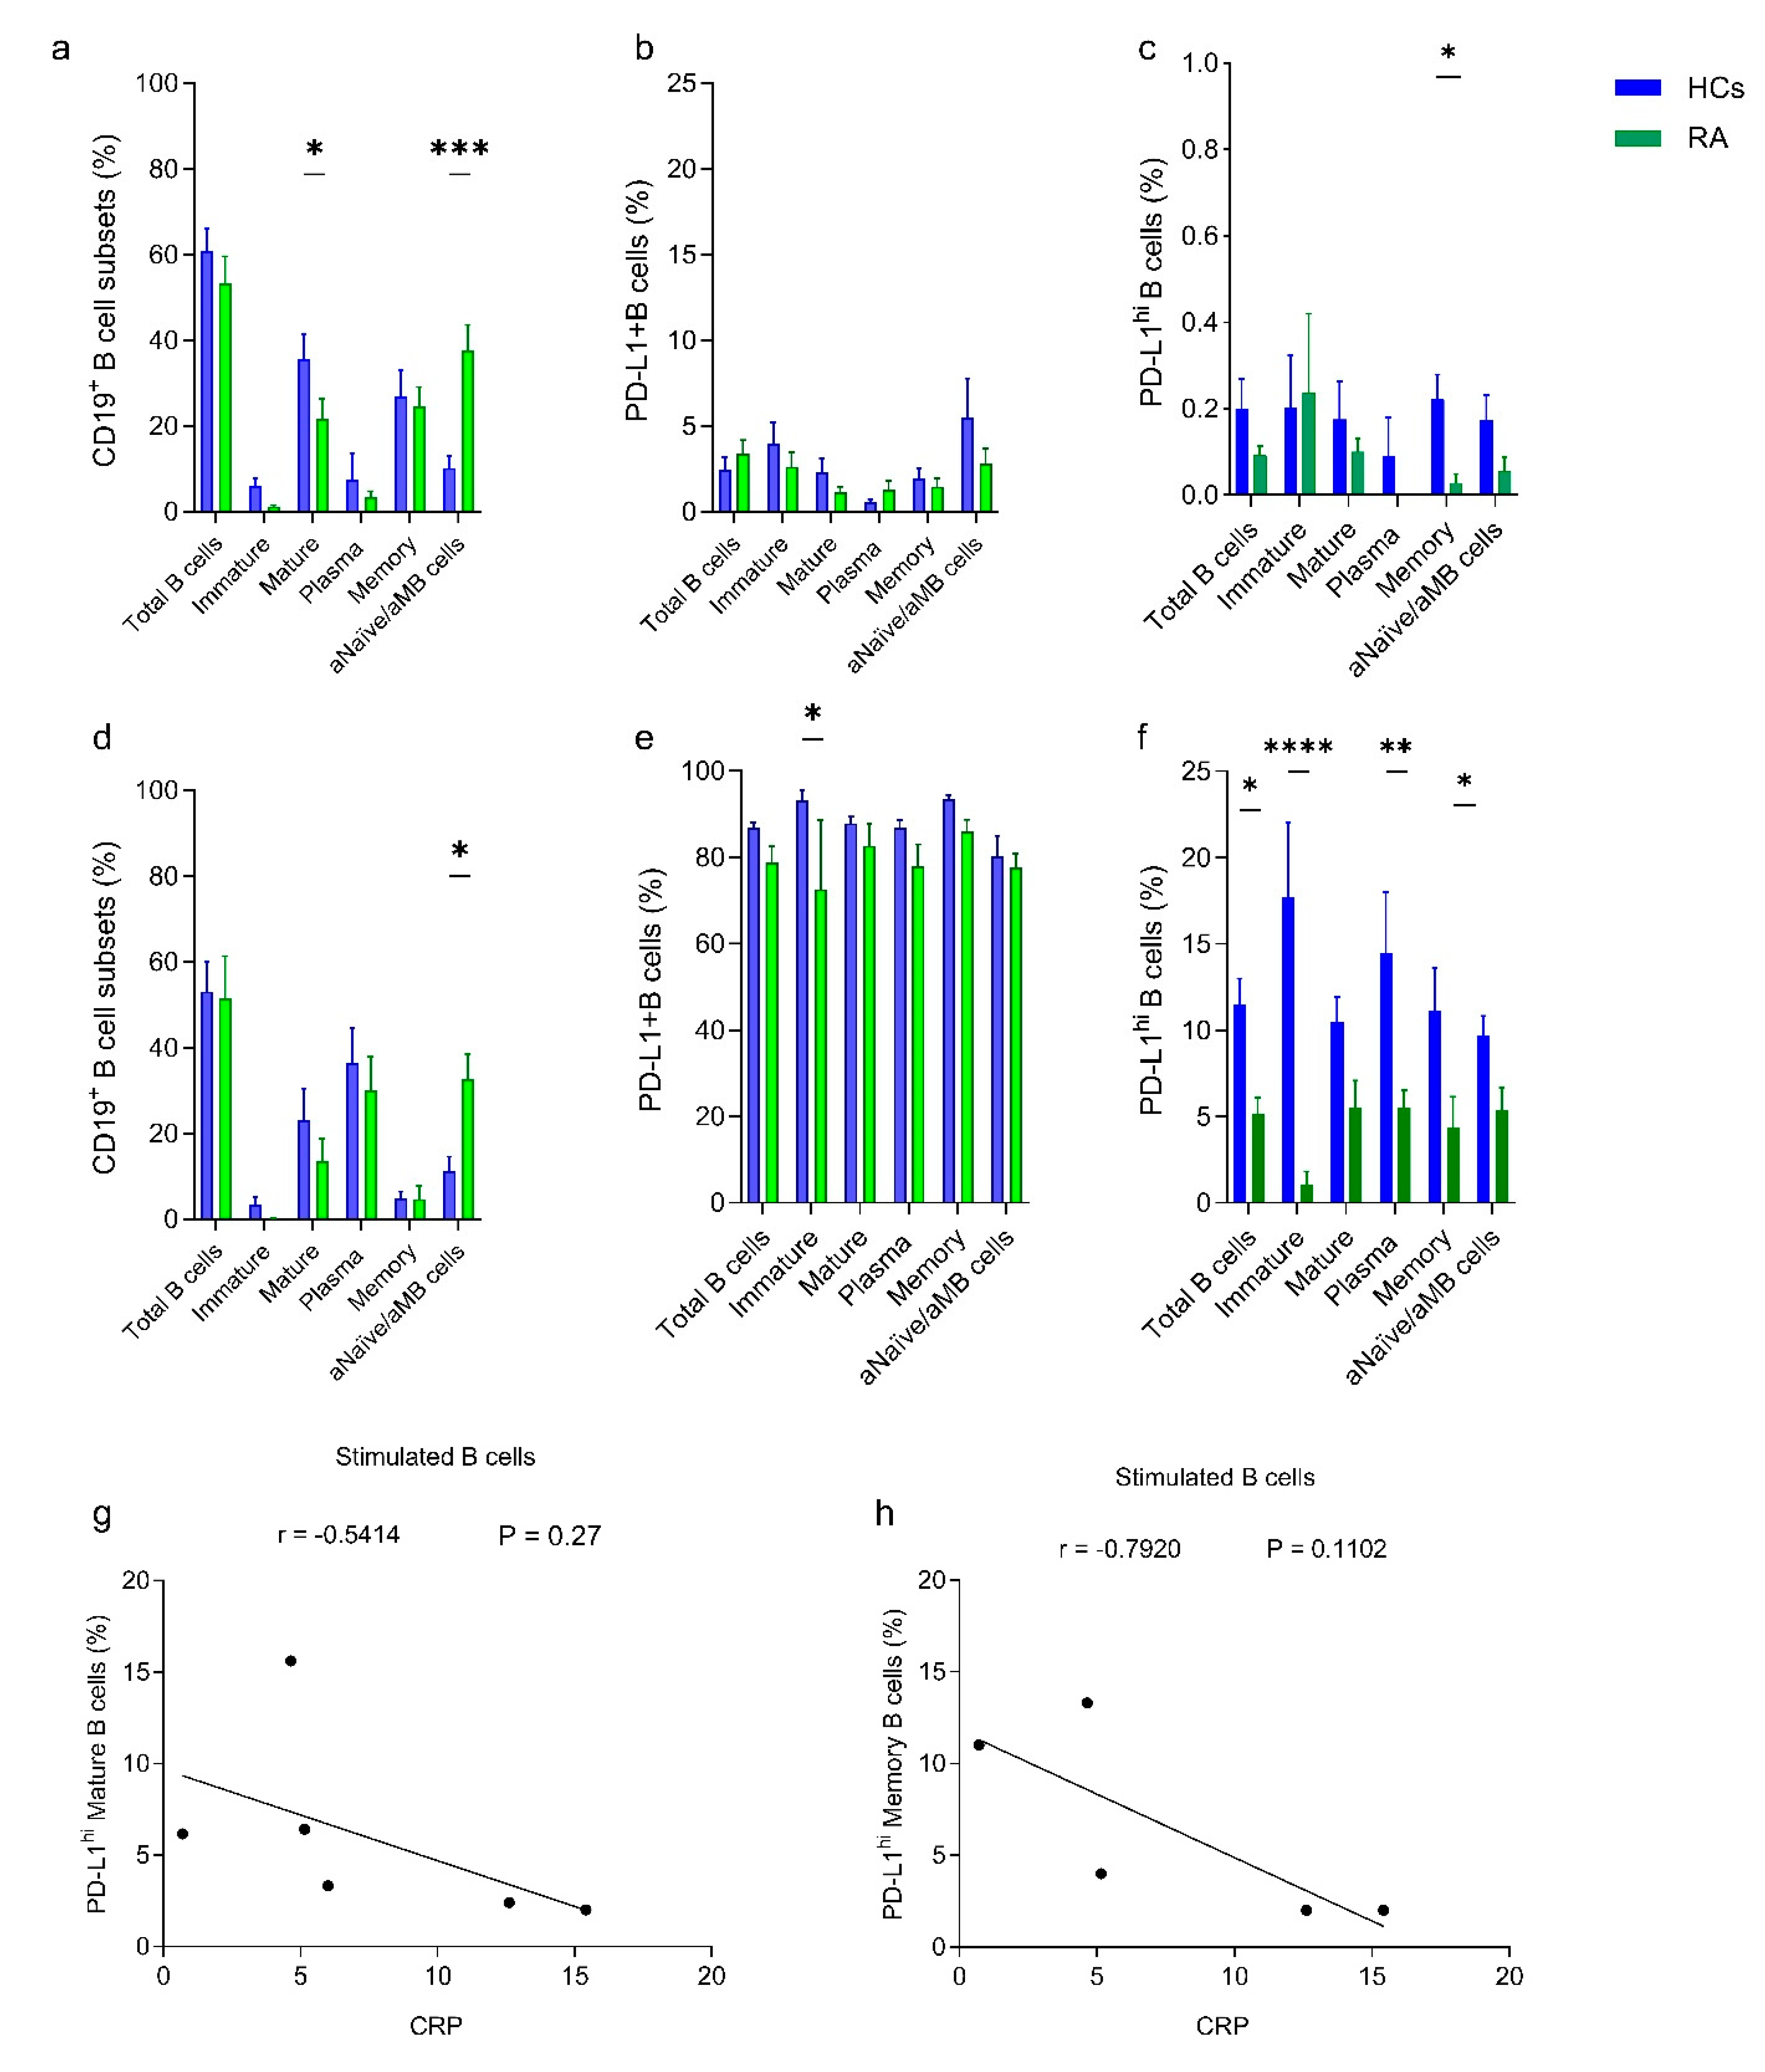
Figure 1. B-cell subsets and PD-L1 expression (a,d) showing the frequency of B-cell subsets before and after stimulation, respectively. B-cell subsets were gated as total B cells (CD19+ B cells), immature B cells (CD19+CD24hiCD38hiB cells), mature B cells (CD19+CD24+CD38+ B cells), plasmablast cells (CD19+CD24CD38+ B cells), memory B cells (CD19+CD24+CD38B cells) and activated naïve/memory B cells (CD19+CD24CD38B cells). Panel (b,e) represent the frequency of PD-L1+ B cells among the specified B-cell subsets before and after stimulation, respectively. Panel (c) depicts the frequency of PD-L1hi Breg cells among PD-L1+ B cells from different B subsets before stimulation and (f) after stimulation. The results were calculated from healthy control (blue-filled bar chart, n = 8) and RA patients (green-filled bar chart, n = 8). The correlation between CRP and PD-L1hi expression on mature and memory B cells was shown in (g,h), respectively, the analysis was performed for 5 to 6 patients for whom the required parameters were available. The B cells were stimulated for 96 h using CpG and sCD40L. The quantification is presented as mean ± S.E.M, using Ordinary Two-way ANOVA with uncorrected Fisher’s LSD. The significance was taken as * p < 0.5, ** p < 0.01, *** p < 0.001, **** p < 0.0001, aNaïve/aMB cells; activated naïve/activated memory B cells.
Ijms 26 02998 g001
Figure 2. Assessment of PD-1 expression on Th/Treg cells. (a) Gating strategy of CD4+CD25lo/−CD127+Th and CD4+CD25hiCD127lo/−Treg cells sorted from peripheral blood and Foxp3 expression assessment among sorted Th and Treg cells. (b) Quantification of PD-1 expression on unstimulated and stimulated Th cells and (c) from Treg cells among HCs (n = 28) and RA patients (n = 19). All cell cultures were prepared by seeding 5 × 10⁴ Th/Treg cells in pre-coated plates with anti-CD3 and anti-CD28 monoclonal antibodies and stimulated for 96 h. The quantification is presented as mean ± S.E.M, using Ordinary Two-way ANOVA with uncorrected Fisher’s LSD. The significance was taken as * p < 0.5, *** p < 0.001, **** p < 0.0001.
Ijms 26 02998 g002
Figure 3. PD-L1+ Breg cell insignificantly affects the proliferation of Th (a,b) and Treg cells (c,d) from HCs and RA patients. The histograms to the left of each bar chart represent the proliferation pattern, and the bar chart depicts the quantification of the percentage of proliferating Th/Treg cells in unstimulated control, monoculture, or co-culture. At least (n = 9) and (n = 7) independent experiments from HCs and RA patients were used for quantification, respectively. Th and Treg cells were stimulated for 48 h by anti-CD3 and anti-CD28; for Treg cell stimulation, IL-2 was included in the cell culture. The co-cultures were prepared by adding pre-stimulated PD-L1+ Breg cells to the pre-stimulated Th/Treg cells, and all cultures were incubated for an additional 48 h before evaluation. The T cells and B cells were added into the culture at a 1:1 ratio. The data were evaluated using Ordinary One-way ANOVA with uncorrected Fisher’s LSD. The significance was taken as * p < 0.5, ** p < 0.01, *** p < 0.001. ns: not significant.
Ijms 26 02998 g003
Figure 4. PD-L1+ Breg cells downregulate IFN-γ/IL21+ Th cells in HCs (a) but not in RA patients’ samples (b). On the left, a representative flow cytometry dot plot shows the percentage of IFN-γ/TNF-α/IL21 positive Th cells in activated Th cell monoculture (upper rows) and co-culture with PD-L1+ B cells (lower rows). On the right, the quantification of at least (n = 8) and (n = 7) independent experiments from HCs and RA patients, respectively. (c) a bar chart compares the production level of specific cytokines, IFN-γ (gray bar), TNF-α, (blue bar), or IL-21 (green bar), and a comparison of cytokine production between HCs and RA patients within similar culture conditions, in T cell monocultures (c), and in co-cultures of Th and PD-L1+ Bregs (d). The experiments were evaluated using Ordinary One-way ANOVA with uncorrected Fisher’s LSD. The significance was taken as * p < 0.5, ** p < 0.01, **** p < 0.0001. ns: not significant.
Ijms 26 02998 g004
Table 1. Clinical and demographic data for RA patients.
RA (n = 25) Reference Value (RV)
Age (y; mean [range])63.60 (43–84)
M/F (N)4/30
Disease duration (y; mean [range])15.00 (4.00–29.00)
Treatments:
 Methotrexate6
 Methotrexate + folic acid1
 Methotrexate + Medrol1
 Methotrexate + Hydroxychloroquine2
 Methotrexate + adalimumab-adaz1
 Methotrexate + folic acid + Medrol1
 Methotrexate + rituximab2
 Methotrexate + Medrol + tofacitinib1
 Certolizumab pegol + leflunomide1
 Leflunomide + Medrol1
 Leflunomide1
 Etanercept + Leflunomide1
 Adalimumab-adaz2
 Sulfasalazine + Methotrexate + Adalimumab1
 Adalimumab-adaz + hydroxychloroquine + Methotrexate + folic acid1
 Methotrexate + folic acid + sulfasalazine + adalimumab-adaz1
 Adalimumab + Methotrexate + folic acid + medrol+ hydroxychloroquine1
CRP (mg/L; mean [range])12.30 (0.58–53.00)<8 mg/L
DAS28 [ESR-based] (mean [range])4.00 (2.3–6.70.00)
aCCP (IU/mL) <20 IU/mL
 aCCP −n = 5
 aCCP + (mean [range])2161.00 (25.00–32,000.00)
RF (IU/mL) <20 IU/mL
 RF −n = 8
 RF + (mean[range])151.85 (13.00–961.00)
Abbreviations: M/F: male/female, CRP: C-reactive proteins, DAS28: disease activity score using 28 joint counts, ESR: erythrocyte sedimentation rate, aCCP: anti-cyclic citrullinated peptide antibody, RF: rheumatoid factor, IU/mL: international units per milliliter.
Disclaimer/Publisher’s Note: The statements, opinions and data contained in all publications are solely those of the individual author(s) and contributor(s) and not of MDPI and/or the editor(s). MDPI and/or the editor(s) disclaim responsibility for any injury to people or property resulting from any ideas, methods, instructions or products referred to in the content.