Article

Unveiling the Forensic Potential of Oral and Nasal Microbiota in Post-Mortem Interval Estimation

1
Institute of Forensic Science, Fudan University, Shanghai 200032, China
2
Ministry of Education’s Key Laboratory of Contemporary Anthropology, School of Life Sciences, Fudan University, Shanghai 200438, China
3
Key Laboratory of Forensic Evidence and Science Technology, Institute of Forensic Science, Ministry of Public Security, Shanghai 200042, China
4
School of Life Sciences, Fudan University, Shanghai 200438, China
5
Department of Forensic Medicine, Guizhou Medical University, Guiyang 550004, China
*
Authors to whom correspondence should be addressed.
Int. J. Mol. Sci. 2025, 26(7), 3432; https://doi.org/10.3390/ijms26073432 (registering DOI)
Submission received: 10 February 2025 / Revised: 24 March 2025 / Accepted: 3 April 2025 / Published: 6 April 2025
(This article belongs to the Special Issue New Perspectives on Biology in Forensic Diagnostics)

Abstract

:
Microbiota have emerged as a promising tool for estimating the post-mortem interval (PMI) in forensic investigations. The role of oral and nasal microbiota in cadaver decomposition is crucial; however, their distribution across human cadavers at different PMIs remains underexplored. In this study, we collected 88 swab samples from the oral and nasal cavities of 10 healthy volunteers and 34 human cadavers. Using 16S rRNA gene sequencing, we conducted comprehensive analyses of the alpha diversity, beta diversity, and relative abundance distribution to characterize the microbial communities in both healthy individuals and cadavers at varying PMIs and under different freezing conditions. Random forest models identified Firmicutes, Proteobacteria, Bacteroidota, Actinobacteriota, and Fusobacteriota as potential PMI-associated biomarkers at the phylum level for both the oral and nasal groups, along with genus-level biomarkers specific to each group. These biomarkers exhibited nonlinear changes over increasing PMI, with turning points observed on days 5, 12, and 22. The random forest inference models demonstrated that oral biomarkers at both the genus and phylum levels achieved the lowest mean absolute error (MAE) values in the training dataset (MAE = 2.16 days) and the testing dataset (MAE = 5.14 days). Additionally, freezing had minimal impact on the overall phylum-level microbial composition, although it did affect the relative abundance of certain phyla. At the genus level, significant differences in microbial biomarkers were observed between frozen and unfrozen cadavers, with the oral group showing greater stability compared to the nasal group. These findings suggest that the influence of freezing should be considered when using genus-level microbial data to estimate PMIs. Overall, our results highlight the potential of oral and nasal microbiota as robust tools for PMI estimation and emphasize the need for further research to refine predictive models and explore the environmental factors shaping microbial dynamics.

1. Introduction

The post-mortem interval (PMI), defined as the time elapsed between death and the examination of the cadaver, is a crucial parameter in forensic investigations [1]. Traditional methods for PMI estimation, such as assessing rigor mortis, algor mortis, livor mortis, cadaveric discoloration, and gastric content digestion, are often affected by external environmental factors and rely heavily on the subjective judgment of forensic examiners [2,3,4]. To enhance PMI estimation, advanced techniques, including forensic entomology [5], molecular biology (e.g., analyses of RNA, DNA, and proteins) [6,7,8], spectroscopy [9], and radiological technologies [10], have been developed. However, these methods often suffer from drawbacks, such as limited precision, sensitivity to external environmental conditions, or inefficacy for longer PMIs [3]. Consequently, the development of more precise, reliable, and stable methods for PMI estimation remains a key focus in forensic research.
Recent studies have shown that microbial communities, both within and outside the body, undergo predictable and systematic changes after death, which are closely linked to the PMI [11,12,13,14,15]. Notably, integrating microbiome data with machine learning models has significantly improved the accuracy of PMI prediction [4,16,17,18]. These findings highlight that microbiome-based methodologies could offer a less subjective and potentially more reliable framework for PMI estimation.
Diverse microbiota residing in the oral and nasal cavities play important roles in cadaver decomposition, making them promising targets for PMI estimation research [19]. The ease and non-invasive nature of sample collection from these sites further strengthens their potential for forensic applications. Several studies have explored the relationship between microbial communities in the oral or nasal cavities and PMIs [17,20,21,22,23]. However, there are some limitations in the existing research. One notable issue is the relatively small number of studies involving large-scale human samples. Much of the current research relies on animal models, such as rats [17,20] and mice [4], which may not fully capture the complexity of human decomposition due to differences in physiology and microbial communities. Additionally, many human studies are limited by small sample sizes [21] or narrow PMI ranges [21], which can undermine the generalizability and accuracy of the findings. Moreover, research on the role of the nasal microbiota in PMI estimation remains sparse, and there has been relatively little investigation into how environmental factors, such as freezing, influence PMI estimation, highlighting key areas for further exploration [24,25,26].
This study aimed to examine the distribution of oral and nasal microbiota in both healthy living individuals and human cadavers, considering varying PMIs and different freezing conditions. We expected to uncover identifiable patterns and biomarkers within these microbiota that could be instrumental in estimating PMIs, providing valuable insights for forensic applications.

2. Results

2.1. Overall Characterization of 16S rRNA Sequencing Data

A total of 88 swab samples were collected and analyzed from the oral and nasal cavities of 10 healthy volunteers and 34 human cadavers. The 10 healthy volunteers (Group H) comprised 5 males and 5 females, with a mean age of 26.3 years. Among the 34 cadavers, there were 26 males and 8 females, with a mean age of 52.6 years. The PMI in this study was defined as the time elapsed from death to sample collection. Based on the stages of cadaveric decomposition [14], the cadavers were categorized into four groups: Group D1 (PMI 1–3 days, fresh decay stage), Group D2 (PMI 4–7 days, bloat stage), Group D3 (PMI 8–15 days, active decay stage), and Group D4 (PMI > 15 days, advanced decay stage). Detailed information is provided in Table 1.
All samples were successfully sequenced on an Illumina platform targeting the V3–V4 region of the 16S rRNA gene, generating a total of 7,277,506 raw reads. After removing low-quality reads, we obtained 6,376,368 clean reads and identified 8253 bacterial ASV sequences for the subsequent analysis. The average number of clean reads was 75,586 and the average number of ASVs was 293 per sample.

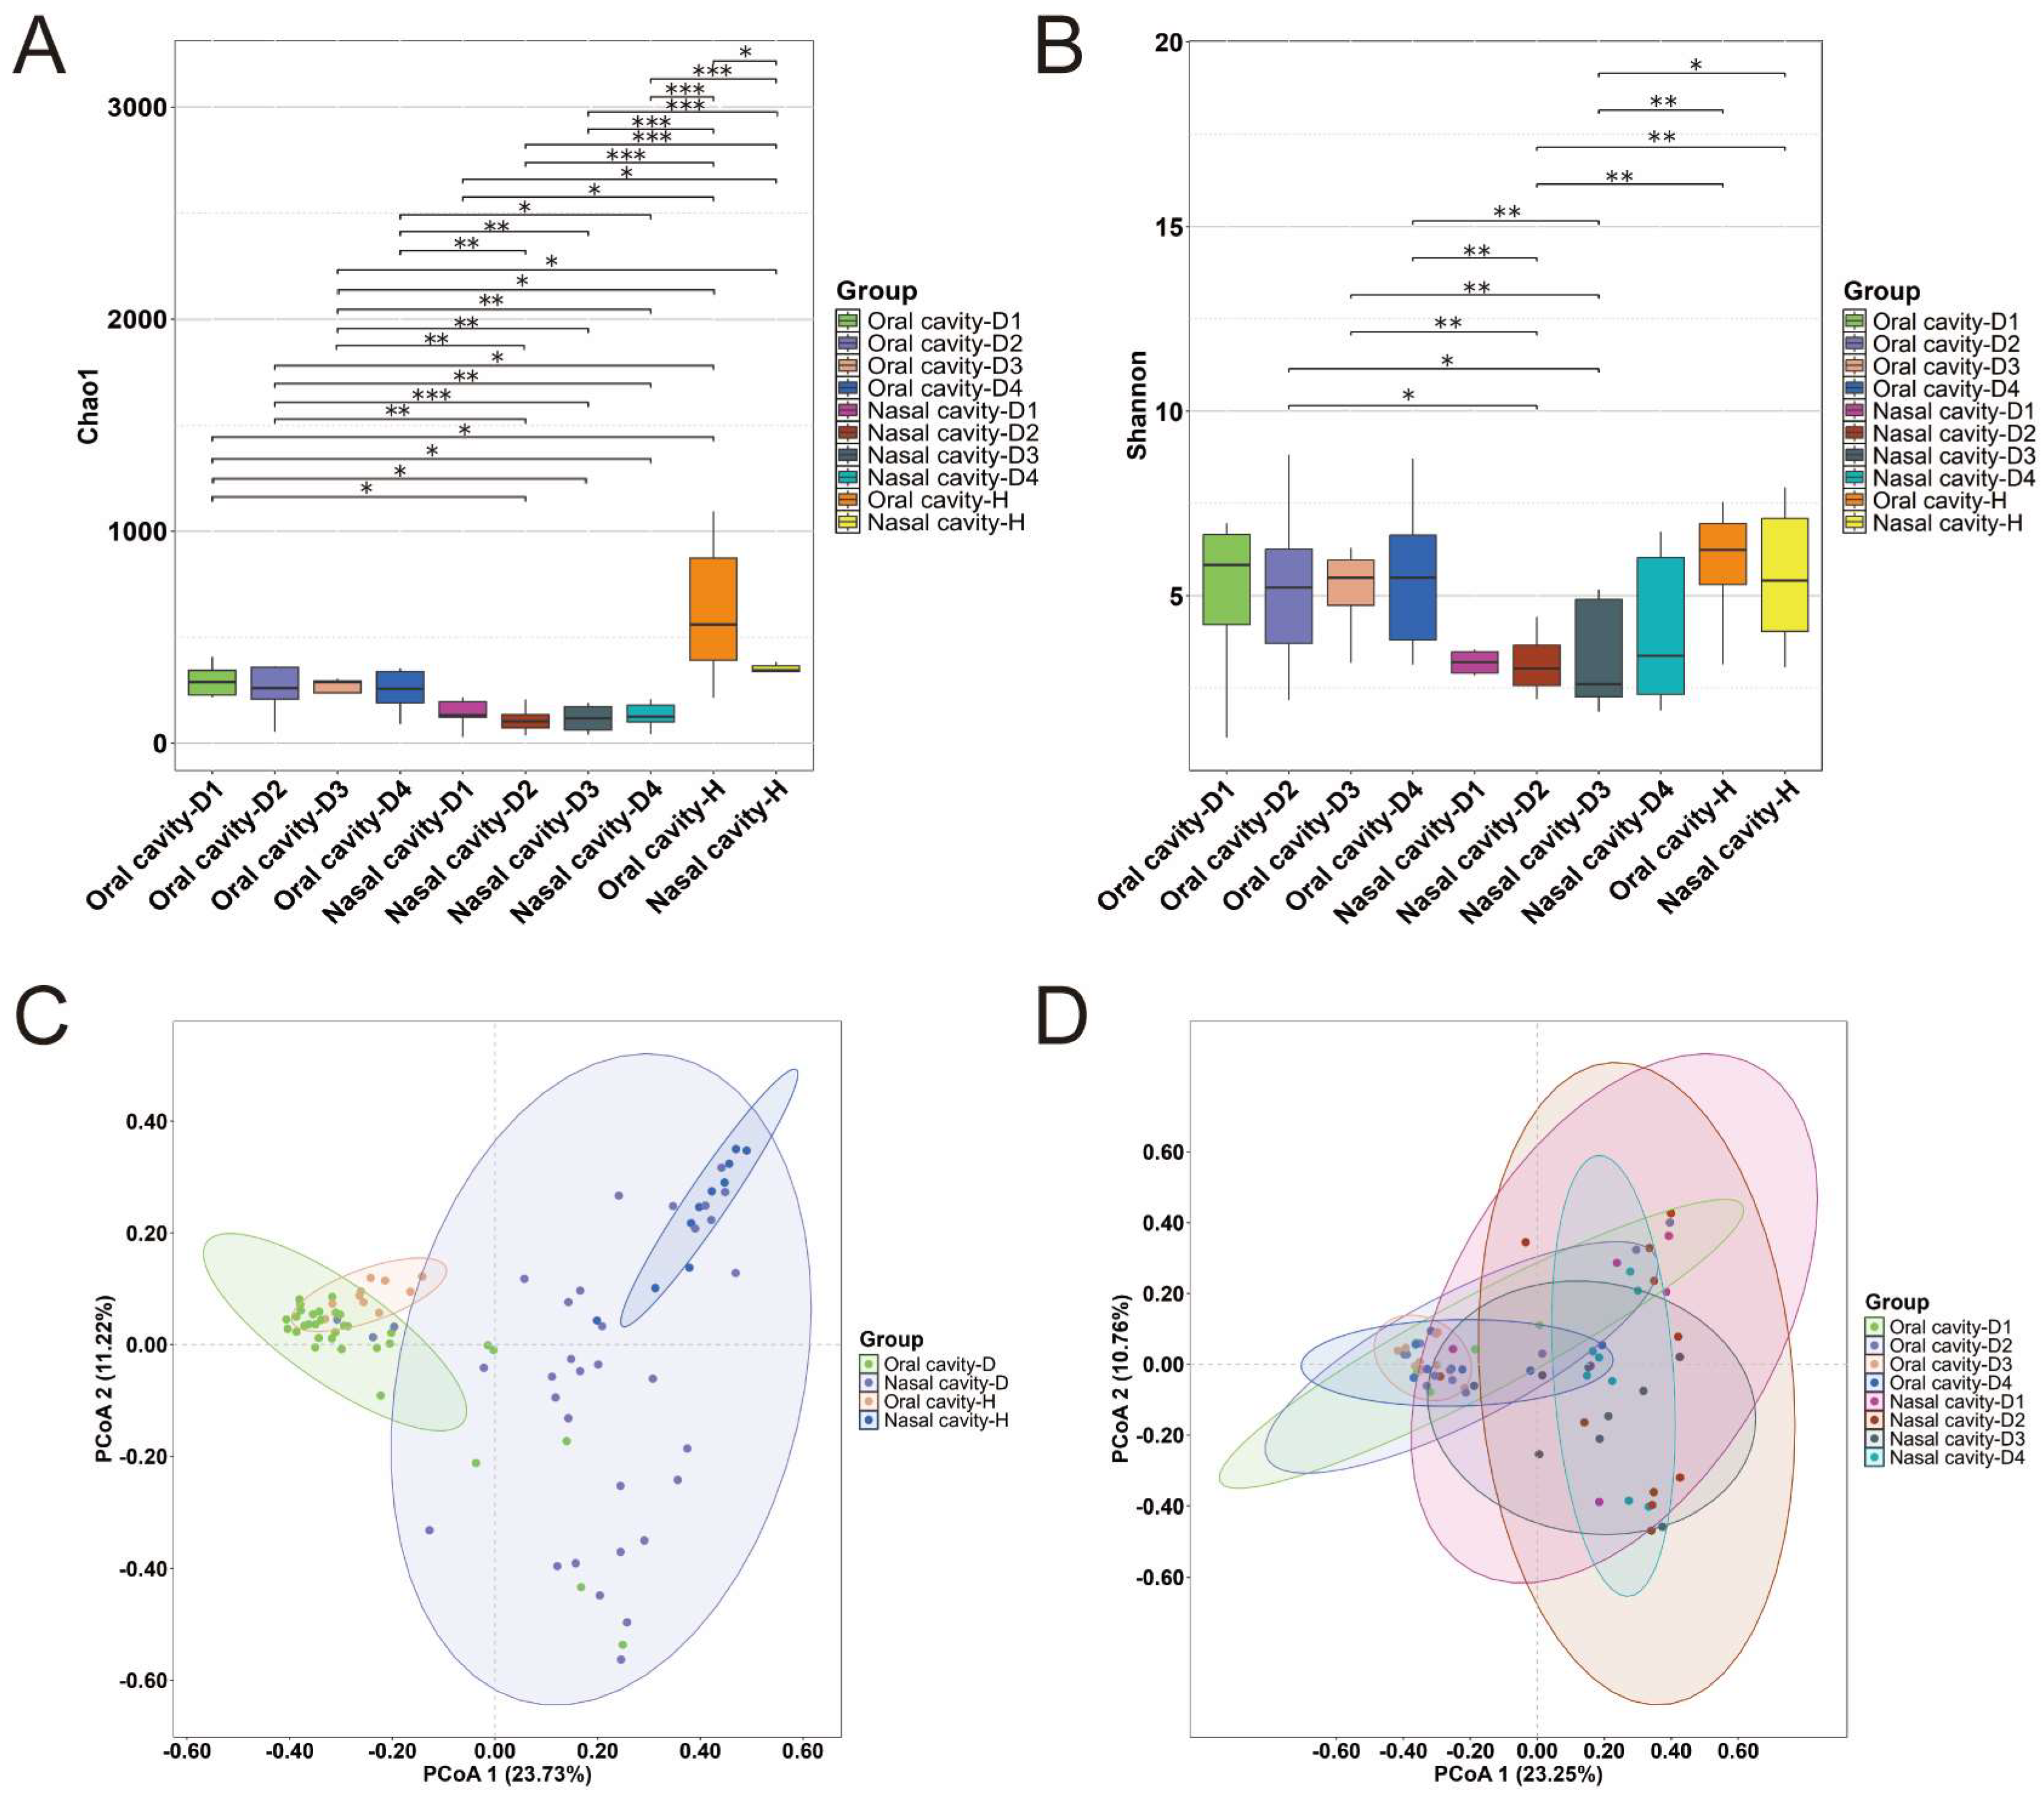
2.2. Microbial Diversity

To evaluate the microbial diversity within groups (alpha diversity), we assessed the richness and evenness of the microbial communities using the Chao1 and Shannon indices at the amplicon sequence variant (ASV) level. As shown in Figure 1A, the Chao1 index indicated significantly higher species richness in the healthy volunteer groups than in the cadaver groups (p < 0.05). Regardless of the group type, the oral samples exhibited greater richness than the nasal samples. The Shannon index (Figure 1B) was lower in the nasal samples than in the oral samples. Furthermore, both indices fluctuated with increasing PMI but showed no consistent trend.
To assess the inter-group microbial diversity (beta diversity), a principal coordinates analysis (PCoA) based on Bray–Curtis distances was performed and visualized in two-dimensional space (Figure 1C,D). The clustering patterns revealed significant differences between the oral and nasal samples, especially among the healthy volunteer groups (Figure 1C). In contrast, no significant clustering was observed across the different PMI groups within either the oral or nasal sample sets (Figure 1D).

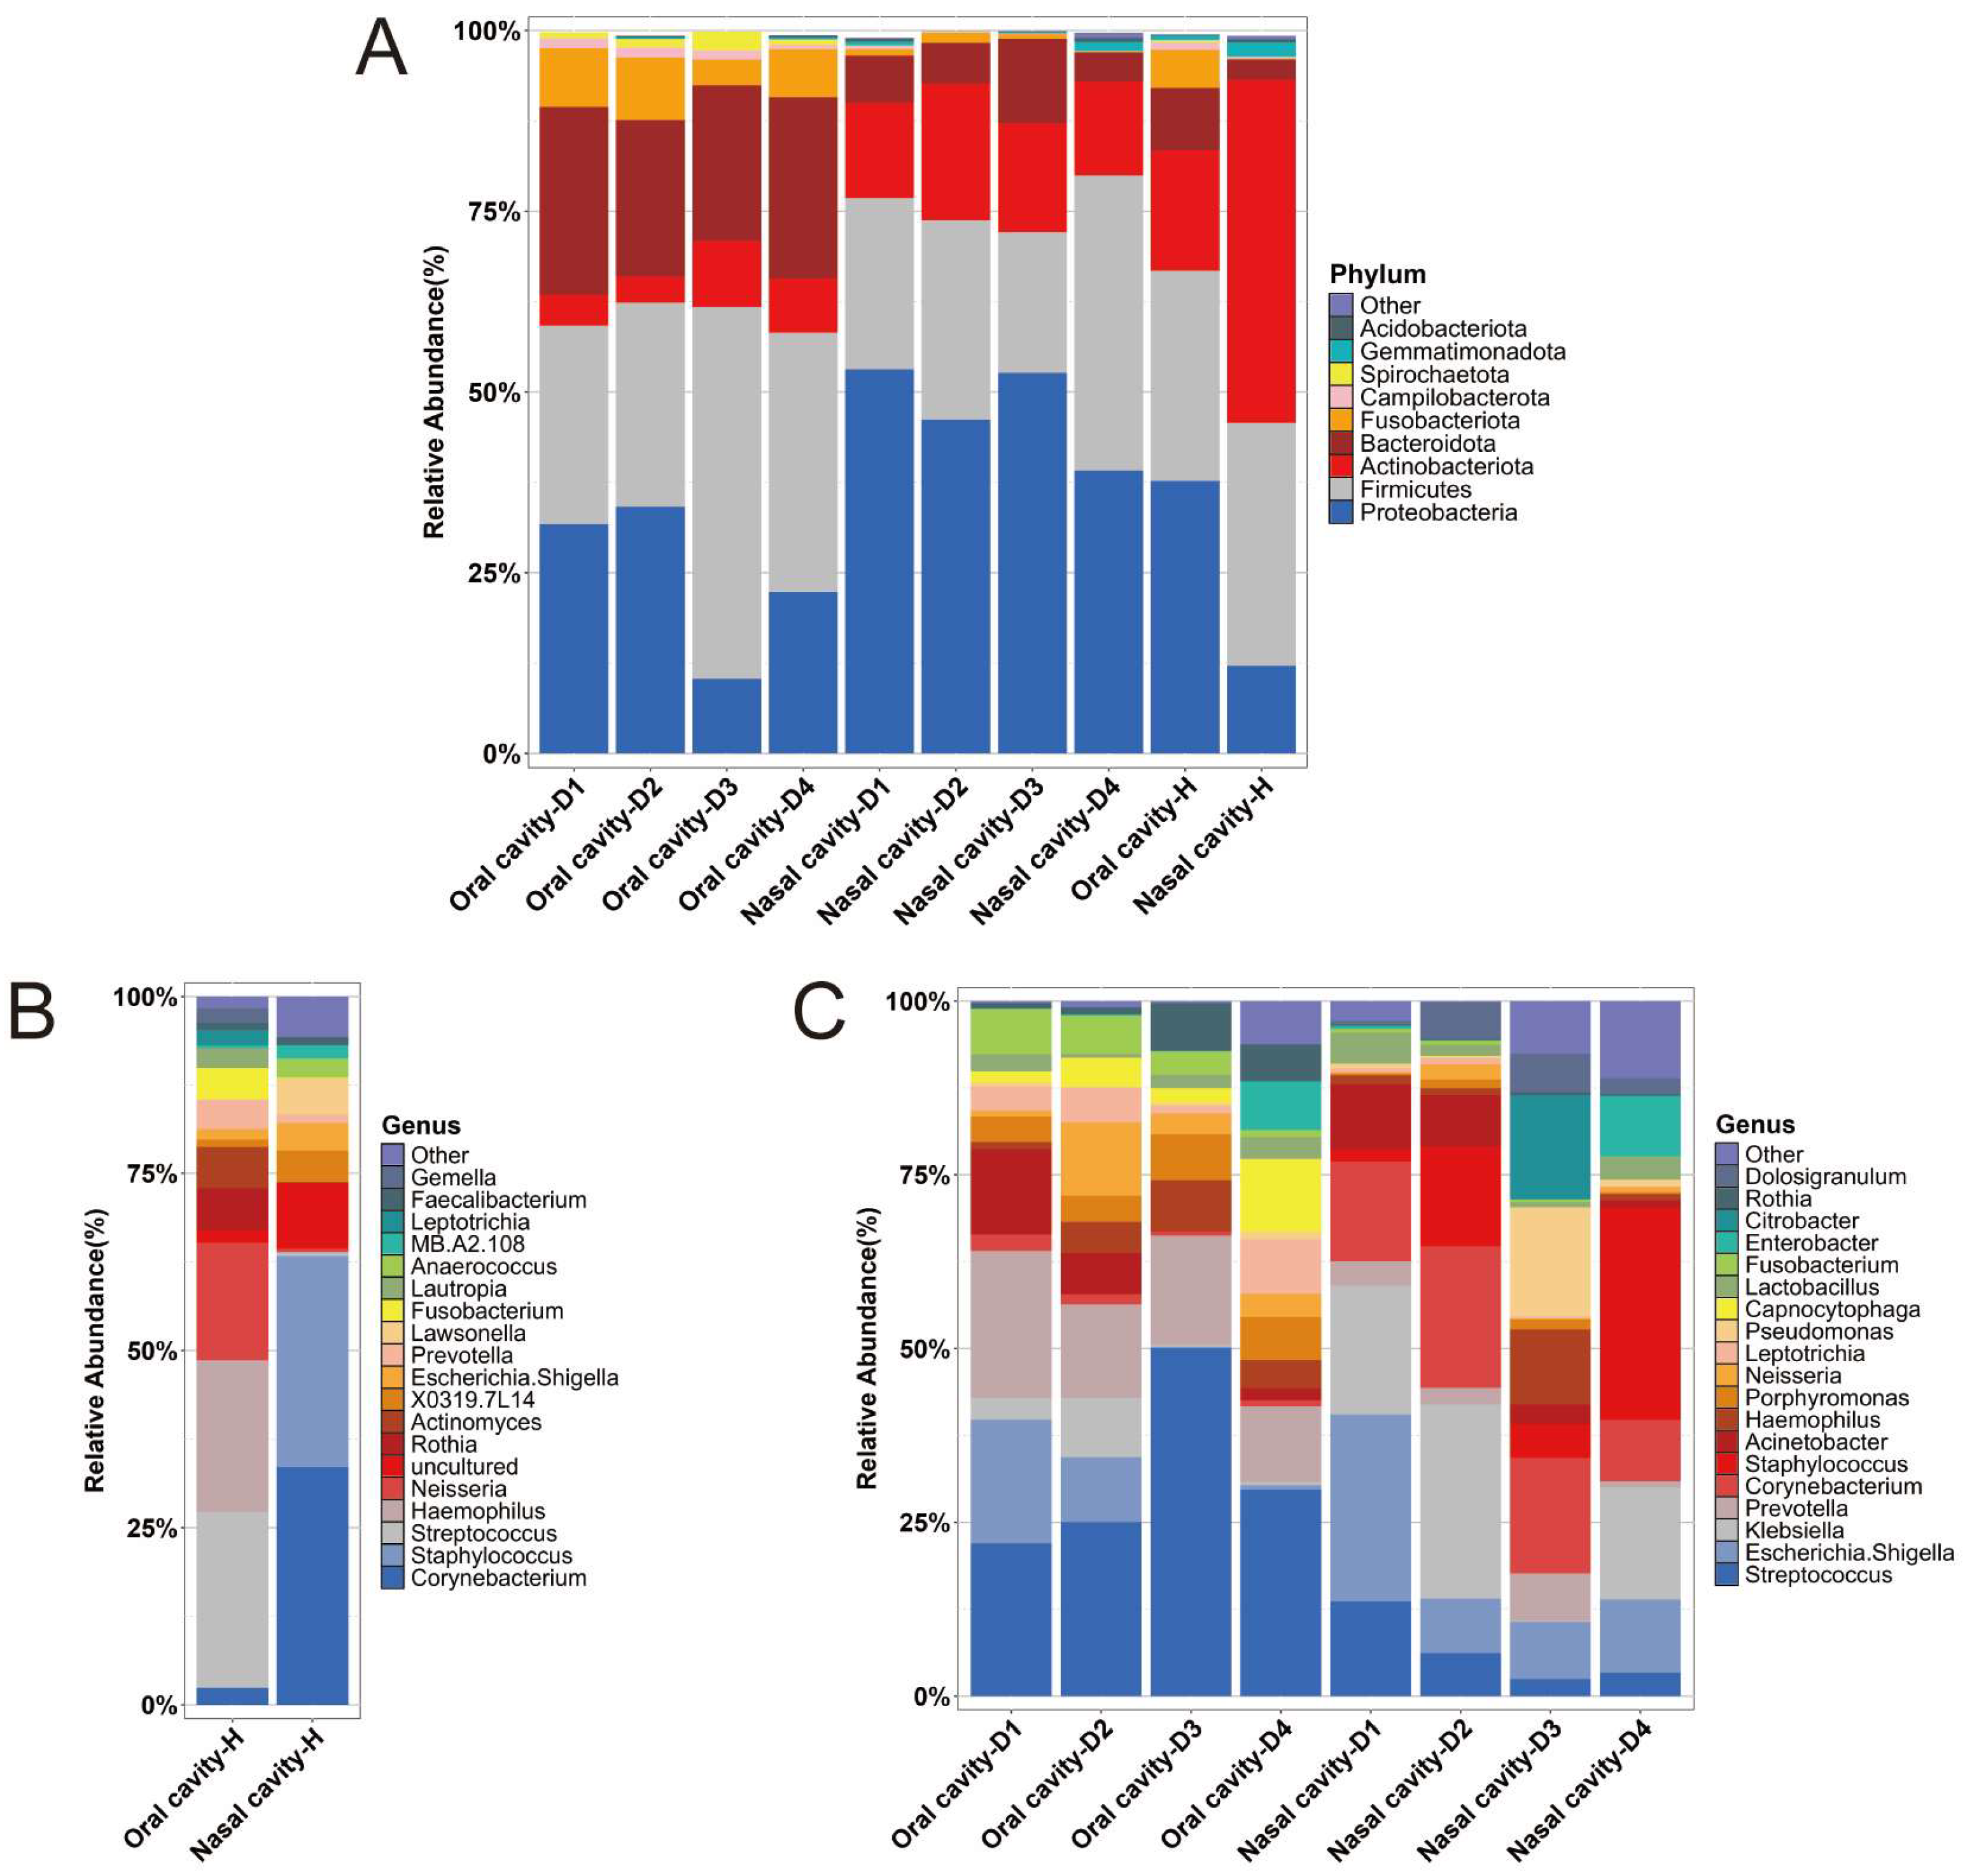
2.3. Microbial Abundance

The relative abundance of microbial communities across the 10 groups was analyzed at both the phylum and genus levels.
At the phylum level, Proteobacteria, Firmicutes, and Bacteroidota were predominant in the oral cadaver groups (Oral cavity-D1, Oral cavity-D2, Oral cavity-D3, and Oral cavity-D4). In the nasal cadaver groups (Nasal cavity-D1, Nasal cavity-D2, Nasal cavity-D3, and Nasal cavity-D4), Proteobacteria, Firmicutes, and Actinobacteriota dominated, with Proteobacteria showing a higher relative abundance than Firmicutes. In the healthy volunteer groups (Oral cavity-H and Nasal cavity-H), the relative abundance of Actinobacteriota was higher compared to that of the corresponding oral or nasal cadaver groups. Additionally, the Nasal cavity-H group exhibited a lower relative abundance of Proteobacteria than the nasal cadaver groups (Figure 2A).
At the genus level, Streptococcus and Haemophilus were the predominant genera in the Oral cavity-H group, while Corynebacterium and Staphylococcus were notably more abundant in the Nasal cavity-H group (Figure 2B). In the oral cadaver groups, Streptococcus and Prevotella were the predominant genera. The nasal cadaver groups displayed variation in the dominant genera across different PMI stages: Escherichia-Shigella was the most abundant genus in Group D1, Klebsiella in Group D2, Corynebacterium in Group D3, and Staphylococcus in Group D4 (Figure 2C).

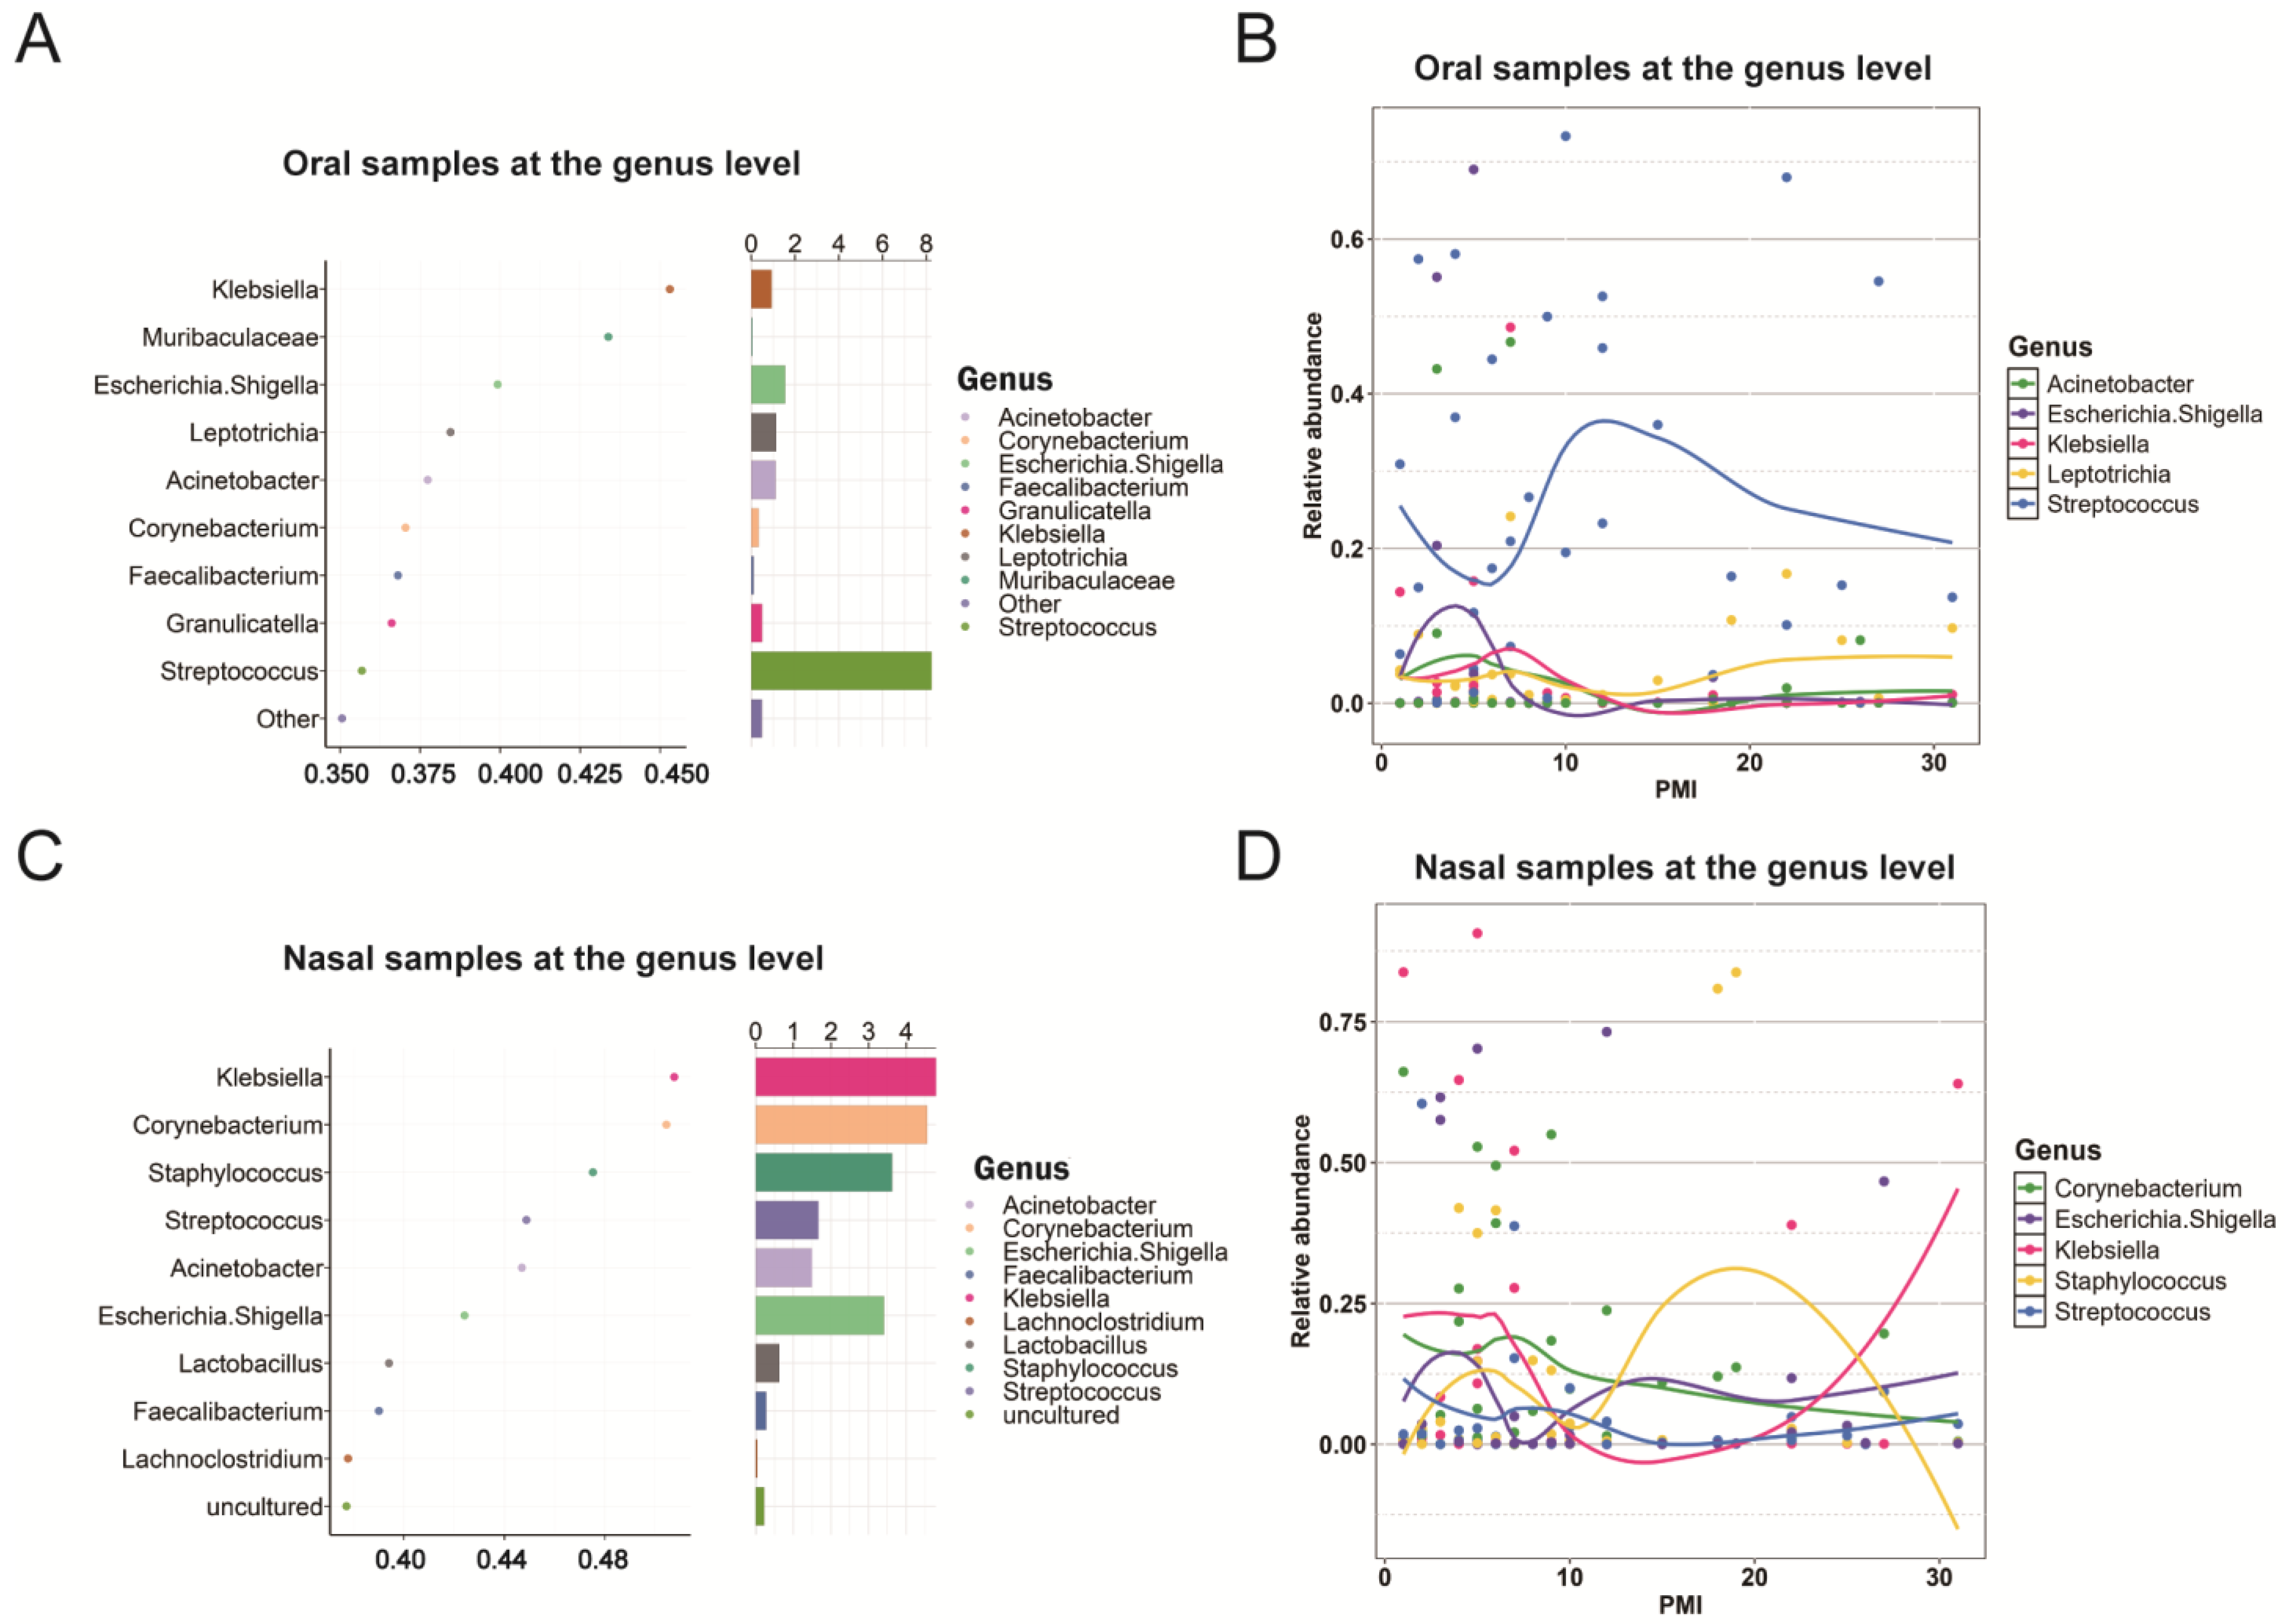
2.4. Biomarkers Associated with PMIs

To identify potential biomarkers for different PMIs in the oral or nasal cadaver groups, random forest models were constructed using the samples’ PMIs and the relative abundances of bacterial taxa at both the phylum and genus levels. The bacterial taxa were ranked based on their mean decrease in Gini values. Among the top 10 taxa, five with higher relative abundances were identified as promising biomarkers for PMIs. Subsequently, LOESS regression curves were produced for each biomarker.
At the phylum level, both the oral and nasal groups shared the same biomarkers: Firmicutes, Proteobacteria, Bacteroidota, Actinobacteriota, and Fusobacteriota (Figure 3A,C). In the oral group, key turning points were observed on days 5, 12, and 22. From day 0 to day 5, all biomarkers, except Proteobacteria, showed a decreasing trend, while Proteobacteria exhibited an increasing trend. From day 6 to day 12, Firmicutes and Actinobacteriota increased, while Proteobacteria decreased. From day 12 to day 22, the trends reversed, with all phyla showing changes opposite to their earlier patterns. After day 22, Firmicutes and Proteobacteria increased, whereas Bacteroidota and Actinobacteriota declined (Figure 3B). In the nasal group, similar turning points and trends were observed, but the trends for Proteobacteria and Firmicutes were reversed compared to the oral group. Moreover, these two phyla exhibited opposite trends during different PMI stages within the nasal group (Figure 3D).
At the genus level, five biomarkers were identified in the oral group, including Streptococcus, Escherichia-Shigella, Acinetobacter, Klebsiella, and Leptotrichia (Figure 4A). The trend of Streptococcus mirrored that of Firmicutes at the phylum level, while the other genera showed an increasing trend from day 1 to day 7, followed by a decline (Figure 4B). For the nasal group, Klebsiella, Corynebacterium, Staphylococcus, Escherichia-Shigella, and Streptococcus were identified as biomarkers (Figure 4C). The trend of Staphylococcus mirrored that of Firmicutes at the phylum level, and Escherichia-Shigella displayed a trend similar to Proteobacteria at the phylum level (Figure 4D). Of note, while the oral and nasal groups showed similar turning points and trends, the trends and relative abundance of certain genera, such as Proteobacteria and Firmicutes, were reversed between the two groups.
Using the identified biomarkers, PMI inference models were constructed and evaluated based on the mean absolute error (MAE) and R2 values (Figure S1A–D). Among the four models, the oral genus-level and phylum-level models achieved the lowest MAE values for the training (MAE = 2.16 days) and testing datasets (MAE = 5.14 days). When biomarkers from both the oral and nasal groups were combined, the phylum-level model achieved an MAE of 2.66 days, while the genus-level model achieved an MAE of 2.26 days (Figure S1E,F).

2.5. Comparison of Samples from Frozen and Unfrozen Cadavers

In this study, 23 cadavers were stored at −20 °C within 12 h postmortem until dissection and sampling. To evaluate the potential impact of freezing on the microbiota, we compared the microbial communities of samples from frozen (Oral cavity-F and Nasal cavity-F) and unfrozen cadavers (Oral cavity-N and Nasal cavity-N).
The PCoA plots showed no significant clustering differences between the frozen and unfrozen samples (Figure 5A,B). Since Group D3 had a relatively balanced and comparable number of frozen and unfrozen samples, it was selected for further analysis. Consistent with the overall findings, the PCoA results for this group also demonstrated no significant differences (Figure 5C,D). At the phylum level, the frozen samples exhibited a higher relative abundance of Proteobacteria and a lower relative abundance of Actinobacteriota compared to the unfrozen samples, regardless of whether they were from the oral or nasal cavity (Figure 5E). At the genus level, the composition of the dominant genera in the nasal group showed substantial differences between the frozen and unfrozen samples (Figure 5F).
Using the method described in Section 2.4, we analyzed PMI-associated biomarkers in both frozen and unfrozen groups. At the phylum level in the oral group, both the frozen and unfrozen samples shared the same biomarkers: Firmicutes, Proteobacteria, Bacteroidota, Actinobacteriota, and Fusobacteriota (Figure S2A,C). The LOESS curves analysis indicated consistent trends between the two groups, although the relative abundance of Proteobacteria was lower in the unfrozen samples (Figure S2B,D). At the genus level, however, the biomarkers differed significantly between the two groups (Figure S3). In the nasal group, the frozen and unfrozen samples also shared common biomarkers at the phylum level: Firmicutes, Proteobacteria, Bacteroidota, and Actinobacteriota (Figure S4A,C). While the overall trends were similar, the relative abundances of these phyla varied between the frozen and unfrozen samples (Figure S4B,D). At the genus level, Klebsiella was the only biomarker common to both groups (Figure S5).
To provide a clearer overview of our key findings, we summarized the main results in Table 2.

3. Discussion

This study offers valuable insights into the dynamics of the oral and nasal microbial communities in both living individuals and human cadavers, highlighting their potential utility in PMI estimation. Our findings demonstrated distinct differences in microbial richness, diversity, and composition across the groups, influenced by factors such as host health status, decomposition stages, and environmental conditions.
Alpha and beta diversity metrics were used to compare microbial communities in healthy volunteers and human cadavers with varying PMIs. The Chao1 index showed a significantly higher species richness in healthy individuals than in cadavers, and the Shannon index reflecting oral and nasal diversity was also higher in the living. This may be due to the stable internal environment, adequate nutrition, and favorable conditions in the oral and nasal cavity during life, which support microbial survival and reproduction. After death, the loss of physiological functions leads to environmental changes, explaining the higher alpha diversity in healthy individuals than in cadavers [27]. The oral samples showed a higher species richness than the nasal samples, likely due to the mouth’s diverse nutrients and complex microenvironments, while the nose’s primary function and strict immune defenses limit microbial diversity [28]. The beta diversity analysis revealed clear clustering by sample site (oral vs. nasal) [29] but no significant clustering based on PMI, possibly due to individual variations within the PMI groups.
The analysis of microbial community composition across the 10 groups (Oral cavity-D1, Oral cavity-D2, Oral cavity-D3, Oral cavity-D4, Nasal cavity-D1, Nasal cavity-D2, Nasal cavity-D3, Nasal cavity-D4, Oral cavity-H, and Nasal cavity-H) revealed distinct patterns reflecting the health status and post-mortem changes. At the phylum level, Proteobacteria, Firmicutes, and Bacteroidota dominated in the oral cadaver groups, consistent with the findings from previous studies on human cadavers [30], rats [17], and mice [22]. In nasal cadaver groups, Proteobacteria, Firmicutes, and Actinobacteriota were predominant, with a particularly high abundance of Proteobacteria, aligning with our earlier study [31]. The higher Actinobacteriota levels in nasal samples likely reflect the nasal cavity’s greater exposure to environmental microbes [32]. In the healthy volunteers, Actinobacteriota was significantly more abundant in both the oral and nasal samples compared to those from cadavers, likely due to their preference for aerobic conditions, while decomposition favors anaerobic bacteria. Additionally, the nasal samples from the healthy individuals had a lower relative abundance of Proteobacteria compared to the cadavers, suggesting the post-mortem proliferation of Proteobacteria, which plays a crucial role in nutrient recycling during decomposition [33]. At the genus level, Streptococcus was dominant in both the healthy and cadaver oral groups, serving as a foundational pioneer species in the oral cavity due to its adaptability. In the healthy individuals, aerobic Haemophilus was prevalent in the oral samples, while anaerobic Prevotella dominated in the oral cadaver groups, reflecting a shift driven by the anaerobic and protein-rich environment of decomposition [34]. The nasal cadaver groups displayed genus-level variations across different PMIs, reflecting temporal microbial succession during decomposition as opportunistic and environmentally adaptive microbes progressively replace commensal species [32].
The random forest models identified PMI-associated biomarkers in the oral and nasal microbiomes. At the phylum level, Firmicutes, Proteobacteria, Bacteroidota, Actinobacteriota, and Fusobacteriota emerged as key biomarkers, consistent with previous studies [21]. These biomarkers exhibited non-linear abundance patterns, with turning points on days 5, 12, and 22. In the oral microbiome, Firmicutes and Bacteroidota dominated from day 0 to day 5 but gradually declined, while Proteobacteria steadily increased. These patterns align with previous studies [21,35] and may be driven primarily by changes in the environment and nutrient availability. The progressive depletion of oxygen may suppress the metabolic activity of anaerobic and facultative anaerobic bacteria like Firmicutes and Bacteroidota, whereas the aerobic and microaerophilic bacteria within Proteobacteria adapted and proliferated.
From day 6 to day 12, Firmicutes increased, aligning with previous findings [21], while Bacteroidota decreased and Actinobacteriota rose, consistent with the observations reported in [24]. In this period, the accumulation of decomposition byproducts, such as short-chain fatty acids and amino acids, favors Firmicutes [11], while the depletion of complex polysaccharides reduces Bacteroidota [12]. Actinobacteriota thrive on secondary metabolites, while Proteobacteria are inhibited under progressively anaerobic conditions. Interspecies resource competition and metabolic cooperation likely further influence these trends [36].
After day 12, the oral microbiome of the cadavers displayed distinct changes, with a turning point on around day 22. Firmicutes initially declined but later rebounded, while Bacteroidota increased before decreasing. Actinobacteriota showed a continuous decline, whereas Proteobacteria steadily increased. These shifts reflect the evolving decomposition environment. Specifically, Firmicutes experienced an early decline due to resource depletion and increasingly anaerobic conditions but later rebounded as decay-adapted taxa, such as Clostridium, proliferated under the putrefactive conditions. Bacteroidota likely utilized short-term decomposition products for initial growth but their growth decreased as the resources became exhausted. The persistent decline of Actinobacteriota suggests their limited adaptability to complex decomposition environments. In contrast, Proteobacteria used their metabolic flexibility and adaptability to anaerobic conditions to thrive and occupy the available ecological niches by relying on late-stage decomposition products.
In the nasal groups, similar trends and turning points as those in the oral groups were observed. However, the abundance patterns of Proteobacteria and Firmicutes were reversed. This divergence likely resulted from the environmental differences between the two cavities. The nasal cavity, an open system with higher oxygen levels, favors aerobic bacteria like Proteobacteria while inhibiting anaerobes like Firmicutes. In contrast, the hypoxic oral cavity provides a suitable environment for anaerobic bacteria [29]. Additionally, the nasal cavity’s immune defenses may limit anaerobic growth, promoting aerobic taxa instead.
At the genus level, the key biomarkers identified in the oral group included Streptococcus, Escherichia-Shigella, Acinetobacter, Klebsiella, and Leptotrichia. The abundance of Streptococcus mirrored the trends observed for Firmicutes at the phylum level, indicating that Streptococcus is a major PMI-associated genus within the Firmicutes phylum. Other biomarkers showed an initial increase from day 1 to day 7, followed by a decline, likely driven by the depletion of short-term decomposition products that initially supported their growth. In the nasal microbiome, Klebsiella, Corynebacterium, Staphylococcus, Escherichia-Shigella, and Streptococcus were identified as biomarkers, with Staphylococcus mirroring the trend of Firmicutes and Escherichia-Shigella and aligning with changes in Proteobacteria. This suggested that these genera are key representatives of their respective phyla in the nasal microbiome. While similar trends and turning points were observed in both the oral and nasal groups, the abundance of genera from Proteobacteria and Firmicutes showed opposite trends between the two environments, reflecting the oxygen-rich, open environment of the nasal cavity, which favors aerobic and facultative anaerobic taxa like Proteobacteria, compared to the hypoxic, closed oral cavity that supports anaerobic taxa like Firmicutes [28].
Using the identified biomarkers, PMI inference models were constructed. The models based on oral biomarkers at both the genus and phylum levels demonstrated superior accuracy, achieving the lowest MAE values in the training (MAE = 2.16 days) and testing datasets (MAE = 5.14 days). These findings indicate that the oral microbiota provide more reliable biomarkers for PMI estimation compared to the nasal microbiota. Furthermore, the MAE achieved by our model is comparable to that from a previous study utilizing a k-nearest neighbor (KNN) regression model based on phylum-level nasal and ear canal microbiome data, which estimated PMI with an MAE of approximately 55 accumulated degree days, equivalent to around three days [23]. It is worth noting that PMI inference models based on animal microbiomes are more common in the current research. For instance, Wang et al. analyzed oral microbiota from 21 rats sampled at seven time points within 168 h postmortem. Using genus-level microbial abundance and a random forest model, they achieved an R2 of 98.76% and an MAE of 6.93 ± 1.19 h [16]. In contrast, the lower accuracy of our model could be attributed to the human samples’ higher inter-individual variability and the study’s longer time span, with fewer samples collected at each time point.
Our study also examined the impact of freezing on postmortem microbiota dynamics by comparing the oral and nasal microbiota from frozen and non-frozen cadavers across varying PMIs. The results showed that freezing had minimal impact on the overall microbiota composition at the phylum level, consistent with a previous study [26]. However, freezing significantly altered the relative abundance of certain phyla, such as Proteobacteria and Actinobacteriota. This shift likely resulted from selective pressures induced by freezing, including low temperature and limited nutrient diffusion, which favor cold-tolerant taxa like Proteobacteria while suppressing taxa like Actinobacteriota that thrive in stable aerobic conditions. At the genus level, the freezing effects were more pronounced in the nasal microbiota than in the oral microbiota, indicating that the oral microbiota were less affected by temperature fluctuations. This suggests that oral microbiota may offer a more stable foundation for PMI estimation. Additionally, the PMI-associated biomarkers varied between the frozen and non-frozen groups, highlighting the necessity of accounting for temperature effects when selecting biomarkers for accurate PMI estimation.
We investigated the dynamics of the oral and nasal microbiota in both healthy individuals and human cadavers, identifying PMI-associated biomarkers and their nonlinear temporal trends. In addition, we developed random forest-based models for PMI prediction and examined the impact of freezing on cadaver microbiota. However, there were certain limitations to this study. First, the distribution of the frozen and non-frozen cadavers across the different PMIs was uneven, potentially introducing bias. Second, despite constructing PMI prediction models, the relatively high MAEs suggest limited model accuracy, likely owing to the uneven sample size across the PMIs and individual variability. Moreover, we did not explore the potential impact of environmental temperature on microbiota-based PMI estimation. Future research should aim to increase the sample size at each PMI and control environmental variables to improve the PMI inference models’ accuracy and precision.

4. Materials and Methods

4.1. Sample Collection

Sample collection was conducted in a controlled environment using sterilized equipment. The technicians adhered to stringent aseptic practices, including the use of sterile gloves, masks, and, protective clothing, to minimize contamination from the environment or personnel sources.
Samples of oral and nasal microbiota were collected from 10 healthy volunteers and 34 cadavers using sterile cotton swabs (Finegene Biotech, Shanghai, China). Healthy volunteers were recruited based on strict exclusion criteria, ensuring that individuals with dental pathologies (e.g., periodontitis, caries) or smoking habits—both of which could influence the oral microbiota—were not included. For the frozen cadavers, the time between death and refrigeration did not exceed 12 h. Separate swabs were used for each anatomical site, which were gently rotated and rubbed over the sampling area for 3–5 s to ensure adequate microbiota collection. The collected samples were immediately stored at −80 °C until further processing.
Written informed consent was obtained from all volunteers. The cadavers were acquired for scientific research through the documented consent of the donors and/or their legal next of kin. Ethical approval for the study was granted by the Ethics Committee of Fudan University (No. 2023C011).

4.2. DNA Extraction, Amplification and Sequencing

Microbial DNA was extracted from the collected swabs using the DNeasy PowerSoil kit (Qiagen, Hildesheim, Germany). The DNA concentration and integrity were measured using a NanoDrop 2000 spectrophotometer (Thermo Fisher Scientific, Waltham, MA, USA) and agarose gel electrophoresis. The V3-V4 hypervariable region of the microbial 16S rRNA gene was PCR-amplified in a 25 μL reaction using universal primer pairs (343F: 5′-TACGGRAGGCAGCAG-3′; 798R: 5′-AGGGTATCTAATCCT-3′). The reverse primer contained a sample barcode and both primers were connected with an Illumina sequencing adapter. Sequencing was conducted on an Illumina NovaSeq6000 with paired-end reads of 250 bases each (Illumina, San Diego, CA, USA; OE Biotech Company, Shanghai, China).

4.3. Data Analysis

The raw sequencing data, in FASTQ format, underwent quality trimming and filtering. Low-quality reads were removed, and DADA2 [37] was used to denoise, merge reads, and detect the chimeric sequences. These steps were performed using the default parameters of QIIME2 (https://qiime2.org/ (accessed on 11 September 2024)) [38]. Representative sequences for each ASV were selected through QIIME2, and annotations were carried out using the Silva database, version 138 (or Unite) (16s/18s/ITS rDNA), and the q2-feature-classifier with the default parameters. The microbial diversity within the groups was evaluated using alpha diversity metrics, including the Chao1 [39] and Shannon indices [40], which was calculated using QIIME2. Pairwise comparisons between the groups were conducted using the Wilcoxon test. Beta diversity, which indicates inter-group microbial composition variation, was analyzed using PCoA based on Bray–Curtis distance matrices. Group differences were statistically tested using the Adonis test, with the significant threshold set at p < 0.05.

4.4. Random Forest and LOESS Regression Modeling

For each anatomical site, the samples were randomly split into training (70%) and test datasets (30%). The relative abundances of bacterial taxa at the phylum or genus level were regressed against the cadavers’ PMIs using the “randomForest” package (https://cran.r-project.org/web/packages/randomForest/index.html (accessed on 12 December 2024)) in R [41]. Feature importance was assessed by ranking bacterial taxa based on their mean decrease in Gini values. Based on these rankings and the relative abundance data, potentially valuable PMI-associated biomarkers were identified. The performance of the PMI estimation models was evaluated by calculating the mean absolute error (MAE) and the goodness-of-fit (R²) values. Regression curves illustrating the relationship between biomarker changes and PMI were generated using the Locally Estimated Scatterplot Smoothing (LOESS) method. All statistical analyses and visualizations were conducted using R software (v4.4.1).

5. Conclusions

This study investigated the dynamics of the oral and nasal microbiota in healthy individuals and human cadavers, uncovering time-dependent changes in the microbial composition and abundance during decomposition. Potential PMI-associated biomarkers were identified, which demonstrating nonlinear changes with key turning points on days 5, 12, and 22. The random forest-based PMI prediction models showed promising results, laying the foundation for estimating PMI using microbiome data from these two body sites. A comparison between frozen and unfrozen cadavers unveiled the minimal impact of freezing on the microbial composition at the phylum level, although certain phyla, such as Proteobacteria and Actinobacteriota, showed altered relative abundances. Notably, the oral microbiota exhibited greater stability when subjected to temperature changes and superior predictive performance compared to the nasal microbiota. This work offers valuable insights into leveraging oral and nasal microbiome data for PMI estimation and highlights future directions to enhance model accuracy and understand microbial changes under varying environmental conditions.

Supplementary Materials

The following supporting information can be downloaded at: https://www.mdpi.com/article/10.3390/ijms26073432/s1.

Author Contributions

Conceptualization, S.Z. and F.Y.; methodology, J.C., X.H. and J.Z.; formal analysis, J.C., Q.W., Y.L. and Y.Z.; investigation, J.C., Q.W., H.Z., Y.L. and Y.Z.; resources, F.Y. and S.Z.; writing—original draft preparation, J.C.; writing—review and editing, J.C., X.W. and S.Z.; visualization, J.C. and Q.W.; supervision, X.W. and S.Z.; project administration, S.Z. All authors have read and agreed to the published version of the manuscript.

Funding

This work was supported by the National Natural Science Foundation of China (No. 82371896).

Institutional Review Board Statement

The study was conducted in accordance with the Declaration of Helsinki and was approved by the Ethics Committee of Fudan University (No. 2023C011).

Informed Consent Statement

Written informed consent was obtained from all volunteers. The cadavers were acquired for scientific research purposes through the expressed and documented consent of the donors and/or their legal next of kin.

Data Availability Statement

The data that support the findings of this study are available upon reasonable request from the corresponding author.

Conflicts of Interest

The authors declare no conflicts of interest.

References

  1. Henssge, C.; Madea, B. Estimation of the time since death. Forensic Sci. Int. 2007, 165, 182–184. [Google Scholar]
  2. Roy, D.; Tomo, S.; Purohit, P.; Setia, P. Microbiome in Death and Beyond: Current Vistas and Future Trends. Front. Ecol. Evol. 2021, 9, 630397. [Google Scholar]
  3. Tozzo, P.; Amico, I.; Delicati, A.; Toselli, F.; Caenazzo, L. Post-Mortem Interval and Microbiome Analysis through 16S rRNA Analysis: A Systematic Review. Diagnostics 2022, 12, 2641. [Google Scholar] [CrossRef]
  4. Liu, R.; Gu, Y.; Shen, M.; Li, H.; Zhang, K.; Wang, Q.; Wei, X.; Zhang, H.; Wu, D.; Yu, K.; et al. Predicting postmortem interval based on microbial community sequences and machine learning algorithms. Environ. Microbiol. 2020, 22, 2273–2291. [Google Scholar]
  5. Matuszewski, S. Post-Mortem Interval Estimation Based on Insect Evidence: Current Challenges. Insects 2021, 12, 314. [Google Scholar] [CrossRef] [PubMed]
  6. Sangwan, A.; Singh, S.P.; Singh, P.; Gupta, O.P.; Manas, A.; Gupta, S. Role of molecular techniques in PMI estimation: An update. J. Forensic Leg. Med. 2021, 83, 102251. [Google Scholar] [PubMed]
  7. Tozzo, P.; Scrivano, S.; Sanavio, M.; Caenazzo, L. The Role of DNA Degradation in the Estimation of Post-Mortem Interval: A Systematic Review of the Current Literature. Int. J. Mol. Sci. 2020, 21, 3540. [Google Scholar] [CrossRef]
  8. Maiese, A.; Scatena, A.; Costantino, A.; Di Paolo, M.; La Russa, R.; Turillazzi, E.; Frati, P.; Fineschi, V. MicroRNAs as Useful Tools to Estimate Time Since Death. A Systematic Review of Current Literature. Diagnostics 2021, 11, 64. [Google Scholar] [CrossRef]
  9. Wang, Q.; Zhang, Y.; Lin, H.; Zha, S.; Fang, R.; Wei, X.; Fan, S.; Wang, Z. Estimation of the late postmortem interval using FTIR spectroscopy and chemometrics in human skeletal remains. Forensic Sci. Int. 2017, 281, 113–120. [Google Scholar]
  10. Schmidt, V.M.; Zelger, P.; Woess, C.; Pallua, A.K.; Arora, R.; Degenhart, G.; Brunner, A.; Zelger, B.; Schirmer, M.; Rabl, W.; et al. Application of Micro-Computed Tomography for the Estimation of the Post-Mortem Interval of Human Skeletal Remains. Biology 2022, 11, 1105. [Google Scholar] [CrossRef]
  11. Hyde, E.R.; Haarmann, D.P.; Lynne, A.M.; Bucheli, S.R.; Petrosino, J.F. The living dead: Bacterial community structure of a cadaver at the onset and end of the bloat stage of decomposition. PLoS ONE 2013, 8, e77733. [Google Scholar] [CrossRef]
  12. Metcalf, J.L.; Wegener Parfrey, L.; Gonzalez, A.; Lauber, C.L.; Knights, D.; Ackermann, G.; Humphrey, G.C.; Gebert, M.J.; Van Treuren, W.; Berg-Lyons, D.; et al. A microbial clock provides an accurate estimate of the postmortem interval in a mouse model system. eLife 2013, 2, e01104. [Google Scholar]
  13. Cláudia-Ferreira, A.; Barbosa, D.J.; Saegeman, V.; Fernández-Rodríguez, A.; Dinis-Oliveira, R.J.; Freitas, A.R.; on behalf of the MR CLEAN Registry Investigators. The Future Is Now: Unraveling the Expanding Potential of Human (Necro)Microbiome in Forensic Investigations. Microorganisms 2023, 11, 2509. [Google Scholar] [CrossRef]
  14. Pechal, J.L.; Crippen, T.L.; Benbow, M.E.; Tarone, A.M.; Dowd, S.; Tomberlin, J.K. The potential use of bacterial community succession in forensics as described by high throughput metagenomic sequencing. Int. J. Leg. Med. 2014, 128, 193–205. [Google Scholar]
  15. Moitas, B.; Caldas, I.M.; Sampaio-Maia, B. Microbiology and postmortem interval: A systematic review. Forensic Sci. Med. Pathol. 2024, 20, 696–715. [Google Scholar] [PubMed]
  16. Wang, Z.; Zhang, F.; Wang, L.; Yuan, H.; Guan, D.; Zhao, R. Advances in artificial intelligence-based microbiome for PMI estimation. Front. Microbiol. 2022, 13, 1034051. [Google Scholar] [CrossRef] [PubMed]
  17. Li, N.; Liang, X.R.; Zhou, S.D.; Dang, L.H.; Li, J.; An, G.S.; Ren, K.; Jin, Q.Q.; Liang, X.H.; Cao, J.; et al. Exploring postmortem succession of rat intestinal microbiome for PMI based on machine learning algorithms and potential use for humans. Forensic Sci. Int. Genet. 2023, 66, 102904. [Google Scholar]
  18. Yang, F.; Zhang, X.; Hu, S.; Nie, H.; Gui, P.; Zhong, Z.; Guo, Y.; Zhao, X. Changes in Microbial Communities Using Pigs as a Model for Postmortem Interval Estimation. Microorganisms 2023, 11, 2811. [Google Scholar] [CrossRef]
  19. Janaway, R.C.; Percival, S.L.; Wilson, A.S. Decomposition of Human Remains. In Microbiology and Aging; Humana Press: Totowa, NJ, USA, 2009; pp. 313–334. [Google Scholar]
  20. Zhao, X.; Zhong, Z.; Hua, Z. Estimation of the post-mortem interval by modelling the changes in oral bacterial diversity during decomposition. J. Appl. Microbiol. 2022, 133, 3451–3464. [Google Scholar] [CrossRef]
  21. Adserias-Garriga, J.; Quijada, N.M.; Hernandez, M.; Rodriguez Lazaro, D.; Steadman, D.; Garcia-Gil, L.J. Dynamics of the oral microbiota as a tool to estimate time since death. Mol. Oral. Microbiol. 2017, 32, 511–516. [Google Scholar]
  22. Dong, K.; Xin, Y.; Cao, F.; Huang, Z.; Sun, J.; Peng, M.; Liu, W.; Shi, P. Succession of oral microbiota community as a tool to estimate postmortem interval. Sci. Rep. 2019, 9, 13063. [Google Scholar] [CrossRef]
  23. Johnson, H.R.; Trinidad, D.D.; Guzman, S.; Khan, Z.; Parziale, J.V.; DeBruyn, J.M.; Lents, N.H. A Machine Learning Approach for Using the Postmortem Skin Microbiome to Estimate the Postmortem Interval. PLoS ONE 2016, 11, e0167370. [Google Scholar] [CrossRef] [PubMed]
  24. Iancu, L.; Bonicelli, A.; Procopio, N. Decomposition in an extreme cold environment and associated microbiome-prediction model implications for the postmortem interval estimation. Front. Microbiol. 2024, 15, 1392716. [Google Scholar] [CrossRef]
  25. Sguazzi, G.; Mickleburgh, H.L.; Ghignone, S.; Voyron, S.; Reno, F.; Migliario, M.; Sellitto, F.; Lovisolo, F.; Camurani, G.; Ogbanga, N.; et al. Microbial DNA in human nucleic acid extracts: Recoverability of the microbiome in DNA extracts stored frozen long-term and its potential and ethical implications for forensic investigation. Forensic Sci. Int. Genet. 2022, 59, 102686. [Google Scholar] [CrossRef] [PubMed]
  26. Ogbanga, N.; Nelson, A.; Gino, S.; Wescott, D.J.; Mickleburgh, H.L.; Gocha, T.P.; Procopio, N. The impact of freezing on the post-mortem human microbiome. Front. Ecol. Evol. 2023, 11, 1151001. [Google Scholar] [CrossRef]
  27. Preiswerk, D.; Walser, J.C.; Ebert, D. Temporal dynamics of microbiota before and after host death. ISME J. 2018, 12, 2076–2085. [Google Scholar] [CrossRef] [PubMed]
  28. Lemon, K.P.; Klepac-Ceraj, V.; Schiffer, H.K.; Brodie, E.L.; Lynch, S.V.; Kolter, R. Comparative analyses of the bacterial microbiota of the human nostril and oropharynx. mBio 2010, 1, 10–1128. [Google Scholar] [CrossRef]
  29. Bassis, C.M.; Tang, A.L.; Young, V.B.; Pynnonen, M.A. The nasal cavity microbiota of healthy adults. Microbiome 2014, 2, 27. [Google Scholar] [CrossRef]
  30. Hyde, E.R.; Haarmann, D.P.; Petrosino, J.F.; Lynne, A.M.; Bucheli, S.R. Initial insights into bacterial succession during human decomposition. Int. J. Leg. Med. 2015, 129, 661–671. [Google Scholar] [CrossRef]
  31. Huang, X.; Zeng, J.; Li, S.; Chen, J.; Wang, H.; Li, C.; Zhang, S. 16S rRNA, metagenomics and 2bRAD-M sequencing to decode human thanatomicrobiome. Sci. Data 2024, 11, 736. [Google Scholar] [CrossRef]
  32. Metcalf, J.L.; Xu, Z.Z.; Weiss, S.; Lax, S.; Van Treuren, W.; Hyde, E.R.; Song, S.J.; Amir, A.; Larsen, P.; Sangwan, N.; et al. Microbial community assembly and metabolic function during mammalian corpse decomposition. Science 2016, 351, 158–162. [Google Scholar] [CrossRef] [PubMed]
  33. Hyde, E.R.; Metcalf, J.L.; Bucheli, S.R.; Lynne, A.M.; Knight, R. Microbial communities associated with decomposing corpses. In Forensic Microbiology; Wiley: Hoboken, NJ, USA, 2017; pp. 245–273. [Google Scholar]
  34. Baker, J.L.; Mark Welch, J.L.; Kauffman, K.M.; McLean, J.S.; He, X. The oral microbiome: Diversity, biogeography and human health. Nat. Rev. Microbiol. 2024, 22, 89–104. [Google Scholar] [CrossRef] [PubMed]
  35. Pechal, J.L.; Schmidt, C.J.; Jordan, H.R.; Benbow, M.E. A large-scale survey of the postmortem human microbiome, and its potential to provide insight into the living health condition. Sci. Rep. 2018, 8, 5724. [Google Scholar] [CrossRef]
  36. Braga, R.M.; Dourado, M.N.; Araújo, W.L. Microbial interactions: Ecology in a molecular perspective. Braz. J. Microbiol. 2016, 47, 86–98. [Google Scholar] [CrossRef] [PubMed]
  37. Callahan, B.J.; McMurdie, P.J.; Rosen, M.J.; Han, A.W.; Johnson, A.J.A.; Holmes, S.P. DADA2: High-resolution sample inference from Illumina amplicon data. Nat. Methods 2016, 13, 581–583. [Google Scholar] [CrossRef]
  38. Bolyen, E.; Rideout, J.R.; Dillon, M.R.; Bokulich, N.A.; Abnet, C.C.; Al-Ghalith, G.A.; Alexander, H.; Alm, E.J.; Arumugam, M.; Asnicar, F.; et al. Reproducible, interactive, scalable and extensible microbiome data science using QIIME 2. Nat. Biotechnol. 2019, 37, 852–857. [Google Scholar]
  39. Chao, A.; Bunge, J. Estimating the number of species in a stochastic abundance model. Biometrics 2002, 58, 531–539. [Google Scholar] [CrossRef]
  40. Hill, T.C.; Walsh, K.A.; Harris, J.A.; Moffett, B.F. Using ecological diversity measures with bacterial communities. FEMS Microbiol. Ecol. 2003, 43, 1–11. [Google Scholar]
  41. Liaw, A.; Wiener, M.C. Classification and Regression by randomForest. R J. 2007, 2–3, 18–22. [Google Scholar]
Figure 1. Analysis of microbial diversity among the studied sample groups. (A) Comparison of Chao1 index (alpha diversity) across groups. (B) Comparison of Shannon index (alpha diversity) across groups. (C,D) Beta diversity PCoA plots of the studied groups (*** p < 0.001, ** p < 0.01, * p < 0.05).
Ijms 26 03432 g001
Figure 2. Composition and relative abundances of dominant microbial communities at the phylum and genus levels. (A) Relative abundance of the dominant microbial phyla across all the groups. (B) Relative abundance at the genus level within the healthy volunteer groups. (C) Relative abundance at the genus level within the cadaver groups.
Ijms 26 03432 g002
Figure 3. Phylum-level oral and nasal biomarkers for PMI estimation. (A) Top 10 phylum-level oral microbial biomarkers identified by the random forest model based on their abundance levels. (B) LOESS regression model of PMI based on the relative abundances of five selected oral microbial biomarkers. (C) Top 10 phylum-level nasal microbial biomarkers identified by the random forest model based on their abundance levels. (D) LOESS regression model of PMI based on the relative abundances of five selected nasal microbial biomarkers.
Ijms 26 03432 g003
Figure 4. Genus-level oral and nasal biomarkers for PMI estimation. (A) Top 10 genus-level oral microbial biomarkers identified by the random forest model based on their abundance levels. (B) LOESS regression model of PMI based on the relative abundances of five selected oral microbial biomarkers. (C) Top 10 phylum-level nasal microbial biomarkers identified by the random forest model based on their abundance levels. (D) LOESS regression model of PMI based on the relative abundances of five selected nasal microbial biomarkers.
Ijms 26 03432 g004
Figure 5. Impact of freezing on microbial communities of cadavers. (A) PCoA plot for oral microbiota in frozen versus unfrozen cadavers. (B) PCoA plot for nasal microbiota in frozen versus unfrozen cadavers. (C) PCoA plot for oral microbiota in frozen versus unfrozen cadavers in group D3. (D) PCoA plot for nasal microbiota in frozen versus unfrozen cadavers in group D3. (E,F) Phylum- and genus-level composition and relative abundance of dominant microbial members in frozen versus unfrozen cadavers in group D3.
Ijms 26 03432 g005
Table 1. Description of the cadavers and healthy volunteers analyzed in this study.
GroupIndividualPMI (Days)Age (Years)GenderCause of DeathFrozenSeason of Death
D1S06141MCraniocerebral injuryNoSpring
D1S08147MCoronary heart diseaseNoSpring
D1S09237FCraniocerebral injuryNoSpring
D1S10248MCoronary heart diseaseNoSpring
D1S12347MDrowningNoSpring
D1S40360FDrug intoxicationYesSummer
D2S17449MCoronary heart diseaseNoSpring
D2S31419FTraffic injuryYesSummer
D2S05580MStomach tumor and lung infectionNoWinter
D2S16530FCraniocerebral injuryYesSpring
D2S30551MTraffic injuryYesSummer
D2S24565MCoronary heart diseaseYesSpring
D2S22627MSudden deathYesSpring
D2S33642MElectric shockYesSummer
D2S25762FSeptic shock and multiple organ failureYesSpring
D2S28757MSudden deathYesSpring
D2S35778MAortoclasiaYesSummer
D3S20854MHangingYesSpring
D3S21980MTraffic injuryNoSpring
D3S01954MCraniocerebral injuryYesWinter
D3S191055MAcute pulmonary embolismNoSpring
D3S231071MTraffic injuryYesSpring
D3S181251MTraumatic shockNoSpring
D3S141223FInjury by fall from heightYesSpring
D3S381251MUnknownYesSummer
D3S021564MSudden cardiac deathYesWinter
D4S271846MTraffic injuryYesSpring
D4S321945MTraffic injuryYesSummer
D4S042287FCoronary heart diseaseYesWinter
D4S072265FCoronary heart diseaseYesSpring
D4S112528MCraniocerebral injuryYesSpring
D4S342674MTraffic injuryYesAutumn
D4S392742MTraumaYesSummer
D4S133157MCoronary heart diseaseNoSpring
H1-20M---
H2-24F---
H3-28M---
H4-27M---
H5-26F---
H6-34F---
H7-28M---
H8-31M---
H9-23F---
H10-22F---
Table 2. Summary of main results.
GroupOral Cavity-HOral Cavity-DNasal Cavity-HNasal Cavity-D
Alpha diversityHigher in healthy individual group than cadaver group;
higher in oral group than nasal group
Beta diversityOral vs. nasal: significant clustering
Healthy individual vs. cadaver: no significant clustering
Frozen vs. unfrozen: no significant clustering
Dominant phylaProteobacteria, Firmicutes, and ActinobacteriotaProteobacteria, Firmicutes, and BacteroidotaProteobacteria, Firmicutes, and ActinobacteriotaProteobacteria, Firmicutes, and Actinobacteriota
Frozen vs. unfrozen: frozen samples exhibited a higher relative abundance of Proteobacteria and a lower relative abundance of Actinobacteriota compared to unfrozen samples
Dominant generaStreptococcus and
Haemophilus
Streptococcus and PrevotellaCorynebacterium and StaphylococcusVariation across different PMI stages
Frozen vs. unfrozen: the dominant genera in the nasal group showed substantial differences between frozen and unfrozen samples
PMI-related biomarkers (phylum level)-Firmicutes, Proteobacteria, Bacteroidota, Actinobacteriota, and Fusobacteriota
Key turning points were observed on days 5, 12, and 22
-Firmicutes, Proteobacteria, Bacteroidota, Actinobacteriota, and Fusobacteriota
Similar turning points and the trends for
Proteobacteria and
Firmicutes were reversed compared to the oral group
-Frozen vs. unfrozen: shared the same biomarkers: Firmicutes,
Proteobacteria, Bacteroidota, Actinobacteriota,
and Fusobacteriota
-Frozen vs. unfrozen: shared the same
biomarkers: Firmicutes,
Proteobacteria, Bacteroidota, and Actinobacteriota
PMI-related biomarkers (genus level)-Streptococcus, Escherichia-Shigella, Acinetobacter, Klebsiella, and Leptotrichia-Klebsiella, Corynebacterium, Staphylococcus, Escherichia-Shigella, and Streptococcus
-Frozen vs. unfrozen:
different biomarkers
-Frozen vs. unfrozen:
different biomarkers
except for Klebsiella
Disclaimer/Publisher’s Note: The statements, opinions and data contained in all publications are solely those of the individual author(s) and contributor(s) and not of MDPI and/or the editor(s). MDPI and/or the editor(s) disclaim responsibility for any injury to people or property resulting from any ideas, methods, instructions or products referred to in the content.

