
Gene Expression Profile of Cultured Human Coronary Arterial Endothelial Cells Exposed to Serum from Chronic Kidney Disease Patients: Role of MAPK Signaling Pathway
 , , , , ,
  , ,
, ,
Abstract
1. Introduction
2. Results
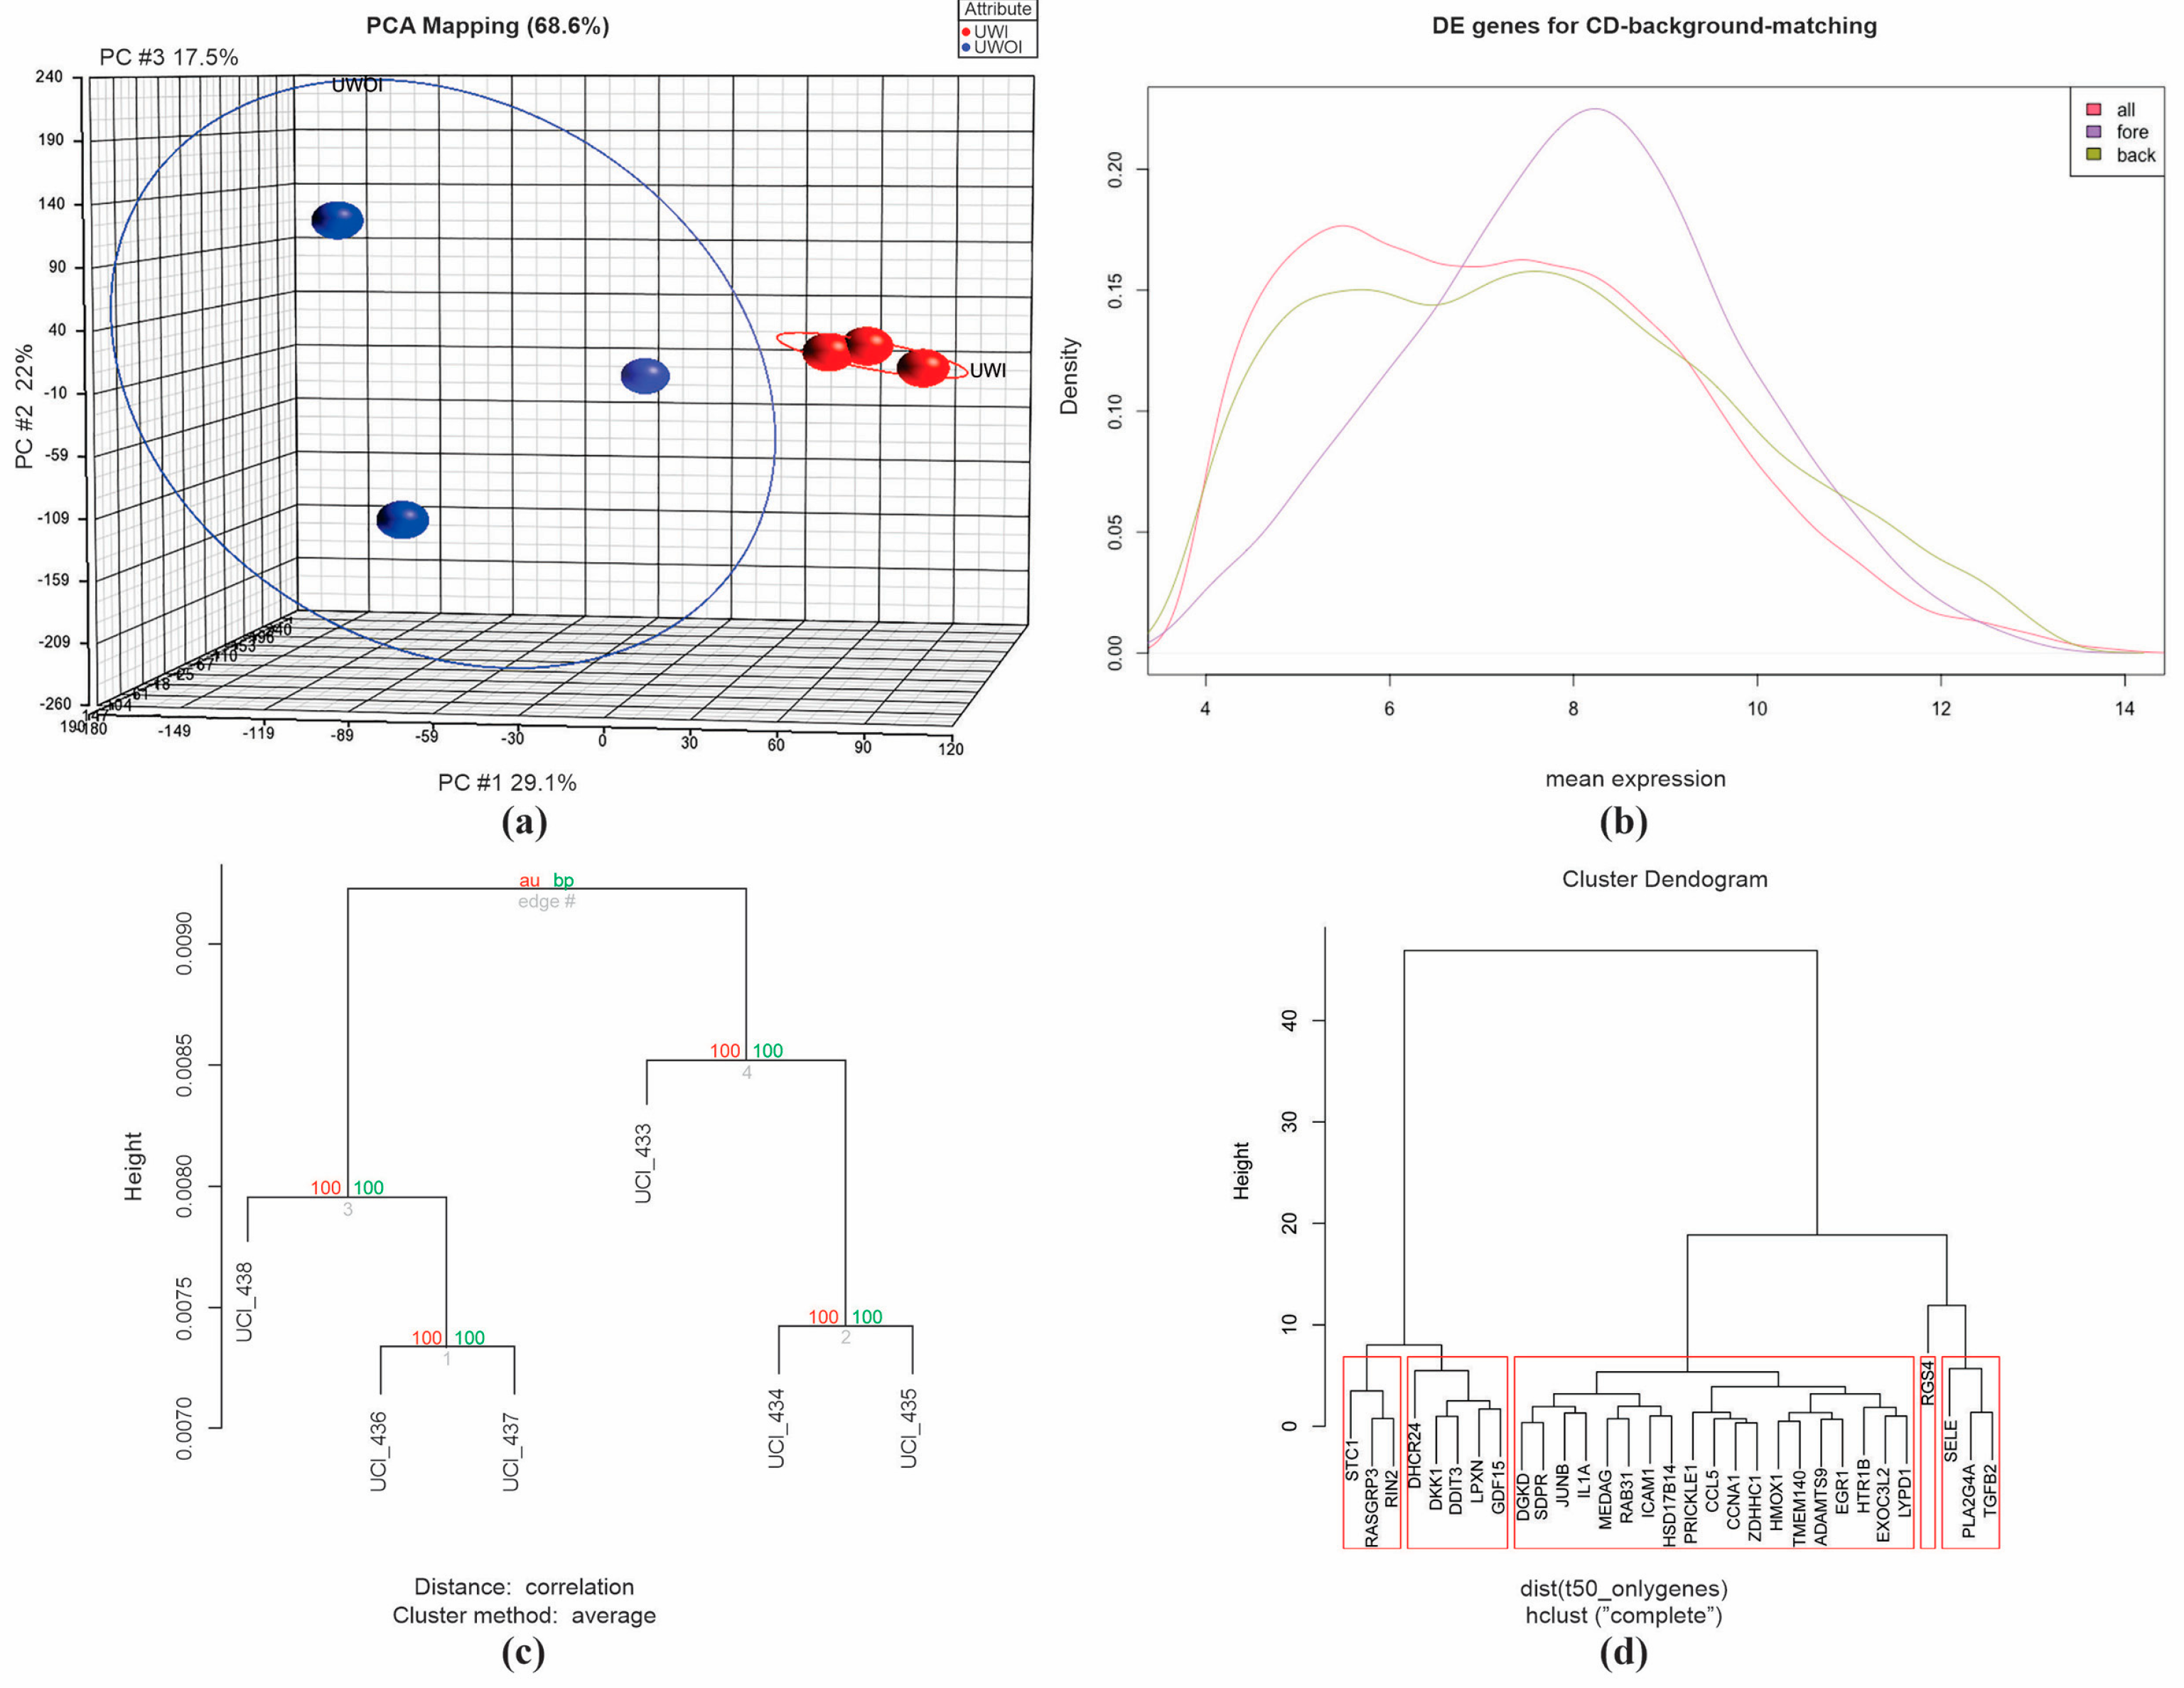
2.1. Microarray Analysis, Overview
2.2. Quality Control Assurance
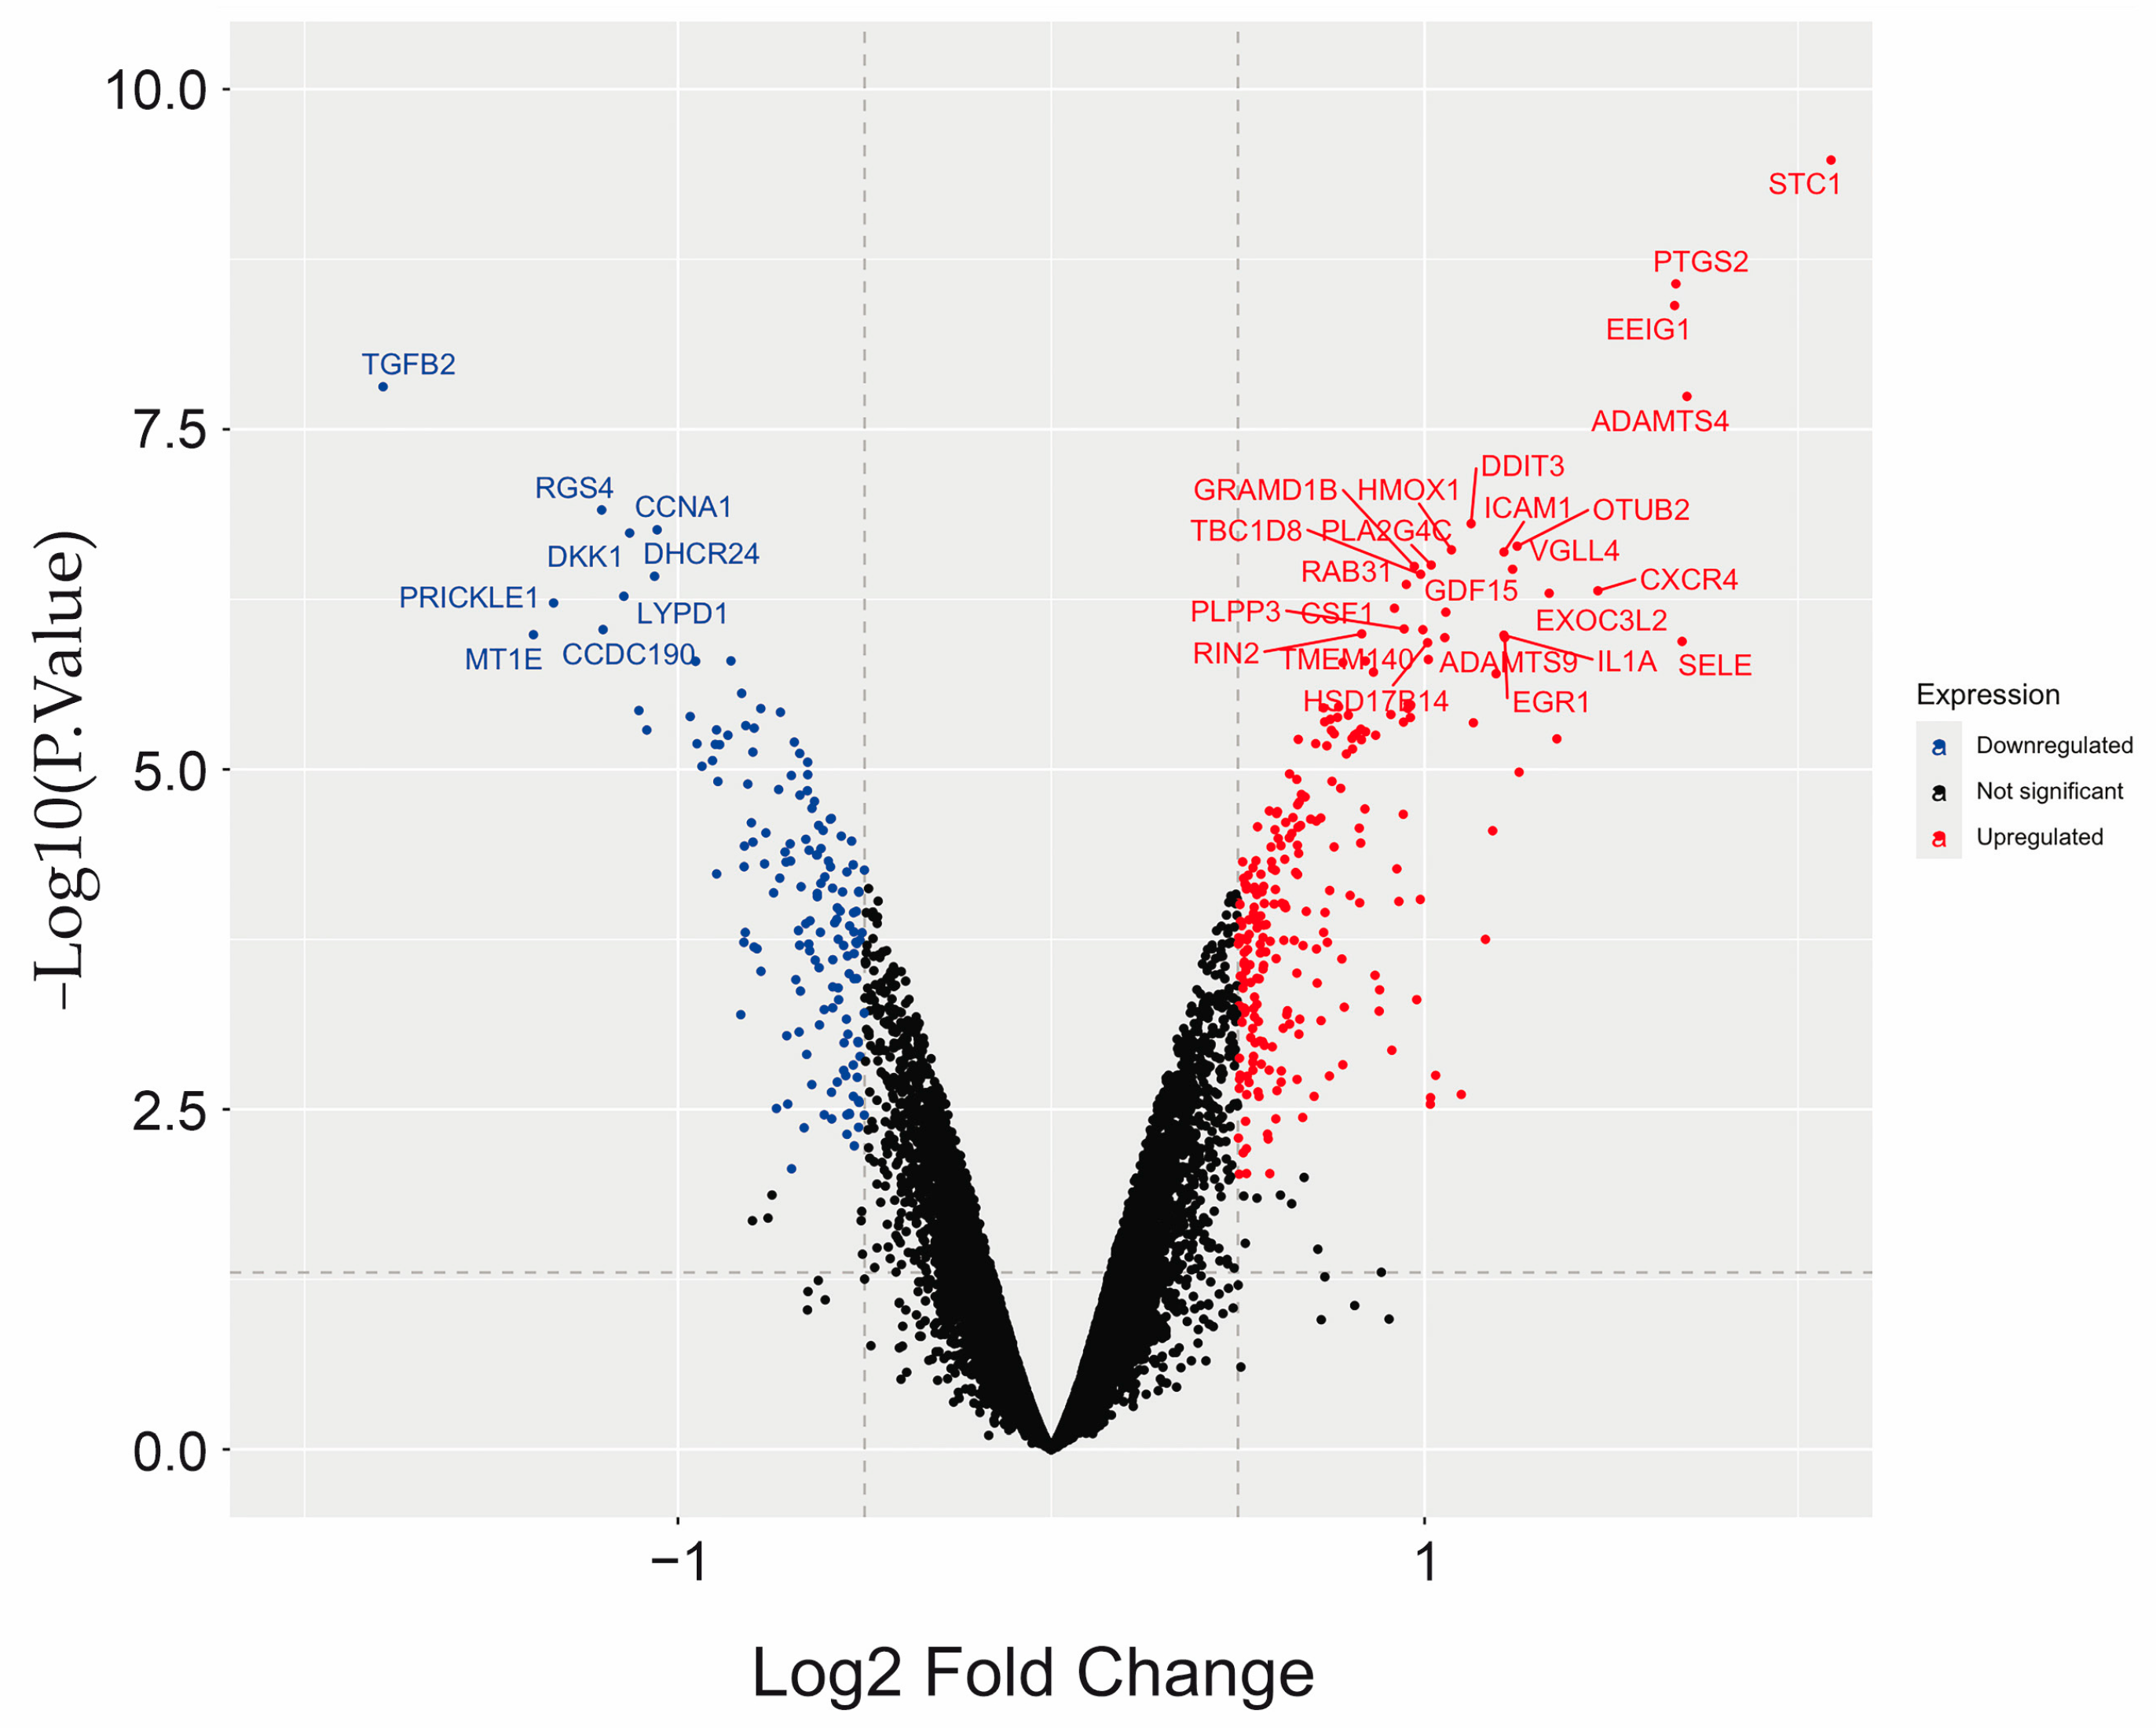
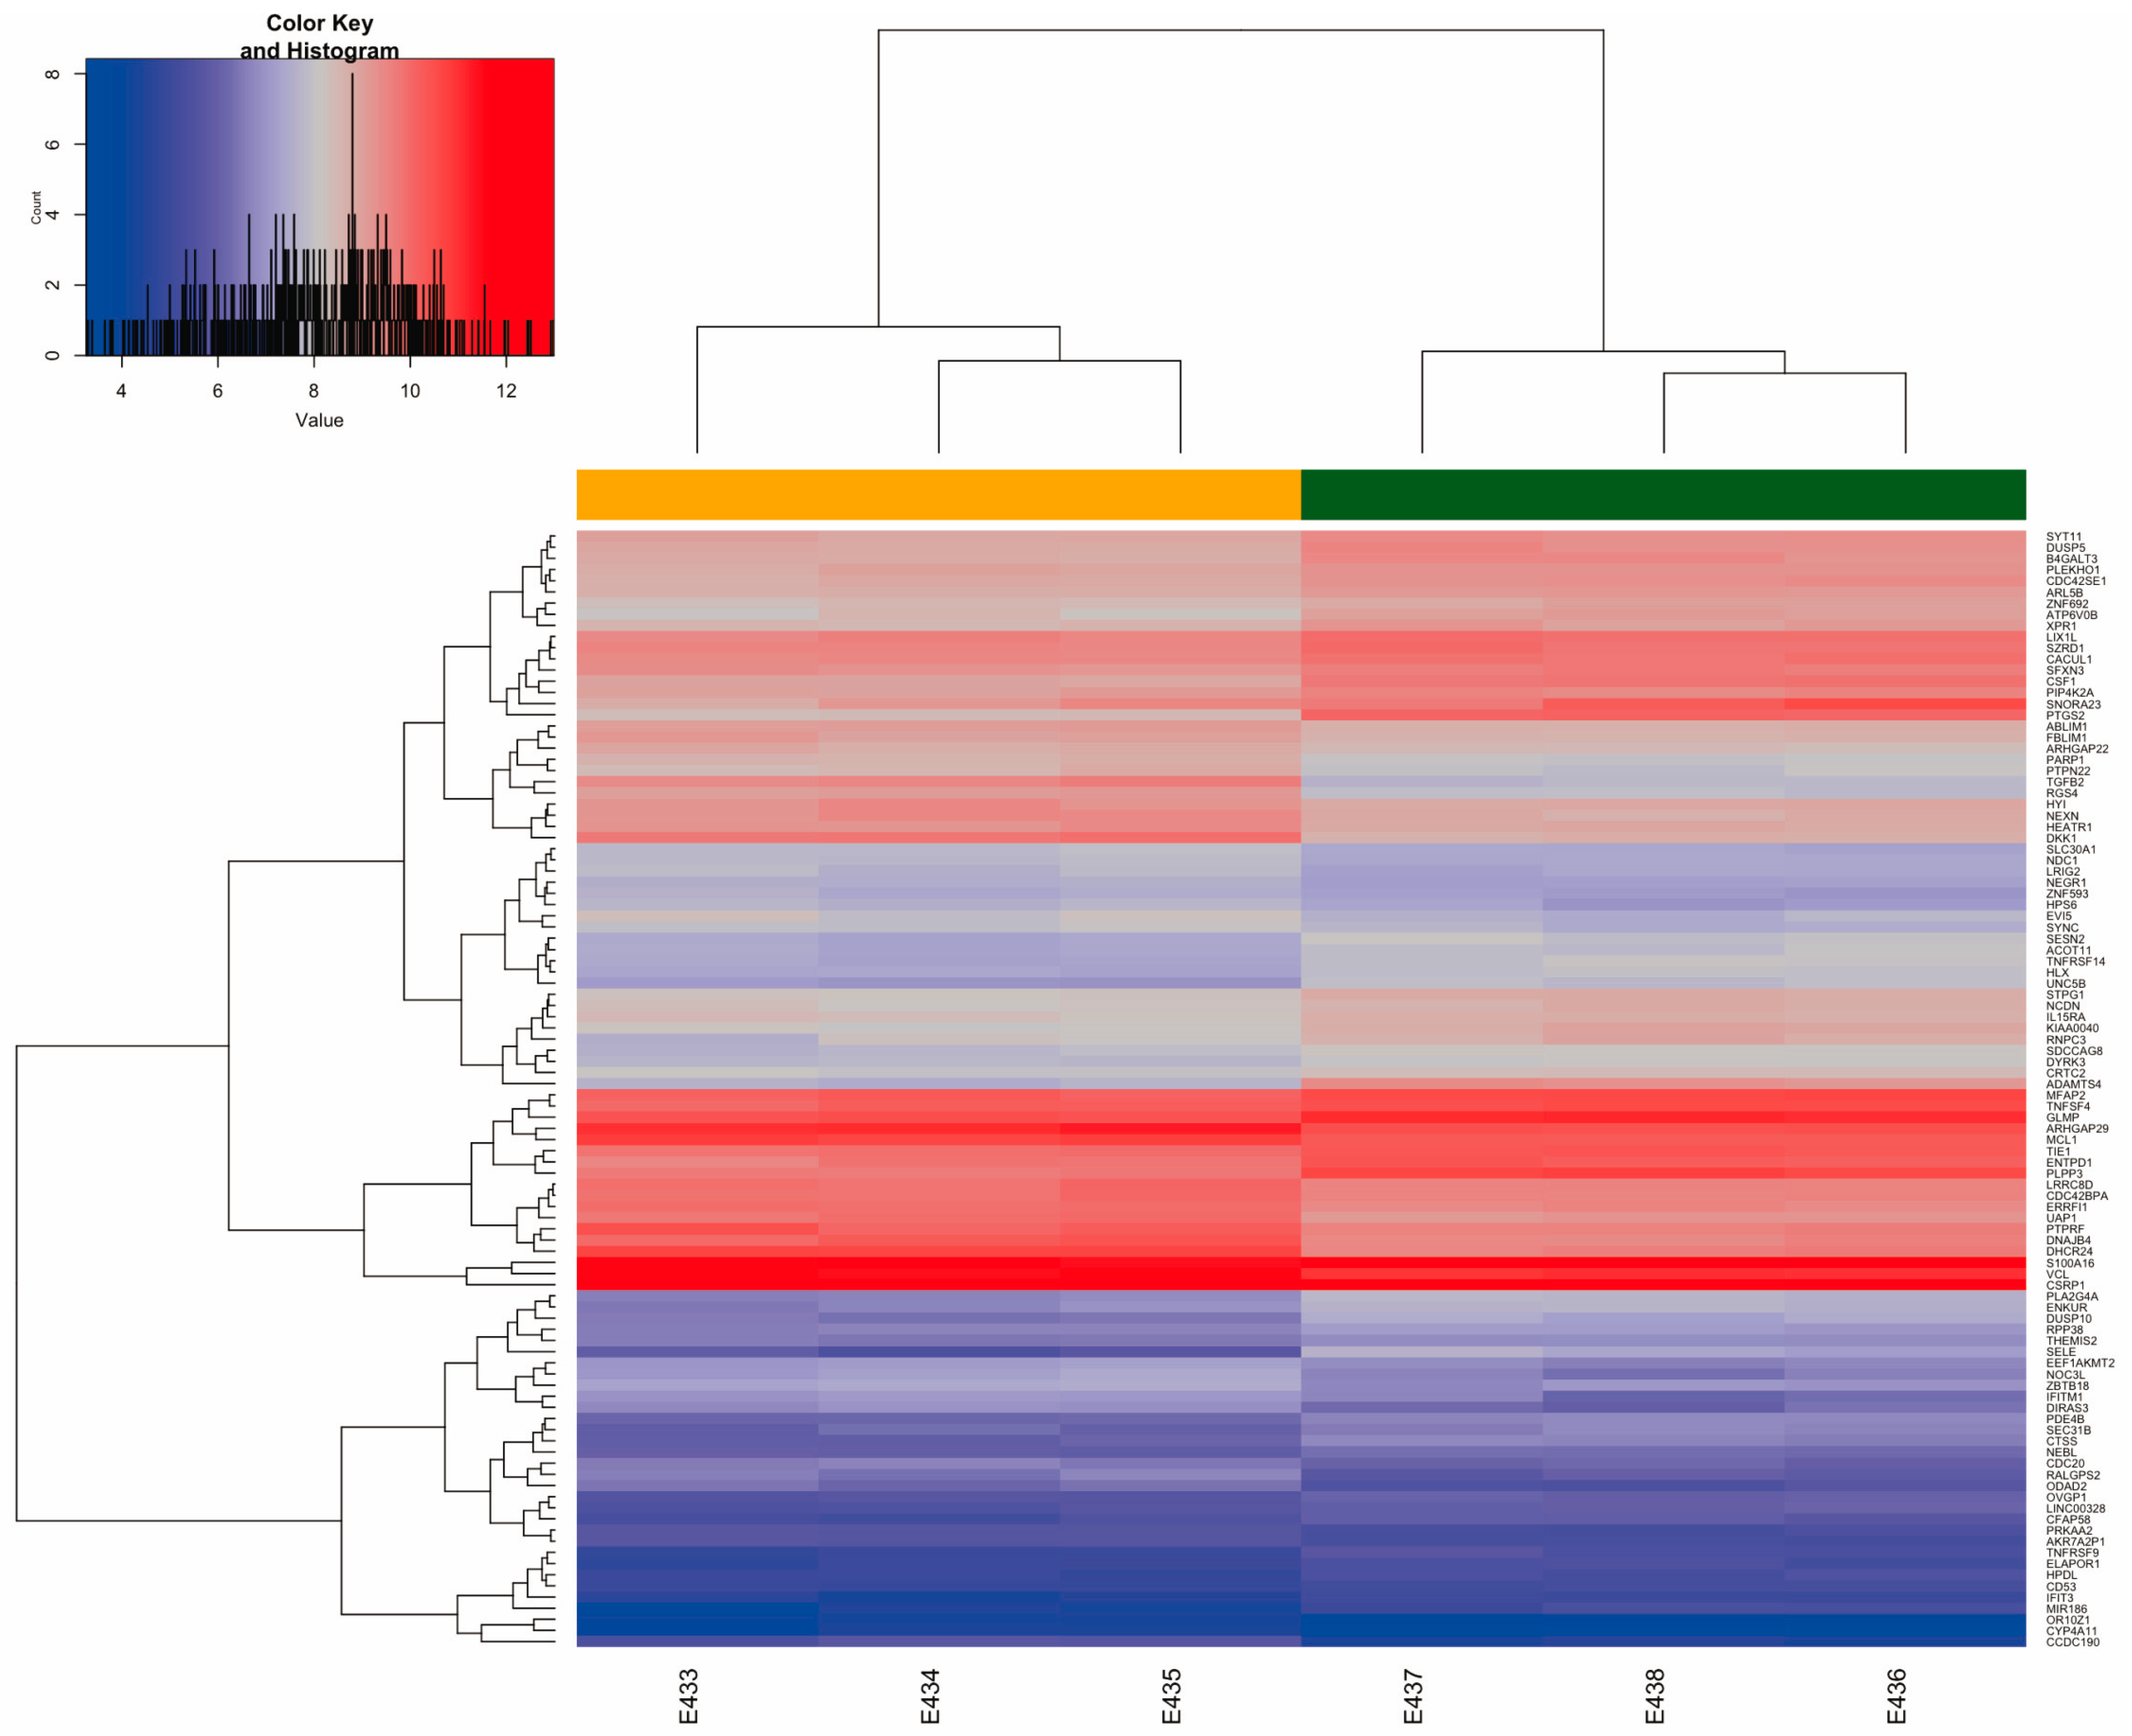
2.3. Differential Gene Expression (DGE) Induced by Uremic Serum

| Symbol | Gene Name | LogFC * | Adj.p.Value | Regulation |
|---|---|---|---|---|
| STC1 | stanniocalcin 1 | 2.0884 | 5.37 × 10⁻⁶ | Up |
| ADAMTS4 | ADAM metallopeptidase with thrombospondin type 1 motif 4 | 1.7026 | 5.87 × 10⁻⁵ | Up |
| SELE | selectin E | 1.6895 | 5.58 × 10⁻⁴ | Up |
| PTGS2 b,i | prostaglandin-endoperoxide synthase 2 | 1.6729 | 2.10 × 10⁻⁵ | Up |
| EEIG1 | estrogen-induced osteoclastogenesis regulator 1 | 1.6695 | 2.10 × 10⁻⁵ | Up |
| CXCR4 j | C-X-C motif chemokine receptor 4 | 1.4639 | 4.11 × 10⁻⁴ | Up |
| TLR2 b | toll-like receptor 2 | 1.2530 | 1.93 × 10⁻³ | Up |
| OTUB2 | OTU deubiquitinase, ubiquitin aldehyde binding 2 | 1.2478 | 3.41 × 10⁻⁴ | Up |
| VGLL4 | vestigial like family member 4 | 1.2355 | 3.63 × 10⁻⁴ | Up |
| EGR1 | early growth response 1 | 1.2146 | 5.44 × 10⁻⁴ | Up |
| ICAM1 c,j | intercellular adhesion molecule 1 | 1.2124 | 3.41 × 10⁻⁴ | Up |
| IL1Ac j | interleukin 1 alpha | 1.2121 | 5.44 × 10⁻⁴ | Up |
| CCL5 c | C-C motif chemokine ligand 5 | 1.1912 | 7.83 × 10⁻⁴ | Up |
| CYP1A1 | cytochrome P450 family 1 subfamily A member 1 | 1.1822 | 3.63 × 10⁻³ | Up |
| DDIT3 | DNA damage-inducible transcript 3 | 1.1244 | 3.29 × 10⁻⁴ | Up |
| MIR21 b,c,g,j | microRNA 21 | 1.0981 | 5.19 × 10⁻² | Up |
| HMOX1 J | heme oxygenase 1 | 1.0718 | 3.41 × 10⁻⁴ | Up |
| GDF15 | growth differentiation factor 15 | 1.0566 | 4.72 × 10⁻⁴ | Up |
| ADAMTS9 j | ADAM metallopeptidase with thrombospondin type 1 motif 9 | 1.0539 | 5.44 × 10⁻⁴ | Up |
| PLA2G4C | phospholipase A2 group IVC | 1.0174 | 3.63 × 10⁻⁴ | Up |
| HSD17B14 | hydroxysteroid 17-beta dehydrogenase 14 | 1.0079 | 5.58 × 10⁻⁴ | Up |
| LIF j | LIF interleukin 6 family cytokine | 0.9787 | 2.07 × 10⁻² | Up |
| B3GAT3 e | beta-1,3-glucuronyltransferase 3 | 0.9618 | 1.25 × 10⁻³ | Up |
| MEF2Cd j | myocyte enhancer factor 2C | 0.9556 | 1.23 × 10⁻³ | Up |
| CYP4A11 | cytochrome P450 family 4 subfamily A member 11 | 0.9356 | 1.77 × 10⁻³ | Up |
| VEGFA a,f,h,j | vascular endothelial growth factor A | 0.8306 | 1.32 × 10⁻³ | Up |
| SEMA7A c,j | semaphorin 7A (JohnMiltonHagen blood group) | 0.8249 | 3.56 × 10⁻³ | Up |
| TNFAIP3 j | TNF alpha-induced protein 3 | 0.6544 | 5.62 × 10⁻³ | Up |
| LPL b | lipoprotein lipase | 0.6376 | 3.97 × 10⁻³ | Up |
| MAPK13 b | mitogen-activated protein kinase 13 | 0.6326 | 2.29 × 10⁻² | Up |
| IFRD1 j | interferon related developmental regulator 1 | 0.6210 | 2.71 × 10⁻² | Up |
| NEK10 a | NIMA-related kinase 10 | 0.6161 | 0.04 × 10⁻² | Up |
| CEACAM1 g, j | CEA cell adhesion molecule 1 | 0.5707 | 0.03 × 10⁻² | Up |
| TGFB1 a,b,c,d,e,g,j | transforming growth factor beta 1 | 0.5671 | 1.11 × 10⁻² | Up |
| DUSP5 | dual specificity phosphatase 5 | 0.5687 | 6.67 × 10⁻³ | Up |
| ETS1 b,j | ETS proto-oncogene 1, transcription factor | 0.5425 | 6.76 × 10⁻³ | Up |
| MMP14 d | matrix metallopeptidase 14 | 0.5033 | 1.14 × 10⁻² | Up |
| PLAUR g | plasminogen activator, urokinase receptor | 0.5015 | 2.24 × 10⁻² | Up |
| CDK5 j | cyclin-dependent kinase 5 | 0.4981 | 7.40 × 10⁻³ | Up |
| ALPK3 f | alpha kinase 3 | 0.4973 | 8.60 × 10⁻³ | Up |
| TGFB2 f | transforming growth factor beta 2 | −1.7897 | 5.87 × 10⁻⁵ | Down |
| MT1E | metallothionein 1E | −1.3871 | 5.44 × 10⁻⁴ | Down |
| PRICKLE1 f,g,j | prickle planar cell polarity protein 1 | −1.3330 | 4.40 × 10⁻⁴ | Down |
| RGS4 f | regulator of G protein signaling 4 | −1.2042 | 3.29 × 10⁻⁴ | Down |
| CCDC190 | coiled-coil domain containing 190 | −1.2006 | 5.44 × 10⁻⁴ | Down |
| LYPD1 | LY6/PLAUR domain containing 1 | −1.1449 | 4.12 × 10⁻⁴ | Down |
| DKK1 a,i,j | Dickkopf WNT signaling pathway inhibitor 1 | −1.1293 | 3.29 × 10⁻⁴ | Down |
| BDNF j | brain-derived neurotrophic factor | −1.0834 | 1.30 × 10⁻³ | Down |
| DHCR24 | 24-dehydrocholesterol reductase | −1.0626 | 3.63 × 10⁻⁴ | Down |
| CCNA1 | cyclin A1 | −1.0558 | 3.29 × 10⁻⁴ | Down |
| GPRC5A g | G protein-coupled receptor class C group 5 member A | −0.8999 | 1.35 × 10⁻³ | Down |
| CXADR f | CXADR Ig-like cell adhesion molecule | −0.8661 | 1.30 × 10⁻³ | Down |
| PDGFC a,c | platelet-derived growth factor C | −0.8220 | 4.27 × 10⁻³ | Down |
| OSMR b | oncostatin M receptor | −0.8197 | 1.03 × 10⁻² | Down |
| PTGER4 b | prostaglandin E receptor 4 | −0.7993 | 1.47 × 10⁻³ | Down |
| IGF1 c,d,f | insulin-like growth factor 1 | −0.7958 | 1.30 × 10⁻³ | Down |
| TNIK j | TRAF2 and NCK interacting kinase | −0.7303 | 2.35 × 10⁻³ | Down |
| PHLDB2 j | pleckstrin homology like domain family B member 2 | −0.7131 | 4.56 × 10⁻³ | Down |
| SEMA3C j | semaphorin 3C | −0.6574 | 9.43 × 10⁻³ | Down |
| FGD4 j | FYVE, RhoGEF and PH domain containing 4 | −0.6463 | 9.18 × 10⁻³ | Down |
| FGF2 a,c,h,j | fibroblast growth factor 2 | −0.6167 | 4.35 × 10⁻³ | Down |
| NRG1 c,d | neuregulin 1 | −0.6111 | 3.63 × 10⁻³ | Down |
| PTPN22 c | protein tyrosine phosphatase non-receptor type 22 | −0.6083 | 2.28 × 10⁻² | Down |
| GLCE e | glucuronic acid epimerase | −0.5920 | 3.28 × 10⁻³ | Down |
| CCBE1 h,j | collagen and calcium binding EGF domains 1 | −0.5731 | 7.91 × 10⁻³ | Down |
| BMP4 c,d,f,j | bone morphogenetic protein 4 | −0.5708 | 1.82 × 10⁻² | Down |
| IL1RL1 b | interleukin 1 receptor like 1 | −0.5655 | 8.30 × 10⁻³ | Down |
| ARHGAP18 j | Rho GTPase activating protein 18 | −0.5625 | 3.88 × 10⁻³ | Down |
| PRKDC j | protein kinase, DNA-activated, catalytic subunit | −0.5411 | 6.17 × 10⁻² | Down |
| TBX18 f,j | T-box transcription factor 18 | −0.5347 | 4.10 × 10⁻³ | Down |
| NTN4 j | netrin 4 | −0.5306 | 5.22 × 10⁻³ | Down |
| SLIT2 j | slit guidance ligand 2 | −0.5214 | 1.64 × 10⁻² | Down |
| PRKCAc j | protein kinase C alpha | −0.5177 | 3.13 × 10⁻² | Down |
| ABCC1 b | ATP binding cassette subfamily C member 1 (ABCC1 blood group) | −0.5148 | 5.60 × 10⁻² | Down |
| LDLR b | low-density lipoprotein receptor | −0.4993 | 2.04 × 10⁻² | Down |
| EFNB2 d,h,j | ephrin B2 | −0.4972 | 1.40 × 10⁻² | Down |
| ERBB2 a,g,j | erb-b2 receptor tyrosine kinase 2 | −0.4916 | 1.82 × 10⁻² | Down |
| MAP3K5 a | mitogen-activated protein kinase kinase kinase 5 | −0.4645 | 3.80 × 10⁻² | Down |
| GO ID | Term Description | Annotated | Significant | Rank in Fisher Classic | Fisher Elimination | Fisher Classic | Significant Genes |
|---|---|---|---|---|---|---|---|
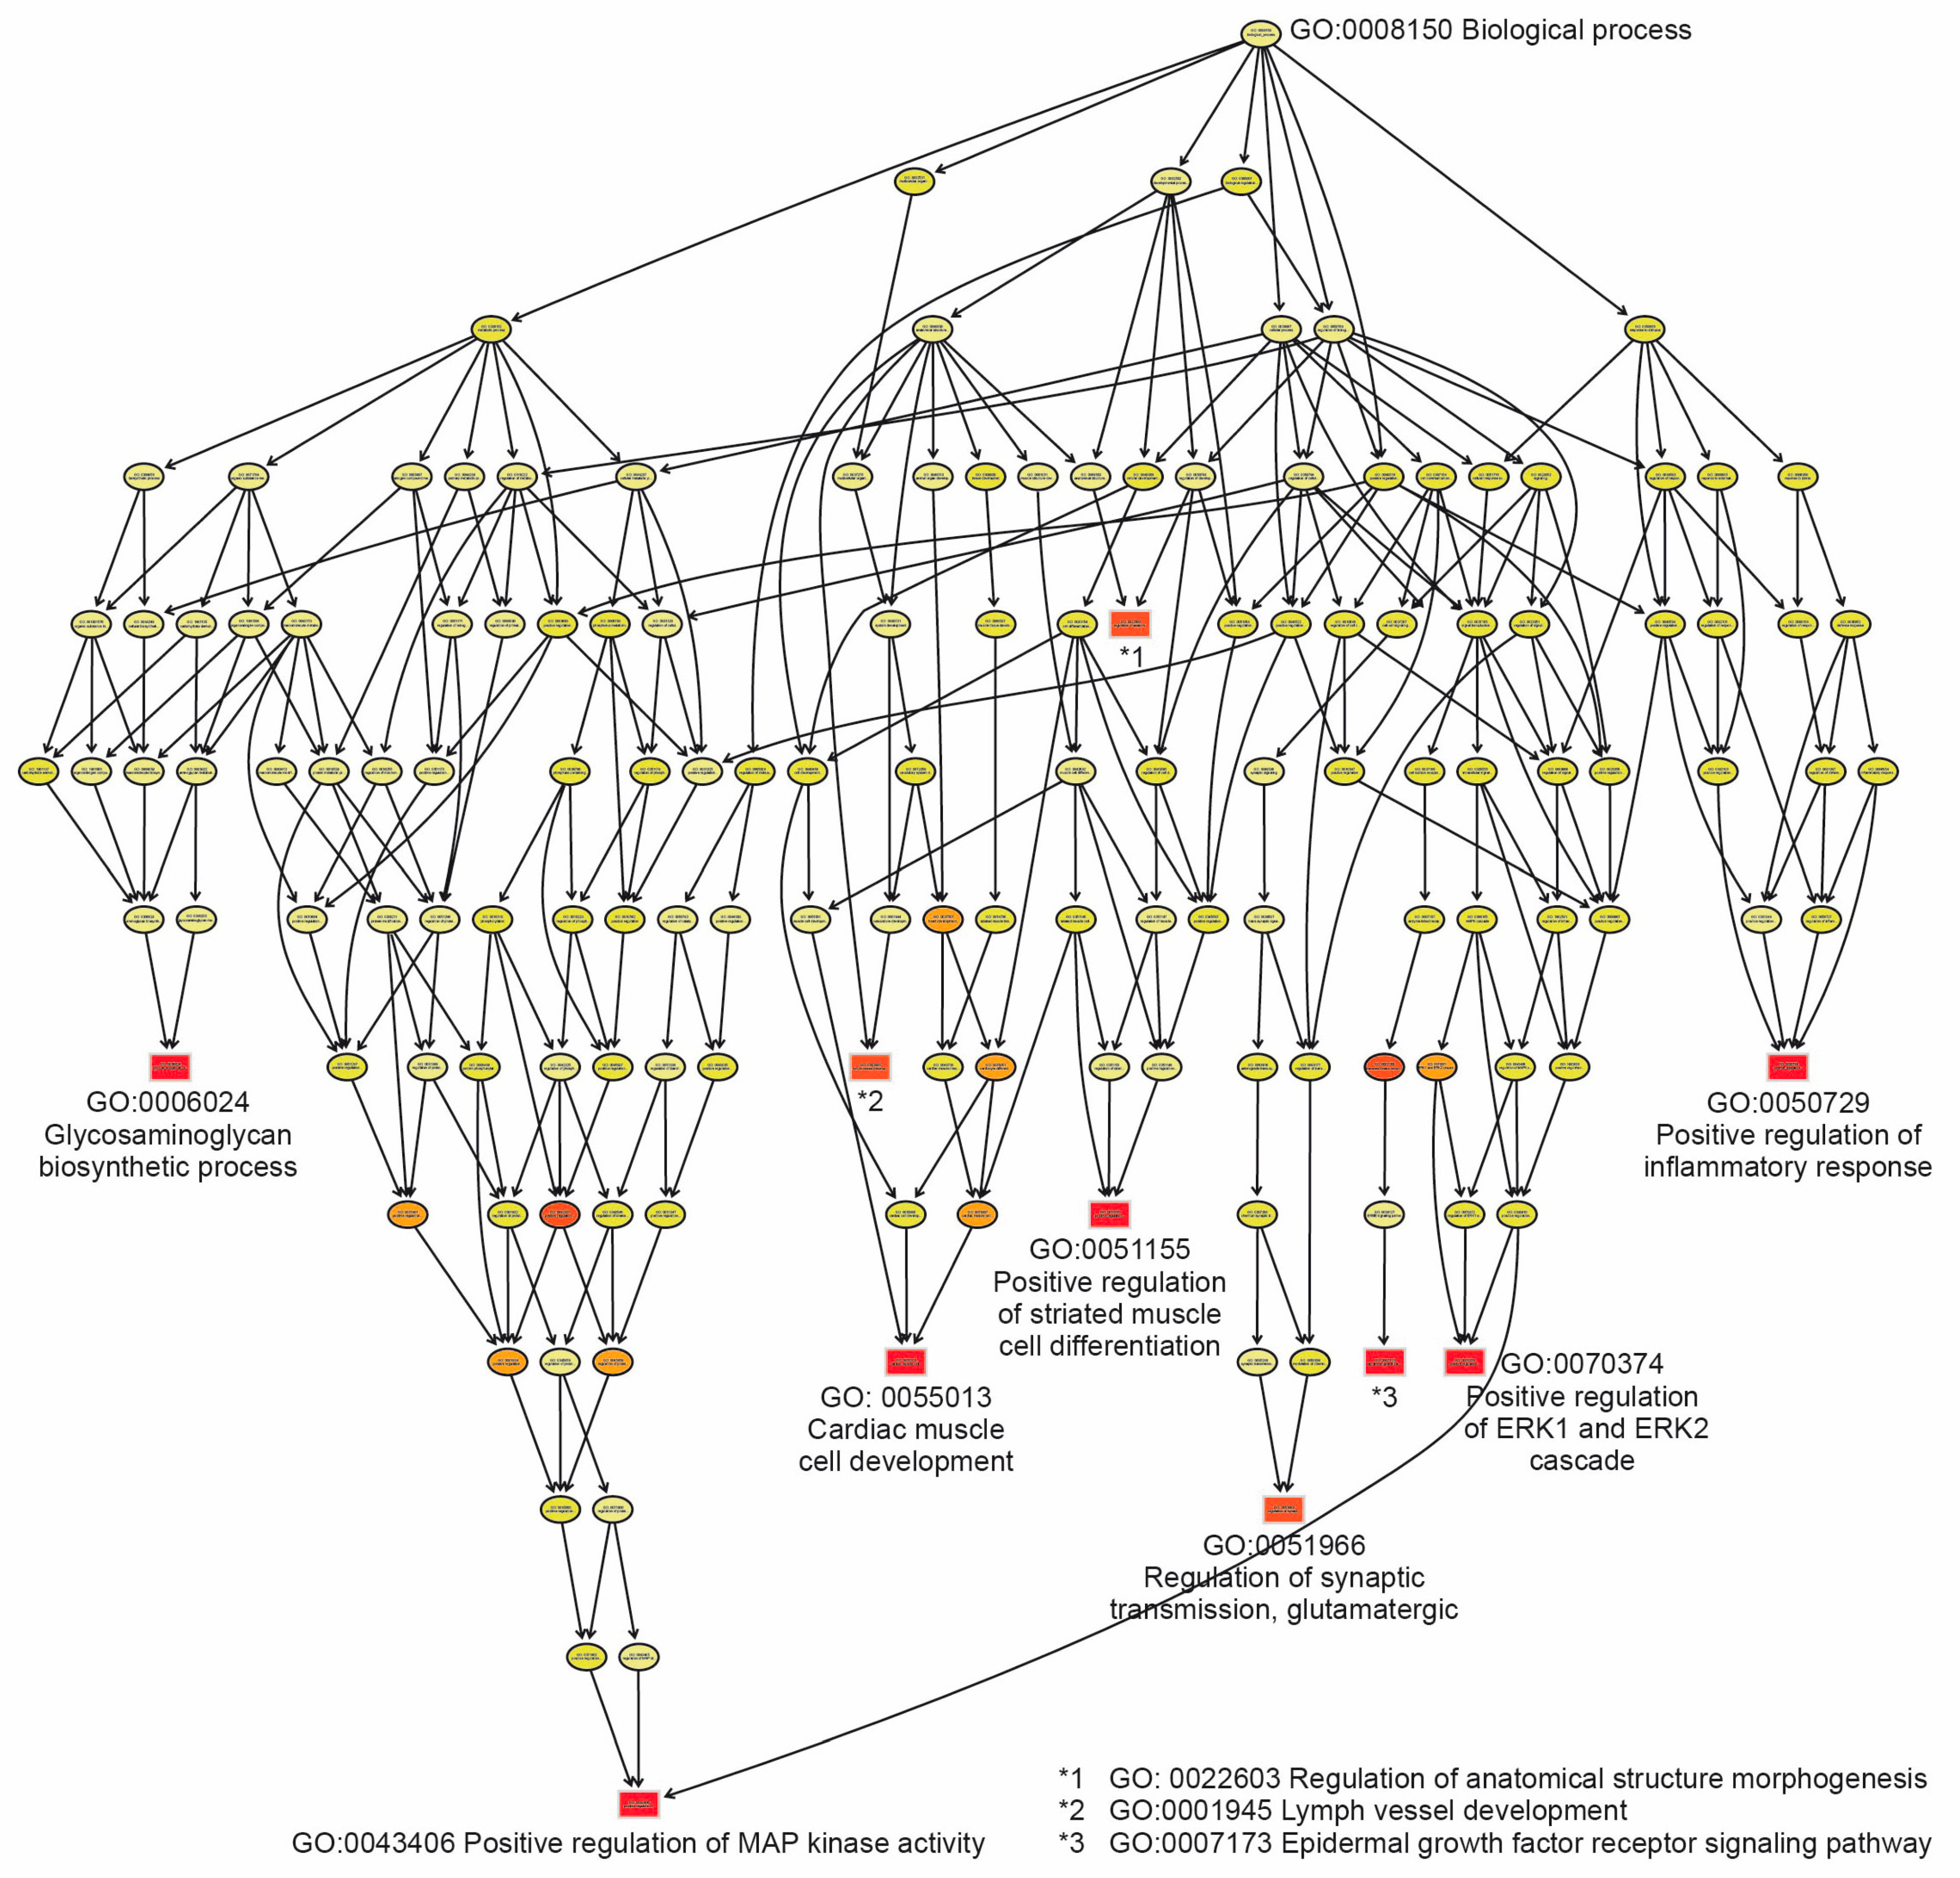
| GO:0043406 | Positive regulation of MAP kinase activity | 27 | 15 | 86 | 0.00016 | 0.00016 | DKK1; ERP29; FLT1; ERBB2; TGFB1; IL1B; CD40; DVL3; NEK10; FGF2; PDGFC; GHR; EDN1; VEGFA; MAP3K5. |
| GO:0050729 | Positive regulation of inflammatory response | 45 | 21 | 101 | 0.00023 | 0.00023 | TNFSF18; TNFSF4; PTGS2; ETS1; NFBIA; ABCC1; GPRC5B; NUPR1; ADOR2; MIR21; LDLR; TGFB1; IL1RL1; IL1B; TLR2; OSMR; PTGER4; NAIP; TNIP1; MAPK13; LPL. |
| GO:0070374 | Positive regulation of ERK1 and ERK2 cascade | 61 | 26 | 107 | 0.00027 | 0.00027 | PTPN22; CAVIN3; DENND2B; IGF1; FERMT2; BMP4; SEMA7A; CCL2; MIR21; PRKCA; CCL5; ABCA7; ICAM1; MIR23A; TGFB1; IL1A; FGF2; RAPGEF2; PDGFC; TPBG; CCN2; GPNMB; MTURN; INHBA; NRG1; ABL1. |
| GO:0051155 | Positive regulation of striated muscle cell differentiation | 15 | 10 | 110 | 0.00028 | 0.00028 | IGF1; EFNB2; MMP14; BMP4; TGFB1; TBX1; MEF2C; EDN1; NRG1; NIBAN2. |
| GO:0006024 | Glycosaminoglycan biosynthetic process | 20 | 12 | 112 | 0.00028 | 0.00028 | CHST3; ST3GAL4; CHST1; B3GAT3; CHST11; GLCE; CLTC; TGFB1; IL1B; ST3GAL6; ABCC5; CHSY3. |
| GO:0055013 | Cardiac muscle cell development | 37 | 18 | 120 | 0.00034 | 0.00034 | RGS4; NEBL; PRICKLE1; IGF1; BMP4; ALPK3; MEF2A; FHOD3; MIR23A; FHL2; CXADR; PDLIM5; SORBS2; EDN1; VEGFA; TBX18; BVES; PLEC. |
| GO:0007173 | Epidermal growth factor receptor signaling pathway | 44 | 20 | 137 | 0.0005 | 0.0005 | ERRFI1; PIK3C2A; GPRC5A; PRICKLE1; BCAR1; ERBB2; MIR21; RHBDF2; MVB12A; TGFB1; CEACAM1; PLAUR; DGKD; CCDC88A; TGFA; CBLB; AREG; GAB1; ERBIN; ABL1. |
| GO:0001945 | Lymph vessel development | 16 | 10 | 147 | 0.0006 | 0.0006 | TIE1; PTPN14; EFNB2; CLEC14A; TMEM204; CCBE1; TBX1; HEG1; FGF2; VEGFA. |
| GO:0051966 | Regulation of synaptic transmission glutamatergic | 24 | 13 | 150 | 0.00062 | 0.00062 | PTGS2; DKK1; DGKZ; SYT1; CLN3; CCL2; CACNG7; SHANK3; HOMER1; MEF2C; HTR1B; CDK5; OPHN1. |
| GO:0022603 | Regulation of anatomical structure morphogenesis | 352 | 103 | 175 | 0.00084 | 0.00084 | FBLIM1; TIE1; CSF1; STRIP1; PLEKHO1; TGFB2; LRP8; CDC42SE1; AKT3; DKK1; ADAM12; BDNF; ETS1; FGD4; SYT1; EPS8; PRICKLE1; BTG1; NTN4; FLT1; EFNB2; DAAM1; INF2; FERMT2; BMP4; PGF; SEMA6D; SEMA7A; EEF2K; CCL2; ERBB2; FMNL1; MIR21; PRKCA; RAC3; DLG4; SP6; SPAG9; DCC; NEDD4L; EPB41L3; CCBE1; EMC10; CACNG7; TGFB1; CEACAM1; CDC42EP3; IL1A; IL1B; CXCR4; STAT1; CD40; ADAMTS1; RUNX1; TBX1; NF2; HMOX1; SHANK3; LIF; PHLDB2; SKIL; DVL3; ADAMTS9; TNIK; SLIT2; PDLIM5; FGF2; GAB1; POU4F2; RAPGEF2; RASA1; MYO10; MEF2C; EFNA5; EDN1; VEGFA; TNFAIP3; TBX18; BVES; ARHGAP18; SYNE1; EZR; LFNG; ITGB8; GPNMB; IFRD1; NOS3; SEMA3C; SEMA3D; SMURF1; PLXNA4; CDK5; ADGRA2; SDC2; NEFL; PRKDC; PALM2AKAP2; ABL1; NIBAN2; NSMF; FOXO4; SH3KBP1; ZMYM3. |
2.4. Functional Analysis Through Gene Enrichment
2.5. Construction of a Network of Molecular Interactions
2.6. Validation of DEGs Through Quantitative RT-qPCR
3. Discussion
Limitations of the Study
4. Materials and Methods
4.1. Origin and Collection of Human Uremic Serum
4.2. Sample Collection and Processing
4.3. Primary Culture of Human Endothelial Cells, RNA Isolation, Purification and Quality
4.4. Microarray Assay
4.5. Data Preprocessing
4.6. Differentially Expressed Genes (DEGs) in UWOI and UWI Groups
4.7. Pathway Enrichment Analysis of DEGs
4.8. Construction of Gene Functional Interaction Network
4.9. Validation Assay Through Real-Time qPCR
5. Conclusions
Author Contributions
Funding
Institutional Review Board Statement
Informed Consent Statement
Data Availability Statement
Conflicts of Interest
References
- Bikbov, B.; Purcell, C.; Levey, A.S.; Smith, M.; Abdoli, A.; Abebe, M.; Adebayo, O.M.; Afarideh, M.; Agarwal, S.K.; Ahmaidan, E.; et al. Global, regional, and national burden of chronic kidney disease, 1990–2017: A systematic analysis for the Global Burden of Disease Study 2017. Lancet 2020, 395, 709–733. [Google Scholar] [CrossRef] [PubMed]
- Kovesdy, C.P. Epidemiology of Chronic Kidney Disease: An Update 2022. Kidney Int. Suppl. 2022, 12, 7–11. [Google Scholar] [CrossRef] [PubMed]
- Thompson, S.; James, M.; Wiebe, N.; Hemmelgarn, B.; Manns, B.; Klarenbach, S.; Tonelli, M.; Network, A.K.D. Cause of Death in Patients with Reduced Kidney Function. J. Am. Soc. Nephrol. 2015, 26, 2504–2511. [Google Scholar] [CrossRef] [PubMed]
- Moradi, H.; Sica, D.A.; Kalantar-Zadeh, K. Cardiovascular burden associated with uremic toxins in patients with chronic kidney disease. Am. J. Nephrol. 2013, 38, 136–148. [Google Scholar] [CrossRef]
- Menon, V.; Gul, A.; Sarnak, M.J. Cardiovascular risk factors in chronic kidney disease. Kidney Int. 2005, 68, 1413–1418. [Google Scholar] [CrossRef]
- Dai, L.; Qureshi, A.R.; Witasp, A.; Lindholm, B.; Stenvinkel, P. Early Vascular Ageing and Cellular Senescence in Chronic Kidney Disease. Comput. Struct. Biotechnol. J. 2019, 17, 721–729. [Google Scholar] [CrossRef]
- Nilsson, P.M. Early vascular aging (EVA): Consequences and prevention. Vasc. Health Risk Manag. 2008, 4, 547–552. [Google Scholar] [CrossRef]
- Blacher, J.; Guerin, A.P.; Pannier, B.; Marchais, S.J.; London, G.M. Arterial calcifications, arterial stiffness, and cardiovascular risk in end-stage renal disease. Hypertension 2001, 38, 938–942. [Google Scholar] [CrossRef]
- Martens, C.R.; Kirkman, D.L.; Edwards, D.G. The Vascular Endothelium in Chronic Kidney Disease: A Novel Target for Aerobic Exercise. Exerc. Sport Sci. Rev. 2016, 44, 12–19. [Google Scholar] [CrossRef]
- Yilmaz, M.I.; Stenvinkel, P.; Sonmez, A.; Saglam, M.; Yaman, H.; Kilic, S.; Eyileten, T.; Caglar, K.; Oguz, Y.; Vural, A.; et al. Vascular health, systemic inflammation and progressive reduction in kidney function; clinical determinants and impact on cardiovascular outcomes. Nephrol. Dial. Transplant. 2011, 26, 3537–3543. [Google Scholar] [CrossRef]
- Lim, Y.J.; Sidor, N.A.; Tonial, N.C.; Che, A.; Urquhart, B.L. Uremic Toxins in the Progression of Chronic Kidney Disease andCardiovascular Disease: Mechanisms and Therapeutic Targets. Toxins 2021, 13, 142. [Google Scholar] [CrossRef] [PubMed]
- Wojtaszek, E.; Oldakowska-Jedynak, U.; Kwiatkowska, M.; Glogowski, T.; Malyszko, J. Uremic Toxins, Oxidative Stress, Atherosclerosis in Chronic Kidney Disease, and Kidney Transplantation. Oxidative Med. Cell. Longev. 2021, 2021, 6651367. [Google Scholar] [CrossRef] [PubMed]
- Falconi, C.A.; Junho, C.V.D.C.; Fogaça-Ruiz, F.; Vernier, I.C.S.; Da Cunha, R.S.; Stinghen, A.E.M.; Carneiro-Ramos, M.S. Uremic Toxins: An Alarming Danger Concerning the Cardiovascular System. Front. Physiol. 2021, 12, 686249. [Google Scholar] [CrossRef]
- Vanholder, R.; Henle, T.; De Smet, R.; Glorieux, G.; Argilés, A.; Baurmeister, U.; Brunet, P.; Clark, W.F.; Cohen, G.M.; De Deyn, P.P.; et al. Review on uremic toxins: Classification, concentration, and interindividual variability. Kidney Int. 2003, 63, 1934–1943. [Google Scholar] [CrossRef] [PubMed]
- Vanholder, R.; Pletinck, A.; Schepers, E.; Glorieux, G. Biochemical and Clinical Impact of Organic Uremic Retention Solutes: A Comprehensive Update. Toxins 2018, 10, 33. [Google Scholar] [CrossRef]
- Castillo-Rodriguez, E.; Pizarro-Sánchez, S.; Sanz, A.B.; Ramos, A.M.; Sanchez-Niño, M.D.; Martin-Cleary, C.; Fernandez, B.; Ortiz, A. Inflammatory Cytokines as Uremic Toxins: “Ni Son Todos Los Que Estan, Ni Estan Todos Los Que Son”. Toxins 2017, 9, 114. [Google Scholar] [CrossRef]
- Fujii, H.; Nakai, K.; Fukagawa, M. Role of Oxidative Stress and Indoxyl Sulfate in Progression of Cardiovascular Disease in Chronic Kidney Disease. Ther. Apher. Dial. 2011, 15, 125–128. [Google Scholar] [CrossRef]
- Shafi, T.; Meyer, T.W.; Hostetter, T.H.; Melamed, M.L.; Parekh, R.S.; Hwang, S.; Banerjee, T.; Coresh, J.; Powe, N.R. Free Levels of Selected Organic Solutes and Cardiovascular Morbidity and Mortality in Hemodialysis Patients: Results from the Ret Retained Organic Solutes and Clinical Outcomes (ROSCO) Investigators. PLoS ONE 2015, 10, e0126048. [Google Scholar] [CrossRef]
- Endemann, D.H.; Schiffrin, E.L. Endothelial dysfunction. J. Am. Soc. Nephrol. 2004, 15, 1983–1992. [Google Scholar] [CrossRef]
- Seliger, S.L.; Salimi, S.; Pierre, V.; Giffuni, J.; Katzel, L.; Parsa, A. Microvascular endothelial dysfunction is associated with albuminuria and CKD in older adults. BMC Nephrol. 2016, 17, 82. [Google Scholar] [CrossRef]
- Roumeliotis, S.; Mallamaci, F.; Zoccali, C. Endothelial Dysfunction in Chronic Kidney Disease, from Biology to Clinical Outcomes: A 2020 Update. J. Clin. Med. 2020, 9, 2359. [Google Scholar] [CrossRef] [PubMed]
- Stam, F.; van Guldener, C.; Becker, A.; Dekker, J.M.; Heine, R.J.; Bouter, L.M.; Stehouwer, C.D. Endothelial dysfunction contributes to renal function-associated cardiovascular mortality in a population with mild renal insufficiency: The Hoorn study. J. Am. Soc. Nephrol. 2006, 17, 537–545. [Google Scholar] [CrossRef] [PubMed]
- Oh, Y.S. Arterial stiffness and hypertension. Clin. Hypertens. 2018, 24, 17. [Google Scholar] [CrossRef] [PubMed]
- Kanbay, M.; Afsar, B.; Goldsmith, D.; Covic, A. Sudden Death in Hemodialysis: An Update. Blood Purif. 2010, 30, 135–145. [Google Scholar] [CrossRef]
- Shroff, G.R.; Li, S.; Herzog, C.A. Trends in Discharge Claims for Acute Myocardial Infarction among Patients on Dialysis. J. Am. Soc. Nephrol. 2017, 28, 1379–1383. [Google Scholar] [CrossRef]
- Amin, A.P.; Spertus, J.A.; Reid, K.J.; Lan, X.; Buchanan, D.M.; Decker, C.; Masoudi, F.A. The Prognostic Importance of Worsening Renal Function during an Acute Myocardial Infarction on Long-Term Mortality. Am. Heart J. 2010, 160, 1065–1071. [Google Scholar] [CrossRef]
- Saleh, M.; Ambrose, J.A. Understanding Myocardial Infarction. F1000Research 2018, 7, 1378. [Google Scholar] [CrossRef]
- Lusis, A.J. Atherosclerosis. Nature 2000, 407, 233–241. [Google Scholar] [CrossRef]
- Gabriel-Costa, D. The Pathophysiology of Myocardial Infarction-Induced Heart Failure. Pathophysiology 2018, 25, 277–284. [Google Scholar] [CrossRef]
- Yap, J.; Irei, J.; Lozano-Gerona, J.; Vanapruks, S.; Bishop, T.; Boisvert, W.A. Macrophages in Cardiac Remodelling after Myocardial Infarction. Nat. Rev. Cardiol. 2023, 20, 373–385. [Google Scholar] [CrossRef]
- Serradell, M.; Díaz-Ricart, M.; Cases, A.; Petriz, J.; Ordinas, A.; Escolar, G. Uraemic medium accelerates proliferation but does not induce apoptosis of endothelial cells in culture. Nephrol. Dial. Transpl. 2003, 18, 1079–1085. [Google Scholar] [CrossRef] [PubMed]
- Serradell, M.; Díaz-Ricart, M.; Cases, A.; Zurbano, M.J.; López-Pedret, J.; Arranz, O.; Ordinas, A.; Escolar, G. Uremic medium causes expression, redistribution and shedding of adhesion molecules in cultured endothelial cells. Haematologica 2002, 87, 1053–1061. [Google Scholar] [PubMed]
- Serradell, M.; Díaz-Ricart, M.; Cases, A.; Zurbano, M.J.; Aznar-Salatti, J.; López-Pedret, J.; Ordinas, A.; Escolar, G. Uremic medium disturbs the hemostatic balance of cultured human endothelial cells. Thromb. Haemost. 2001, 86, 1099–1105. [Google Scholar] [CrossRef] [PubMed]
- Caballo, C.; Palomo, M.; Cases, A.; Galán, A.M.; Molina, P.; Vera, M.; Bosch, X.; Escolar, G.; Diaz-Ricart, M. NF B in the development of endothelial activation and damage in uremia: An in vitro approach. PLoS ONE 2012, 7, e43374. [Google Scholar] [CrossRef]
- Savira, F.; Cao, L.; Wang, I.; Yang, W.; Huang, K.; Hua, Y.; Jucker, B.M.; Willette, R.N.; Huang, L.; Krum, H.; et al. Apoptosis Signal-Regulating Kinase 1 Inhibition Attenuates Cardiac Hypertrophy and Cardiorenal Fibrosis Induced by Uremic Toxins: Implications for Cardiorenal Syndrome. PLoS ONE 2017, 12, e0187459. [Google Scholar] [CrossRef]
- Cardinal, H.; Raymond, M.-A.; Hebert, M.-J.; Madore, F. Uraemic Plasma Decreases the Expression of ABCA1, ABCG1 and Cell-Cycle Genes in Human Coronary Arterial Endothelial Cells. Nephrol. Dial. Transplant. 2006, 22, 409–416. [Google Scholar] [CrossRef]
- Tan, S.; Yang, J.; Hu, S.; Lei, W. Cell-cell interactions in the heart: Advanced cardiac models and omics technologies. Stem Cell Res. Ther. 2024, 15, 362. [Google Scholar] [CrossRef]
- Diaz-Ricart, M.; Torramade-Moix, S.; Pascual, G.; Palomo, M.; Moreno-Castaño, A.B.; Martinez-Sanchez, J.; Vera, M.; Cases, A.; Escolar, G. Endothelial Damage, Inflammation and Immunity in Chronic Kidney Disease. Toxins 2020, 12, 361. [Google Scholar] [CrossRef]
- Hansson, G.K.; Libby, P.; Schönbeck, U.; Yan, Z.-Q. Innate and Adaptive Immunity in the Pathogenesis of Atherosclerosis. Circ. Res. 2002, 91, 281–291. [Google Scholar] [CrossRef]
- Suliman, M.E.; Qureshi, A.R.; Heimbürger, O.; Lindholm, B.; Stenvinkel, P. Soluble Adhesion Molecules in End-Stage Renal Disease: A Predictor of Outcome. Nephrol. Dial. Transplant. 2006, 21, 1603–1610. [Google Scholar] [CrossRef]
- Joshi, S.; Platanias, L.C. Mnk Kinase Pathway: Cellular Functions and Biological Outcomes. World J. Biol. Chem. 2014, 5, 321–333. [Google Scholar] [CrossRef] [PubMed]
- Anfuso, C.D.; Lupo, G.; Romeo, L.; Giurdanella, G.; Motta, C.; Pascale, A.; Tirolo, C.; Marchetti, B.; Alberghina, M. Endothelial Cell-Pericyte Cocultures Induce PLA2 Protein Expression through Activation of PKCα and the MAPK/ERK Cascade. J. Lipid Res. 2007, 48, 782–793. [Google Scholar] [CrossRef] [PubMed]
- Liu, Y. Cellular and Molecular Mechanisms of Renal Fibrosis. Nat. Rev. Nephrol. 2011, 7, 684–696. [Google Scholar] [CrossRef]
- Guijas, C.; Rodríguez, J.P.; Rubio, J.M.; Balboa, M.A.; Balsinde, J. Phospholipase A2 Regulation of Lipid Droplet Formation. Biochim. Biophys. Acta (BBA)—Mol. Cell Biol. Lipids 2014, 1841, 1661–1671. [Google Scholar] [CrossRef] [PubMed]
- Salmeron, K.; Aihara, T.; Redondo-Castro, E.; Pinteaux, E.; Bix, G. IL-1alpha Induces Angiogenesis in Brain Endothelial Cells in Vitro: Implications for Brain Angiogenesis after Acute Injury. J. Neurochem. 2016, 136, 573–580. [Google Scholar] [CrossRef]
- Luheshi, N.M.; Kovács, K.J.; Lopez-Castejon, G.; Brough, D.; Denes, A. Interleukin-1α Expression Precedes IL-1β after Ischemic Brain Injury and Is Localised to Areas of Focal Neuronal Loss and Penumbral Tissues. J. Neuroinflamm. 2011, 8, 186. [Google Scholar] [CrossRef]
- Rebhun, J.F.; Castro, A.F.; Quilliam, L.A. Identification of Guanine Nucleotide Exchange Factors (GEFs) for the Rap1 GTPase. J. Biol. Chem. 2000, 275, 34901–34908. [Google Scholar] [CrossRef]
- Li, G.; Mongillo, M.; Chin, K.-T.; Harding, H.; Ron, D.; Marks, A.R.; Tabas, I. Role of ERO1-α–Mediated Stimulation of Inositol 1,4,5-Triphosphate Receptor Activity in Endoplasmic Reticulum Stress–Induced Apoptosis. J. Cell Biol. 2009, 186, 783–792. [Google Scholar] [CrossRef]
- Álvarez-Aguilar, C.; Lara-Romero, D.; Piñón-Escobedo, J.; Gómez-García, A.; Álvarez-Paredes, A.R. Intima-Media Thickness is Associated with Non-Traditional Risk Factors and Ischemic Heart Disease in Hemodialysis Patients. Letters to the Editor. Ther. Apher. Dial. 2012, 16, 104–108. [Google Scholar] [CrossRef]
- Palomo-Piñón, S.; Mora-Villalpando, C.J.; Del Carmen Prado-Uribe, M.; Ceballos-Reyes, G.M.; De Jesús Ventura-García, M.; Ávila-Díaz, M.; Rodríguez, O.O.; Paniagua-Sierra, J.R. Inflammation and myocardial damage markers influence loss of residual renal function in peritoneal dialysis patients. Arch. Med. Res. 2014, 45, 484–488. [Google Scholar] [CrossRef]
- Lin, W.J.; Hsueh, H.M.; Chen, J.J. Power and sample size estimation in microarray studies. BMC Bioinform. 2010, 11, 48. [Google Scholar] [CrossRef] [PubMed]
- Juarez-Mendez, S.; Zentella-Dehesa, A.; Villegas-Ruiz, V.; Perez-Gonzalez, O.A.; Salcedo, M.; Lopez-Romero, R.; Roman-Basaure, E.; Lazos-Ochoa, M.; Montes de Oca-Fuentes, V.E.; Vazquez-Ortiz, G.; et al. Splice variants of zinc finger protein 695 mRNA associated to ovarian cancer. J. Ovarian Res. 2013, 6, 61. [Google Scholar] [CrossRef] [PubMed]
- Montes-de-Oca-Fuentes, E.V.; Jacome-Lopez, K.; Zarco-Mendoza, A.; Guerrero, G.; Ventura-Gallegos, J.L.; Juarez-Mendez, S.; Cabrera-Quintero, A.J.; Recillas-Targa, F.; Zentella-Dehesa, A. Differential DNA methylation and CTCF binding between the ESR1 promoter a of MCF-7 and MDA-MB-231 breast cancer cells. Mol. Biol. Rep. 2024, 51, 148. [Google Scholar] [CrossRef] [PubMed]
- Kwizera, R.; Akampurira, A.; Kandole, T.K.; Nielsen, K.; Kambugu1, A.; Meya, D.B.; Boulware, D.R.; Rhein, J.; on behalf of the ASTRO-CM Study Team. Evaluation of trypan blue stain in a haemocytometer for rapid detection of cerebrospinal fluid sterility in HIV patients with cryptococcal meningitis. BMC Microbiol. 2017, 17, 182. [Google Scholar] [CrossRef]
- Gentleman, R.C.; Carey, V.J.; Bates, D.M.; Bolstad, B.; Dettling, M.; Dudoit, S.; Ellis, B.; Gautier, L.; Ge, Y.; Gentry, J.; et al. Bioconductor: Open Software Development for Computational Biology and Bioinformatics. Genome Biol. 2004, 5, R80. [Google Scholar] [CrossRef]
- Ritchie, M.E.; Phipson, B.; Wu, D.; Hu, Y.; Law, C.W.; Shi, W.; Smyth, G.K. Limma Powers Differential Expression Analyses for RNA-Sequencing and Microarray Studies. Nucleic Acids Res. 2015, 43, e47. [Google Scholar] [CrossRef]
- Livak, K.J.; Schmittgen, T.D. Analysis of Relative Gene Expression Data Using Real-Time Quantitative PCR and the 2−ΔΔCT Method. Methods 2001, 25, 402–408. [Google Scholar] [CrossRef]


| Characteristic | Description | UWOI Group (n = 3) | UWI Group (n = 3) |
|---|---|---|---|
| Demographic | Age (years) | 66 ± 21 | 66 ± 11 |
| Female/male | 1/2 | 1/2 | |
| Cause of end-stage renal disease (%) | Diabetic nephropathy | 1 (33) | 3 (100) |
| Arterial hypertension | 1 (33) | 3 (100) | |
| Coronary heart disease | 0 (0) | 3 (100) | |
| Other or unknown | 1 (33) | 1 (33) | |
| Comorbidity (%) | Ischemic heart disease | 0 (0) | 3 (100) |
| Myocardial infarction | 0 (0) | 3 (100) | |
| History of hypertension | 3 (100) | 3 (100) | |
| Mellitus diabetes | 3 (100) | 3 (100) | |
| Smoking | 2 (67) | 0 (0) | |
| Familial hyperlipidemia | 1 (33) | 1 (33) | |
| Familial hypercholesterolemia | 1 (33) | 1 (33) | |
| Treatment (%) | Insulin | 0 (0) | 2 (67) |
| Folic acid | 0 (0) | 1 (33) | |
| Complex B | 0 (0) | 2 (67) | |
| Calcitriol | 0 (0) | 1 (33) | |
| Enalapril | 1 (33) | 0 (0) | |
| Losartan | 1 (33) | 1 (33) | |
| Amlodipine | 1 (33) | 0 (0) | |
| Clopidogrel | 0 (0) | 1 (33) | |
| Acetylsalicylic acid | 0 (0) | 1 (33) | |
| Isosorbide | 2 (67) | 1 (33) | |
| Statins | 0 (0) | 1 (33) | |
| Renal replacement therapy | Peritoneal dialysis (%) | 3 (100) | 0 (0) |
| Hemodialysis (2–3 sessions/week) | 0 (0) | 3 (100) | |
| Biochemical parameters (mg/dl) | Glucose | 125 (89–167) | 124 (86–189) |
| Urea | 81 (32–108) | 122 (104–134) | |
| Creatinine | 10.5 (1.1–18) | 10.6 (5.8–16.1) | |
| Cholesterol | 170 (147–192) | 166 (149–192) | |
| Triglycerides | 115 (100–138) | 180 (115–223) | |
| HDL-cholesterol | 43 (28–64) | 29 (27–32) | |
| LDL-cholesterol | 110 (99–126) | 105 (100–112) |
Disclaimer/Publisher’s Note: The statements, opinions and data contained in all publications are solely those of the individual author(s) and contributor(s) and not of MDPI and/or the editor(s). MDPI and/or the editor(s) disclaim responsibility for any injury to people or property resulting from any ideas, methods, instructions or products referred to in the content. |
© 2025 by the authors. Licensee MDPI, Basel, Switzerland. This article is an open access article distributed under the terms and conditions of the Creative Commons Attribution (CC BY) license (https://creativecommons.org/licenses/by/4.0/).
Share and Cite
Rangel-López, A.; Mata-Rocha, M.; Pérez-González, O.A.; López-Romero, R.; López-Sánchez, D.M.; Juárez-Méndez, S.; Villegas-Ruiz, V.; Méndez-Tenorio, A.; Mejía-Araguré, J.M.; Orihuela-Rodríguez, O.; et al. Gene Expression Profile of Cultured Human Coronary Arterial Endothelial Cells Exposed to Serum from Chronic Kidney Disease Patients: Role of MAPK Signaling Pathway. Int. J. Mol. Sci. 2025, 26, 3732. https://doi.org/10.3390/ijms26083732
Rangel-López A, Mata-Rocha M, Pérez-González OA, López-Romero R, López-Sánchez DM, Juárez-Méndez S, Villegas-Ruiz V, Méndez-Tenorio A, Mejía-Araguré JM, Orihuela-Rodríguez O, et al. Gene Expression Profile of Cultured Human Coronary Arterial Endothelial Cells Exposed to Serum from Chronic Kidney Disease Patients: Role of MAPK Signaling Pathway. International Journal of Molecular Sciences. 2025; 26(8):3732. https://doi.org/10.3390/ijms26083732
Chicago/Turabian StyleRangel-López, Angélica, Minerva Mata-Rocha, Oscar Alberto Pérez-González, Ricardo López-Romero, Dulce María López-Sánchez, Sergio Juárez-Méndez, Vanessa Villegas-Ruiz, Alfonso Méndez-Tenorio, Juan Manuel Mejía-Araguré, Oscar Orihuela-Rodríguez, and et al. 2025. "Gene Expression Profile of Cultured Human Coronary Arterial Endothelial Cells Exposed to Serum from Chronic Kidney Disease Patients: Role of MAPK Signaling Pathway" International Journal of Molecular Sciences 26, no. 8: 3732. https://doi.org/10.3390/ijms26083732
APA StyleRangel-López, A., Mata-Rocha, M., Pérez-González, O. A., López-Romero, R., López-Sánchez, D. M., Juárez-Méndez, S., Villegas-Ruiz, V., Méndez-Tenorio, A., Mejía-Araguré, J. M., Orihuela-Rodríguez, O., Álvarez-Aguilar, C., Majluf-Cruz, A., Amato, D., Zavala-Vega, S., Melchor-Doncel de la Torre, S., Paniagua-Sierra, R., & Arellano-Galindo, J. (2025). Gene Expression Profile of Cultured Human Coronary Arterial Endothelial Cells Exposed to Serum from Chronic Kidney Disease Patients: Role of MAPK Signaling Pathway. International Journal of Molecular Sciences, 26(8), 3732. https://doi.org/10.3390/ijms26083732