Abstract
On the basis of the previous models of inductive and steric effects, ‘inductive’ electronegativity and molecular capacitance, a range of new ‘inductive’ QSAR descriptors has been derived. These molecular parameters are easily accessible from electronegativities and covalent radii of the constituent atoms and interatomic distances and can reflect a variety of aspects of intra- and intermolecular interactions. Using 34 ‘inductive’ QSAR descriptors alone we have been able to achieve 93% correct separation of compounds with- and without antibacterial activity (in the set of 657). The elaborated QSAR model based on the Artificial Neural Networks approach has been extensively validated and has confidently assigned antibacterial character to a number of trial antibiotics from the literature.
Introduction.
Nowadays, rational drug design efforts widely rely on building extensive QSAR models which currently represent a substantial part of modern ‘in silico’ research. Due to inability of the fundamental laws of chemistry and physics to directly quantify biological activities of compounds, computational chemists are led to research for simplified but efficient ways of dealing with the phenomenon, such as by the means of molecular descriptors [1]. The QSAR descriptors came to particular demand during last decades when the amounts of chemical information started to grow explosively. Nowadays, scientists routinely work with collections of hundreds of thousands of molecular structures which cannot be efficiently processed without use of diverse sets of QSAR parameters. Modern QSAR science uses a broad range of atomic and molecular properties varying from merely empirical to quantum-chemical. The most commonly used QSAR arsenals can include up to hundreds and even thousands of descriptors readily computable for extensive molecular datasets. Such varieties of available descriptors in combination with numerous powerful statistical and machine learning techniques allow creating effective and sophisticated structure-bioactivity relationships [1,2,3]. Nevertheless, although even the most advanced QSAR models can be great predictive instruments, often they remain purely formal and do not allow interpretation of individual factors influencing activity of drugs [3]. Many molecular descriptors (in particular derived from molecular topology alone) lack defined physical justification. The creation of efficient QSAR descriptors also possessing much defined physical meaning still remains one of the most important tasks for the QSAR research.
In a series of previous works we introduced a number of reactivity indices derived from the Linearity of Free Energy Relationships (LFER) principle [4]. All of these atomic and group parameters could be easily calculated from the fundamental properties of bound atoms and possess much defined physical meaning [5,6,7,8]. It should be noted that, historically, the entire field of the QSAR has been originated by such LFER descriptors as inductive, resonance and steric substituent constants [4]. As the area progressed further, the substituent parameters remained recognized and popular quantitative descriptors making lots of intuitive chemical sense, but their applicability was limited for actual QSAR studies [9]. To overcome this obstacle, we have utilized the extensive experimental sets of inductive and steric substituent constants to build predictive models for inductive and steric effects [5]. The developed mathematical apparatus not only allowed quantification of inductive and steric interactions between any substituent and reaction centre, but also led to a number of important equations such as those for partial atomic charges [8], analogues of chemical hardness-softness [7] and electronegativity [6].
Notably, all of these parameters (also known as ‘inductive’ reactivity indices) have been expressed through the very basic and readily accessible parameters of bound atoms: their electronegativities (χ), covalent radii (R) and intramolecular distances (r). Thus, steric Rs and inductive σ* influence of n - atomic group G on a single atom j can be calculated as:
In those cases when the inductive and steric interactions occur between a given atom j and the rest of N-atomic molecule (as sub-substituent) the summation in (1) and (2) should be taken over N-1 terms. Thus, the group electronegativity of (N-1)-atomic substituent around atom j has been expressed as the following:
Similarly we have defined steric and inductive effects of a singe atom onto a group of atoms (the rest of the molecule):
In the works [7,8] an iterative procedure for calculating a partial charge on j-th atom in a molecule has been developed:
(where Qj reflects the formal charge of atom j).
Initially, the parameter χ in (6) corresponds to χ0 - an absolute, unchanged electronegativity of an atom; as the iterative calculation progresses the equalized electronegativity χ’ gets updated according to (7):
where the local chemical hardness η0 reflects the “resistance” of electronegativity to a change of the atomic charge. The parameters of ‘inductive’ hardness ηi and softness si of a bound atom i have been elaborated as the following:
The corresponding group parameters have been expressed as
The interpretation of the physical meaning of ‘inductive’ indices has been developed by considering a neutral molecule as an electrical capacitor formed by charged atomic spheres [8]. This approximation related inductive chemical softness and hardness of bound atom(s) with the total area of the facings of electrical capacitor formed by the atom(s) and the rest of the molecule.
We have also conducted very extensive validation of ‘inductive’ indices on experimental data. Thus, it has been established that RS steric parameters calculated for common organic substituents form a high quality correlation with Taft’s empirical ES -steric constants (r2=0.985) [10]. The theoretical inductive σ* constants calculated for 427 substituents correlated with the corresponding experimental numbers with coefficient r = 0.990 [5]. The group inductive parameters χ computed by the method (3) have agreed with a number of known electronegativity scales [6]. The inductive charges produced by the iterative procedure (6) have been verified by experimental C-1s Electron Core Binding Energies [8] and dipole moments [6]. A variety of other reactivity and physical-chemical properties of organic, organometallic and free radical substances has been quantified within equations (1)-(11) [11,12,13,14,15,16]. It should be noted, however, that in our previous studies we have always considered different classes of ‘inductive’ indices (substituent constants, charges or electronegativity) in separate contexts and tended to use the canonical LFER methodology of correlation analysis in dealing with the experimental data. At the same time, a rather broad range of methods of computing ‘inductive’ indices has already been developed to the date and it is feasible to use these approaches to derive a new class of QSAR descriptors. In the present work we introduce 50 such QSAR descriptors (we called ‘inductive’) and will test their applicability for building QSAR model of “antibiotic-likeness”.
Results
QSAR models for drug-likeness in general and for antibiotic-likeness in particular are the emerging topics of the ‘in silico’ chemical research. These binary classifiers serve as invaluable tools for automated pre-virtual screening, combinatorial library design and data mining. A variety of QSAR descriptors and techniques has been applied to drug/non-drug classification problem. The latest series of QSAR works report effective separation of bioactive substances from the non-active chemicals by applying the methods of Support Vector Machines (SVM) [17,18], probability-based classification [19], the Artificial Neural Networks (ANN) [20,21,22] and the Bayesian Neural Networks (BNN) [23,24] among others. Several groups used datasets of antibacterial compounds to build the binary classifiers of general antibacterial activity (antibiotic-likeness models) utilizing the ANN algorithm [25,26,27], linear discriminant analysis (LDA) [28,29], binary logistic regression [29] or k-means cluster method [30]. Thus, in the study [31] the LDA has been used to relate anti-malarial activity of a series of chemical compounds to molecular connectivity QSAR indices. The results clearly demonstrate that creation of QSAR approaches for classification of molecules active against broad range of infective agents represents an important and valuable tack for the modern QSAR research.
Dataset
To investigate the possibility of using the inductive QSAR descriptors for creation an effective model of antibiotic-likeness, we have considered a dataset of Vert and co-authors [27] containing the total of 657 structurally heterogeneous compounds including 249 antibiotics and 408 general drugs. This dataset has been used in the previous studies [27,29] and therefore could allow us to comparatively evaluate the performance of QSAR model built upon the inductive descriptors.
Descriptors
50 inductive QSAR descriptors introduced on the basis of formulas (1)-(11) have been described in the greater details in Table 1. Those include various local parameters calculated for certain kinds of bound atoms (for instance for most positively/negatively charges, etc), groups of atoms (say, for substituent with the largest/smallest inductive or steric effect within a molecule, etc) or computed for the entire molecule. One common feature for all of the introduced inductive descriptors is that they all produce a single value per compound. Another similarity between them is in their relation to atomic electronegativity, covalent radii and interatomic distances. It should also be noted, that all descriptors (except the total formal charge) depend on the actual spatial structure of molecules. The choice of particular inductive descriptors in Table 1 was driven by our expectation to have a limited set of QSAR parameters reflecting the greatest variety of different aspects of intra- and intermolecular interactions a molecule can be engaged into. It should be mentioned, however, that some inductive descriptors may reflect related or similar molecular/atomic properties and therefore can be correlated in certain cases (even though the analytical representation of those descriptors does not directly imply their co-linearity). Thus, a special precaution should be taken when using such parameters for QSAR modeling. The procedure of selection of appropriate inductive descriptors has been outlined in the following section.

Table 1.
Inductive QSAR descriptors introduced on the basis of equations (1)-(11).
| Descriptor | Characterization | Parental formula(s) |
|---|---|---|
| χ (electronegativity) – based | ||
| EO_Equalizeda | Iteratively equalized electronegativity of a molecule | Calculated iteratively by (7) where charges get updated according to (6); an atomic hardness in (7) is expressed through (8) |
| Average_EO_Posa | Arithmetic mean of electronegativities of atoms with positive partial charge | where is the number of atoms i in a molecule with positive partial charge |
| Average_EO_Nega | Arithmetic mean of electronegativities of atoms with negative partial charge | where is the number of atoms i in a molecule with negative partial charge |
| η (hardness) – based | ||
| Global_Hardnessa | Molecular hardness - reversed softness of a molecule | (10) |
| Sum_Hardnessa | Sum of hardnesses of atoms of a molecule | Calculated as a sum of inversed atomic softnesses in turn computed within (9) |
| Sum_Pos_Hardnessa | Sum of hardnesses of atoms with positive partial charge | Obtained by summing up the contributions from atoms with positive charge computed by (8) |
| Sum_Neg_Hardnessa | Sum of hardnesses of atoms with negative partial charge | Obtained by summing up the contributions from atoms with negative charge computed by (8) |
| Average_Hardnessa | Arithmetic mean of hardnesses of all atoms of a molecule | Estimated by dividing quantity (10) by the number of atoms in a molecule |
| Average_Pos_Hardness | Arithmetic mean of hardnesses of atoms with positive partial charge | where is the number of atoms i with positive partial charge. |
| Average_Neg_Hardnessa | Arithmetic mean of hardnesses of atoms with negative partial charge | where is the number of atoms i with negative partial charge. |
| Smallest_Pos_Hardnessa | Smallest atomic hardness among values for positively charged atoms | (8) |
| Smallest_Neg_Hardnessa | Smallest atomic hardness among values for negatively charged atoms. | (8) |
| Largest_Pos_Hardness | Largest atomic hardness among values for positively charged atoms | (8) |
| Largest_Neg_Hardness | Largest atomic hardness among values for negatively charged atoms | (8) |
| Hardness_of_Most_Pos | Atomic hardness of an atom with the most positive charge | (8) |
| Hardness_of_Most_Nega | Atomic hardness of an atom with the most negative charge | (8) |
| s (softness) - based | ||
| Global_Softness | Molecular softness – sum of constituent atomic softnesses | (11) |
| Total_Pos_Softnessa | Sum of softnesses of atoms with positive partial charge | Obtained by summing up the contributions from atoms with positive charge computed by (9) |
| Total_Neg_Softnessa | Sum of softnesses of atoms with negative partial charge | Obtained by summing up the contributions from atoms with negative charge computed by (9) |
| Average_Softness | Arithmetic mean of softnesses of all atoms of a molecule | (11) divided by the number of atoms in molecule |
| Average_Pos_Softness | Arithmetic mean of softnesses of atoms with positive partial charge | where is the number of atoms i with positive partial charge. |
| Average_Neg_Softness | Arithmetic mean of softnesses of atoms with negative partial charge | where is the number of atoms i with negative partial charge. |
| Smallest_Pos_Softnessa | Smallest atomic softness among values for positively charged atoms | (9) |
| Smallest_Neg_Softnessa | Smallest atomic softness among values for negatively charged atoms | (9) |
| Largest_Pos_Softness | Largest atomic softness among values for positively charged atoms | (9) |
| Largest_Neg_Softness | Largest atomic softness among values for positively charged atoms | (9) |
| Softness_of_Most_Posa | Atomic softness of an atom with the most positive charge | (9) |
| Softness_of_Most_Nega | Atomic softness of an atom with the most negative charge | (9) |
| q (charge)- based | ||
| Total_Charge | Sum of absolute values of partial charges on all atoms of a molecule | where all the contributions derived within (6) |
| Total_Charge_Formala | Sum of charges on all atoms of a molecule (formal charge of a molecule) | Sum of all contributions (6) |
| Average_Pos_Chargea | Arithmetic mean of positive partial charges on atoms of a molecule | where is the number of atoms i with positive partial charge |
| Average_Neg_Chargea | Arithmetic mean of negative partial charges on atoms of a molecule | where is the number of atoms i with negative partial charge |
| Most_Pos_Chargea | Largest partial charge among values for positively charged atoms | (6) |
| Most_Neg_Charge | Largest partial charge among values for negatively charged atoms | (6) |
| σ* (inductive parameter) – based | ||
| Total_Sigma_mol_ia | Sum of inductive parameters σ*(molecule→atom) for all atoms within a molecule | where contributions are computed by equation (2) with n=N-1 – i.e. each atom j is considered against the rest of the molecule G |
| Total_Abs_Sigma_mol_i | Sum of absolute values of group inductive parameters σ*(molecule→atom) for all atoms within a molecule | |
| Most_Pos_Sigma_mol_ia | Largest positive group inductive parameter σ*(molecule→atom) for atoms in a molecule | (2) |
| Most_Neg_Sigma_mol_ia | Largest (by absolute value) negative group inductive parameter σ*(molecule→atom) for atoms in a molecule | (2) |
| Most_Pos_Sigma_i_mola | Largest positive atomic inductive parameter σ*(atom→molecule) for atoms in a molecule | (5) |
| Most_Neg_Sigma_i_mola | Largest negative atomic inductive parameter σ*(atom→molecule) for atoms in a molecule | (5) |
| Sum_Pos_Sigma_mol_i | Sum of all positive group inductive parameters σ*( molecule →atom) within a molecule | where >0 and is the number of N-1 atomic substituents in a molecule with positive inductive effect (electron acceptors) |
| Sum_Neg_Sigma_mol_ia | Sum of all negative group inductive parameters σ*( molecule →atom) within a molecule | where <0 and is the number of N-1 atomic substituents in a molecule with negative inductive effect (electron donors) |
| Rs (steric parameter) – based | ||
| Largest_Rs_mol_ia | Largest value of steric influence Rs(molecule→atom) in a molecule | (1) where n=N-1 - each atom j is considered against the rest of the molecule G |
| Smallest_Rs_mol_ia | Smallest value of group steric influence Rs(molecule→atom) in a molecule | (1) where n=N-1 - each atom j is considered against the rest of the molecule G |
| Largest_Rs_i_mol | Largest value of atomic steric influence Rs(atom→molecule) in a molecule | (4) |
| Smallest_Rs_i_mola | Smallest value of atomic steric influence Rs(atom→molecule) in a molecule | (4) |
| Most_Pos_Rs_mol_ia | Steric influence Rs(molecule→atom) ON the most positively charged atom in a molecule | (1) |
| Most_Neg_Rs_mol_ia | Steric influence Rs(molecule→atom) ON the most negatively charged atom in a molecule | (1) |
| Most_Pos_Rs_i_mol | Steric influence Rs(atom→molecule) OF the most positively charged atom to the rest of a molecule | (4) |
| Most_Neg_Rs_i_mola | Steric influence Rs(atom→molecule) OF the most negatively charged atom to the rest of a molecule | (4) |
a – descriptors selected for building the antibiotic-likeness QSAR model.
Selection of variables
To build a binary QSAR model enabling effective separation of antibacterials we have initially calculated all 50 individual inductive descriptors for each molecule from the Vert’s dataset. We have used the hydrogen suppressed representation of the molecular structures – i.e. only the heavy atoms have been taken into account. The inductive QSAR descriptors have been calculated within the MOE package [32] from values of atomic electronegativities and radii taken from our previous publications [5]. To avoid the mentioned cross-correlation among the independent variables we have computed pair wise regressions between all 50 sets of the QSAR parameters and removed those inductive descriptors which formed any linear dependence with R≥0.9. As the result of this procedure, only 34 inductive QSAR descriptors have been selected for the further processing (see the legend to Table 1). The average values of these 34 parameters independently calculated for antibacterial and non- antibacterial compounds have been plotted onto Figure 1. As it can be seen, the corresponding curves for two classes of compounds are clearly separated on the graph and, hence, the selected 34 inductive descriptors should allow building an effective QSAR model of “antibiotic likeness”.
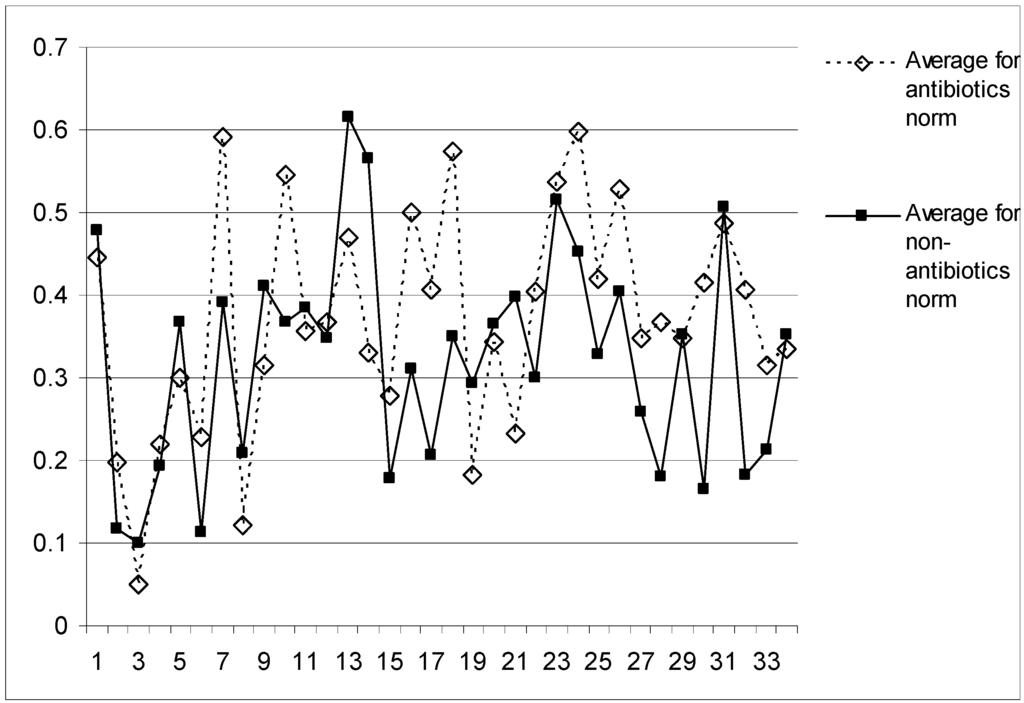
Figure 1.
Averaged values of 34 selected inductive QSAR descriptors calculated independently within studied sets of antibiotics (dashed line) and non-antibiotics (solid line).
Figure 1.
Averaged values of 34 selected inductive QSAR descriptors calculated independently within studied sets of antibiotics (dashed line) and non-antibiotics (solid line).

QSAR model
In order to relate the inductive descriptors to antibiotic activity of the studied molecules we have employed the Artificial Neural Networks (ANN) method – one of the most effective pattern recognition techniques. During the last decades the machine-learning approaches have became an essential part of the QSAR research; the detailed description of the ANN’s fundamentals can be found in numerous sources [33 for example].
In our study we have used the standard back-propagation ANN configuration consisting of 34 input and 1 output nodes. The number of nodes in the hidden layer was varied from 2 to 14 in order to find the optimal network that allows most accurate separation of antibacterials from other compounds in the training sets. For effective training of the ANN (to avoid its over fitting) we have used the training sets of 592 compounds (including 197 antibiotics) randomly derived as 90 percent of the total of 657 molecules. In each training run the remaining 10 percents of the compounds were used as the testing set to assess the predictive ability of the model. It should be noted, that we the condition of non-correlation amongst the descriptors has been monitored within the training and the testing sets of compounds as well.
During the learning phase, a value of 1 has been assigned to the training set’s molecules possessing antibacterial activity and value 0 to the others. For each configuration of the ANN (with 2, 3, 4, 6, 8, 10, 12, and 14 hidden nodes respectively) we have conducted 20 independent training runs to evaluate the average predictive power of the network. Table 2 contains the resulting values of specificity, sensitivity and accuracy of separation of antibacterial and non-antibacterial compounds in the testing sets. The corresponding counts of the false/true positive- and negative predictions have been estimated using 0.4 and 0.6 cut-off values for non-antibacterials and antibacterials respectively. Thus, an antibiotic compound from the testing set, has been considered correctly classified by the ANN only when its output value ranged from 0.6 to 1.0. For each non-antibiotic entry of the testing set the correct classification has been assumed if the corresponding ANN output lay between 0 and 0.4. Thus, all network output values ranging from 0.4 to 0.6 have been ultimately considered as incorrect predictions (rather than undetermined or non-defined).
Table 2.
Parameters of specificity, sensitivity, accuracy and positive predictive values for prediction of antibiotic and non-antibiotic compounds by the artificial neural networks with the varying number of hidden nodes. The cut-off values 0.4 and 0.6 have been used for negative and positive predictions respectively.
| Hidden nodes | Specificity | Sensitivity | Accuracy | PPV |
|---|---|---|---|---|
| 2 | 0.8 | 0.92 | 0.846 | 0.751 |
| 3 | 0.926 | 0.928 | 0.923 | 0.884 |
| 4 | 0.925 | 0.92 | 0.923 | 0.884 |
| 6 | 0.9 | 1 | 0.938 | 0.862 |
| 8 | 0.9 | 0.92 | 0.907 | 0.851 |
| 10 | 0.9 | 0.92 | 0.907 | 0.851 |
| 12 | 0.9 | 0.92 | 0.907 | 0.851 |
| 14 | 0.815 | 1 | 0.923 | 0.833 |
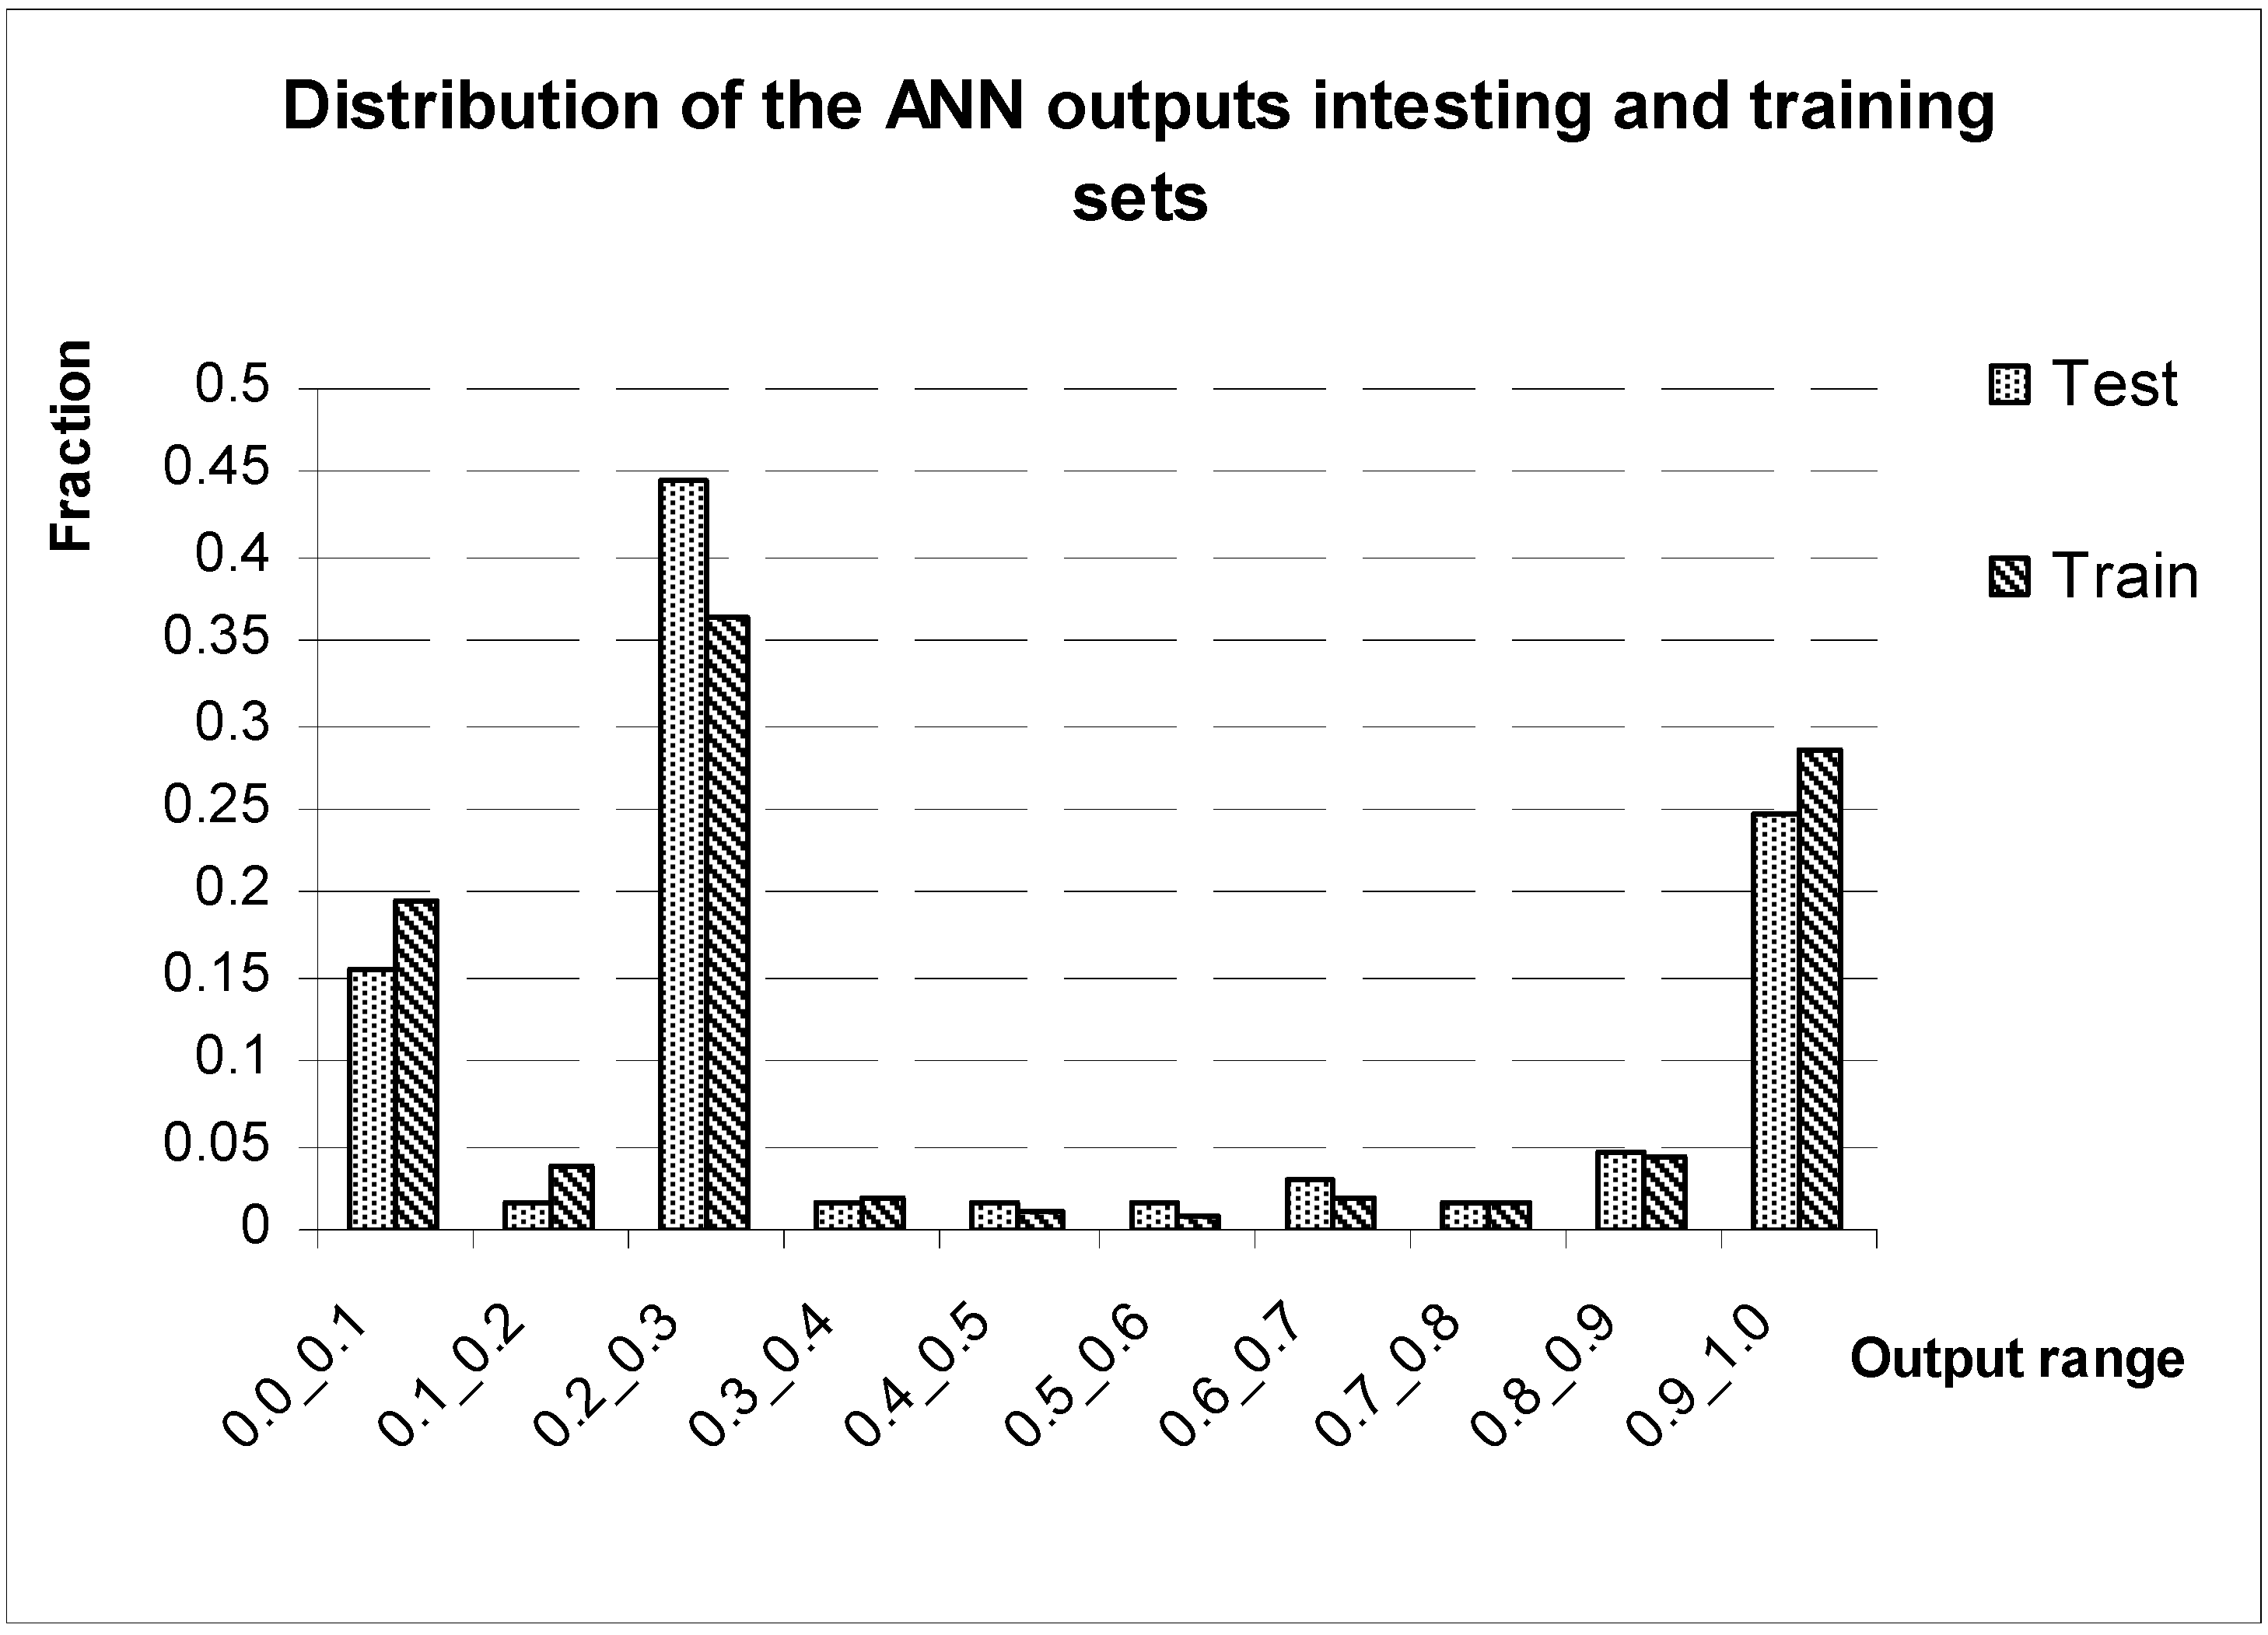
Considering that one of the most important implications for the “antibiotic-likeness” model is its potential use for identification of novel antibiotic candidates from electronic databases, we have calculated the parameters of the Positive Predictive Values (PPV) for the networks while varying the number of hidden nodes. Taking into account the PPV values for the networks with the varying number of the hidden nodes along with the corresponding values of sensitivity, specificity and general accuracy we have selected neural network with three hidden nodes as the most efficient among the studied. The ANN with 34 input-, 3 hidden- and 1 output nodes has allowed the recognition of 93% of antibiotic and 93% of non-antibiotic compounds, on average. The output from this 34-3-1 network has also demonstrated very good separation on positive (antibiotics) and negative (non-antibiotics) predictions. Figure 2 features frequencies of the output values for the training and testing sets consisting of ⅓ of antibiotic and ⅔ of non-antibiotics compounds. As it can readily be seen from the graph, the vast majority of the predictions has been contained within [0.0°0.4] and [0.6°1.0] ranges what also illustrates that 0.4 and 0.6 cut-offs values provide very adequate separation of two bioactivity classes (Table 3 and Table 4 feature the outputs values from the 34-3-1 ANN for the training and testing sets respectively).

Figure 2.
Distribution of the output values from the ANN with three nodes in the hidden layer and trained on the set containing 90% of the studied compounds
Figure 2.
Distribution of the output values from the ANN with three nodes in the hidden layer and trained on the set containing 90% of the studied compounds
It should be mentioned, that the estimated 93% accuracy of the prediction by the 34-3-1 ANN is similar or superior to the results by several similar ‘antibiotic-likeness’ studies where the overall cross—validated accuracy can range from 78 [20] to 98% [26] depending of the QSAR methodology, size of antibiotics/non-antibiotics dataset, cross-correlation technique and statistics utilized.
We have also applied the developed techniques on the non-hydrogen suppressed molecular structures. The estimated accuracy of antibiotic/non-antibiotic classification was very close to the results for the hydrogen suppressed molecules. In contrast, the time for the calculation of the inductive QSAR descriptors in the former case is much shorter as the total number of all atoms nearly doubles.
Discussion
The accuracy of discrimination of antibiotic compounds by the artificial neural networks built upon the ‘inductive’ descriptors clearly demonstrates an adequacy and good predictive power of the developed QSAR model. There is strong evidence, that the introduced inductive descriptors do adequately reflect the structural properties of chemicals, which are relevant for their antibacterial activity. This observation is not surprising considering that the inductive QSAR descriptors calculated within (1)–(11) should cover a very broad range of proprieties of bound atoms and molecules related to their size, polarizability, electronegativity, compactness, mutual inductive and steric influence and distribution of electronic density, etc. The results of the study demonstrate that not extensive sets of inductive QSAR descriptors having much defined physical meaning can be sufficient for creating useful models of “antibiotic-likeness”. The accuracy of the developed QSAR model is superior or similar compared to other binary classifiers on the same set of molecules but using much more extensive collections of QSAR descriptors [27,29].
Presumably, accuracy of the approach operating by the inductive descriptors can be improved even further by expanding the QSAR descriptors or by applying more powerful classification techniques such as Support Vector Machines or Bayesian Neural Networks. Use of merely statistical techniques in conjunction with the inductive QSAR descriptors would also be beneficial, as they will allow interpreting individual descriptor contributions into molecular “antibiotic-likeness”. The selection of drugs used for the simulation can also be extended and/or refined. For instance, it has been experimentally confirmed that several non-antibacterial compounds from Vert’s dataset can, in fact, possess definite antibacterial activity. Thus, anti-inflammatory drugs diclofenac [34,35], piroxicam, mefenamic acid and naproxen [35], antihistamines – bromodiphenhydramine [36] diphenhydramine [36] and triprolidine [37], anti-psychotics – chlorpromazine [38,39] and fluphenazine [40,41], the tranquilizer promazine [42] and anti-hypertensive methyldopa [43] all exhibit moderate to powerful potential against microbes. It is obvious, that having all these compounds as the negative control can interfere with the training of efficient antibiotic-likeness model. We, however, did not remove these substances from the e training and testing sets for the sake of comparison of our results with the previous data. Nonetheless, despite the certain drawbacks, it is obvious that the developed ANN-based QSAR model operating by the inductive descriptors has demonstrated very high accuracy and can be used for mining electronic collections of chemical structures for novel antibiotic candidates.
An application of the model
We have decided to test the developed model of “antibiotic-likeness” on the series of early-stage antibiotic compounds featured in the free issue of the Drug Data Report – a journal presenting preliminary drug research results appearing for the first time in patent literature [44]. The “experimental” antibiotic compounds cited by the issue included one penicillin- and two cephalosporin- derivatives as well as a number of high molecular weight chemicals with complex spatial structures such as five C11-carbamate azalides and four eremomycin carboxamides (the corresponding structural formulas are presented on Figure 3).
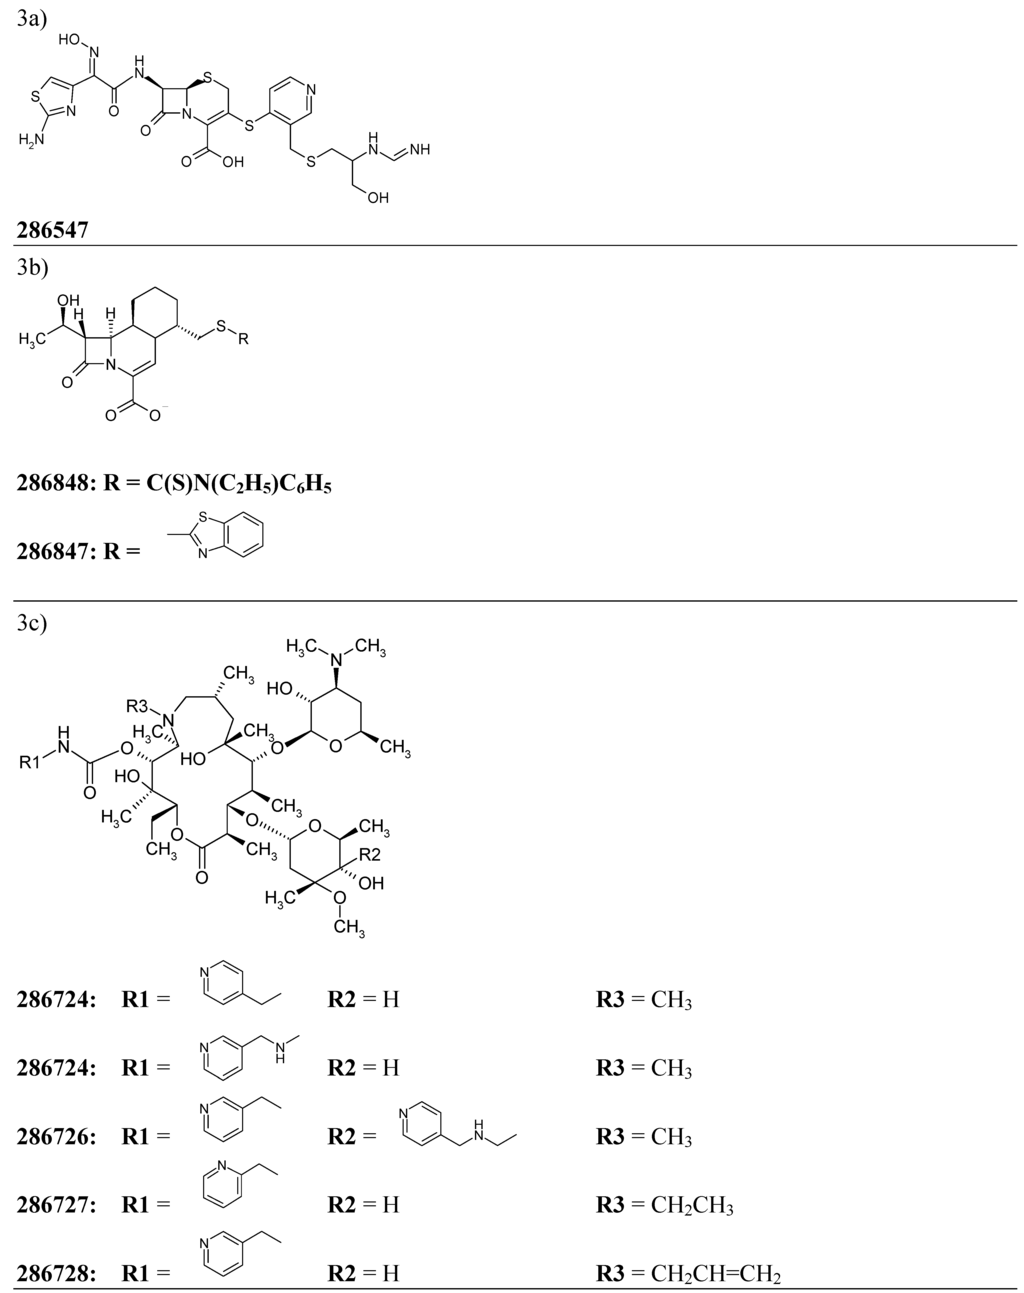
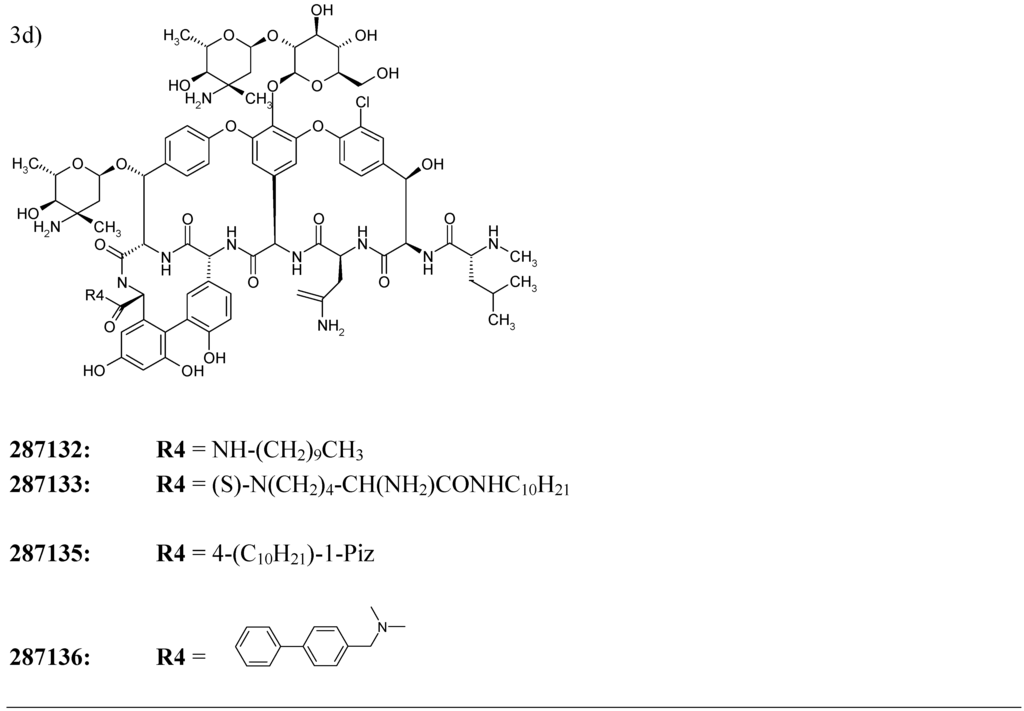
Figure 3.
Chemical structures of twelve early stage antibiotics from the Drug Data Report used for validation for the developed ANN – based QSAR model.
Figure 3.
Chemical structures of twelve early stage antibiotics from the Drug Data Report used for validation for the developed ANN – based QSAR model.

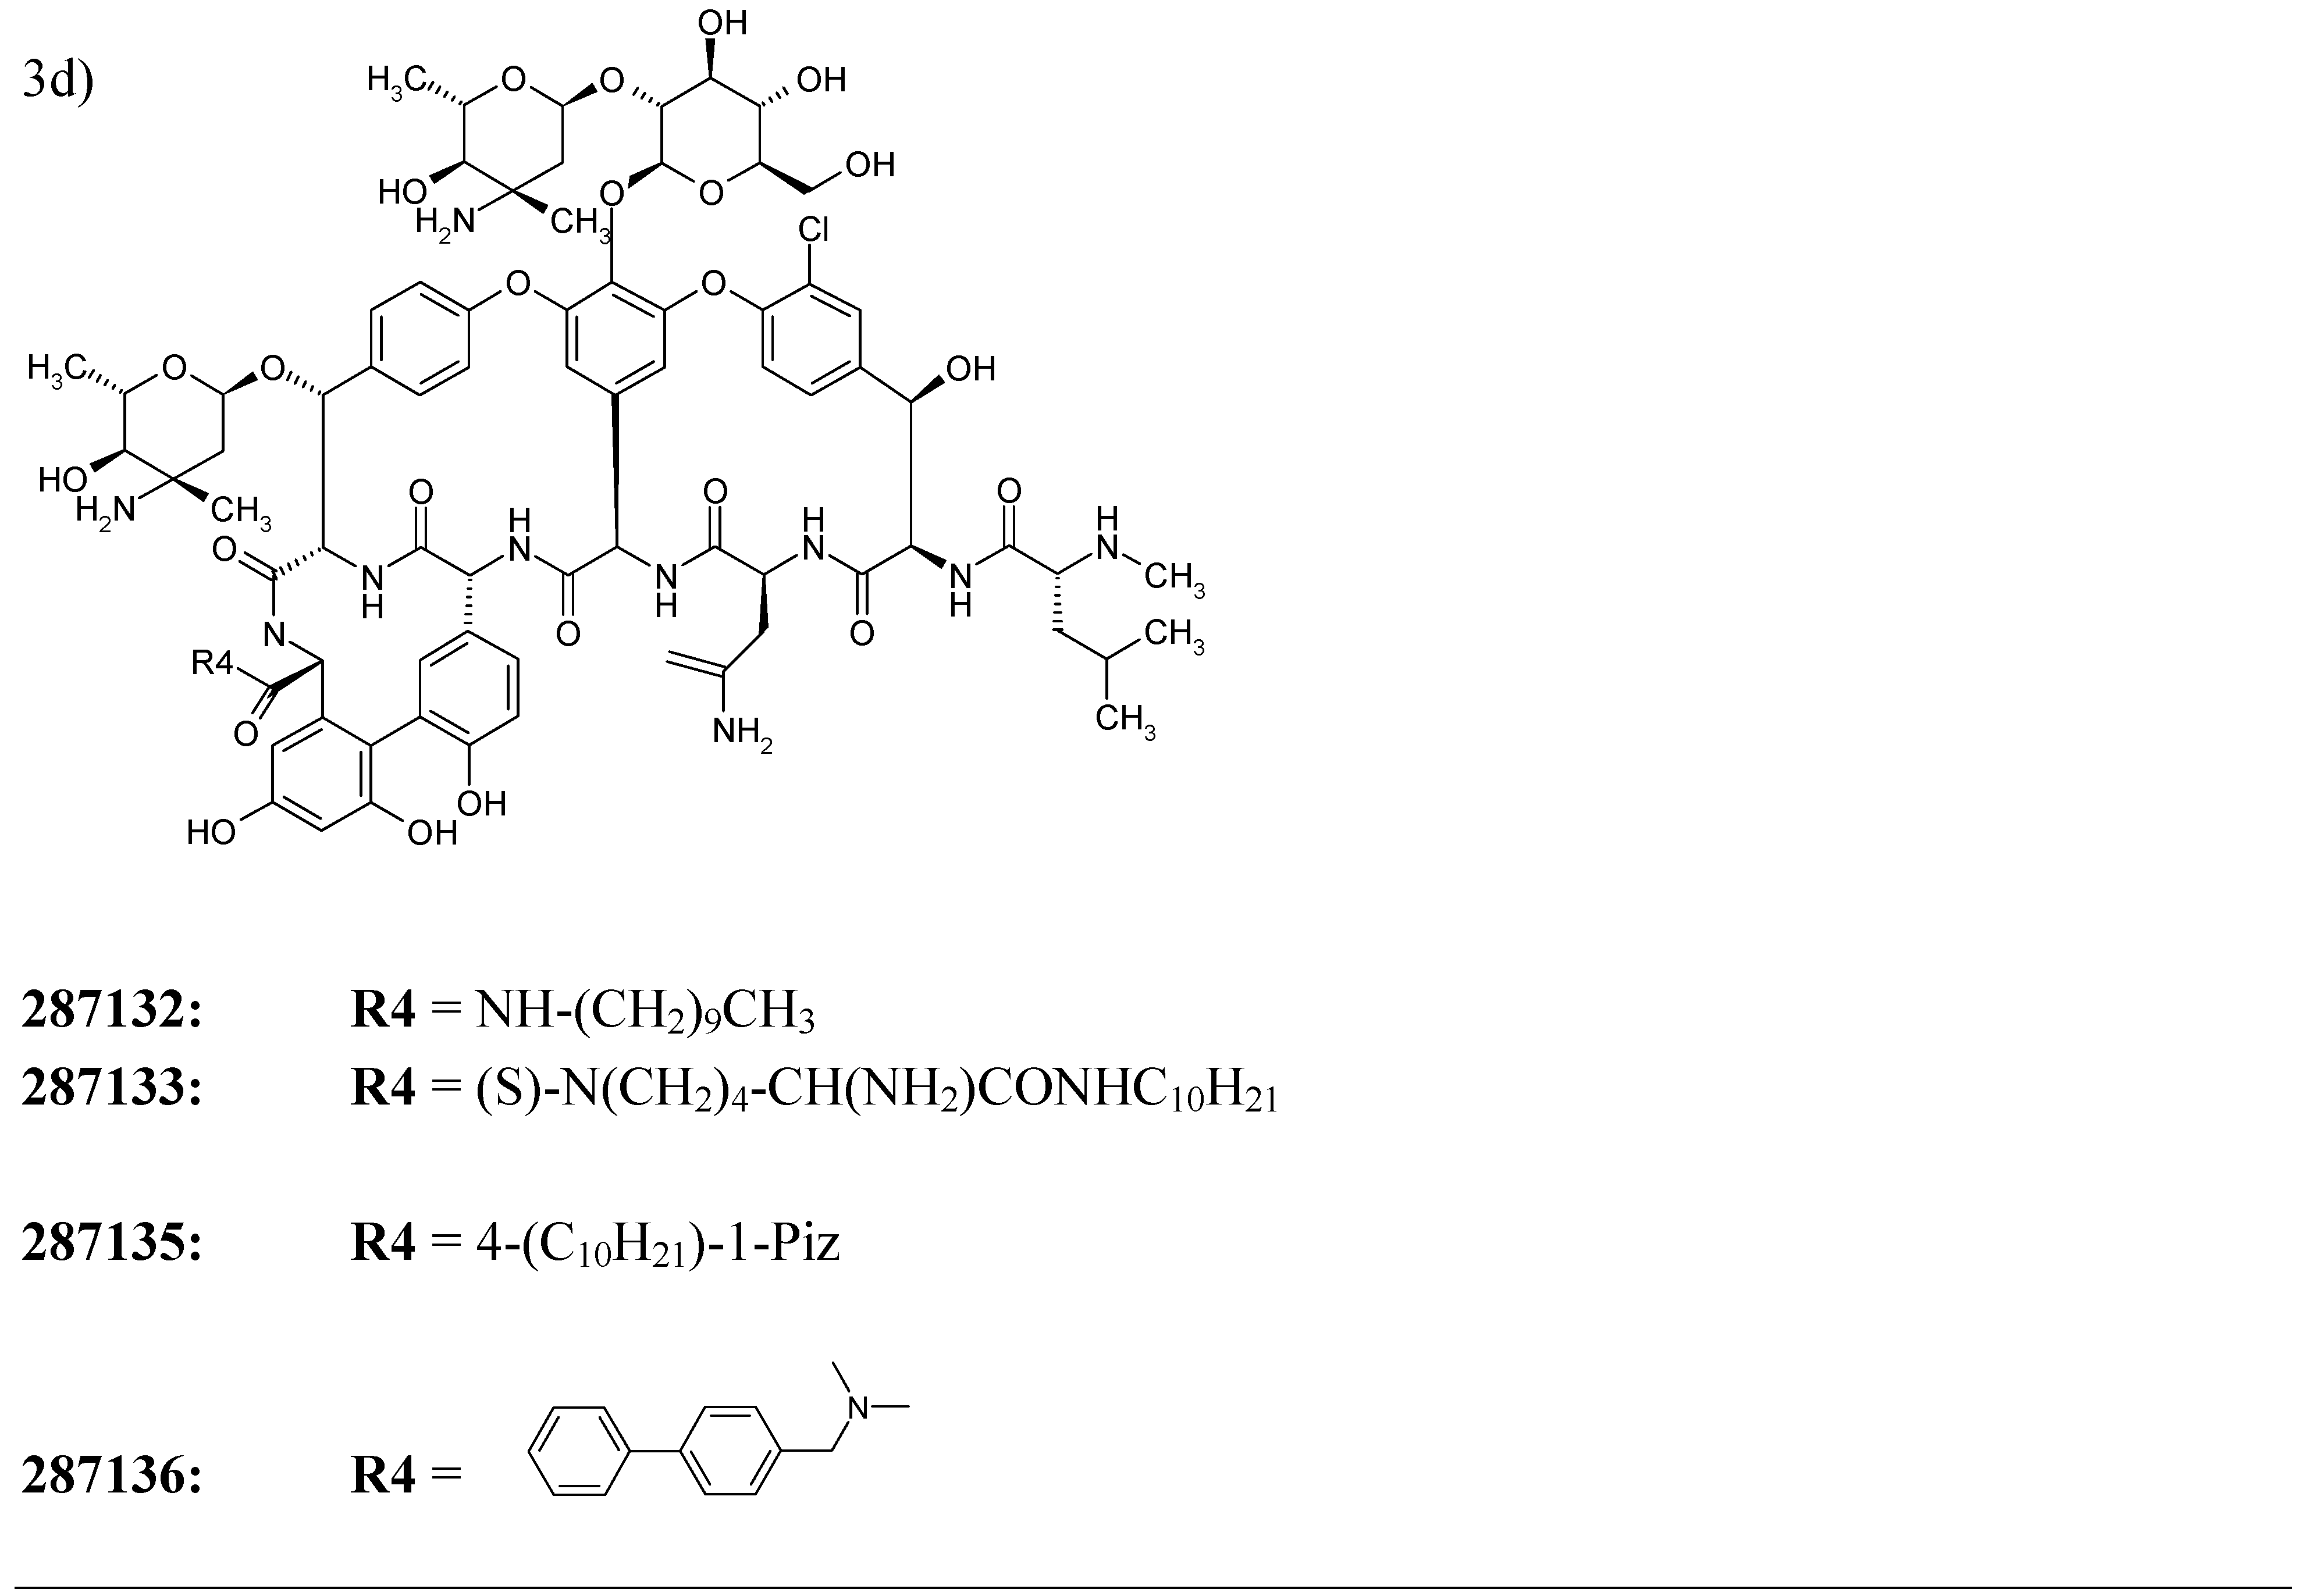
For each of 12 compounds from the validation set we have calculated 34 inductive descriptors used earlier. The normalized patterns of the independent variables have then been passed through 34-3-1 network with its node–associated weights pre-assigned during the training. The ANN has produced the output parameters presented in Table 5. As it can be seen from the data, all of the estimated output values score well above 0.60 threshold what confidently assigns all of the trial molecules to the class of antibiotics.
Table 3.
Compounds of the training set and output values from the trained neural network with three hidden nodes.
| Name | Output | Name | Output | |
|---|---|---|---|---|
| antibiotics | apicycline | 0.975 | ||
| 4'-(methylsulfamoyl)sulfanilanilide | 0.973 | apramycin | 0.980 | |
| 4'-formylsuccinanilic acid thiosemicarbazone | azidocillin | 0.979 | ||
| 0.259 | arbekacin | 0.980 | ||
| 4-sulfanilamidosalicylic acid | 0.938 | aspoxicillin | 0.975 | |
| acediasulfone | 0.828 | azidamfenicol | 0.966 | |
| acetyl sulfamethoxypyrazine | 0.855 | azlocillin | 0.850 | |
| acetyl sulfisoxazole | 0.964 | aztreonam | 0.981 | |
| amidinocillin | 0.702 | bacampicillin | 0.982 | |
| amidinocillin pivoxil | 0.938 | benzylpenicillinic acid | 0.924 | |
| amifloxacin | 0.881 | benzylsulfamide | 0.733 | |
| amikacin | 0.984 | biapenem | 0.830 | |
| apalcillin | 0.981 | brodimoprim | 0.585 | |
| butirosin | 0.984 | cephalothin | 0.977 | |
| carbenicillin | 0.974 | cephapirin sodium | 0.984 | |
| carfecillin sodium | 0.970 | cephradine | 0.897 | |
| carindacillin(a,e,f,i) | 0.938 | chloramphenicol | 0.606 | |
| carumonam | 0.985 | chloramphenicol palmitate | 0.604 | |
| cefaclor | 0.860 | chloramphenicol pantothenate | 0.983 | |
| cefadroxil | 0.915 | chlortetracycline | 0.984 | |
| cefamandole | 0.964 | cinoxacin | 0.770 | |
| cefatrizine | 0.973 | clinafloxacin | 0.920 | |
| cefazedone | 0.984 | clindamycin | 0.926 | |
| cefazolin | 0.979 | clometocillin | 0.953 | |
| cefbuperazone | 0.984 | clomocycline | 0.982 | |
| cefcapene pivoxil | 0.983 | cloxacillin | 0.935 | |
| cefclidin(a,i,j) | 0.985 | cyclacillin | 0.960 | |
| cefdinir(e,i) | 0.984 | dibekacin | 0.952 | |
| cefditoren | 0.984 | dichloramine | 0.253 | |
| cefepime | 0.982 | dicloxacillin | 0.983 | |
| cefetamet | 0.983 | difloxacin | 0.835 | |
| cefixime | 0.984 | diphenicillin sodium | 0.767 | |
| cefmenoxime | 0.984 | doxycycline | 0.981 | |
| cefmetazole | 0.984 | enoxacin | 0.915 | |
| cefminox | 0.985 | enrofloxacin | 0.630 | |
| cefodizime | 0.985 | epicillin | 0.963 | |
| cefonicid | 0.984 | fenbenicillin | 0.967 | |
| ceforanide | 0.974 | fleroxacin | 0.980 | |
| cefotiam | 0.985 | flomoxef | 0.985 | |
| cefoxitin | 0.984 | florfenicol | 0.955 | |
| cefozopran | 0.982 | floxacillin | 0.983 | |
| cefpimizole | 0.985 | fortimicin a | 0.978 | |
| cefpiramide | 0.985 | fortimicin b | 0.700 | |
| cefpirome | 0.984 | furaltadone | 0.901 | |
| cefpodoxime proxetil | 0.985 | gentamicin c1 | 0.850 | |
| cefprozil | 0.902 | gentamicin c2 | 0.940 | |
| cefroxadine | 0.970 | gentamicin c3 | 0.956 | |
| cefsulodin | 0.982 | grepafloxacin | 0.862 | |
| ceftazidime | 0.984 | guamecycline | 0.977 | |
| cefteram | 0.979 | imipenem | 0.577 | |
| ceftezole | 0.984 | isepamicin | 0.985 | |
| ceftizoxime | 0.984 | kanamycin a | 0.962 | |
| cefuroxime | 0.980 | kanamycin b | 0.976 | |
| cefuzonam | 0.985 | kanamycin c | 0.971 | |
| cephacetrile sodium | 0.982 | lenampicillin | 0.985 | |
| cephalexin | 0.847 | lincomycin | 0.907 | |
| cephaloglycin | 0.951 | lomefloxacin | 0.946 | |
| cephaloridine | 0.960 | loracarbef | 0.862 | |
| cephalosporin c | 0.976 | lymecycline | 0.978 | |
| meclocycline | 0.984 | propicillin | 0.814 | |
| meropenem | 0.977 | quinacillin | 0.984 | |
| methacycline | 0.983 | ribostamycin | 0.965 | |
| methicillin sodium | 0.951 | rifamide | 0.979 | |
| mezlocillin | 0.976 | rifamycin sv | 0.984 | |
| micronomicin | 0.966 | rifaximin | 0.984 | |
| miloxacin | 0.786 | ritipenem | 0.977 | |
| moxalactam | 0.984 | rolitetracycline | 0.979 | |
| n2-formylsulfisomidine | 0.919 | rosoxacin | 0.265 | |
| n4-sulfanilylsulfanilamide | 0.980 | rufloxacin | 0.975 | |
| nadifloxacin | 0.658 | salazosulfadimidine | 0.970 | |
| nafcillin sodium | 0.919 | sancycline | 0.980 | |
| nalidixic acid | 0.268 | sisomicin | 0.909 | |
| neomycin a(c,i,j) | 0.983 | sparfloxacin | 0.975 | |
| neomycin b(a,d,h,i) | 0.981 | spectinomycin | 0.628 | |
| netilmicin | 0.938 | succinylsulfathiazole | 0.977 | |
| nifuradene | 0.600 | sulbenicillin | 0.884 | |
| nifuratel | 0.980 | sulfabenzamide | 0.895 | |
| nifurfoline | 0.963 | sulfacetamide | 0.955 | |
| nifurprazine | 0.267 | sulfachlorpyridazine | 0.915 | |
| nifurtoinol | 0.694 | sulfachrysoidine | 0.975 | |
| nitrofurantoin | 0.291 | sulfacytine | 0.971 | |
| norfloxacin | 0.523 | sulfadiazine | 0.937 | |
| N-sulfanilyl-3,4-xylamide | 0.956 | sulfadicramide | 0.933 | |
| ofloxacin | 0.972 | sulfadimethoxine | 0.958 | |
| oxytetracycline | 0.984 | sulfadoxine | 0.965 | |
| panipenem | 0.939 | sulfaethidole | 0.918 | |
| paromomycin | 0.984 | sulfaguanidine | 0.904 | |
| pasiniazide | 0.236 | sulfaguanol | 0.943 | |
| pazufloxacin | 0.926 | sulfalene | 0.938 | |
| pefloxacin | 0.563 | sulfaloxic acid | 0.857 | |
| penamecillin | 0.636 | sulfamethazine | 0.912 | |
| penethamate hydriodide | 0.704 | sulfamethizole | 0.759 | |
| penicillin G potassium | 0.848 | sulfamethomidine | 0.940 | |
| penicillin N | 0.901 | sulfamethoxazole | 0.908 | |
| penicillin O | 0.978 | sulfamethoxypyridazine | 0.912 | |
| penicillin V | 0.912 | sulfamidochrysoidine | 0.952 | |
| phenethicillin potassium | 0.822 | sulfamoxole | 0.954 | |
| phthalylsulfathiazole | 0.976 | sulfanilamide | 0.653 | |
| pipacycline | 0.921 | sulfanilic acid | 0.841 | |
| pipemidic acid | 0.882 | sulfanilylurea | 0.938 | |
| piperacillin | 0.982 | sulfaphenazole | 0.929 | |
| piromidic acid | 0.696 | sulfaproxyline | 0.957 | |
| pivampicillin | 0.916 | sulfapyrazine | 0.934 | |
| pivcefalexin | 0.946 | sulfathiazole | 0.873 | |
| p-nitrosulfathiazole | 0.893 | sulfathiourea | 0.849 | |
| sulfisomidine | 0.909 | bamipine | 0.036 | |
| sulfisoxazole | 0.963 | biclofibrate | 0.247 | |
| sultamicillin | 0.983 | befunolol | 0.252 | |
| talampicillin | 0.911 | benfluorex | 0.258 | |
| temocillin | 0.985 | benorylate | 0.259 | |
| tetracycline | 0.983 | benserazide | 0.259 | |
| tetroxoprim | 0.837 | benzitramide | 0.259 | |
| thiamphenicol | 0.942 | benzotropine mesylate | 0.000 | |
| ticarcillin | 0.983 | benzpiperylon | 0.000 | |
| tigemonam | 0.985 | benzydamine | 0.000 | |
| trimethoprim | 0.739 | bermoprofen | 0.257 | |
| trospectomycin | 0.850 | betaxolol | 0.174 | |
| trovafloxacin(b) | 0.960 | bevantolol | 0.154 | |
| non-antibiotics | bevonium methyl sulfate | 0.032 | ||
| 2-amino-4-picoline | 0.258 | bezafibrate | 0.256 | |
| 5-bromosalicylic acid acetate | 0.258 | binifibrate | 0.319 | |
| 5-nitro-2propoxyacetanilide | 0.280 | bisoprolol | 0.184 | |
| acecarbromal | 0.259 | bitolterol | 0.004 | |
| aceclofenac | 0.431 | bucloxic acid | 0.258 | |
| acefylline(c,d,e,g) | 0.841 | bopindolol | 0.001 | |
| acetaminophen(b,i) | 0.258 | bromfenac | 0.258 | |
| acetanilide | 0.258 | bromisovalum | 0.258 | |
| acetazolamide | 0.023 | bromodiphenhydramine | 0.057 | |
| acetophenazine | 0.265 | brompheniramine | 0.006 | |
| acetylsalicylic acid | 0.258 | bucetin | 0.247 | |
| acrivastine | 0.260 | bucolome | 0.253 | |
| ahistan | 0.000 | bucumolol | 0.256 | |
| albuterol | 0.258 | bufetolol | 0.157 | |
| alclofenac | 0.258 | bufexamac | 0.258 | |
| alminoprofen | 0.256 | bufuralol | 0.008 | |
| alphaprodine | 0.106 | bumadizon | 0.205 | |
| alprenolol | 0.239 | bunitrolol | 0.258 | |
| aminochlorthenoxazin | 0.257 | butabarbital | 0.258 | |
| aminopyrine | 0.000 | butaclamol | 0.123 | |
| amosulalol | 0.078 | butallylonal | 0.262 | |
| amtolmetin guacil | 0.001 | butanilicaine | 0.206 | |
| anileridine | 0.262 | butibufen | 0.255 | |
| antipyrine | 0.017 | butidrine hydrochloride | 0.183 | |
| antrafenine | 0.283 | butoctamide | 0.252 | |
| apazone | 0.001 | butofilolol | 0.256 | |
| apronalide | 0.258 | caffeine | 0.159 | |
| arotinolol | 0.293 | capuride | 0.257 | |
| atenolol | 0.258 | carazolol | 0.027 | |
| atropine | 0.258 | carbamazepine | 0.015 | |
| bambuterol | 0.032 | carbidopa | 0.259 | |
| bamifylline | 0.290 | carbinoxamine | 0.066 | |
| carbiphene | 0.258 | diethylbromoacetamide | 0.257 | |
| carbocloral | 0.313 | difenamizole | 0.006 | |
| carbromal | 0.257 | difenpiramide | 0.009 | |
| carbuterol | 0.258 | diflunisal | 0.258 | |
| carfimate | 0.258 | dilevalol | 0.255 | |
| carphenazine | 0.263 | dioxadrol | 0.000 | |
| carprofen | 0.258 | dipyrocetyl | 0.315 | |
| carsalam | 0.258 | dipyrone | 0.041 | |
| carteolol | 0.259 | disulfiram | 0.001 | |
| carvedilol | 0.000 | doxefazepam | 0.270 | |
| celiprolol | 0.211 | doxofylline | 0.629 | |
| cetamolol | 0.245 | doxylamine(b,f,g,i) | 0.000 | |
| cetirizine | 0.261 | droperidol | 0.259 | |
| chlorhexadol | 0.288 | droxicam | 0.022 | |
| chlorobutanol | 0.258 | dyphylline | 0.410 | |
| chloropyramine | 0.050 | ectylurea | 0.244 | |
| chlorothen | 0.070 | embramine | 0.122 | |
| chlorpheniramine | 0.095 | emorfazone | 0.010 | |
| chlorprothixene | 0.017 | enfenamic acid | 0.256 | |
| chlorthenoxacin | enprofylline | 0.246 | ||
| (chlorthenoxazine) | 0.258 | epanolol | 0.258 | |
| chlorcyclizine | 0.078 | ephedrine | 0.229 | |
| cinchophen | 0.251 | epirizole | 0.002 | |
| cinmetacin | 0.248 | eprozinol | 0.237 | |
| cinnarizine | 0.388 | estazolam | 0.000 | |
| cinromida | 0.197 | etafedrine | 0.179 | |
| ciprofibrate | 0.251 | etamiphyllin | 0.118 | |
| clemastine | 0.039 | etaqualone | 0.000 | |
| clenbuterol | 0.234 | eterobarb | 0.001 | |
| clidanac | 0.258 | etersalate | 0.260 | |
| clinofibrate | 0.282 | ethenzamide | 0.243 | |
| clofibric acid | 0.256 | ethinamate | 0.258 | |
| clometacin | 0.292 | ethoheptazine | 0.000 | |
| clometiazol | 0.255 | ethoxazene | 0.248 | |
| clonixin | 0.254 | etodolac | 0.259 | |
| clopirac | 0.257 | etofibrate | 0.260 | |
| cloranolol | 0.247 | etofylline | 0.266 | |
| clordesmetildiazepam | 0.257 | etomidate | 0.000 | |
| clorprenaline | 0.249 | etymemazine | 0.002 | |
| clothiapine | 0.003 | felbinac | 0.258 | |
| clozapine | 0.051 | fenadiazole | 0.230 | |
| codeine | 0.062 | fenbufen | 0.258 | |
| cropropamide | 0.002 | fenclofenac | 0.259 | |
| crotethamide | 0.035 | fenethazine | 0.000 | |
| deserpidine | 0.005 | fenofibrate | 0.254 | |
| diclofenac | 0.262 | fenoprofen | 0.258 | |
| fenoterol | 0.258 | lornoxicam | 0.031 | |
| fentanyl | 0.066 | loxapina | 0.004 | |
| fentiazac | 0.259 | loxoprofen | 0.258 | |
| floctafenine | 0.266 | mazindol(i) | 0.162 | |
| flufenamic acid | 0.259 | meclofenamic acid(f) | 0.276 | |
| fluoresone | 0.459 | mecloqualone | 0.000 | |
| fluphenazine | 0.260 | medibazine | 0.004 | |
| flupirtine | 0.260 | medrylamine | 0.001 | |
| fluproquazone | 0.258 | meparfynol | 0.258 | |
| flurazepam | 0.010 | mepindolol | 0.211 | |
| flurbiprofen | 0.258 | meprobamate | 0.259 | |
| fluspirilene | 0.259 | mequitazine | 0.001 | |
| flutropium bromide | 0.259 | methafurylene | 0.000 | |
| formoterol | 0.259 | methaphenilene | 0.000 | |
| fosazepam | 0.258 | methotrimeprazine | 0.002 | |
| fusaric acid | 0.258 | methoxyphenamine | 0.000 | |
| gemfibrozil | 0.248 | methyldopa | 0.258 | |
| gentisic acid | 0.258 | methyltyrosine | 0.256 | |
| glafenine | 0.259 | methyprylon | 0.232 | |
| glucametacin | 0.335 | metiapine | 0.002 | |
| glutethimide | 0.258 | metipranolol | 0.258 | |
| haloperidide | 0.259 | metofoline | 0.094 | |
| haloperidol | 0.258 | metoprolol | 0.179 | |
| hexapropymate | 0.258 | metron | 0.275 | |
| hexobarbital | 0.274 | mexiletine | 0.251 | |
| hexoprenaline | 0.258 | mofezolac | 0.340 | |
| histapyrrodine | 0.004 | molindone | 0.000 | |
| hydroxyethylpromethazine | moperone | 0.259 | ||
| (N-Hydroxyethylpromethazine) | 0.261 | moprolol | 0.213 | |
| hydroxyzine | 0.261 | morazone | 0.000 | |
| ibufenac | 0.258 | morphine | 0.289 | |
| ibuprofen | 0.258 | moxastine | 0.000 | |
| ibuproxam | 0.258 | nadoxolol | 0.258 | |
| indenolol | 0.179 | naproxen | 0.256 | |
| indomethacin | 0.323 | narcobarbital | 0.265 | |
| ipratropium bromide | 0.259 | nefopam | 0.000 | |
| isoetharine | 0.258 | niceritrol | 0.981 | |
| isofezolac | 0.183 | nicoclonate | 0.095 | |
| isonixin | 0.125 | nicofibrate | 0.214 | |
| isopromethazine | 0.000 | nifenalol | 0.256 | |
| isoxicam | 0.003 | nifenazone | 0.000 | |
| ketoprofen | 0.250 | niflumic acid | 0.260 | |
| ketorolac | 0.259 | nimetazepam | 0.512 | |
| labetalol | 0.252 | nipradilol | 0.611 | |
| lefetamine | 0.068 | nitrazepam | 0.337 | |
| lorazepam | 0.268 | nordiazepam | 0.254 | |
| novonal | 0.255 | propyphenazone | 0.000 | |
| octopamine | 0.258 | protokylol | 0.260 | |
| orphenadrine | 0.000 | proxibarbital | 0.262 | |
| oxaceprol | 0.259 | proxyphylline | 0.210 | |
| oxametacine | 0.284 | pyrilamine | 0.000 | |
| oxanamide | 0.254 | pyrrobutamine | 0.000 | |
| oxaprozin | 0.259 | quazepam | 0.331 | |
| oxitropium bromide | 0.265 | ramifenazone | 0.000 | |
| oxprenolol | 0.221 | reproterol | 0.296 | |
| oxypertine | 0.000 | rimiterol | 0.258 | |
| paramethadione | 0.258 | ronifibrate | 0.259 | |
| parsalmide | 0.259 | salacetamide | 0.258 | |
| p-bromoacetanilide | 0.258 | salicylamide | 0.257 | |
| pemoline | 0.258 | salicylamide O-acetic acid | 0.258 | |
| penbutolol | 0.099 | salsalate | 0.258 | |
| penfluridol | 0.259 | salverine | 0.000 | |
| perisoxal | 0.034 | scopolamine | 0.278 | |
| perphenazine | 0.284 | secobarbital | 0.257 | |
| phenacemide | 0.258 | setastine | 0.035 | |
| phenacetin | 0.247 | simetride | 0.028 | |
| phenoperidine | 0.191 | simfibrate | 0.259 | |
| phenopyrazone | 0.243 | simvastatin | 0.355 | |
| phenylbutazone | 0.000 | sotalol | 0.013 | |
| phenyltoloxamine(a,c,g) | 0.000 | soterenol | 0.099 | |
| pindolol | 0.055 | sulfinalol | 0.062 | |
| pipebuzone | 0.001 | sulpiride | 0.017 | |
| piperacetazine | 0.261 | suprofen | 0.258 | |
| piperidione | 0.253 | talastine | 0.000 | |
| piperylone | 0.000 | talinolol | 0.245 | |
| pirbuterol | 0.259 | talniflumate | 0.399 | |
| pirifibrate(g,h) | 0.258 | temazepam | 0.207 | |
| piroxicam | 0.013 | tenoxicam | 0.008 | |
| pirprofen | 0.258 | terbutaline | 0.258 | |
| p-lactophenetide | 0.257 | tertatolol | 0.129 | |
| p-methyldiphenhydramine | 0.000 | tetrabarbital | 0.257 | |
| pravastatin | 0.438 | thenaldine | 0.000 | |
| prazepam | 0.008 | thenyldiamine | 0.000 | |
| primidone | 0.133 | theobromine | 0.251 | |
| probucol | 0.000 | theofibrate(b,f,i) | 0.435 | |
| procaterol | 0.260 | theophylline(f,h,i,j) | 0.224 | |
| proglumetacin | 0.292 | thioridazine | 0.003 | |
| prolintane | 0.024 | thiothixene | 0.003 | |
| promazine | 0.000 | thonzylamine | 0.001 | |
| pronethalol | 0.237 | tiaprofenic acid | 0.258 | |
| propanolol | 0.067 | timolol | 0.030 | |
| toliprolol | 0.127 | tripelennamine | 0.000 | |
| tolmetin | 0.254 | triprolidine | 0.000 | |
| tolpropamine | 0.001 | tulobuterol | 0.169 | |
| tretoquinol | 0.418 | viminol | 0.028 | |
| triazolam | 0.003 | vinylbital | 0.258 | |
| triclofos | 0.276 | xenbucin | 0.256 | |
| trifluoperazine | 0.298 | xibenolol | 0.148 | |
| trifluperidol | 0.259 | zolamine | 0.035 | |
| trimethadione | 0.258 | zomepirac | 0.263 | |
| triparanol | 0.248 | |||
Table 4.
Compounds of the testing set and the corresponding output values from the trained neural network with three hidden nodes.
| Name | Output | Name | Output | |
|---|---|---|---|---|
| antibiotics | butacetin | 0.147 | ||
| amoxicillin | 0.152 | chlorpromazine | 0.169 | |
| ampicillin | 0.728 | ciramadol | 0.150 | |
| cefoperazone | 0.997 | clocinizine | 0.125 | |
| cefotaxime | 0.999 | clofibrate | 0.142 | |
| cefotetan | 0.568 | diazepam | 0.997 | |
| cefteram | 0.999 | diphenhydramine | 0.125 | |
| ceftriaxone | 0.999 | diphenylpyraline | 0.101 | |
| ciprofloxacin | 0.999 | esmolol | 0.151 | |
| demeclocycline | 0.999 | ethclorvinol | 0.047 | |
| flumequine | 0.998 | feprazone | 0.118 | |
| hetacillin | 0.992 | flunitrazepam | 0.069 | |
| mafenide | 0.999 | fosfosal | 0.134 | |
| metampicillin | 0.978 | indoprofen | 0.287 | |
| minocycline | 0.984 | isoproterenol | 0.151 | |
| nifurpirinol | 0.998 | levobunolol | 0.150 | |
| noprylsulfamide | 0.998 | lovastatin | 0.151 | |
| oxacillin | 0.999 | mabuterol | 0.149 | |
| oxolinic acid | 0.991 | mefenamic acid | 0.097 | |
| sulfamerazine | 0.999 | mefexamide | 0.000 | |
| sulfametrole | 0.999 | meperidine | 0.146 | |
| sulfanitran | 0.998 | mephobarbital | 0.160 | |
| sulfaperine | 0.997 | methapyrilene | 0.000 | |
| temafloxacin | 0.987 | nadolol | 0.151 | |
| thiazolsulfone | 0.994 | pheniramine | 0.134 | |
| tobramycin | 0.994 | phenocoll | 0.000 | |
| tosufloxacin | 0.995 | phenyramidol | 0.000 | |
| non-antibiotics | pimozide | 0.029 | ||
| acetaminosalol | 0.110 | practolol | 0.152 | |
| acetobutolol | 0.150 | proheptazine | 0.149 | |
| aminopropylon | 0.000 | propacetamol | 0.166 | |
| benoxaprofen | 0.150 | sulindac | 0.975 | |
| brotizolam | 0.004 | talbutal | 0.063 | |
| bupranolol | 0.144 | |||
Table 5.
Output values from the neural network for the validation set’s antibiotics.
| Compound | Structural formula | Prediction |
|---|---|---|
| 286547 | 3a | 0.984 |
| 286724 | 3c | 0.985 |
| 286725 | 3c | 0.985 |
| 286726 | 3c | 0.985 |
| 286727 | 3c | 0.985 |
| 286728 | 3c | 0.985 |
| 286847 | 3b | 0.915 |
| 286848 | 3b | 0.914 |
| 287132 | 3d | 0.985 |
| 287133 | 3d | 0.985 |
| 287135 | 3d | 0.985 |
| 287136 | 3d | 0.985 |
These results demonstrate that the developed ANN-based binary classifier of antibacterial activity is adequate and can be considered an effective tool for ‘in silico’ antibiotics discovery. The results also demonstrate that the inductive parameters readily accessible by formulas (1)-(11) from atomic electronegativities, covalent radii and interatomic distances can produce a variety of useful QSAR descriptors to be used ‘in silico’ chemical research.
Conclusions
The results of the present work demonstrate that a variety of atomic, substituent and molecular properties which can be computed within the framework of our previous models for inductive and steric effects, inductive electronegativity and molecular capacitance represent a powerful arsenal of 3D QSAR descriptors for modern ‘in silico’ drug research. Using only 34 inductive descriptors with no additional independent parameters we have achieved 93% correct classification of compounds with- and without antibacterial activity. The introduced inductive descriptors possess a number of important merits: they are 3D- and stereo- sensitive, can be easily computed from fundamental properties of bound atoms and molecules and possess much defined physical meaning. The developed ANN-based model for antibiotic-likeness prediction can be used as a powerful QSAR tool for filtering through the collections of chemical structures to discover novel antibiotic leads.
Methods
The names of the chemical compounds from the dataset from [27] have been translated into SMILES records and MOL files using the ChemIDPlus online service [45] and the MOE package [32]. 50 inductive descriptors have been calculated using by the SVL scripts – a specialized language of the MOE package. The interatomic distances have been calculated by the MOE from the molecular structures optimized with the MMFF94 force-field [46]. The atomic types have been assigned according to the name, valent state and a formal charge of atoms as it is defined within the MOE. The parameters of the corresponding atomic electronegativities and covalent radii have been taken from our works [5,8]. The inductive QSAR descriptors used in the study have been normalized into the range [0.0°1.0] and the non-overlapping training and testing sets have been randomly drawn by the customized Java scripts. The training and testing of the neural networks has been conducted using the Stuttgart Neural Network Simulator [47]. The training was performed through the feed-forward back-propagation algorithm with the weight decay and pattern shuffling. The values of initial rates were randomly assigned in a range [0.0°1.0], the learning rate has been set to 0.8 with the threshold 0.10.
References
- Kubinyi, H.; Folkers, G.; Martin, Y.C. (Eds.) 3D QSAR in Drug Design; Kluwer: Dordrecht, 2002.
- Truhlar, D.G.; Howe, W.J.; Hopfinger, A.J. (Eds.) Rational Drug Design; Springer: Berlin, 1999.
- Karelson, M. Molecular Descriptors in QSAR/QSPR; Wiley: New York, 2000; p. 448. [Google Scholar]
- Exner, O. Correlation Analysis of Chemical Data; Kluwer: Dordrecht, 1988. [Google Scholar]
- Cherkasov, A.R.; Galkin, V.I.; Cherkasov, R.A. J. Phys. Org. Chem. 1998, 11, 437. [CrossRef]
- Cherkasov, A.R.; Galkin, V.I.; Cherkasov, R.A. J. Molec. Struct. (Theochem) 1999, 489, 43. [CrossRef]
- Cherkasov, A.R.; Galkin, V.I.; Cherkasov, R.A. J. Molec. Struct. (Theochem) 2000, 497, 115. [CrossRef]
- Cherkasov, A. J. Chem. Inf. Comp. Sci. 2003, 43, 2039. [CrossRef]
- Babij, C.; Poe, A.J. J. Phys. Org. Chem. 2004, 17, 162.
- Galkin, V.I.; Sayakhov, R.D.; Cherkasov, R.A. Russ. Chem. Rev. 1991, 60, 1617.
- Cherkasov, A.; Jonsson, M. J. Chem. Inf. Comp. Sci. 1998, 38, 1151. [CrossRef]
- Cherkasov, A.; Jonsson, M. J. Chem. Inf. Comp. Sci. 1999, 39, 1057. [CrossRef]
- Cherkasov, A.R.; Jonsson, M.; Galkin, V.I. J. Mol. Graph. Model. 1999, 17, 28. [CrossRef]
- Cherkasov, A.; Jonsson, M. J. Chem. Inf. Comp. Sci. 2000, 40, 1222. [CrossRef]
- Cherkasov, A.; Sprous, D.; Chen, R. J. Phys. Chem. A. 2003, 107, 9695.
- Galkin, V.I.; Cherkasov, A.R.; Cherkasov, R.A. Phosphorus, Silicon, Sulphur 1999, 146, 329.
- Byvalov, E.; Fechner, U.; Sadowski, J.; Schneider, G. J. Chem. Inf. Comp. Sci. 2003, 43, 1882. [CrossRef]
- Zernov, V.; Balakin, K.V.; Ivaschenko, A.A.; Savchuk, N.P.; Pletnev, I.V. J. Chem. Inf. Comp. Sci. 2003, 43, 2048. [CrossRef]
- Anzali, S.; Barenickel, G.; Cezanne, B.; Krug, M.; Filimonov, D.; Poroikob, V. J. Med. Chem. 2001, 44, 2432. [CrossRef]
- Murcia-Soler, M.; Perez-Gimenez, F.; Garcia-March, F.J.; Salabert-Salvador, M.T.; Diaz-Villanueva, W.; Castro-Bleda, M.J. J. Chem. Inf. Comp. Sci. 2003, 43, 1688. [CrossRef]
- Frimurer, T.M.; Bywater, R.; Naerum, L.; Lauritsen, L.N.; Brunak, S. J. Chem. Inf. Comp. Sci. 2000, 40, 1315. [CrossRef]
- Sadowski, J.; Kubinyi, H. J. Med. Chem. 1998, 41, 3325. [CrossRef]
- Galvez, J.; de Julian-Ortiz, J.V.; Garcia-Domenech, R. J. Mol. Graph. Model. 2001, 20, 84. [CrossRef]
- Ajay, A.; Walters, W.P.; Murcko, M.A. J. Med. Chem. 1998, 41, 3314. [CrossRef]
- Jaen-Oltra, J.; Salabert-Salvador, M.T.; Garcia-March, F.J.; Perez-Gimenez, F.; Tomas-Vert, F. J. Med. Chem. 2000, 43, 1143. [CrossRef] [PubMed]
- Garcia-Domenech, R.; de Julian-Ortiz, J.V. J. Chem. Inf. Comp. Sci. 1998, 38, 445. [CrossRef]
- Tomas-Vert, F.; Perez-Gimenez, F.; Salabert-Salvador, M.T.; Garcia-March, F.J.; Jaen-Oltra, J. J. Molec. Struct. (Theochem). 2000, 504, 249. [CrossRef]
- Mishra, R.K.; Garcia-Domenech, R.; Galvez, J. J. Chem. Inf. Comp. Sci. 2001, 41, 387. [CrossRef]
- Cronin, M.T.D.; Aptula, A.O.; Dearden, J.C.; Duffy, J.C.; Netzeva, T.I.; Patel, H.; Rowe, P.H.; Schultz, T.W.; Worth, A.P.; Voutzoulidis, K.; Schuurmann, G. J. Chem. Inf. Comp. Sci. 2002, 42, 869. [CrossRef]
- Molina, E.; Diaz, H.G.; Gonzalez, M.P.; Rodriguez, E.; Uriarte, E. J. Chem. Inf. Comp. Sci. 2004, 44, 515. [CrossRef]
- Gozalbez, R.; Galvez, J.; Moreno, A.; Garcia-Domenech, R. J. Pharm. Pharmacol. 1999, 51, 111. [CrossRef]
- Molecular Operational Environment; Chemical Computation Group Inc.: Montreal, Canada, 2004.
- Zupan, J.; Gasteiger, J. Neural Networks in Chemistry and Drug Design, 2nd Ed. ed; Wiley: New York, 1999. [Google Scholar]
- Dastidar, S.D.; Ganguly, K.; Chaudhuri, K.; Chakrabarty, A.N. Int. J. Antimicrob. Agents 2000, 14, 249.
- Annadurai, S.; Basu, S.; Ray, S.; Dastidar, S.D.; Chakrabarty, A.N. Indian J. Exp. Biol. 1998, 36, 86.
- Dastidar, S.D.; Saha, P.K.; Sanymat, B.; Chakrabarty, A.N. J. Appl. Bact. 1976, 42, 209. [CrossRef]
- Dastidar, S.D.; Jairaj, J.; Mookerjee, M.; Chakrabarty, A.N. Acta Microbiol. Immun. Hung. 1997, 44, 241.
- Molnar, J.; Mandi, Y.; Kiraly, J. Acta Microbiol. Immun. Hung. 1976, 23, 45.
- Kristiansen, J.E. Acta Path. Microbioil. Scand. Sect. B. 1979, 87, 317.
- Kristiansen, J.E.; Mortensen, I. Pramocol. Toxicol. 1987, 60, 100.
- Dastidar, S.D.; Chaudhuri, K.; Annadurai, S.; Ray, S.; Mookerjee, M.; Chakrabarty, A.N. J. Chemother. 1995, 7, 201. [CrossRef]
- Dash, S.K.; Dastidar, S.D.; Chaudhuri, K. Ind. J. Exp. Biol. 1977, 15, 324.
- Dastidar, S.D.; Mondal, U.; Niyogi, S.; Chakrabarty, A.N. Ind. J. Med. Res. 1986, 84, 142.
- Drug Data Report 2000, 22, 530.
- ChemIDPlus database:. http://chem.sis.nlm.nih.gov/chemidplus/.
- Halgren, T.A. J. Comp. Chem. 1996, 17, 490. [CrossRef]
- SNNS: Stuttgart Neural Network Simulator, Version 4.0; University of Stuttgart: Stuttgart, 1995.
© 2005 by MDPI (http://www.mdpi.org). Reproduction is permitted for noncommercial purposes.