Abstract
This study investigated the spatial variation in the components of a microbial food web (viruses, picoplankton, nanoflagellates, and ciliates) in different hydrographic environments in the Taiwan Strait during winter. Water temperature and salinity varied spatially, with lower temperatures (15.3–22.8 °C) and salinities (32.2–33.4 psu) in the northern part of the Taiwan Strait, largely affected by runoff from the coast of China. Concentrations of nutrients and Chl a were significantly higher in the northern part than that in the southern part of the study area. Synechococcus spp., nanoflagellate, and ciliate abundance also varied significantly, with the northern strait having higher abundances of these communities. In contrast, a higher abundance of bacteria was found in the southern part of the Taiwan Strait. The results of this study, which describes two different ecosystems in the Taiwan Strait, suggest that during winter, a “viral loop” might play an important role in controlling bacterial production in the southern part of the Taiwan Strait, while nanofalgellate grazing of picophytoplankton may contribute mainly to the flux of energy in the northern part.
1. Introduction
The microbial community, which consists of bacteria, nanoflagellates, and microzooplankton, plays an important role in the life of aquatic environments [1]. An understanding of the relationship between the distributions of microbial organisms and their environments can help us better understand their eco-physiological requirements. Bacteria are able to use dissolved organic matter and incorporate it into their own biomass. Their biomass may be reduced in several ways, with the important one being grazing by phagotrophic protists (nano- and microzooplankton) and viral lysis [2,3,4,5]. These studies showed that both viral lysis and grazing can cause significant mortality, but that the impact of each varies by season, host organism, and environmental conditions. Seasonally, viral lysis is reported to be the main cause of bacterial mortality during the winter, and thus a “viral loop” might serve as an important control mechanism for bacterial production in colder seasons, while grazing can be the cause of most bacterial mortality during warmer seasons [5].
The growth of bacteria can also be controlled by physical factors, such as temperature and the supply of substrates [6,7,8]. Li [9] reported that their regulation can be seasonal and suggested that, over the course of a year, temperature is the dominant factor affecting bacterial growth in colder seasons. Other factors, such as substrate supply, may be important in warmer seasons. Ochs et al. [10] found that bacterial growth rates are unrelated to temperatures above 14 °C, which was further confirmed by Shiah and Ducklow [11].
Understanding the principles that govern trophic interactions among microbial planktonic organisms, those that regulate carbon and energy flows in microbial food webs, is an important goal in biological oceanography. The dominating predators of bacteria are heterotrophic nanoflagellates (HNFs) [3,12,13]. Some studies reported increases in HNFs in areas where there are increases in bacteria, suggesting that HNFs are resource controlled [12,14]. Other studies have found a weak coupling between bacteria and HNF density and recommended predation control [15,16]. Although correlative data can suggest possible governing factors, such data do not provide much insight into the complex mechanisms involved. For example, the lack of a strong relationship between HNFs and bacterial abundance might be related to the possibility that HNFs use other sources of carbon (e.g., picophytoplanktonic cyanobacteria) [13], or it may be that there are other more important predators of bacteria (e.g., ciliates) [17]. Other studies suggested that bottom-up control dominates HNF abundance [18,19], while other studies noted that top-down control is more important [16,20]. In addition, the relative importance of these controls may change along with the environmental trophic state, season, and other environmental factors [21,22].
Taiwan is located at the junction of Ryukyu and Luzon in the northwestern part of the Pacific Ocean. This large island country is bordered to the west by the shallow Taiwan Strait and to the east by the deep Philippine Sea. The broad (140 to 200 km) Taiwan Strait Shelf is located between the coasts of China and Taiwan and extends for more than 300 km. Generally, currents in the Taiwan region vary consistently from season to season [23]. Jan et al. [24] described the seasonal variations in currents in the Taiwan Strait in detail. During winter, the northward flow of South China Sea waters through the Penghu Channel is slowed down by the northeasterly winter monsoon and turns northwestward along the southern edge of the Changyun Ridge. In the northern area of the Taiwan Strait, the cold and fresh southward flow of China’s coastal waters turn cyclonically at the northern edge of the Changyun Ridge, where they form a cyclonic cold eddy. These winter differences in physicochemical and biotic factors in the shallow Taiwan Strait may set the scene for differences in the development of microorganisms and provide an excellent environmental frame to analyze the potential changes in microbial food web components under very different trophic environments. We hypothesize that the spatial variation in temperature affects the microbial dynamics in the shallow Taiwan Strait in cold seasons. Therefore, this study investigated the surface water distributions of viral, heterotrophic bacterial, Synechococcus spp., nanoflagellate, and ciliate abundance, as well as possible HNF-bacterial coupling along different cruise transects in the Taiwan Strait during winter.
2. Material and Methods
2.1. Study Sites and Samplings
Samples were collected in January and February 2018 from the surface waters at 25 established stations (9 transects; A–I) located in the Taiwan Strait on board the Fishery Researcher I (Figure 1A). During this cruise, seawater samples were collected at depths of 2 m using a SeaBird CTD (Sea-Bird Scientific, Bellevue, WA, USA) and General Oceanic Rosette assembly with 10 L Niskin bottle (General Oceanic, Florida, USA) Temperature and salinity were measured with a SeaBird CTD. Water samples were filtered (25 mm GF/F: Whatman glass microfiber filters) for Chl a analysis and measured after extraction using an in vitro fluorometer (Turner Design 10-AU-005) (Turner Designs, Inc, San Jose, CA, USA) [25]. Nutrients in seawater samples were measured as previously described by Gong et al. [25]. Sample volumes of 50 mL were used to count bacteria, Synechococcus spp., and nanoflagellates. They were fixed with gluteraldehyde at a final concentration of 0.5%. For ciliates, 500 mL water samples from the surface were fixed with neutralized formaldehyde (2% final concentration) [26] and preserved at 4 °C until analysis. Virus populations were identified and measured using flow cytometry (FCM) (BD FACSCaliburTM) (Biosciences, Macquarie Research Park, Sydney, Australia) [27].
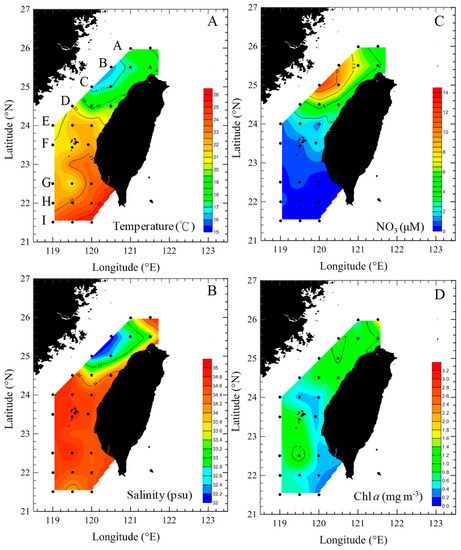
Figure 1.
Spatial variations of temperature (A), salinity (B), NO3 (C), and Chl a concentrations (D) during the study period in the Taiwan Strait.
2.2. Microbial Counts
Bacteria, Synechococcus spp., and nanoflagellates were counted using an epifluorescence microscope (Nikon Optiphot-2) (1000×). Subsamples of 1–2 mL, 4 mL, and 20 mL were filtered onto 0.2 μm or 0.8 μm black Nuclepore filters for bacteria, Synechococcus spp., and nanoflagellates, respectively. Samples were stained with DAPI (4′,6-diamidino-2-phenylindole) at a final concentration of 1 μg mL−1 [28] to count bacteria and heterotrophic nanoflagellates (HNFs). Pigmented nanoflagellates (PNFs) and HNFs were detected and counted based on the absence or presence of chlorophyll autofluorescence using a separate filter set optimized for chlorophyll or DAPI under a 1000× epifluorescence microscope (Nikon Optiphot-2). Bacteria and HNFs were identified using their blue fluorescence under UV illumination. Synechococcus spp. and PNFs were identified using their orange and red autofluorescences under blue excitation light. Furthermore, to obtain reliable ciliate counts, a 500-mL water sample was concentrated into a 100-mL subsample using a 20-μm mesh size net, and then the subsamples (100 mL) were allowed to settle in an Utermöhl chamber (Utermöhl). The entire area of the Utermöhl chamber was examined at 200× or 400× magnification using an inverted microscope (Nikon-TMD 300). To perform FCM analysis, we diluted them to 1:10 with a 0.2-μm filtered TE buffer (Tris-EDTA buffer) (10 mM Tris, 1 mM EDTA: Ethylenediaminetetraacetic acid), stained them with SYBR Green I solution (1:500 dilution; Molecular Probes), and incubated them at 80 °C in the dark for 10 min [29]. Cell side scatter (a proxy of cell size) and SYBR Green fluorescence (an indicator of nucleic acid) were used to distinguish viruses from heterotrophic bacteria [29].
All statistical analyses were performed using SPSS software (SPSS 14). A Student t-test was carried out to check for significant differences in microbial community (viruses, bacteria, Synechococcus spp., HNFs, PNFs, and ciliates) and environmental factors (temperature, salinity, NO3, and Chl a) between the northern and southern parts of the Taiwan Strait, with a confidence level of 95% (α = 0.05). Regression analyses were used to explain the relationship between microbial community and environmental factors. This study used redundancy analysis (RDA; rda function in R package vegan) to examine the environmental conditions to explain the microbial community composition in the studied parameters and the spatial variation of the microbial community. To identify the main patterns of spatial change of the relationship between microbial community and environmental conditions, we conducted a series of RDAs using (1) all datasets of the Taiwan Strait, (2) northern part, and (3) southern part of the Taiwan Strait.
3. Results
3.1. Environmental Conditions
The spatial variations in hydrographic parameters (temperature, salinity, and NO3 concentration) in the surface waters of the Taiwan Strait are shown in Figure 1. During the study period, water temperature and salinity were found to have different patterns in different areas, with the northern part of the Taiwan Strait having lower temperatures (15.3–22.8 °C) and salinities (32.2–33.4 psu) (transects A–D) (Figure 1A,B), as they were affected by China’s coastal waters. Temperatures and salinities were higher in the southern part (transects E–I) (t-test, p < 0.05, Figure 2A). NO3 concentrations were higher (>4 μM) in the northern part compared to the southern part of the study area (Figure 1C and Figure 2B). Chl a concentrations were highest (1.6 mg m−3) at the edge of China’s coastal waters in the northern part (Figure 1D). In general, the northern and southern parts of the Taiwan Strait had significant differences in average Chl a concentrations (t-test, p < 0.05) (Figure 2B).
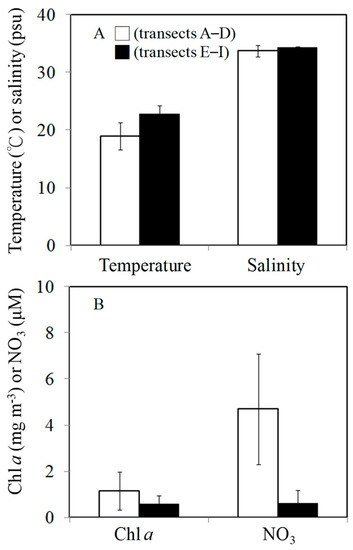
Figure 2.
Mean values were determined from the transects A–D (□) and transects E–I (■) for temperature and salinity (A) and for Chl a and NO3 (B).
3.2. Spatial Changes in Microbial Community
During the study period, the spatial variations in viral abundance ranged from 0.4 × 10⁷ to 2.4 × 10⁷ viruses mL−1, was slightly lower in the northern (transects A–D) part (1.2 ± 0.5) × 107 viruses mL−1) than that in the southern (transects E–I) part of the Taiwan Strait, (1.5 ± 0.6) ×107 viruses mL−1) (Figure 3A). Bacterial abundance varied between 0.4 × 10⁶ and 1.1 × 10⁶ cells mL−1 and 0.6 × 10⁶ and 2.9 × 10⁶ cells mL−1 in the northern (transects A–D) part and southern (transects E–I) part of the Taiwan Strait, respectively (Figure 3B). Bacterial abundances in the northern part (transects A–D) were significantly lower than those in the southern part (transects E–I) (Figure 4). Based on our field studies, bacterial abundance was probably related to temperature, and temperature explained about 42% of the difference in bacterial abundance (Figure 5A). Furthermore, viral abundance was significantly positively related to bacterial abundance in the northern part (r = 0.41, p < 0.05) and southern part (r = 0.82, p < 0.05) of the Taiwan Strait (Figure 5B). Abundance of Synechococcus spp. ranged from 0.4 × 10⁴ to 4.2 × 10⁴ cells mL−1 and showed higher values in the northern part (transects A–D) (Figure 3C and Figure 4). Nanoflagellate concentrations were higher in the northern part (transects A–D), HNF concentrations were (0.6–2.8) × 103 cells mL−1, and PNF concentrations were (0.3–2.3) × 103 cells mL−1 (Figure 3D,E and Figure 4). When Synechococcus spp. and PNFs from all stations were pooled, they were found to be positively correlated with total Chl a values (Synechococcus spp.: r = 0.77, p < 0.05; PNF: r = 0.63, p < 0.05; Figure 6). Mean Synechococcus spp. and PNFs represented a significant part of the total phytoplankton biomass. The same pattern was noted for ciliate abundances and the nanoflagellate community, with the southern part of the Taiwan Strait having lower ciliate concentrations (<400 cells L−1) (Figure 3F and Figure 4).
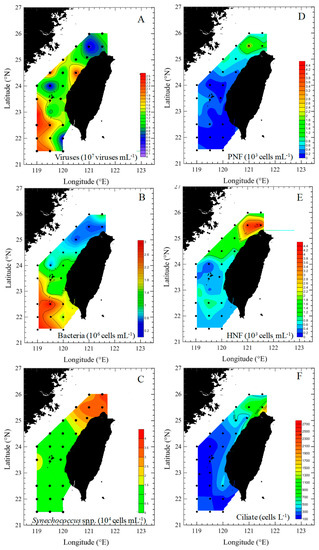
Figure 3.
Spatial variations of viral (A), bacterial (B), Synechococcus spp. (C), heterotrophic nanoflagellate (D), pigmented nanoflagellate (E), and ciliate (F) abundance during the study period in Taiwan Strait.
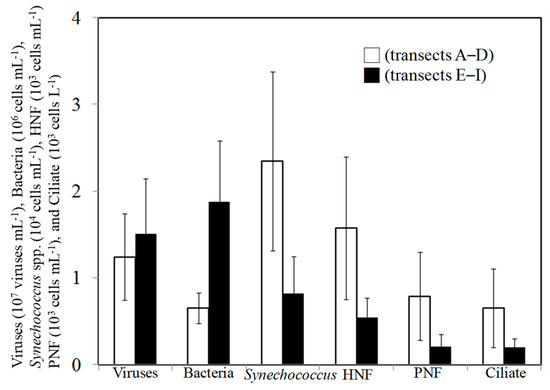
Figure 4.
Mean values were determined from the transects A–D (□) and transects E–I (■) for viral, bacterial, Synechococcus spp., HNF, PNF, and ciliate abundances.
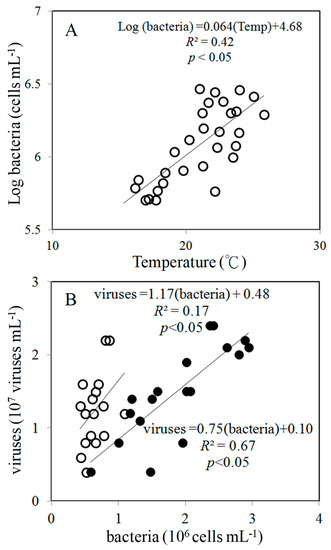
Figure 5.
Relationship between temperature and log(bacterial abundance) (A) and between viral and bacterial abundance (B) during the study period. The solid line is the regression line for all data (○); (□): the data for transects A–D; (■): the data for transects E–I.
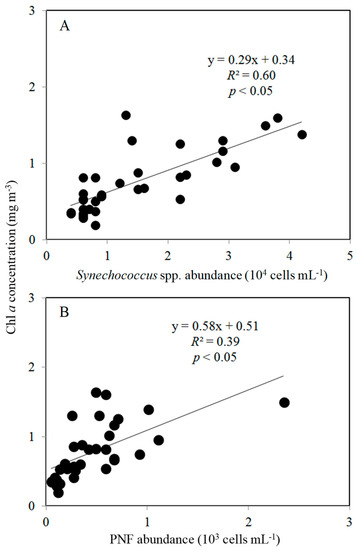
Figure 6.
Relationship between Synechococcus spp. (A), PNF abundance (B), and Chl a concentration during the study period. The solid line is the regression line for all data.
Based on analysis of all the data, environmental conditions explained 43.7% of variance in the data for microbial community composition in the Taiwan Strait. We observed that HNFs, PNFs, ciliates, and Synechococcus spp. showed similar patterns of spatial fluctuations (Figure 7A). On the other hand, temperature and salinity were associated with bacteria (Figure 7A). This result is supported by the correlation analysis between both of them (Figure 5A). Interestingly, a different pattern was observed between the northern and the southern parts of the Taiwan Strait (Figure 7B,C). In the northern part of the Taiwan Strait, we noticed the marked impact of the bacteria characterized by temperature, salinity, and viruses (Figure 7B). However, in the southern part of the Taiwan Strait, the impact parameters appeared in a different way, as bacteria variations were associated with an abundance of viruses and HNFs, highlighting the importance of top-down control as a limiting factor on bacteria (Figure 7C).
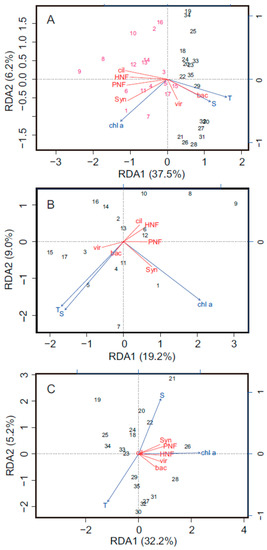
Figure 7.
Redundancy analysis (RDA)-based microbial community composition (bac = bacteria, vir = viruses, HNF = heterotrophic nanoflagellate, PNF = pigmented nanoflagellate, cil = ciliate, and Syn = Synechococcus spp.), and environmental conditions (chl a = chlorophyll a, T = temperature, S = salinity) as the explanatory variables, for all data (A), northern part (B), and southern part (C) of the Taiwan Strait. In (A), samplings from northern part and southern part of the Taiwan Strait are labeled using magenta and black, respectively. The percentages of the community composition variation explained by the first and second RDA are labeled on the two axes of each RDA plot. The explanatory environmental conditions and microbial compositions are presented as blue arrows and red lines on RDA plots, respectively.
4. Discussion
This study explored spatial variations in microbial communities across the Taiwan Strait during the winter months (January and February) of 2018. We used temperature and salinity in our study period to distinguish two hydrographic regions in the Taiwan Strait. Transects A–D and transects E–I were assumed in this study to be representative of the northern and southern parts of the strait, respectively. To the best of our knowledge, there are no previous studies of aquatic–microbial community dynamics in the Taiwan Strait, and so this study represents the first to investigate aquatic microbial ecology in this region. We found viral and bacterial concentrations to be higher at higher temperatures and in oligotrophic oceans, which have higher salinities in the southern part of the Taiwan Strait. Synechococcus spp., nanoflagellates, and ciliates had different spatial variations, with higher abundances of both found in the northern part (transects A–D) of the Taiwan Strait containing cold China coastal waters.
4.1. Spatial Variations in Bacterial and Viral Abundance
In marine environments, substrate availability and water temperature are important factors regulating bacterial production [9,30,31,32,33]. Some previous studies have suggested that, over the course of a year, temperature is the dominant factor affecting bacterial growth in colder seasons. Other factors, such as substrate supply, may be more important in warmer seasons [9,34]. In a study of a Delaware estuary, Hock and Kirchman [34] showed that its temperature varied over an annual cycle and that bacterial growth rate was directly related to temperatures below, but not above, 12 °C. In the present study, we found a clear relationship between temperature and bacterial abundance (ANOVA, p < 0.05) (Figure 5A), but not between Chl a and bacteria concentrations.
Viruses control bacterial mortality and may help to maintain bacterial community diversity [35]. In most aquatic environments, viral abundance was positively correlated with bacteria [27,35,36]. Interestingly, we found a closer linear relationship between viruses and bacteria in oligotrophic oceans in the southern part than those in the northern part of the Taiwan Strait (Figure 5B). One previous study of two lakes in the French Massif Central found that the relationship between viral and bacterial abundances to be weaker in the more productive lake, suggesting that there is an increase in relative abundance of non-bacteriophage viruses, such as cyanophages, in more productive environments [37]. In the present study, Synechococcus spp. abundance was significantly higher in the northern part of the study area (transects A–D) (Figure 4). This might explain the weaker linear relationship between the abundance of viruses and bacteria in the northern part of the Taiwan Strait (Figure 5B). Aside from this, differences in these relationships may be related to the burst size and infection rate of host cells [36]. Thus, future studies may want to include viral lysis and viral production when assessing the ecological role of phages and their potential for controlling bacterial dynamics.
4.2. Effects of Bottom-Up and Top-Down Controls on HNFs
According to one study, HNF abundance should be higher in warm environments than in colder ones, owing to consistent differences in the food web structure along the latitudinal gradient [38]. Some models of the predator–prey relationship have predicted that an increase in trophy of the freshwater environment should be reflected in both higher prey and higher predator abundances [39]. For example, a positive relationship has been found between bacterial and HNF abundances in marine systems [12,40,41,42]. Therefore, we also expected to find a relationship between the abundances of bacteria and HNFs in our study, but after considering all the data we collected, we found no consistent positive relationship between bacterial and HNF abundances (Figure 8), which is a correlation reported previously by many studies [12,41,42,43]. Šolić et al. [44] also reported a very low association between bacteria and HNF concentrations during the colder part of the year, suggesting that HNFs did not graze as much on bacteria during the colder months in the middle of the Adriatic Sea. In addition, top-down control on HNFs weakens the relationship between the abundances of bacteria and HNFs [15,16]. Therefore, a negative relationship was found between bacteria and HNFs in the northern part of the Taiwan Strait (r = −0.57) (Figure 8), showing a top-down control on bacteria by HNFs in this study area. The significant and positive relationship between water temperature and bacterial abundance (r = 0.65) suggests a stronger bottom-up control of bacteria in the northern part of the Taiwan Strait (Figure 5A). For another possibility of both bacteria and HNFs showing a negative relationship, the high correlation between HNFs and ciliates (strong top-down control of HNFs) could explain their relationship through the “trophic cascade effect.” This predation effect is known as the trophic cascade and is based on predation limitation at several trophic levels [45].
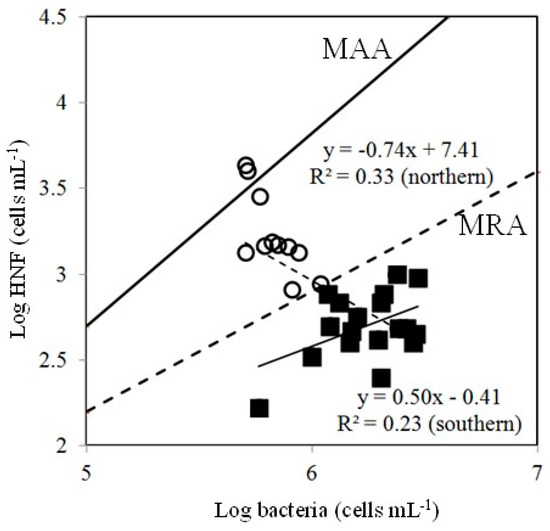
Figure 8.
Simultaneous observations of bacterial and HNF abundances plotted following Gasol’s model [16]. MAA is the maximum attainable abundance line, and MRA is the mean realized abundance line. (○): the data for transects A–D; (■): the data for transects E–I.
We looked to interpret our data using Gasol’s [16] theoretical framework to better understand the HNFs’ limitation in our study (Figure 8). According to Gasol’s model, points located below the MRA line (mean realized abundance) suggest top-down control of HNFs and points above it suggest low top-down control of HNFs. Points close to the MAA (maximal attainable abundance) line indicate clear bottom-up control of HNFs. The points were all below the MRA line in the southern part of Taiwan Strait in this study, denoting that HNFs were controlled more by predation (top-down) than available resources (bottom-up) (Figure 8). However, we did not observe a higher abundance of ciliates, top-down predators of HNFs, in the southern part of the Taiwan Strait (Figure 3D and Figure 4). However, viral lysis is a major source of bacterial loss [46,47], and its effect on bacterial mortality has been compared with the effect of nanoflagellate grazing in many oceanic systems [47,48,49].
This study found a closer linear relationship between viruses and bacteria in the southern part than those in the northern part of the Taiwan Strait (Figure 5B), thus suggesting that a significant fraction of bacterial carbon and energy is probably not transferred to higher trophic levels, but instead is cycled in a bacteria–virus–dissolved organic matter (DOM) loop. This “viral loop” [50] might serve as an important control mechanism for bacterial production in the southern part of the Taiwan Strait. Therefore, future studies may want to take viral lysis into account when studying mechanisms controlling bacterial abundance. Aside from this, mixotrophic nanoflagellates (MNFs) and HNFs have been described as important grazers on bacteria; in particular, the relevance of MNFs as grazers in oligotrophic environments was recognized [8]. Furthermore, a group of grazers (MNFs) may be related to bacteria, but not to HNFs, which probably affects the bacteria–HNF relationship.
We applied our field data of bacteria and HNF abundances in the northern part of the Taiwan Strait to the model by Gasol [16] (Figure 8). Because most points lay between the MRA and MAA lines in this part of the strait in this study, top-down control on HNFs should be low and bottom-up control should be high (Figure 8). This part of the Taiwan Strait is relatively high in nutrients. Thus, our results were not in agreement with Gasol regarding dominant bottom-up control of HNFs in oligotrophic sites [16]. At the stations in the northern part of the strait, bacterial abundance was relatively low, because low temperature reduced bacterial growth. In this situation, HNFs could not satisfy their carbon demand through only grazing on bacteria in the northern part of the strait.
The increase in HNF abundance in the northern part of Taiwan Strait may have to do with the availability of other types of prey, such as Synechococcus spp. or picoeukaryotes, as well as low top-down control by predators such as ciliates. Some studies have found variations in the abundance of ciliates to be important in explaining the variations in abundance of nanoflagellates. Weisse [51] and Nakano et al. [52] reported a negative relationship between abundances of the two. According to earlier studies, predation control on HNFs should increase with productivity [12,16]. However, in the current study, we found a positive relationship between ciliates and nanoflagellates (ANOVA, p < 0.05). As for the ciliate community, ciliates of <30 μm in equivalent spherical diameter (ESD), including Strombidium spp., Strobilidium spp., and Tontonia spp., were the most abundant group (65–90%) of the ciliate community in the northern part of the strait in this study. These small ciliates probably control the production of picoplankton [53]. This positive relationship between ciliates and nanoflagellates may suggest that the same factors control the abundance of both communities, since they basically have the same resource requirements (picophytoplankton) and potential predators (zooplankton) [21]. Thus, the high abundance of HNFs obtained in relation to the low abundance of bacteria we found in the northern part of the strait in this study was probably due to the availability of other prey sources. HNFs are known to have other food resources (e.g., picophytoplankton) besides bacteria [54]. However, this does not change the fact that we found that HNFs were primarily resource limited in the northern part of the study area. The spatial variations in Synechococcus spp. abundance in the present study showed higher values in the northern part (transects A–D) (Figure 4). Thus, we believe that the major flux in energy in the northern part of the strait during winter was nanofalelltes grazing on picophytoplankton.
5. Conclusions
We found higher abundances of bacteria in waters with warmer temperatures and lower salinities, while nanoflagellate and ciliate abundances were found to be higher in the northern part of the Taiwan Strait due to cold China coastal waters. Our findings characterize two different ecosystems in the Taiwan Strait. We suspect that a “viral loop” plays a major role in controlling bacterial production in the southern part of the strait and that picophytoplankton plays a major role in the flux of energy in the northern part of the strait during winter, though further studies are needed to investigate these possibilities.
Author Contributions
Conceptualization: G.-C.G. and A.-Y.T.; methodology: A.-Y.T.; validation: A.-Y.T.; formal analysis: G.-C.G., C.-h.H., P.-C.H., and A.-Y.T.; investigation: H.-M.Y. and Y.-K.C.; resources: G.-C.G. and A.-Y.T.; data curation: G.-C.G. and A.-Y.T.; writing–original draft preparation: G.-C.G. and A.-Y.T.; writing–review and editing: G.-C.G. and A.-Y.T.; supervision: G.-C.G.; funding acquisition: G.-C.G. and A.-Y.T.
Funding
This study was supported by a grant (NSC 106-2611-M-019-013) from the Ministry of Science and Technology, Republic of China.
Acknowledgments
We appreciate the language editing and helpful comments from James Steed on this manuscript.
Conflicts of Interest
The authors declare no conflict of interest.
References
- Pomeroy, L.R. The ocean’s food web: A changing paradigm. Bioscience 1974, 24, 499–504. [Google Scholar] [CrossRef]
- Christaki, U.; Giannakourou, A.; Van Wambeke, F.; Gregori, G. Nanoflagellate predation on auto-and heterotrophic picoplankton in the oligotrophic Mediterranean Sea. J. Plankton Res. 2001, 23, 1297–1310. [Google Scholar] [CrossRef]
- Tsai, A.Y.; Chiang, K.P.; Chang, J.; Gong, G.C. Seasonal diel variations of picoplankton and nanoplankton in a subtropical Western Pacific coastal ecosystem. Limnol. Oceanogr. 2005, 50, 1221–1231. [Google Scholar] [CrossRef]
- Unrein, F.; Massana, R.; Alonso-Saez, L.; Gasol, J.M. Significant year-round effect of small mixotrophic flagellates on bacterioplankton in an oligotrophic coastal system. Limnol. Oceanogr. 2007, 52, 456–469. [Google Scholar] [CrossRef]
- Tsai, A.Y.; Gong, G.C.; Hung, J. Seasonal variations of virus- and nanoflagellate-mediated mortality of heterotrophic bacteria in the coastal ecosystem of subtropical western Pacific. Biogeosciences 2013, 10, 3055–3065. [Google Scholar] [CrossRef]
- Schultz, G.E., Jr.; White, E.D., III; Ducklow, H.W. Bacterioplankton dynamics in the York River estuary: Primary influence of temperature and freshwater inputs. Aquat. Microb. Ecol. 2003, 30, 135–148. [Google Scholar] [CrossRef][Green Version]
- Iriarte, A.; Sarobe, A.; Orive, E. Seasonal variability in bacterial abundance, production and protistan bacterivory in the lower Urdaibai estuary, Bay of Biscay. Aquat. Microb. Ecol. 2008, 52, 273–282. [Google Scholar] [CrossRef]
- Tsai, A.Y.; Gong, G.C.; Sanders, R.W.; Chen, W.H.; Chao, C.F.; Chiang, K.P. Importance of bacterivory by pigmented and heterotrophic nanoflagellates during the warm season in a subtropical western Pacific coastal ecosystem. Aquat. Microb. Ecol. 2011, 63, 9–18. [Google Scholar] [CrossRef]
- Li, W.K.W. Annual average abundance of heterotrophic bacteria and Synechococcus in surface ocean waters. Limnol. Oceanogr. 1998, 43, 1746–1753. [Google Scholar] [CrossRef]
- Ochs, C.A.; Cole, J.J.; Liken, G.E. Population dynamics of bacterioplankton in an oligotrophic lake. J. Plankton Res. 1995, 17, 365–391. [Google Scholar] [CrossRef]
- Shiah, F.K.; Ducklow, H.W. Temperature regulation of heterotrophic bacterioplankton abundance, production, and specific growth rate in Chesapeake Bay. Limnol. Oceanogr. 1994, 39, 1243–1258. [Google Scholar] [CrossRef]
- Sanders, R.W.; Caron, D.A.; Berninger, U.G. Relationships between bacteria and heterotrophic nanoplankton in marine and fresh waters- an interecosystem comparison. Mar. Ecol. Peog. Ser. 1992, 86, 1–14. [Google Scholar] [CrossRef]
- Sherr, E.B.; Sherr, B.F. Significance of predation by protists in aquatic microbial food webs. Antonie Van Leeuwenhoek 2002, 81, 293–308. [Google Scholar] [CrossRef] [PubMed]
- Gasol, J.M.; Simons, A.M.; Kalff, J. Patterns of top-down versus bottom-up regulation of heterotrophic nanoflagellates in temperate lakes. J. Plankton Res. 1995, 17, 1879–1903. [Google Scholar] [CrossRef]
- Gasol, J.M.; Vaque, D. Lack of coupling between heterotrophic nanoflagellates and bacteria: A general phenomenon across aquatic systems? Limnol. Oceanogr. 1993, 38, 657–665. [Google Scholar] [CrossRef]
- Gasol, J.M. A framework for the assessment of top-down vs. bottom-up control of heterotrophic nanoflagellate abundance. Mar. Ecol. Prog. Ser. 1994, 113, 291–300. [Google Scholar] [CrossRef]
- Kisand, V.; Zingel, P. Dominance of ciliate grazing on bacteria during spring in a shallow eutrophic lake. Aquat. Microb. Ecol. 2000, 22, 135–142. [Google Scholar] [CrossRef]
- Berglund, J.; Samuelsson, K.; Kull, T.; Muren, U.; Andersson, A. Relative strength of resource and predation limitation of heterotrophic nanoflagellates in a low-productive sea area. J. Plankton Res. 2005, 27, 923–935. [Google Scholar] [CrossRef]
- Samuelsson, K.; Berglund, J.; Andersson, A. Factors structuring the heterotrophic flagellate and ciliate community along a brackish water primary production gradient. J. Plankton Res. 2006, 28, 345–359. [Google Scholar] [CrossRef][Green Version]
- Carrias, J.F.; Amblard, C.; Quiblier-Lloberas, C.; Bourdier, G. Seasonal dynamics of free and attached heterotrophic nanoflagellates in an oligotrophic lake. Freshw. Biol. 1998, 39, 91–101. [Google Scholar] [CrossRef]
- Auer, B.; Arndt, H. Taxonomic composition and biomass of heterotrophic flagellates in relation to lake trophy and season. Freshw. Biol. 2001, 46, 959–972. [Google Scholar] [CrossRef]
- Kosolapova, N.G.; Kosolapov, D.B. The diversity and distribution of heterotrophic nanoflagellates in the eutrophic Lake Nero. Inland Water Biol. 2009, 2, 42–49. [Google Scholar] [CrossRef]
- Liang, W.D.; Tang, T.Y.; Yang, Y.J.; Ko, M.T.; Chung, W.S. Upper-ocean currents around Taiwan. Deep Sea Res. 2003, 50, 1085–1105. [Google Scholar] [CrossRef]
- Jan, S.; Wang, J.; Chern, C.S.; Chao, S.Y. Seasonal variation of the circulation in the Taiwan Strait. J. Mar. Syst. 2002, 35, 249–268. [Google Scholar] [CrossRef]
- Gong, G.C.; Shiah, F.-K.; Liu, K.-K.; Wen, Y.-H.; Liang, M.-H. Spatial and temporal variation of chlorophyll a, primary productivity and chemical hydrography in the southern East China Sea. Cont. Shelf Res. 2000, 20, 411–436. [Google Scholar] [CrossRef]
- Stoecker, D.K.; Taniguchi, A.; Michaels, A.E. Abundance of autotrophic, mixotrophic, and heterotrophic planktonic ciliates in shelf and slope waters. Mar. Ecol. Prog. Ser. 1989, 50, 241–254. [Google Scholar] [CrossRef]
- Tsai, A.Y.; Gong, G.C.; Liu, H. Seasonal variations in virioplankton and picoplankton in semi-enclosed and open coastal waters. Terr. Atoms. Ocean. Sci. 2018, 29, 465–472. [Google Scholar] [CrossRef]
- Porter, K.G.; Feig, Y.S. The use of DAPI for identifying and counting aquatic microflora. Limnol. Oceanogr. 1980, 25, 943–948. [Google Scholar] [CrossRef]
- Brusaard, C.P.D. Optimization of procedures for counting viruses by flow cytometry. Appl. Environ. Microbial. 2004, 70, 1506–1513. [Google Scholar] [CrossRef]
- White, P.A.; Kalff, J.; Rasmussen, J.B.; Gasol, J.M. The effect of temperature and algal biomass on bacterial production and specific growth rate in freshwater and marine habitats. Microb. Ecol. 1991, 21, 99–118. [Google Scholar] [CrossRef]
- Coveney, M.F.; Wetzel, R.G. Effects of nutrients on specific growth rate of bacterioplankton in oligotrophic lake water cultures. Appl. Environ. Microbiol. 1992, 58, 150–156. [Google Scholar] [PubMed]
- Sala, M.M.; Peters, F.; Gasol, J.M.; Pedros-Alio, C.; Marrase, C.; Vaque, D. Seasonal and spatial variations in the nutrient limitation of bacterioplankton growth in the northwestern Mediterranean. Aquat. Microb. Ecol. 2002, 27, 47–56. [Google Scholar] [CrossRef]
- Rejas, D.; Muylaert, K.; Meester, L.D. Nutrient limitation of bacteria and sources of nutrients supporting nutrient-limited bacterial growth in an Amazonina floodplain lake. Aquat. Microb. Ecol. 2005, 39, 57–67. [Google Scholar] [CrossRef][Green Version]
- Hock, M.P.; Kirchman, D.L. Seasonal and inter-annual variability in bacterial production and biomass in a temperate estuary. Mar. Ecol. Prog. Ser. 1993, 98, 283–295. [Google Scholar] [CrossRef]
- Peduzzi, P.; Schiemer, F. Bacteria and viruses in the water column of tropical freshwater reservoirs. Environ. Microbiol. 2004, 6, 707–715. [Google Scholar] [CrossRef] [PubMed]
- Wommack, K.E.; Colwell, R.R. Virioplankton: Viruses in aquatic ecosystems. Microbiol. Mol. Biol. Rev. 2000, 64, 69–114. [Google Scholar] [CrossRef]
- Bettarel, Y.; Sime-Ngando, T.; Amblard, C.; Dolan, J. Viral activity in two contrasting lake ecosystems. Appl. Environ. Microbiol. 2004, 70, 2941–2951. [Google Scholar] [CrossRef]
- Sarmento, H. New paradigms in tropical limnology: The importance of the microbial food web. Hydrobiologia 2012, 686, 1–14. [Google Scholar] [CrossRef]
- Arditi, R.; Ginzburg, L.R.; Akcakaya, H.R. Variation in plankton densities among lakes: A case for ratio-dependent predation models. Am. Nat. 1991, 138, 1287–1296. [Google Scholar] [CrossRef]
- Sherr, B.F.; Sherr, E.B.; Newell, S.Y. Abundance and productivity of heterotrophic nanoplankton in Georgia coastal waters. J. Plankton Res. 1984, 6, 195–202. [Google Scholar] [CrossRef]
- Wright, R.T.C.; Wright, R.T.; Ledo, M.E. Dynamics of planktonic bacteria and heterotrophic flagellates in Parker Estuary, northern Massachusetts. Cont. Shelf Res. 1987, 7, 1383–1387. [Google Scholar] [CrossRef]
- Wikner, J.; Hagstrom, A. Evidence of a tightly coupled nanoplankton predator-prey link regulating the bacterivores in the marine environment. Mar. Ecol. Prog. Ser. 1988, 50, 137–145. [Google Scholar] [CrossRef]
- Berninger, U.G.; Finlay, B.J.; Kuuppo-Leinikki, P. Protozoan control of bacterial abundances in freshwater. Limnol. Oceanogr. 1991, 36, 139–147. [Google Scholar] [CrossRef]
- Solic, M.; Krstulovic, N.; Vilibic, I.; Bojanic, N.; Kuspilic, G.; Sestanovic, S.; Santic, D.; Ordulj, M. Variability in the bottom-up and top-down controls of bacteria on trophic and temporal scales in the middle Adriatic Sea. Aquat. Microb. Ecol. 2009, 58, 15–29. [Google Scholar] [CrossRef]
- Paine, R.T. Food Webs: Linkage, interaction strength and community infrastructure. J. Anim. Ecol. 1980, 49, 667–685. [Google Scholar] [CrossRef]
- Suttle, C.A. The significance of viruses to mortality in aquatic microbial communities. Microb. Ecol. 1994, 28, 237–243. [Google Scholar] [CrossRef] [PubMed]
- Fuhrman, J.A.; Noble, R.T. Viruses and protists cause similar bacterial mortality in coastal seawater. Limnol. Oceanogr. 1995, 40, 1236–1242. [Google Scholar] [CrossRef]
- Steward, F.C.; Smith, D.C.; Azam, F. Abundance and production of bacteria and viruses in the Bering and Chukchi Sea. Mar. Ecol. Prog. Ser. 1996, 131, 287–300. [Google Scholar] [CrossRef]
- Taira, Y.; Uchimiya, M.; Kudo, I. Simultaneous estimation of viral lysis and protozoan grazing on bacterial mortality using a modified virus-dilution method. Mar. Ecol. Prog. Ser. 2009, 379, 23–32. [Google Scholar] [CrossRef]
- Bratbak, G.; Heldal, M.; Thingstad, T.F.; Riemann, B.; Haslund, O.H. Incorporation of viruses into the budget of microbial C-transfer. A first approach. Mar. Ecol. Prog. Ser. 1992, 83, 273–280. [Google Scholar] [CrossRef]
- Weisse, T. The annual cycle of heterotrophic freshwater nanoflagellates: Role of bottom-up versus top-down control. J. Plankton Res. 1991, 13, 167–185. [Google Scholar] [CrossRef]
- Nakano, S.P.M.; Manage, M.; Nishibe, Y.; Kawabata, Z. Trophic linkage among heterotrophic nanoflagellates, ciliates and metazoan zooplankton in a hypereutrophic pond. Aquat. Microb. Ecol. 2001, 25, 259–270. [Google Scholar] [CrossRef]
- Suzuki, T.; Miyabe, C. Ecological balance between ciliate plankton and its prey candidates, pico- and nanoplankton, in the East China Sea. Hydrobiology 2007, 586, 403–410. [Google Scholar] [CrossRef]
- Kuosa, H. Picoplanktonic algae in the northern Baltic Sea-seasonal dynamics and flagellate grazing. Mar. Ecol. Prog. Ser. 1991, 73, 269–276. [Google Scholar] [CrossRef]


© 2019 by the authors. Licensee MDPI, Basel, Switzerland. This article is an open access article distributed under the terms and conditions of the Creative Commons Attribution (CC BY) license (http://creativecommons.org/licenses/by/4.0/).