1. Introduction
Wetlands play a crucial role in maintaining bird communities by supplying abundant resources. Unfortunately, global wetlands continue to disappear at an alarming rate, and one of the main drivers of this process is urbanization [
1,
2]. Natural marshes and agricultural ponds are replaced by impervious surfaces. In human-made urban parks and residual habitats in the metropolitan area, the high-intensity of human disturbances surrounding the wetlands is changing the air, soil, water quality and land cover pattern, which has a significant effect on the animals [
3,
4,
5,
6]. As a result of increasing urbanization, many ecologically sensitive species, especially those that depend on particular habitats, experience habitat loss and degradation, which leads to population declines and local extinctions [
7,
8,
9,
10,
11]. Meanwhile, the increase in the number of species that can adapt to the urban environment has led to the homogenization of species [
12,
13,
14]. As urbanization intensifies, birds living in wetlands face enormous environmental challenges [
15]. It is essential to understand the response of bird communities in the wetlands to urbanization to effectively develop biodiversity conservation strategies.
The viewpoint that urbanization has an impact on the homogenization of wildlife in urban areas is widely documented [
14,
16,
17]. Some studies have demonstrated that biotic homogenization goes along with increasing urbanization [
18,
19]. Species richness tended to be higher in areas with low to moderate levels of human development (such as suburban areas) than in natural rural areas, in accordance with the intermediate disturbance hypothesis [
20,
21]. Meanwhile, other studies showed that suburban areas had lower species diversity than rural habitats [
22,
23]. Therefore, the first question for us to test is whether bird species diversity is different among the urban-rural gradient.
Meanwhile, what is the primary cause of difference along the urban-rural gradient? A central focus of landscape ecology is to identify conditions under which local and landscape factors strongly influence ecological patterns and processes [
24,
25]. This paper attempts to reveal the influencing factors of land cover pattern on wetland diversity.
Land cover pattern is a major factor that may affect bird diversity. For example, shorebirds prefer wetland areas that are shallow, sparsely vegetated, and contain considerable mudflats [
26]. Some studies suggest that temperature and water depth affects the abundance of waterfowls [
27], while other studies indicate that herbivorous waterfowl abundance is related to lake connectivity [
28]. We should also pay attention to the terrestrial birds that have a history of wetland habitat preference. A survey of the Midwestern metropolitan area of America showed that bird species richness and diversity within wetlands correlated positively with the percentage of trees in the area plus the non-tree vegetation near the wetlands [
29]. Another study showed that water birds prefer large wetlands with extensive emergent vegetation [
30]. Furthermore, noise levels and vegetation appear to be critical predictors of bird diversity in urban areas [
31]. Connectivity and road density are essential indexes for predicting bird combinations in agro-ecological zones [
32]. The abundance of birds in Latin American cities is negatively affected by the amount of impervious surfaces and municipal green spaces [
33]. Albanese (2015) found that wetland habitats acreage significantly affected the density and abundance of shorebirds [
34].
Land cover patterns may change along the urban-rural gradient as the intensity of human activities changes. In urban areas, lightly managed wetlands with diverse land cover can retain a large number of sub-natural habitats and can serve as significant contributors to the conservation of local biodiversity in large urban metropolitan areas [
35]. However, humans may also have a strong impact on the vegetation composition, which impacts the species richness [
36]. A study in Singapore showed that the bird diversity in natural vegetation cover and cultivated greenery are significantly different [
37].
The land cover pattern of wetlands has a significant impact on bird diversity [
26]. However, the role of land cover pattern in wetland bird diversity in the urban-rural gradient is still unclear. In this paper, we investigated the bird communities of 31 wetland sites in Dianchi Lake, Yunnan, China. We attempted to explain the response, in terms of species diversity, of wetland birds to land cover pattern in the urban-rural gradient. We expected this study to aid the management of wetland biodiversity conversation in urbanized areas.
2. Materials and Methods
2.1. Study Area
Dianchi Lake (24°53′ N, 102°42′ E) is the largest inland lake on the Yunnan-Guizhou Plateau in Southwestern China. Its maximum water depth is 10.0 m, and the average water depth is 4.4 m. Kunming, one of the largest cities in Southwest China, is located in the northern part of Dianchi Lake. In the past, there were large areas of farmland to the east and south of Dianchi Lake. Nevertheless, the city has gradually expanded southward and surrounded Dianchi Lake. At the same time the government built several parks around Dianchi Lake. Via a systematic review of the lakeside zone, we chose 31 typical wetlands in the urban, suburban, and rural areas around Dianchi Lake as sample sites (
Figure 1). We ordered the urban gradient based on the degree of urbanization around the 31 sample sites.
2.2. Bird Survey and Diversity Indices
We conducted the bird survey from 8:00 to 12:00 and from 14:00 to 18:00 on sunny days. The survey transect length of each site was 200–400 m. We counted all bird species detected with the naked eye or with binoculars along transects. We counted all waterfowls in the lake that could be detected using a monocular telescope (20–60 times). We surveyed once a month in summer and winter, from June 2018 to September 2018 and from December 2018 to February 2019. Therefore, we conducted three rounds per season, and there were a total of six rounds. The six sets of surveys were then combined to form the community composition of each site [
37]. All bird species were used to calculate the α and β diversity indices of all birds. A subset of water birds was used to calculate the α and β diversity indices of water birds (including waterfowls and shorebirds). Water birds are more sensitive to changes in the wetlands and therefore had to be analyzed separately.
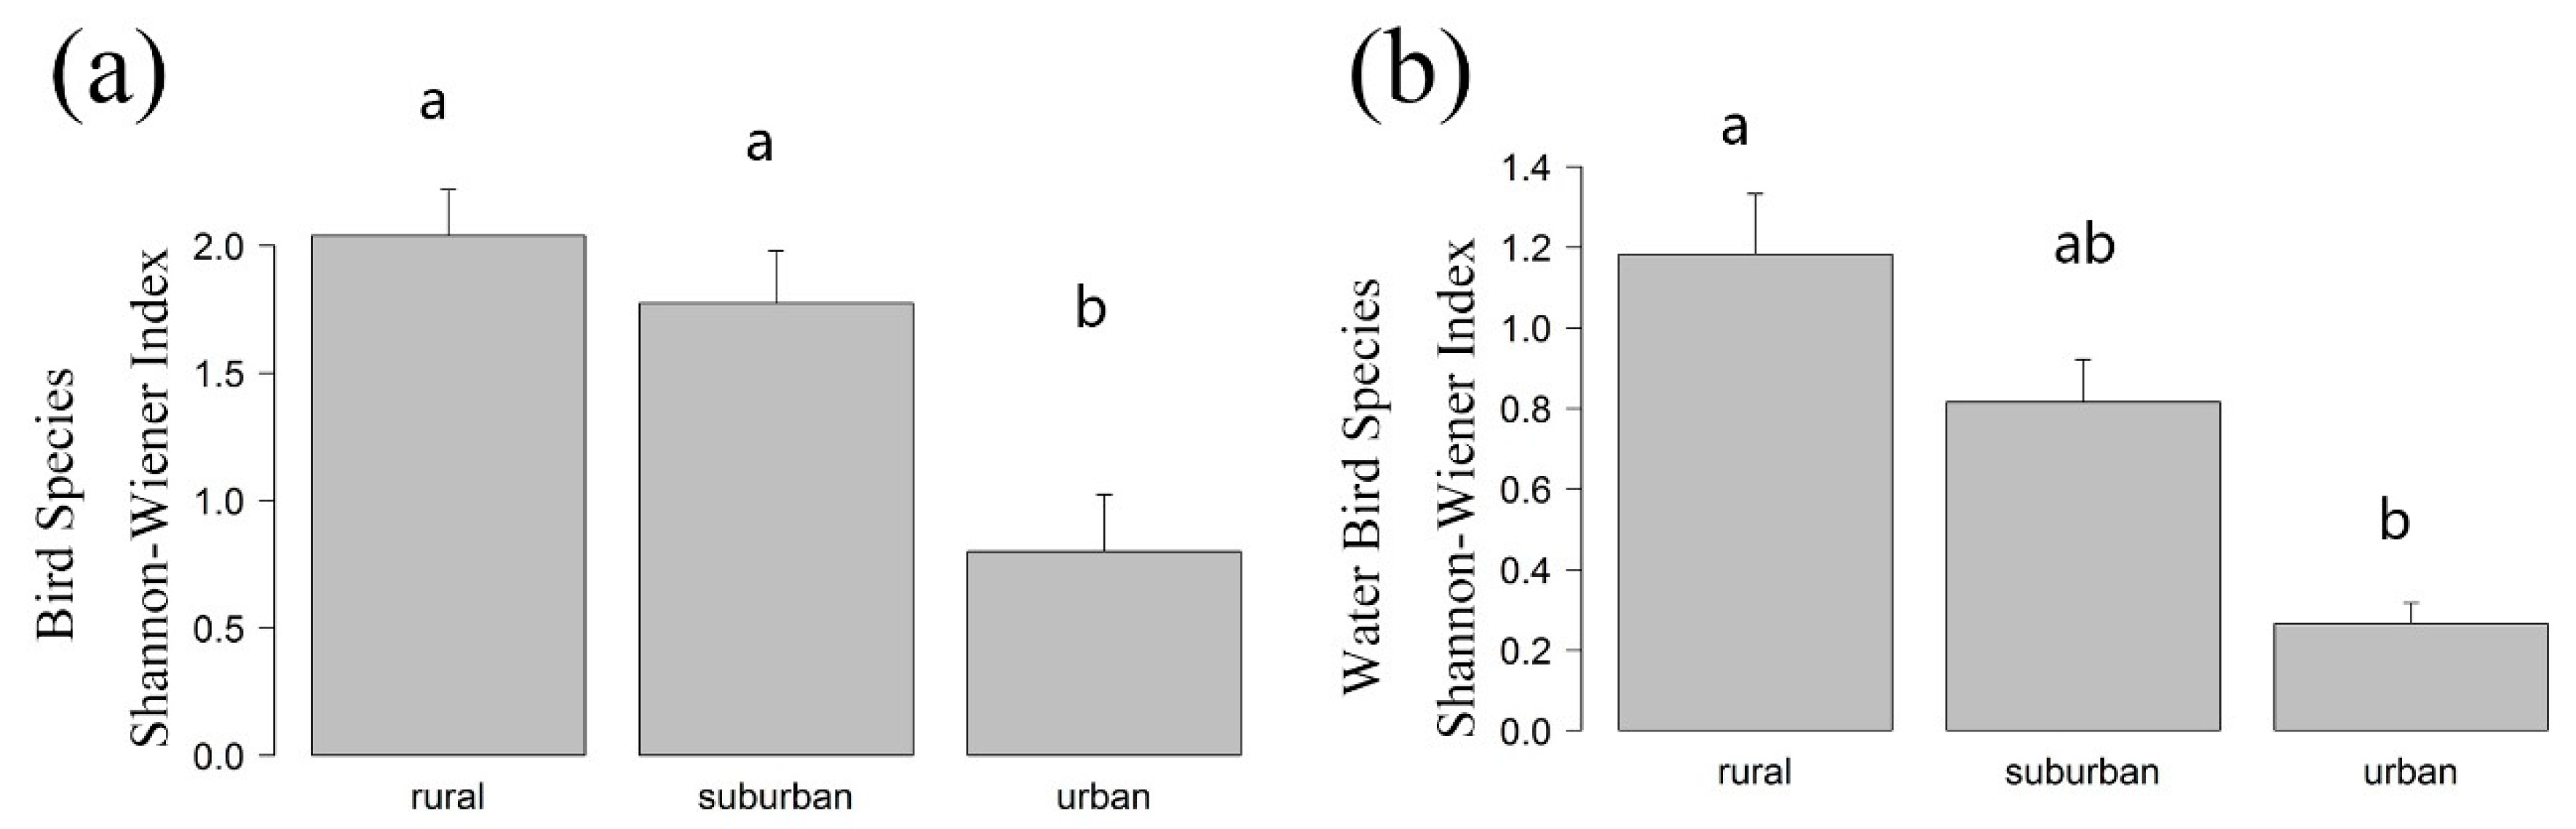
The α diversity index was formed using species richness. We also analyzed the Shannon-Wiener index (see
Appendix A for the results). The β diversity index was measured by the Morisita–Horn index, which emphasized composition and abundance and was sensitive to abundant species [
38]:
with
and
, where
is the
ith species found in
jth community and
is the
ith species found in
kth community. The Morisita–Horn index was calculated using the function “vegdist” in the package “vegan” in R [
39].
2.3. Land Cover and Plant Community Survey
We set a 1000 m × 1000 m quadrat at each site and measured the percentage of built land acreage (denoted as Pbuil), agricultural land acreage (Pagri), road acreage (Proad), lawn acreage (Plawn), forest acreage (Pfore), emergent plants acreage (Pemer), floating plants acreage (Pfloa), submerged plants acreage (Psubm), pond acreage (Ppond), and edge density of emergent plants (EDemer). EDemer equals the sum of the lengths (m) of all edge segments involving emergent plants, divided by the total landscape area (m2), multiplied by 10,000 (to convert to hectares).
To accurately measure these variables, we used a drone to capture images in the sample sites and used Agisoft PhotoScan 1.2 [
40] to obtain high-resolution orthophotos. The classification of images was done using eCognition Developer 8.7 [
41] and ArcGIS 10 [
42] based on an object-oriented classification method. We carefully verified the classifications with physical inspections. Furthermore, we used FRAGSTATS v. 4.2 [
43] to calculate the landscape indices.
2.4. Statistical Analysis
All statistical analyses in this study were conducted using R 3.5.3 [
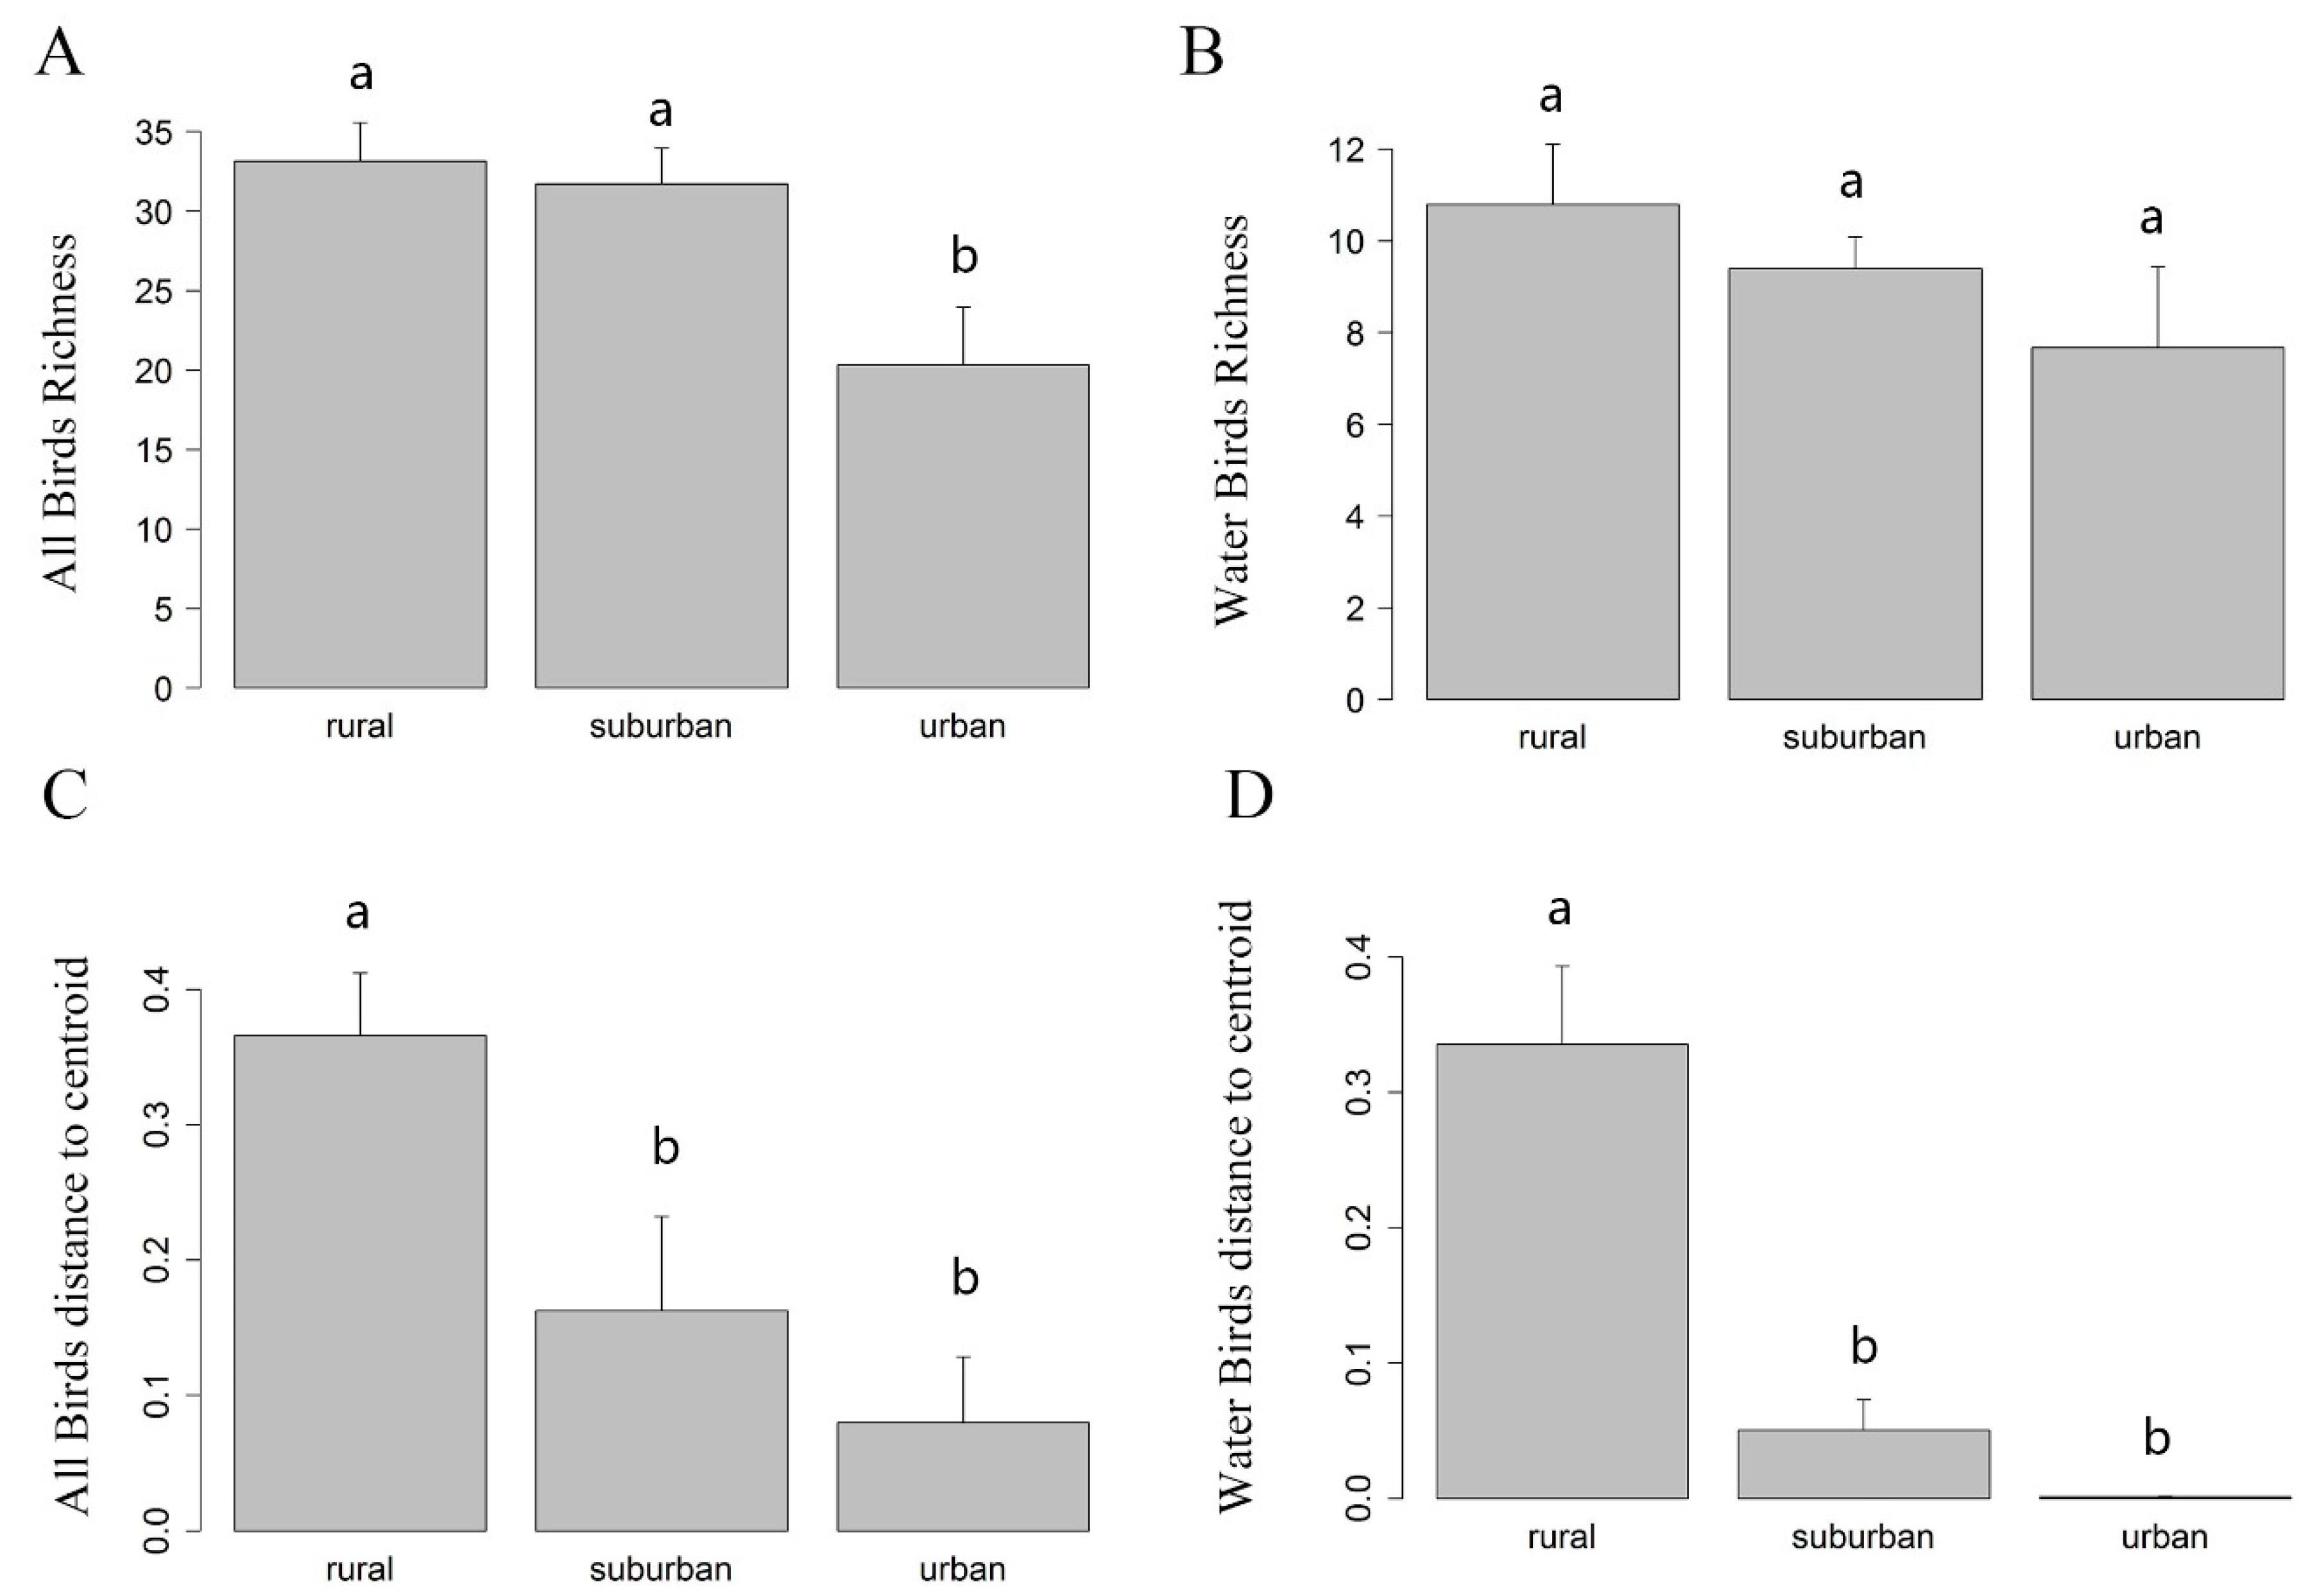
44]. We firstly conducted a one-way analysis of variance (ANOVA) and Tukey’s HSD (honestly significant difference) post hoc test to compare the difference of α diversity (i.e., richness) of the three groups (rural, suburban, and urban) of wetlands along the urban-rural gradient. The functions we used were “anova” and “TukeyHSD”.
Then, to test the significance of the difference in β diversity (i.e., community dispersion) of the three groups along urban-rural gradient, we used a distance-based test of homogeneity of multivariate dispersions for a one-way ANOVA design [
45,
46], and the function “betadisper” in package “vegan” [
39]. For visualization, we plotted bar plots of the distances to centroid for each group.
To detect the influential factors of land cover pattern on richness, we used the model section method in linear regression based on the information-theoretic approach [
47]. Before model selection we tested the data sets for normality using the Shapiro-Wilk test. We checked the variance inflation factors (VIFs) to assess multicollinearity. Furthermore, we drew partial residual plots to refute severe nonlinearity, plotted the residual QQ (quantile-quantile) plots to refute severe heteroscedasticity, and checked the Bonferonni
p-value to ensure there was no severe outlier.
Since our sample size was small, to avoid over-fitting the model, we limited the number of predictors in the candidate models to one-tenth of the sample size [
37,
48], i.e., up to three variables. We calculated the corrected Akaike information criterion (AICc), difference in AICc between the model and the model with the smallest AICc (ΔAICc), and the weight of all the models. The AICc is corrected from the AIC for the bias of small sample sizes [
49] and
. Since the model of ΔAICc < 2.0 is considered to have a large amount of support [
47], we chose models with an ΔAICc less than 2.0 and independent variables ≤ 3 as top model subset candidates.
The coefficient weight (
), i.e., “Akaike weight” [
47,
50] is calculated as:
where on the set of
m models,
is the weight of evidence of model
i, and Δ means ΔAICc.
Since top-ranked models had similar weights (i.e., each of the models considered was relatively likely given the dataset), we averaged the models in the top model set [
51]. Using the zero method, a parameter estimate and error of zero was substituted into those models where the given parameter was absent, and the parameter estimate was calculated by averaging all the models in the top model set [
47]. We evaluated the
p-values of the model parameters, the confidence interval, unconditional SE, and the relative importance of the predictors [
51]. Model selection was conducted using the function “dredge”, and model averaging and relative importance were calculated using the function “model.ave” in package “MumIn” [
52]. Confidence intervals for the model averaging parameters and unconditional SE were calculated in the "AICcmodavg" package in R [
53].
The selected influential factors of land cover pattern were then tested by MANCOVA (multivariate analysis of covariance) and the difference in the urban, suburban and rural wetlands was tested to check if different degrees of urbanization have different influential land cover patterns.
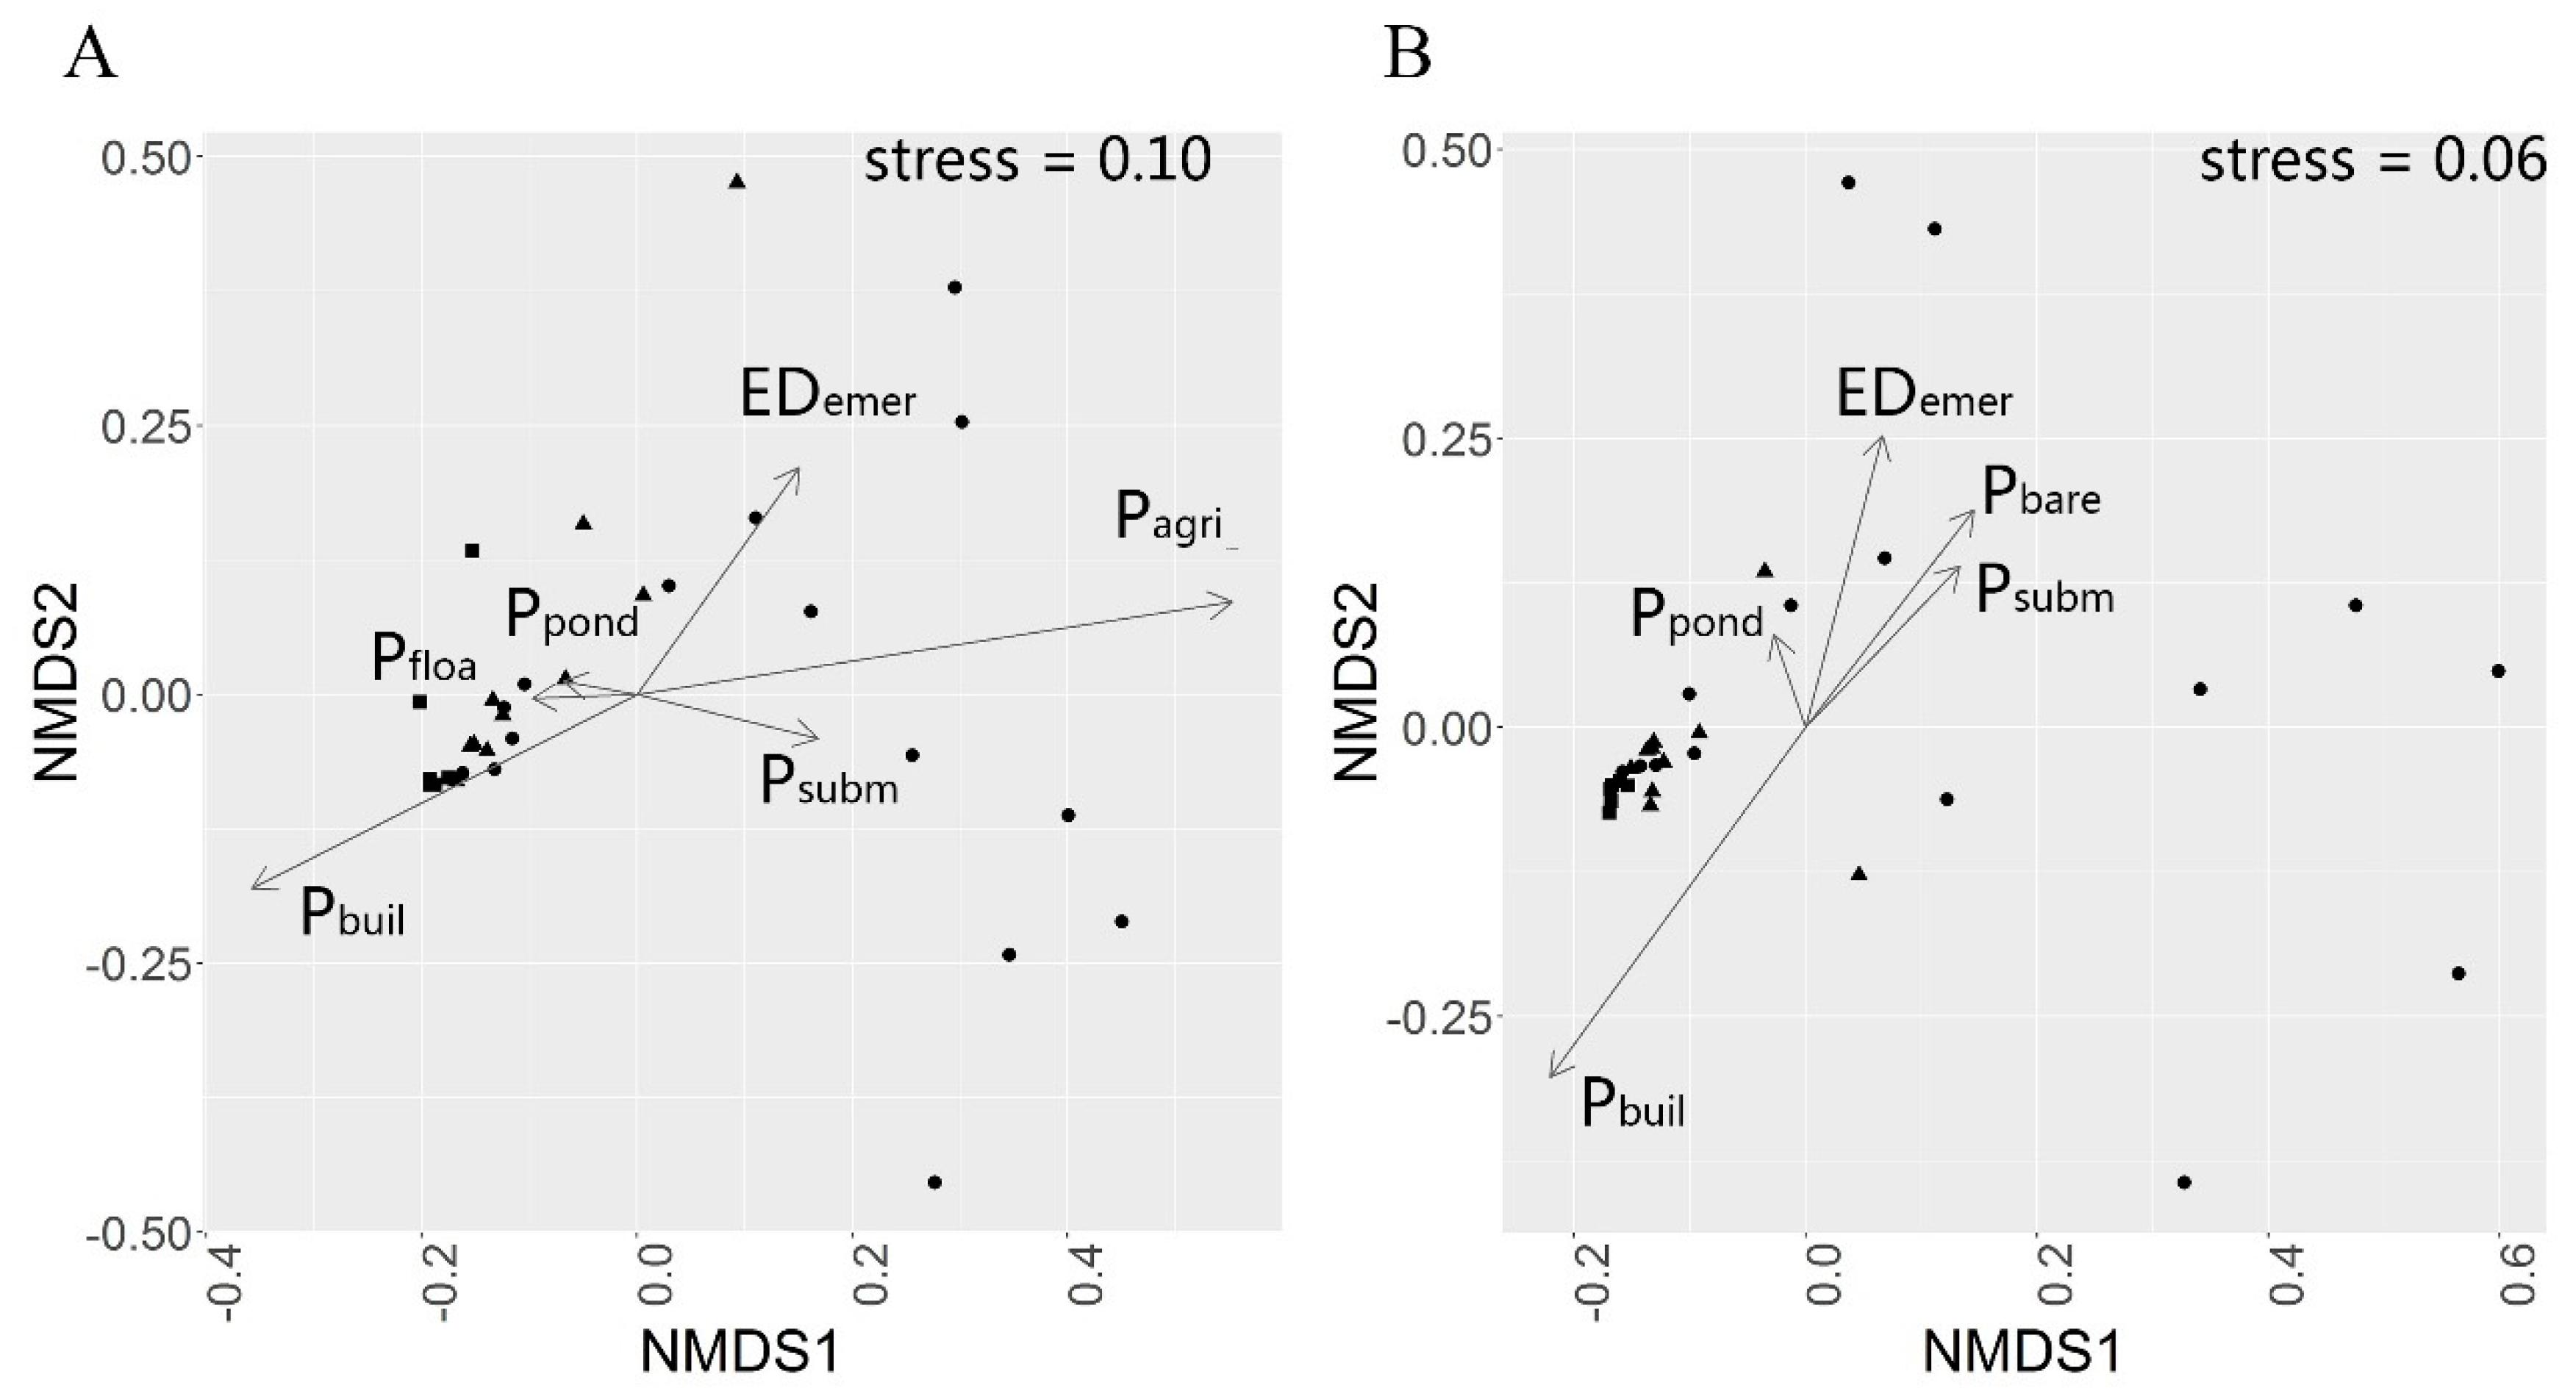
For the all bird dataset and the water bird dataset, we used non-metric multi-dimensional scaling (NMDS) based on Morisita–Horn distance to analyze dissimilarities of the birds between sample sites. To detect the variation in species of the environmental gradients we added land cover variables, chosen in model averaging, to the NMDS ordination plots as vectors. The regression coefficients of each axis weighted the direction of the environmental vectors, and the R² value weighted the vector length.
4. Discussion
In our study, urbanization decreased both α diversity (richness) and β diversity significantly, though we did not detect a significant difference in α diversity when comparing suburban and rural areas. However, we did detect a significant difference in the β diversity of suburban and rural areas. The reason could be that α-diversity reflects a relatively small proportion of biodiversity compared to β-diversity [
54,
55]. We suggested that suburban wetlands have lower species diversity than rural wetlands. Another research showed that the average abundance of omnivores, granivores, and habitat generalists was higher in urban areas, while insectivores and open habitat species were more abundant in periurban areas [
56]. The difference in the food preference of birds may lead to different community composition in urban and rural areas, which may result in significantly different biodiversity between the areas, as we found in this study.
For birds living in wetlands around the city, larger ponds and more extensive areas of aquatic plants may provide more spaces for nesting, shelters, and foods. Water birds need aquatic plants not only as a food source but also for shelter, especially those very sensitive to human disturbances such as Anatidae, some Scolopacidae, and Charadriidae birds. They rely on a more substantial buffer area of emergent plants as a shelter. The area of submerged plants has a significant, positive impact on water bird richness, as submerged plants are essential for herbivorous waterfowls. Ducks like to eat the aquatic plants in the water bay where the wind and waves are less intense, far from human disturbance. In the Caohai Dam of Dianchi Lake, although it is close to the road and construction land, there are still several kinds of ducks due to the abundance of submerge plants. Urban parks with high crowd density are more likely to have birds that rely on humans for food sources, such as
Chroicocephalus ridibundus, which results in simpler community structure. Compared with our team’s survey in 2012 [
57], we found that because of the disappearance of some mire (temporary mire appeared during construction period), the richness and abundance of Charadriidae and Scolopacidae birds declined. In wetland restoration and design, it is important to pay extra attention to the mire habitats. In urban planning, it is better to consider the high population density generated by residential lands around the wetland parks, buffer zones, and the connection between the wetland parks and natural habitats.
In some other studies, habitats with tall plants seemed to limit the species richness and quantity of shorebirds in the wetland habitats, or the vegetation-related attributes reduced the probability of finding shorebirds in the wetlands [
34,
58]. In our study, the area of the forest did not appear in the average model parameters of the richness for the all bird group or the water birds. This may be due to the artificial pure forests (
Taxodium ’Zhongshanshan’) that were planted around Dianchi Lake. As all of the sites were influenced, we suggest further research on this topic.
We observed that the higher degree of connectivity between wetland habitats might be an important factor affecting the richness of the birds. In other studies researchers considered habitat density (suitable habitat at 1.5 km or less ) to be an essential predictor of wetland shorebird density and abundance, while migrant bird populations have been shown to increase significantly with the amount of suitable habitat in the landscape surrounding stopover sites [
34,
59]. Therefore, in future urban planning around the lake, it may be necessary to pay more attention to the degree of connection of wetland habitats. In the development of the lakeside metropolitan area, the compact development patterns benefits the city’s sensitive species, as the ample green space remains intact [
60]. Dianchi Lake provides important and varied habitats for the breeding and wintering of wild birds. Pressures from human activities continue to reduce habitats available to bird species that feed, breed and live in wetlands. To manage and restore the urban lake wetlands, it is important to specify the characteristic of the habitats for all wild and water birds.
Our results are meant to guide wetland restoration projects, especially in terms of buffering the harmful effects of urbanization on bird diversity. Large ponds, high edge density of emergent plants are very important for bird diversity around wetlands. At the same time, more submerged plants in the harbor will be conducive to the survival of water birds.
5. Conclusions
Based on our study, Dianchi lake’s urban and suburban wetland birds are significantly homogeneous. The community structure in rural wetlands is notably different from that of suburban and urban areas. The main land cover factors that influence bird species richness are the built lands, submerged plants, ponds, and the edge density of emergent plants. Meanwhile, of these variables, the built lands, ponds and edge density of emergent plants are significantly different between the urban, suburban, and rural wetlands. Therefore, to maintain high biodiversity in the wetlands affected by urbanization, we must pay more attention to these land cover patterns.

 ,
, 


