Abstract
This study contributes to an understanding of megadiversity in the arid-adapted ant genus Melophorus by presenting an integrated genetic, morphological and distributional analysis of diversity within the M. rufoniger group in the 400,000 km2 Top End (northern region) of Australia’s Northern Territory. An earlier study of the Top End’s ant fauna lists eleven species from the M. rufoniger group, but a recent revision of Melophorus described the taxon as a single species occurring throughout most of the Australian mainland. CO1 sequences were obtained for 120 Top End specimens of the M. rufoniger group, along with a specimen from just outside the Top End. We recognize a total of 30 species among the sequenced specimens from the Top End, based on marked CO1 divergence (mean > 9%) in association with morphological differentiation and/or sympatric distribution. The sequenced specimen from just outside the Top End represents an additional species. Our unpublished CO1 data from other specimens from elsewhere in monsoonal Australia indicate that all but two of the 30 sequenced Top End species are endemic to the region, and that such diversity and endemism are similar in both the Kimberley region of far northern Western Australia and in North Queensland. The total number of species in the M. rufoniger group is potentially more than the 93 total species of Melophorus recognized in the recent revision. It has previously been estimated that Melophorus contains at least 1000 species, but our findings suggest that this is a conservative estimate.
1. Introduction
Melophorus is a highly diverse, arid-adapted ant genus endemic to Australia that has been estimated to contain at least 1000 species [1,2]. However, a recent revision presents a markedly different view of diversity within the genus, recognizing only 93 species [3]. The Melophorus rufoniger Heterick, Castalanelli and Shattuck species group illustrates these divergent views. The group comprises polymorphic, large-bodied (4–10 mm), gracile, and highly thermophilic ants with reddish head and mesosoma that occur throughout arid, semi-arid and seasonally arid Australia (Figure 1). It belongs to the M. aeneovirens radiation of species where the head of minor workers has a dome-shaped occiput and an acutely angled clypeal ‘apron’ that projects over the base of the mandibles [1,2]. According to [1,2] (where it was referred to as the M. aeneovirens (Lowne) group, prior to the description of M. rufoniger) this group consists of many species, with diversity especially high in the monsoonal zone of northern Australia [4]. For example, a recent synopsis of the ant fauna of the 400,000 km2 Top End (north of Katherine) of the Northern Territory (NT) listed 11 species from the group (where they are given the Melophorus species number codes sp. 1, sp. 2, sp. 4, sp. 35, sp. 45, sp. 46, sp. 47, sp. 52, sp. 62, sp. 63 and sp. 64) [5]. Preliminary CO1 data show that sp. 1 apparently represents several cryptic species, indicating that actual diversity within the complex is higher than is morphologically apparent [6].
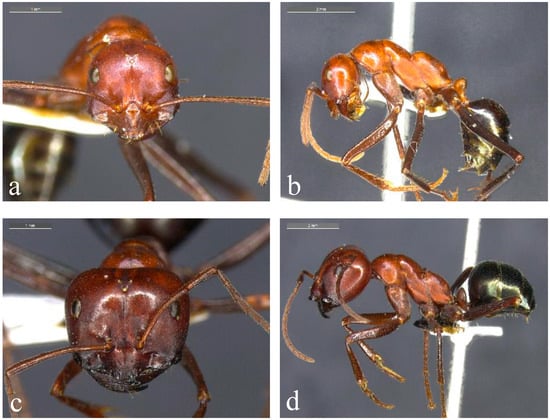
Figure 1.
Representative species from the Melophorus rufoniger group. Minor ((a,b); BOLD ID: MELUS015-19) and major ((c,d); BOLD ID: MELPS092-18) workers of Taxon 1F, a member of the ‘sp. 1’ complex of the Melophorus rufoniger group from the Gove Peninsula in the NT.
Species within the M. rufoniger group show marked variation in mesosomal shape, sculpture, pilosity and configuration of the clypeal apron. In most Top End taxa, the anterior margin of the clypeal apron of both minor and major workers has a conspicuous medial notch. Such taxa can be divided into two complexes. In the first (sp. 1 and allies; Figure 1), minor workers have a deep and relatively narrow metanotal groove and the propodeum is highly asymmetrical in profile, with a distinct anterior face that curves into an oblique dorsal face (Figure 1b). The head has a matt appearance due to finely scalloped sculpture (Figure 1a), and the mesosoma never has erect hairs. The metanotal groove is particularly deep and the propodeum is especially prominently rounded anteriorly in sp. 52 (known only from sandstone country of Kakadu National Park), producing a biconvex mesosoma (Figure 2a). The head of the major workers of sp. 52 is heart-shaped, with the occipital margin V-shaped medially (Figure 2b). In sp. 46 (occurring in the southern Top End and extending further south in the NT), the profile of the pronotum rises more steeply anteriorly, and the mesosoma often has longer and denser pubescence (Figure 2c). The sp. 1 complex occurs throughout monsoonal Australia [7,8,9,10,11], and it is by far the most common form in the Top End of the NT [12,13,14].
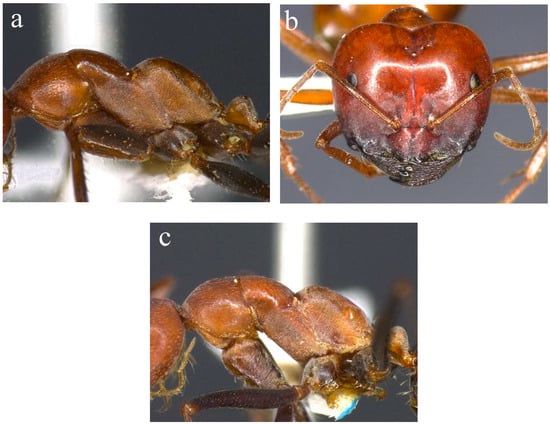
Figure 2.
Morphology of sp. 52 and sp. 46 of the Melophorus rufoniger group. Mesosoma of minor worker ((a); BOLD ID: MELPS042-18) and head of major worker ((b); BOLD ID: MELOP008-15) sp. 52, and mesosoma of sp. 46 ((c); BOLD ID: MELOP079-15), both members of the sp. 1 complex.
In the second complex (sp. 2 and allies), the anterior margin of the clypeal apron is often less prominently notched, the metanotal groove is broader, the propodeum is more evenly rounded, the head (and mesosoma) is shinier, and the mesosoma often has erect hairs (Figure 3). In sp. 2 (occurring throughout the higher rainfall (northern) areas of the Top End), erect mesosomal hairs are very sparse and often restricted to the pronotum or are absent (Figure 3a,b), whereas in sp. 45 (known only from Litchfield NP), they occur throughout the mesosoma, and the first gastric segment and antennal scapes also have many erect hairs (Figure 3c,d). In sp. 62 (known only from the Tiwi Islands north of Darwin), the mesosoma is always glabrous. The sp. 2 complex appears not to extend outside the Top End into drier regions of the NT [9,11].
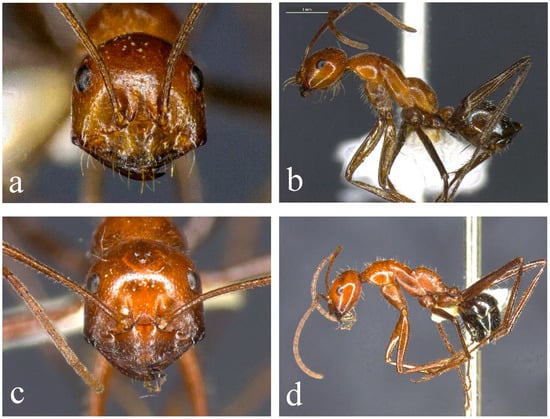
Figure 3.
Morphology of the sp. 2 complex of the Melophorus rufoniger group. Head and lateral views of sp. 2 ((a,b); BOLD ID: MELPS048-18) and sp. 45 ((c,d); non-sequenced specimen from Litchfield NP).
A third complex also occurs in the Top End, represented by the slightly smaller sp. 35, where the anterior margin of the clypeal apron lacks a conspicuous medial notch (it is crenulate in minor workers and almost entire in major workers), and the metanotal groove is not so deep (Figure 4). This complex occurs most commonly outside the Top End, in lower rainfall areas of the monsoonal zone [9].
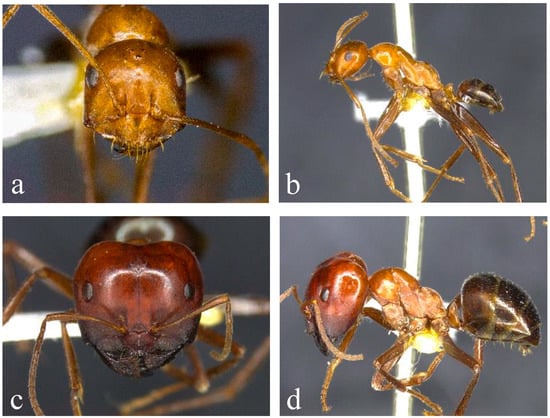
Figure 4.
Morphology of sp. 35 from the Melophorus rufoniger complex. Minor (a,b) and major (c,d) workers of sp. 35 from Kalkarindji, NT (not sequenced).
Despite the extensive morphological variation within the M. rufoniger group described above just within the Top End, as well as published accounts of high diversity more broadly [1], including marked genetic differentiation in sympatry [2], the recent revision of Melophorus [3] described the taxon as a single species. The species description provided no discussion of morphological or genetic variation within it. Here, we present an integrated morphological, genetic (CO1) and distributional analysis of diversity within the M. rufoniger group in the Top End of the NT, which is the most extensively collected region within its range. Our purpose is to improve an understanding of the extent of species richness within the M. rufoniger group, as a contribution to understanding diversity within Melophorus more generally.
2. Materials and Methods
The study was based on the >1000 pinned Top End specimens of the M. rufoniger group held in the ant collection at CSIRO’s Tropical Ecosystems Research Centre (TERC) in Darwin, which represent the vast majority of specimens of the group collected from the Top End. The collection was inspected by B.H. Heterick when preparing the revision of the genus [3].
DNA was extracted from foreleg tissue and sequences obtained for 120 Top End specimens of the M. rufoniger group, along with a specimen from just outside the Top End (Lorella Springs, near Borroloola) and a specimen of M. sulconotus Heterick, Castalanelli and Shattuck (Supplementary Table S1). Melophorus sulconotus is a closely related species within the M. aeneovirens radiation [3], and it was used as the outgroup for building a CO1 tree. Geographic sampling within the Top End was very patchy (Figure 5). It was heavily concentrated in Kakadu and Nitmiluk National Parks in the central region, and to a lesser extent the northwest (Darwin region and Litchfield National Park), and on the Gove Peninsula in the far northeast. Most of Arnhem Land (east of Kakadu and Nitmiluk National Parks) and the southwest remain unsampled. Sequenced specimens included representatives of seven of the eleven species listed in [5]; sequences were unable to be obtained from the other species because of the old (>15 yrs) age of specimens. DNA extraction and CO1 sequencing were conducted through the Barcode of Life Data (BOLD) System (for extraction details, see http://ccdb.ca/resources). Each sequenced specimen was assigned a unique identification code that combines the batch within which it was processed and its number within the batch (e.g., MELPS087-17), and all specimens are labeled with their respective BOLD identification numbers in the TERC collection. All data sequences have been deposited in GenBank; BankIt2111481.
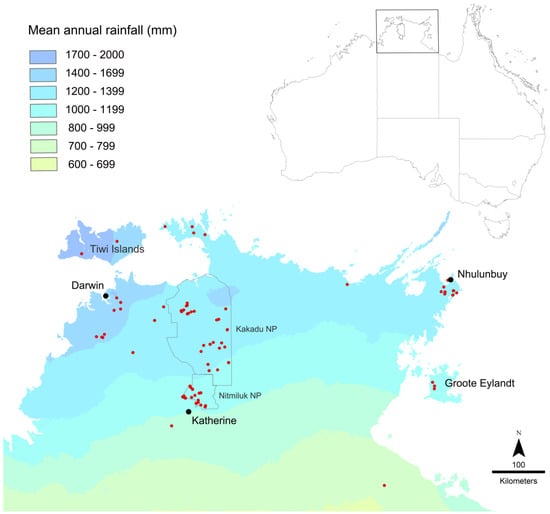
Figure 5.
Map of collection localities in the Top End of the Northern Territory. Collection localities for sequenced specimens are shown in red. Collections are heavily concentrated in Kakadu and Nitmiluk National Parks, as indicated.
DNA sequences were checked and edited in MEGA 7 [15]. Sequences were aligned using the UPGMB clustering method in MUSCLE [16], and then translated into (invertebrate) proteins to check for stop codons and nuclear paralogues. The aligned sequences were trimmed accordingly, resulting in 657 base pairs.
To explore overall CO1 diversity in the samples, the mean genetic pairwise distances between sequences were calculated in MEGA 7. This was done using the Kimura-2 parameter (K2P) model [17] to ensure that results were comparable with those of most other studies of insect DNA barcoding, with 500 bootstrap replicates and the ‘pairwise deletion’ option of missing data (to remove all ambiguous positions for each sequences pair). Analysis involved all nucleotide sequences, excluding those of the outgroup. Codon positions included were 1st+2nd+3rd.
There is no specific level of CO1 divergence that can be used to define a species, but the level of CO1 variation within ant species is typically 1%–3% [18]. However, some ant species can show substantially higher variation (e.g., [19]), and in other cases two clear species can show no CO1 differentiation (e.g., [20]). We also note that some ant species from other genera are known to have workers that are virtually identical morphologically, and they can be separated only by detailed morphometric analysis or through reproductive castes [21]. When delimiting species, we adopted the species concept based on reproductive isolation and evolutionary independence as evidenced by morphological differentiation between sister (i.e., most closely related) clades (considering all available samples from the same collections as those of sequenced specimens) and sympatric distribution. We are not aware of any record of M. ‘rufoniger’, or any other species of Melophorus, having wingless or brachypterous queens that might compromise the reliability of CO1 data for species delimitation.
Tree inference by maximum likelihood was conducted through the IQTREE web server (http://iqtree.cibiv.univie.ac.at/; [22]) using ultrafast bootstrap approximation [23]. IQTREE has been shown to be a robust algorithm for tree inference that compares favourably with other methods [24]. Model selection was inferred using a 3-codon partition file and linked branch lengths with the AutoMRE ‘ModelFinder’ function to find the best-fit model for tree inference [25]. Trees were viewed and edited in FigTree v1.4.3 [26] and annotated using Photoshop CS5.1.
3. Results
The CO1 tree shows four primary clades, with 10.2–13.5% divergence among them (Figure 6). The first two clades both consist of members of the sp. 1 complex, the third clade comprises the sp. 2 complex, and the fourth clade the sp. 35 complex.
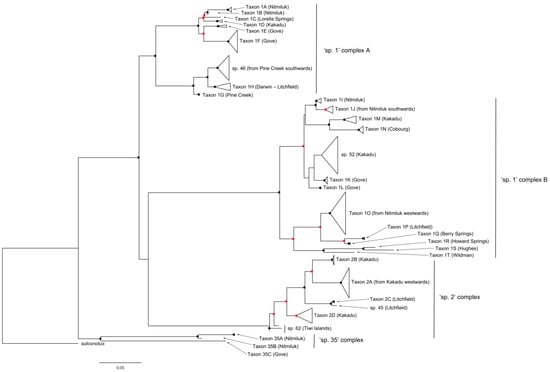
Figure 6.
Summary CO1 tree of specimens from the Melophorus rufoniger group. Red and black circles indicate bootstrap values ≥70% and ≥90%, respectively. The full CO1 tree is shown in Supplementary Figure S2.
The CO1 data indicate that sp. 1 contains 22 genetically differentiated taxa across the first two primary clades (Taxa 1A—1T in Figure 6), with mean divergence among them of 9.1% and in most cases morphologically differentiated from their sister taxa. However, some sp. 1 taxa show no obvious morphological differentiation from one or more non-sister taxa, even when they occur in different primary clades.
The first primary clade contains eight sp. 1 taxa (Taxa 1A – 1H) along with sp. 46 (Figure 2c), with 3.9% mean divergence among them. Taxon 1A and Taxon 1B are both known only from Nitmiluk NP; there are no obvious morphological differences between them, but their clear and substantial (2.2%) CO1 divergence in sympatry (in one case occurring within 100 m of each other) indicates that they represent different species. The single specimen of Taxon 1C (from Lorella Springs) can be differentiated morphologically from other sp. 1 taxa by its far denser and longer gastric pubescence (Figure 7). Taxon 1D is shown as sister to Taxon 1C but has typical gastric pubescence. In Taxon 1E (known only from the Gove Peninsula) the mesosoma of the major worker is saddle-shaped (Figure 8), lacking the prominent metanotal groove characteristic of other sp. 1 taxa (Figure 1d). Its sister taxon (Taxon 1F) is also known only from the Gove Peninsula, and the two taxa have 4.3% CO1 divergence from each other. The remaining taxa (sp. 46, Taxon 1G and Taxon 1H) occur in a separate sub-clade (Figure 6). Taxon 1G (Pine Creek region) and Taxon 1H (Darwin and Litchfield regions, approximately 150 km from Pine Creek) have 3.5% mean CO1 divergence from each other, but they show no obvious morphological differentiation, despite Taxon 1H having lower CO1 divergence from morphologically differentiated sp. 46 (Figure 2c) than from Taxon 1G.
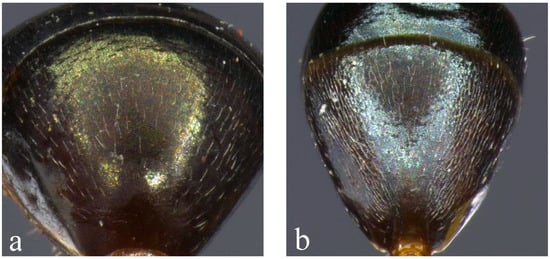
Figure 7.
Variation in gastric pubescence. First gastric segments of minor workers of (a) Taxon 1A (BOLD ID: MELPS087-17) and (b) Taxon 1C (BOLD ID: DARW621-16) from the sp. 1 complex.
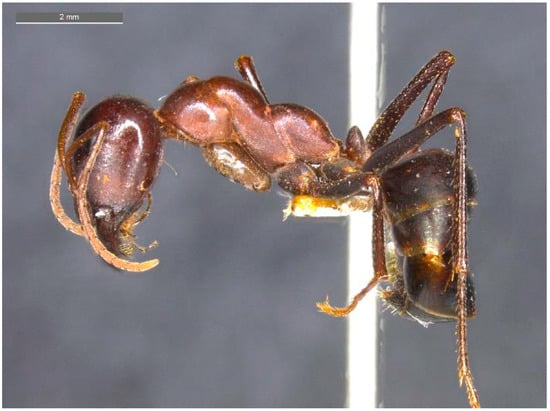
Figure 8.
Major worker of Taxon 1E from the sp. 1 complex. Note the saddle-shaped mesosoma that lacks a conspicuous metanotal groove (BOLD ID: DARW622-15).
The second primary clade consists of 12 sp. 1 taxa along with sp. 52, with 6.2% mean CO1 divergence among them. It is also divided into two distinct sub-clades. The first sub-clade contains sp. 52 along with Taxa 1I-1N. Taxon 1I and Taxon 1J show no clear morphological differentiation, but they are differentiated genetically (2.2% CO1 divergence) despite both occurring in Nitmiluk NP (Figure 6). The former is known only from Nitmiluk, whereas the latter extends south to Newcastle Waters in the NT and across to Western Australia (A. N. Andersen, unpublished CO1 data). Taxon 1K (known only from the Gove Peninsula) is the sister taxon to sp. 52 (known only from Kakadu NP), but lacks the biconvex mesosoma. Taxon 1L is sister to Taxon 1K plus sp. 52 and, like Taxon 1K, is also known only from the Gove Peninsula. Taxon 1M (known only from Kakadu NP) and Taxon 1N (known only from Cobourg Peninsula) are sister taxa, with 3.9% mean CO1 divergence between them. The second sub-clade of the second primary clade contains Taxa 1O–1T. Taxon 1O is widespread in the western half of the Top End, and its distribution overlaps that of all the other taxa in the sub-clade. The most distinctive of these taxa morphologically is Taxon 1Q (known only from Berry Springs near Darwin), the minor workers of which have a very prominently rounded pro-mesonotum and a relatively narrow head that is longer than wide in full-face view (Figure 9). The third primary clade of the CO1 tree represents the sp. 2 complex, and strongly indicates that sp. 2 comprises multiple species (Taxa 2A -2D, with 3.2% mean CO1 divergence from each other; Figure 6). Taxon 2A is widespread in the Top End, occurring from Wildman River (approximately 100 km east of Darwin) to central Arnhem Land; its sister taxon (Taxon 2B; 3.8% CO1 divergence) is known only from Kakadu NP, where Taxon 2A is common. Taxon 2C has only 0.09% CO1 divergence from the very hairy sp. 45 (Figure 3c,d), but its mesosoma is only sparsely hairy and erect hairs are absent from its antennal scapes and gaster. Both taxa are known only from Litchfield NP. Taxon 2D is a third sp. 2 taxon occurring in Kakadu NP, and it has not been recorded elsewhere. The final species in the sp. 2 complex is sp. 62, known only from the Tiwi Islands. It has no obviously distinguishing features but is genetically distinct (shown as basal) from the rest of the complex (Figure 6).
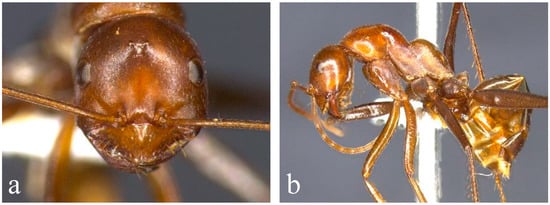
Figure 9.
Morphology of Taxon 1Q from the sp. 1 complex. Head (a) and lateral view (b) of minor worker (BOLD ID: MELPS071-18). This taxon is known only from Berry Springs, NT.
The final primary clade represents the sp. 35 complex, and it indicates that sp. 35 also contains multiple taxa, with three (Taxa 35A–C, 7.8% mean CO1 divergence) represented among the four specimens sequenced from the Top End (Figure 6). The most distinctive of these morphologically is Taxon 35C; in the minor worker the posterior half of the pronotum and the mesonotum are only feebly curved in profile and the propodeum is weakly differentiated (Figure 10).
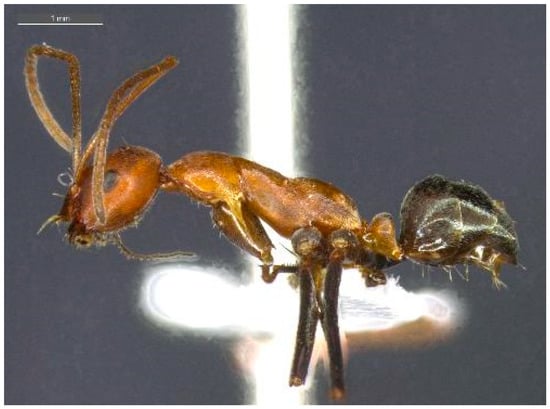
Figure 10.
Morphology of Taxon 35C from the sp. 35 complex. Minor worker (BOLD ID: MELPS118-18), known only from the Gove Peninsula.
4. Discussion
This study presents an integrated analysis of diversity within the Melophorus rufoniger group of ants in the Top End of the NT, a taxon that was described as a single species in a recent revision of the genus [3]. CO1 sequences were obtained for seven of the eleven species listed from the Top End in [5], and the validity of all these species has been supported. Moreover, our analyses have indicated that each of sp. 1, sp. 2 and sp. 35 represent several to many species. We recognise a total of 31 species from the sequenced specimens, based on a combination of CO1 divergence, morphological differentiation and/or sympatric distribution. One of these species is represented by the specimen from Lorella Springs, and it was not recorded from the Top End. Several of the Top End species have no obvious morphological differences between their minor workers, even when they belong to highly divergent CO1 clades. However, we note that major workers often have particularly informative morphological characters, and that major workers have not been collected for most of the apparently cryptic species.
Additional diversity is especially high in the sp. 1 complex, where our analysis revealed a remarkable 20 apparent species (Taxa 1A-T) among sequenced specimens in addition to sp. 46 and sp. 52. Multiple species from the sp. 1 complex often occurred at the same site (within 100 m); for example: Taxon 1D and sp. 52 (Kakadu NP, Biodiversity Monitoring Site 133B), Taxon 1G and sp. 46 (nr. Pine Creek), Taxon 1A and Taxon 1B (Nitmiluk NP, Biodiversity Monitoring Sites 42/42B), and Taxon 1H and Taxon 1R (Howard River) (Supplementary Table S1). Our analyses also revealed multiple species among sequenced specimens within both sp. 2 (four species) and sp. 35 (three species). Species from the sp. 2 complex were collected from only the northern (higher rainfall) half of the Top End, and there was only one case where a species occurred at the same site as one of the sp. 1 complexes (sp. 2A and sp. 52; Kakadu NP, Biodiversity Monitoring Site 69/69B; Supplementary Table S1), compared with the several cases of co-occurring species from within the sp. 1 complexes. The single sequenced specimen of Taxon 35C was collected at the same site as Taxon 1K (Gove Peninsula, Dhimurru Biodiversity Monitoring Site G1; Supplementary Table S1).
Regional diversity is particularly high in Nitmiluk National Park, where seven sequenced species have been collected, including five from the sp. 1 complex (Figure 11). Species distributions within the Park do not show strong geographic structure. None of the Nitmiluk species belong to the sp. 2 complex, which reflects the Park’s southern location within the Top End. Notably, six of the seven Nitmiluk species have not been recorded outside the Park. Another centre of diversity is Kakadu National Park, which adjoins Nitmiluk to the north; six sequenced species were collected from Kakadu, including three species from the sp. 2 complex (Figure 11). The Kakadu species are strongly structured spatially, especially west versus east relating to lowland savanna and sandstone habitat, respectively (Figure 11). Only one (Taxon 2A) of the six Kakadu species has been collected outside the Park. Remarkably, none of the Kakadu or Nitmiluk species are known from both Parks; collectively, they harbour 13 sequenced species from the group, and, as far as is currently known, 11 of these are endemic to their respective Park. There are no samples from the north of Nitmiluk, and it is likely that the Kakadu species sp. 52, Taxon 1D and Taxon 2B occur there (Figure 11); nevertheless, the Kakadu and Nitmiluk faunas are remarkably disjunct. The high regional diversity in Kakadu and Nitmiluk might simply be a product of high sampling intensity (Figure 5), but we suspect that the prominence of sandstone landforms as part of the western Arnhem Plateau is an important contributing factor. Local diversity is also high on the Gove Peninsula in the far northeast of the Top End, where five sequenced species have been collected. Four of these are known only from the Gove Peninsula, and the only other known location of the fifth (Taxon 1F) is nearby Groote Eylandt. Taxon 1K and Taxon 1L are known only from small localities within the Gove Peninsula, around Gulkula and Port Bradshaw, respectively. We note that such apparent local endemism might be an artefact of low sampling intensity elsewhere in Arnhem Land (Figure 5). However, there are numerous other examples of apparent short-range endemism elsewhere in the Top End where regional sampling is more extensive: for example, despite very extensive collecting in the broader region, Taxon 1Q is known only from the Territory Wildlife Park at Berry Springs, and sp. 45 has been collected only from the Wangi Falls area of Litchfield National Park. Nine of the 30 sequenced species that we have recognized from the Top End are known from a single site, suggesting that a substantial proportion of species have very limited distributional ranges.
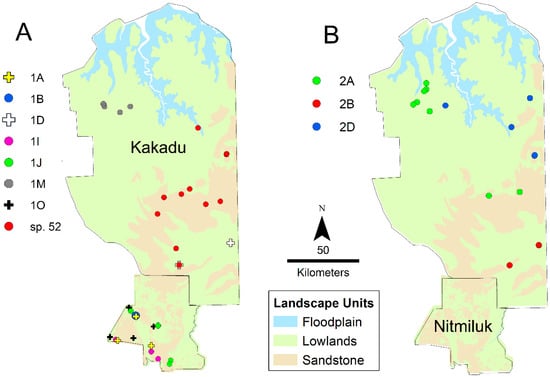
Figure 11.
Distribution of species of the sp. 1 (A) and sp. 2 (B) complexes in Kakadu and Nitmiluk National Parks.
5. Conclusions
Our integrated analysis of diversity within the Melophorus rufoniger group indicates that the 120 specimens sequenced from the Top End of the NT represent very many and potentially 30 species. This does not include the four additional species recognised from the Top End in [5]. For example, sp. 63 is a member of the sp. 1 complex from the Darwin region with a prominently raised mesonotum and a particularly long clypeal projection, and sp. 47 is another member of the sp. 2 complex from Kakadu NP, in which the antennal scapes are clothed in short, semi-erect hairs and the head has a matt appearance due to finely punctate and scalloped sculpture. We acknowledge that the validity of all these indicated species has not been unequivocally demonstrated. However, we have clearly demonstrated that the species group is represented by very many species in the Top End. Notably, all but two of these appear to be endemic to the Top End. There are high levels of apparent short-range endemism, which suggests that many species occur in the Top End in addition to those sequenced, given the highly patchy geographic coverage of samples (Figure 4). Our finding of extensive undocumented diversity within the M. rufoniger gp. in the Top End is consistent with a recent phylogeographic study of ten lizard genera in the region [27], which found that many species represent multiple lineages, especially among geckos. For example, 11 lineages of Heteronotia ‘binoei’ were recorded, most of which are endemic to the Top End and have narrow distributional ranges within it. Diversity was found to be especially high on the western Arnhem Plateau (see also [28]), which is consistent with our finding of very high levels of diversity within the M. rufoniger gp. in Kakadu and Nitmiluk National Parks.
Diversity and endemism within the M. rufoniger group is also very high in the Kimberley region of northern Western Australia and in North Queensland (A. N. Andersen, unpublished data), as has also been shown for lizards [27]. This suggests that well over 50 species from the M. rufoniger gp., and possibly as many as 100, occur just in monsoonal Australia. None of these also occur in South Australia (A. N. Andersen, unpublished CO1 data) where the type locality for M. rufoniger occurs, and so all are undescribed.
Our findings have important implications for diversity more generally in Melophorus. There is a strong likelihood that more species are concealed under M. ‘rufoniger’ than the total of 93 species recognized by [3] for the whole genus. When [4] presented an analysis of diversity in Melophorus based on the >850 morphospecies sorted in the TERC collection at the time, CO1 analysis in association with closer morphological inspection of 188 of these showed that many represented multiple and often many species, as was the case here for M. rufoniger sp. 1, sp. 2 and sp. 35. As of April 2020, the TERC collection holds >950 morphospecies of Melophorus, and it is likely that these represent well over 1000 actual species. Given the high levels of short-range endemism reported here, and that only a fraction of the range of Melophorus across the Australian continent has been sampled for ants, total diversity in the genus is likely to be far higher.
Supplementary Materials
The following are available online at https://www.mdpi.com/1424-2818/12/10/386/s1, Figure S1: Complete fifty percent majority rule Bayesian consensus tree of CO1-barcoded specimens from the Melophorus rufoniger group considered in this study. A specimen of closely related M. sulconotus is used as a n outgroup. Red and black circles indicate bootstrap values ≥70% and ≥90%, respectively. Table S1: Collection locations of specimens from the Melophorus rufoniger group that were CO1-barcoded for this study. Table S2. CO1 sequence divergence (%) among taxa, calculated using the Maximum Composite Likelihood model [29] in MEGA X [15].
Author Contributions
A.N.A. conceived the study, led the development of the TERC collection, and wrote the first draft of the manuscript. B.D.H. helped develop the TERC collection and contributed to the writing of the paper. S.K.O. undertook the analysis of the CO1 data and contributed to the writing of the paper. All authors have read and agreed to the published version of the manuscript.
Funding
This research received no external funding.
Acknowledgments
We thank our many collaborators who collected the specimens analysed in this study, and especially Magen Pettit, Tony Hertog and Jodie Hayward from CSIRO, as well as staff from the Flora and Fauna Division of the NT Department of Environment and Natural Resources who conducted biodiversity monitoring in Kakadu, Nitmiluk and Litchfield National Parks. We are also most grateful to Ruben Andersen for preparing the digital images, and to Finn Andersen for assistance with image quality. Finally, we thank Brian Fisher, Tek Tay and Olivia de Sousa for their valuable comments on the draft manuscript.
Conflicts of Interest
The authors declare no conflict of interest.
References
- Andersen, A.N. Ant diversity in arid Australia: A systematic overview. In Advances in Ant (Hymenoptera: Formicidae) Systematics: Homage to E. O. Wilson—50 Years of Contributions; Snelling, R.R., Fisher, B.L., Ward, P.S., Eds.; American Entomological Institute: Gainesville, FI, USA, 2007; Volume 80, pp. 19–51. [Google Scholar]
- Andersen, A.N.; Hoffmann, B.D.; Sparks, K. The megadiverse Australian ant genus Melophorus: Using CO1 barcoding to inform species richness. Diversity 2016, 8, 30. [Google Scholar] [CrossRef]
- Heterick, B.H.; Castalanelli, M.; Shattuck, S.O. Revision of the ant genus Melophorus (Hymenoptera, Formicidae). ZooKeys 2017, 700, 1–420. [Google Scholar] [CrossRef] [PubMed]
- Andersen, A.N. The Ants of Northern Australia: A Guide to the Monsoonal Fauna; CSIRO Publishing: Collingwood, New Zealand, 2000. [Google Scholar]
- Andersen, A.N.; Hoffmann, B.D.; Oberprieler, S. Diversity and biogeography of a species-rich ant fauna of the Australian seasonal tropics. Ins. Sci. 2016, 25, 519–526. [Google Scholar] [CrossRef] [PubMed]
- Andersen, A.N. Ant megadiversity and its origins in arid Australia. Austral Entomol. 2016, 55, 132–147. [Google Scholar] [CrossRef]
- Barrow, L.; Parr, C.L.; Kohen, J.L. Biogeography and diversity of ants in Purnululu (Bungle Bungle) National Park and conservation reserve. Aust. J. Zool. 2006, 54, 123–136. [Google Scholar] [CrossRef]
- Andersen, A.N.; Lanoue, J.; Radford, I. The ant fauna of the remote Mitchell Falls area of tropical north-western Australia: Biogeography, environmental relationships and conservation significance. J. Insect Conserv. 2010, 14, 647–661. [Google Scholar] [CrossRef]
- Andersen, A.N.; Del Toro, I.; Parr, C.L. Savanna ant species richness is maintained along a bioclimatic gradient of decreasing rainfall and increasing latitude in northern Australia. J. Biogeogr. 2015, 42, 2313–2322. [Google Scholar] [CrossRef]
- Cross, A.T.; Myers, C.; Mitchell, C.N.A.; Cross, S.L.; Jackson, C.; Waina, R.; Mucina, L.; Dixon, K.W.; Andersen, A.N. Ant biodiversity and its environmental predictors in the North Kimberley region of Australia’s seasonal tropics. Biodivers. Conserv. 2016, 25, 1727–1759. [Google Scholar] [CrossRef]
- Del Toro, I.; Ribbons, R.R.; Hayward, J.; Andersen, A.N. Are stacked species distribution models accurate at predicting multiple levels of diversity along a rainfall gradient? Austral Ecol. 2019, 44, 105–113. [Google Scholar] [CrossRef]
- Andersen, A.N. Responses of ground-foraging ant communities to three experimental fire regimes in a savanna forest of tropical Australia. Biotropica 1991, 23, 575–585. [Google Scholar] [CrossRef]
- Andersen, A.N. Ants as indicators of restoration success at a uranium mine in tropical Australia. Restor. Ecol. 1993, 1, 156–167. [Google Scholar] [CrossRef]
- Andersen, A.N.; Ribbons, R.R.; Pettit, M.; Parr, C.L. Burning for biodiversity: Highly resilient ant communities respond only to strongly contrasting fire regimes in Australia’s seasonal tropics. J. Appl. Ecol. 2014, 51, 1406–1413. [Google Scholar] [CrossRef]
- Kumar, S.; Stecher, G.; Li, M.; Knyaz, C.; Tamura, K. MEGA X: Molecular Evolutionary Genetics Analysis across computing platforms. Mol. Biol. Evol. 2018, 35, 1547–1549. [Google Scholar] [CrossRef] [PubMed]
- Edgar, R.C. MUSCLE: Multiple sequence alignment with high accuracy and high throughput. Nucleic Acids Res. 2004, 32, 1792–1797. [Google Scholar] [CrossRef]
- Kimura, M. A simple method for estimating evolutionary rates of base substitutions through comparative studies of nucleotide sequences. J. Mol. Evol. 1980, 16, 111–120. [Google Scholar] [CrossRef]
- Smith, M.A.; Fisher, B.L.; Hebert, P.D.N. DNA barcoding for effective biodiversity assessment of a hyperdiverse arthropod group: The ants of Madagascar. Philos. Trans. R. Soc. B Biol. Sci. 2005, 360, 1825–1834. [Google Scholar] [CrossRef]
- Wild, A.L. Evolution of the Neotropical ant genus Linepithema. Syst. Entomol. 2009, 34, 49–62. [Google Scholar] [CrossRef]
- Schär, S.; Talavera, G.; Espadaler, X.; Rana, J.D.; Andersen, A.A.; Cover, S.P.; Vila, R. Do Holarctic ant species exist? Trans-Beringian dispersal and homoplasy in the Formicidae. J. Biogeogr. 2018, 45, 1917–1928. [Google Scholar] [CrossRef]
- Wagner, H.C.; Gamisch, A.; Arthofer, W.; Moder, K.; Steiner, F.M.; Schlick-Steiner, B.C. Evolution of morphological crypsis in the Tetramorium caespitum ant species complex (Hymenoptera: Formicidae). Sci. Rep. 2018, 8, 12547. [Google Scholar] [CrossRef]
- Trifinopoulos, J.; Nguyen, L.-T.; von Haeseler, A.; Minh, B.Q. W-IQ-TREE: A fast online phylogenetic tool for maximum likelihood analysis. Nucleic Acids Res. 2016, 44, W232–W235. [Google Scholar] [CrossRef]
- Minh, B.Q.; Nguyen, M.A.T.; Von Haeseler, A. Ultrafast approximation for phylogenetic bootstrap. Mol. Biol. Evol. 2013, 30, 188–1195. [Google Scholar] [CrossRef] [PubMed]
- Nguyen, L.-T.; Schmidt, H.A.; Von Haeseler, A.; Minh, B.Q. IQ-TREE: A fast and effective stochastic algorithm for estimating maximum-likelihood phylogenies. Mol. Biol. Evol. 2014, 32, 268–274. [Google Scholar] [CrossRef] [PubMed]
- Chernomor, O.; von Haeseler, A.; Minh, B.Q. Terrace aware data structure for phylogenomic inference from supermatrices. Syst. Biol. 2016, 65, 997–1008. [Google Scholar] [CrossRef] [PubMed]
- Ambaut, A. FigTree: Molecular Evolution, Phylogenetics and Epidemiology. 2007. Available online: http://tree.bio.ed.ac.uk/software/figtree/ (accessed on 21 February 2019).
- Rosauer, D.F.; Blom, M.P.K.; Bourke, G.; Catalano, S.; Donnellan, S.; Gillespie, G.; Mulder, E.; Oliver, P.M.; Potter, S.; Rabosky, D.L.; et al. Phylogeography, hotspots and conservation priorities: An example from the Top End of Australia. Biol. Conserv. 2016, 204, 83–93. [Google Scholar] [CrossRef]
- Woinarski, J.C.Z.; Russell-Smith, J.; Andersen, A.N.; Brennan, K. Fire management and biodiversity of the western Arnhem Land plateau. In Culture, Ecology and Economy of Fire management in North Australian Savannas: Rekindling the Wurrk Tradition; Russell-Smith, J., Whitehead, P., Cooke, P., Eds.; CSIRO Publishing: Collingwood, New Zealand, 2009; pp. 201–227. [Google Scholar]
- Tamura, K.; Nei, M.; Kumar, S. Prospects for inferring very large phylogenies by using the neighbor-joining method. Proc. Natl. Acad. Sci. USA 2004, 101, 11030–11035. [Google Scholar] [CrossRef] [PubMed]


© 2020 by the authors. Licensee MDPI, Basel, Switzerland. This article is an open access article distributed under the terms and conditions of the Creative Commons Attribution (CC BY) license (http://creativecommons.org/licenses/by/4.0/).