Article

Dimensions of Phyllostomid Bat Diversity and Assemblage Composition in a Tropical Forest-Agricultural Landscape

by
Farah Carrasco-Rueda
1,2,* and
Bette A. Loiselle
3,4
1
School of Natural Resources and Environment, University of Florida, 103 Black Hall, Gainesville, FL 32611, USA
2
Keller Science Action Center, The Field Museum of Natural History, 1400 S. Lake Shore Drive, Chicago, IL 60605, USA
3
Department of Wildlife Ecology and Conservation, University of Florida, 110 Newins-Ziegler Hall, Gainesville, FL 32611, USA
4
Center for Latin American Studies, University of Florida, 319 Grinter Hall, Gainesville, FL 32611, USA
*
Author to whom correspondence should be addressed.
Diversity 2020, 12(6), 238; https://doi.org/10.3390/d12060238
Submission received: 17 April 2020 / Revised: 8 June 2020 / Accepted: 9 June 2020 / Published: 11 June 2020
(This article belongs to the Special Issue Land-Use Change Impacts on Tropical Vertebrates)

Abstract

:
Tropical rainforests are suffering rapid habitat loss with large extensions of land transformed into agriculture. We wanted to know whether the type of agricultural activity in forest-agricultural landscapes affects how species composition as well as taxonomic and functional dimensions of diversity respond. We worked in the Amazon forests of southeast Peru and used bats as model organisms. We sampled mosaics characterized by forest adjacent to papaya plantations or cattle pastures. At each sampling site we established a transect in each of the three different vegetation types: forest interior, forest edge and agricultural land. We found that vegetation type was a better predictor of species composition than the type of agricultural land present. Vegetation structure characteristics explained differences in bat species composition between forest interior and edge. Agricultural land type chosen was not irrelevant as we found higher estimated species richness in papaya than in pasture sites. Agricultural land type present in a site and vegetation type affected functional diversity, with both agricultural land types showing a lower number of functionally distinct species than forests. We found papaya plantation sites showed species more evenly dispersed in trait space, suggesting they do better at conserving functional diversity when compared to cattle pasture sites. We demonstrate that sites that harbor agricultural activities can maintain a considerable proportion of the expected bat diversity. We note that this region still has large tracts of intact forest adjacent to agricultural lands, which may explain their ability to maintain relatively high levels bat diversity.

Graphical Abstract

1. Introduction

In the era of the Anthropocene [1] human activities are affecting biological diversity globally [2]. Exploitation of natural resources, deforestation, and land-use change are among the most important drivers of habitat loss and reduction of biodiversity [3,4]. These changes have negative consequences for ecosystems and people that depend on these ecosystems due to the loss of ecological function and services [5,6]. These negative impacts are perhaps nowhere more pressing than in highly biodiverse regions such as the tropics.
In tropical rainforest, habitat loss is occurring rapidly [7] with large extensions of land transformed into agriculture (including crop and livestock farming and plantations). Cropland represents 12% of the world surface [8], while grazing for livestock production covers 25% [9]. Agriculture generally has negative effects on biodiversity largely through direct effects on habitat loss due to crop expansion and intensification, habitat degradation, pesticide contamination, increased frequency of fires, and introduction of invasive species [10,11,12,13,14,15,16,17]. Nevertheless agriculture may provide new spaces benefiting several species [18,19,20]. For example, some agricultural plantations (e.g., agroforestry plots) have been shown to better maintain species characteristic of forests than others (e.g., monoculture crops like pineapple, oil palm) [21,22,23,24]. Agricultural plantations may also provide resources that supplement what is available in natural habitats (i.e., landscape supplementation) [25]. The degree of supplementation can be measured in terms of food availability. Agricultural land taken together with native vegetation, comprise novel human-modified landscapes that have been the focus of recent studies to understand the maintenance and resilience of biodiversity and ecosystem properties at landscape scale (i.e., country-side biogeography) [26,27].
Bats are an excellent focal taxa to investigate responses to changes in forested areas that result from conversion of forest to agricultural activities given their diversity in morphology and habits, their varied evolutionary histories, and the key ecosystem services they provide (e.g., seed dispersal, pollination, pest control, regeneration of disturbed areas) [28,29,30,31,32,33]. Some species are sensitive to perturbations [33], while other species may tolerate or even benefit from land-use changes [29,34,35] as is the case of generalist frugivores [36] and nectarivores [37].
In Madre de Dios (MDD), Peru, as is typical for other developing Amazon regions, cattle pastures and plantations are common and require relatively large land extensions to generate income for landowners. Cattle ranching in the Amazon region was promoted by the Peruvian Government in the 1970s [38]. In contrast to the decades old activity of cattle ranching, papaya plantations represent a recent economic boom in the region and are now considered an important driver of deforestation [39].
Here we examine how dominant agricultural land uses in Amazonia impact dimensions of diversity and assemblage composition using bats as model organisms. We specifically examine taxonomic [34,40,41,42], and functional [29,43] dimensions of diversity where the latter have received much less attention [44,45,46,47]; understanding how functional diversity changes in human-modified landscapes is key to understanding change in ecological function and services. Functional diversity provides information about the scope of things that, in this case, bats do in communities and ecosystems and adds additional insights regarding ecosystem function that are not available from species diversity measures alone [29,43,48].
We wanted to know whether the site context (e.g., type of agricultural activity in forest-agricultural landscapes) affects bat species composition in different vegetation types (i.e., forest interior, forest edge, agriculture). Specifically we expect that forest (interior and edge) in sites with a matrix including papaya will show greater similarity and segregate from those forests found in a matrix containing cattle pasture. Furthermore, we expect that bat composition within papaya plantations will differ from those in pasture. This result would indicate that agricultural activities impact bats within adjacent forests in predictable ways. We relied on earlier findings that (1) bats can respond differently to edge effects under different land uses as a result of species-specific feeding and roosting habits, morphologies and maneuverability [45,49,50], and (2) agricultural activities may in some cases enhance the conservation value of adjacent forest remnants [51].
We also ask whether agricultural land-use type has an effect on different dimensions of diversity. We expect that (1) papaya plantations sites will show greater taxonomic diversity than cattle pasture sites. We base this expectation on the differences in vegetation structure of the papaya versus cattle pasture and the likely benefits to bats. Vegetation structure of the papaya plantation is expected to benefit bats by providing protection from predation (e.g., from owls and large carnivorous bats) and locations that may serve as roosts. (2) We further predict greater functional diversity in papaya plantation, which are assumed to provide more resources to exploit, than cattle pasture. Papaya plantations have food resources for frugivores (papaya fruits), gleaning insectivores (insects attracted by rotten papayas), as well as carnivores and omnivores (small mammals feeding on papaya fruits), and consequently, should support more functional diversity than cattle pasture, which are more structurally simple and where food sources are principally insects.
We expect the results of this study to reveal how agricultural lands at the agriculture-forest frontier differentially impact bat diversity and assemblage composition, which will inform potential policies for agricultural development and land management.

2. Materials and Methods

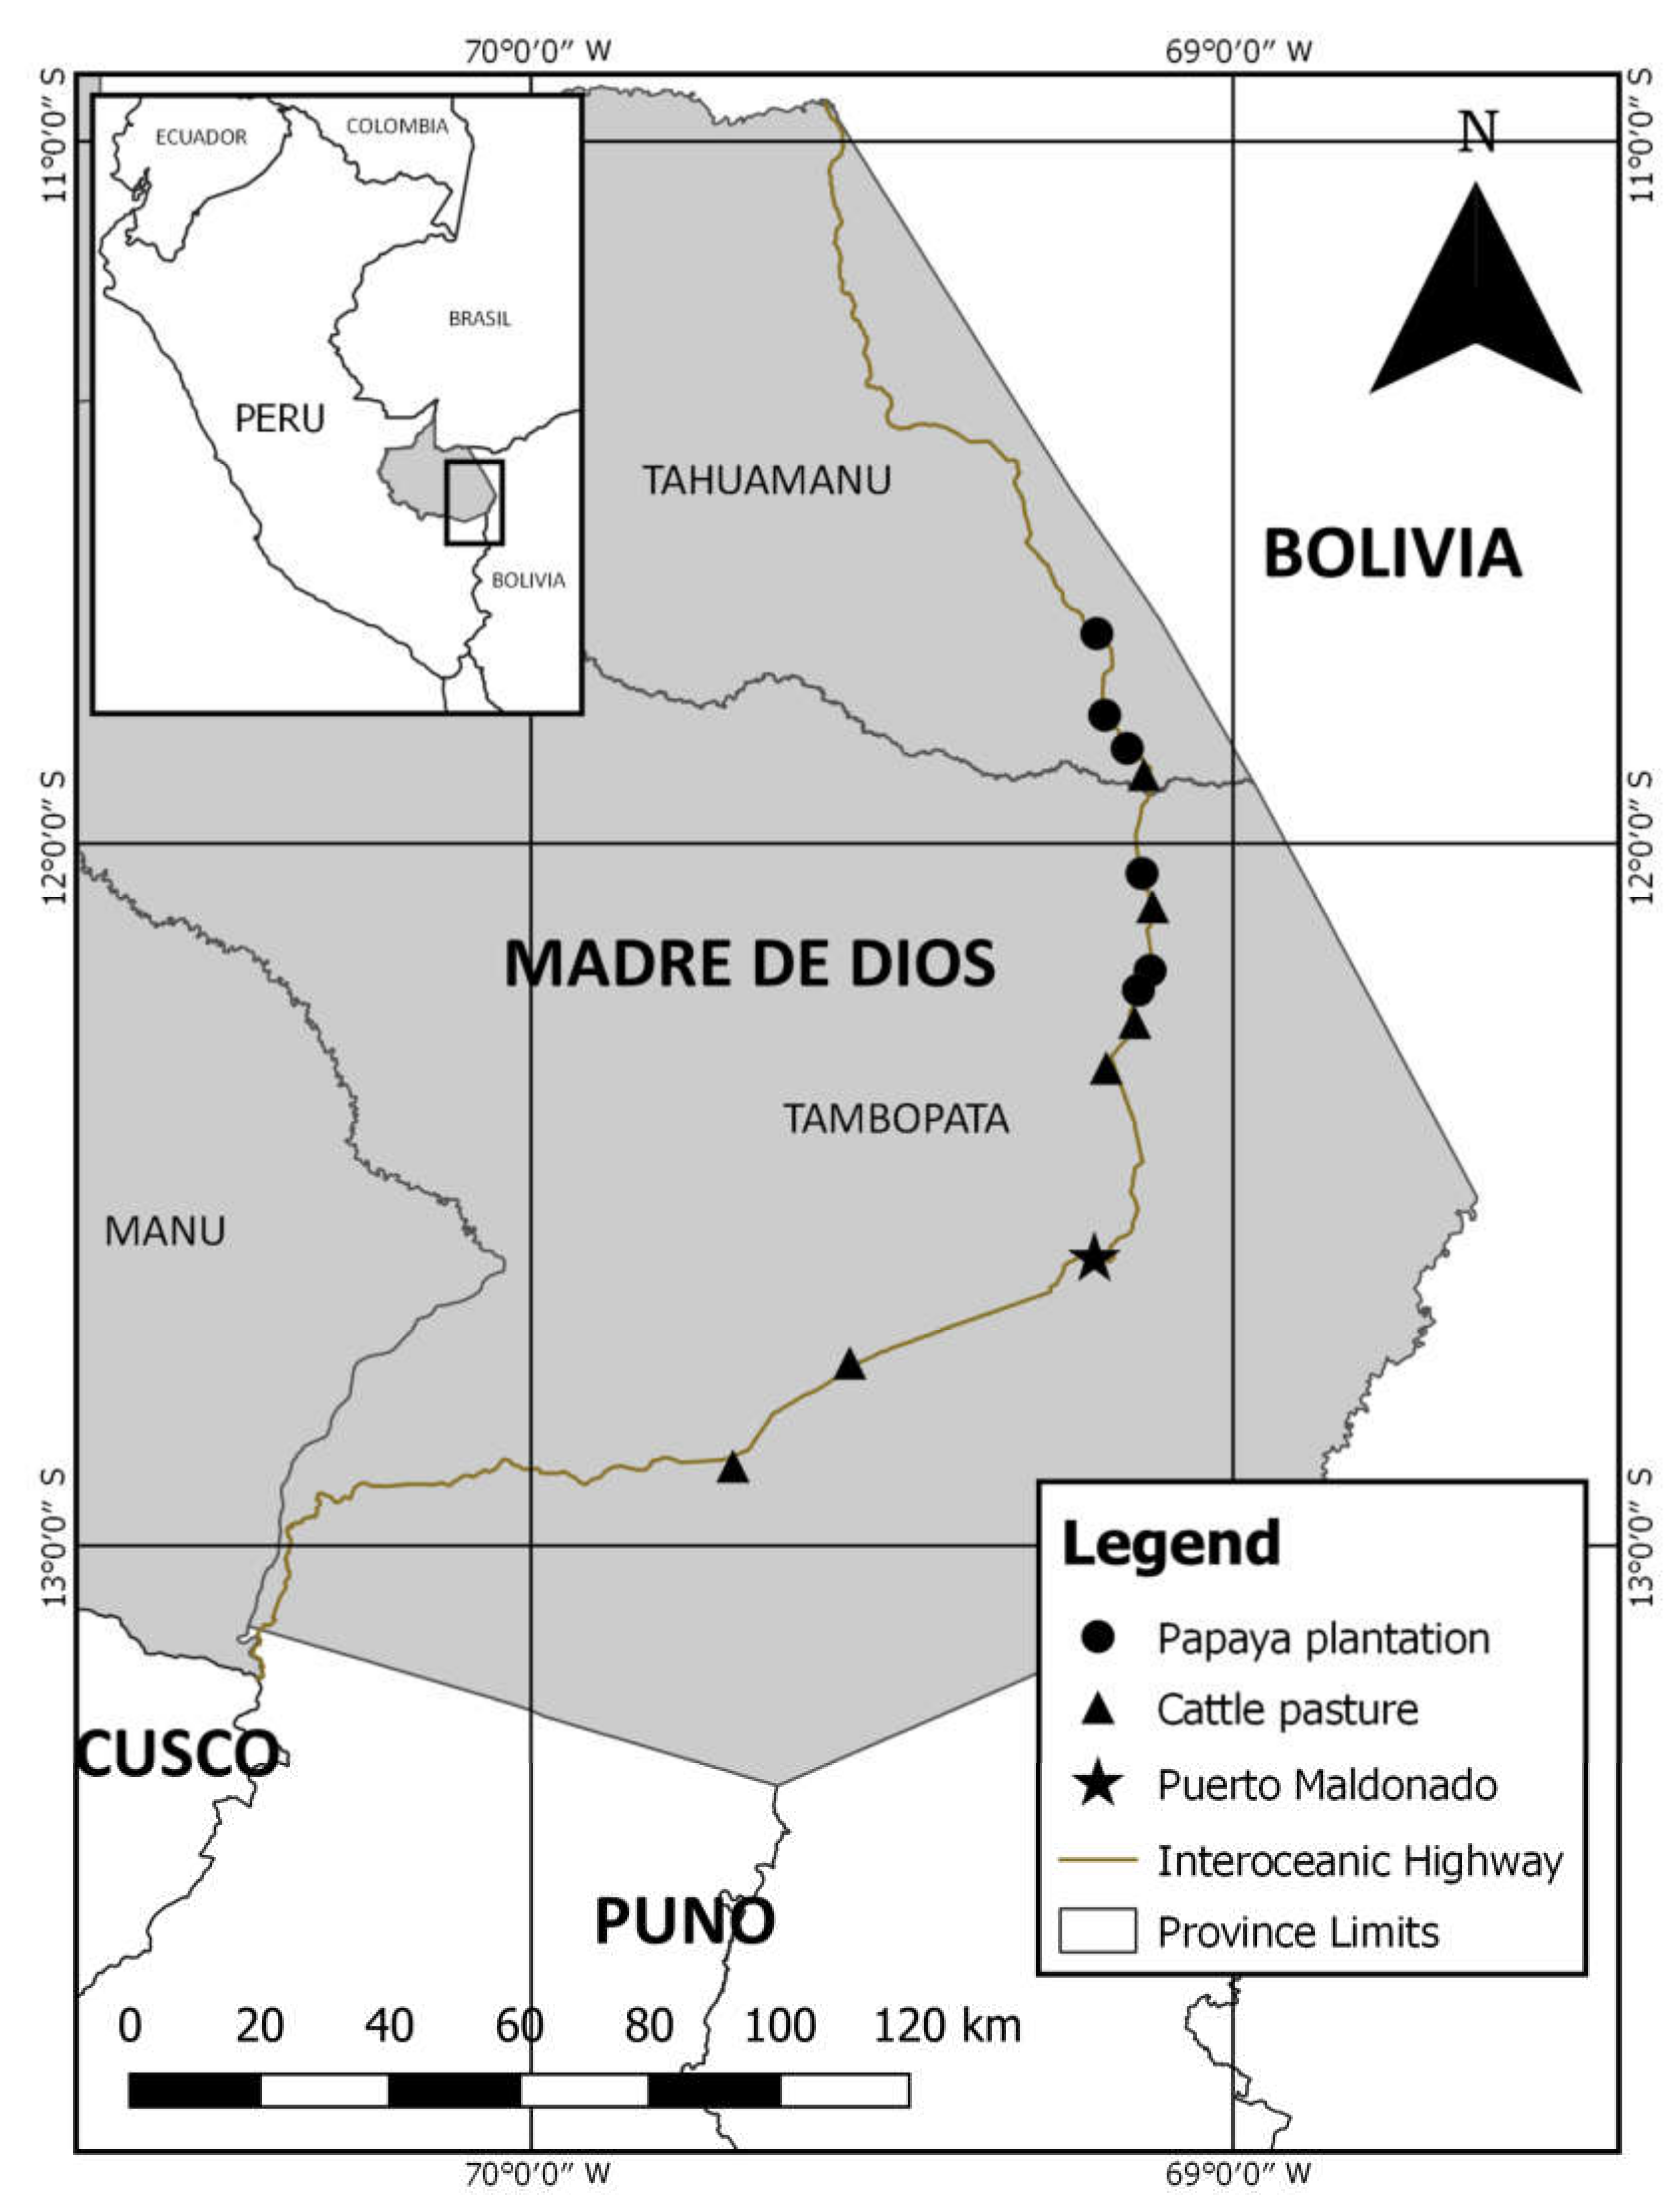
2.1. Sampling Location

We worked in the Amazon forests of southeast Peru in Madre de Dios Department in the districts of Las Piedras, Iñambari, Laberinto in the Tambopata Province and the district of Tahuamanu in Tahuamanu Province between latitudes 12°53′19.9″ S and 11°42′0.5″ S and longitudes 69°42′44.86″ W and 69°11′34.01″ W at about 200 m a.s.l.

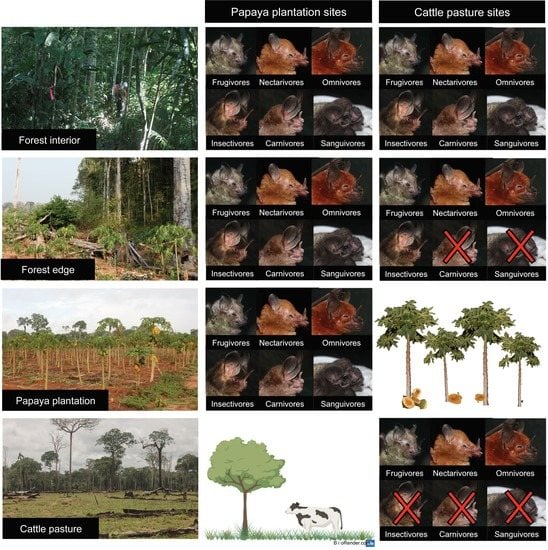
2.2. Sampling Design

We sampled two kinds of mosaics characterized by forest adjacent to agricultural land dominated by either papaya plantations or cattle pastures. These agricultural land uses were among the most widespread land use types in Madre de Dios [52]. In MDD, an estimated 5.3% has been converted to agriculture, pasture and herbaceous vegetation [52], whereas in the province of Tambopata in MDD, estimates reveal 5% of its extension corresponds to agricultural land, and 7% to pastures [53]. The conversion to papaya plantations in the region is relatively new and Finer et al. [39] report that in 2015, 204 ha were deforested for papaya in MDD. We worked in sites with the following characteristics: (1) agricultural land that was either cattle pasture or papaya plantation; (2) sites located adjacent to the Interoceanic Highway and next to continuous forest in “good” condition (i.e., not fragmented or severely degraded by logging, mining, etc.); (3) agricultural lands were always adjacent to the highway; the distance between forest and the Interoceanic Highway was at least 300 m and up to 1440 m depending on the site; and, (4) forest edge at agricultural boundaries that was distinct (i.e., sharp borders with abrupt changes in vegetation). All sites were separated by at least 4 km and, overall, sites spanned a total linear distance of approximately 170 km (Figure 1). Here we use the concept provided by Murcia in 1995 [54] to define edge as the interface between two adjacent ecosystems, in this case forest and agricultural land. Sampling of forest edges included 12 m on each side of the edge, i.e., into the forest interior and into the agricultural land. In 2016 we established 12 sampling sites in agricultural-forest mosaics, six for each agricultural land type (hereafter site category). We assume sampling sites are independent, agricultural activities in the sampling sites are representative of production activities that take place in the study region, and they all have the same impact of the presence of the Interoceanic Highway. We obtained landowner permission to access and sample each site. Since we looked for site-specific characteristics and required access permission from landowners, site selection was not randomized. Fieldwork on bats at each site occurred during two visits in the 2016 dry season (first visit between May and August, second visit between September and November), and one visit during the 2017 dry season (June–July); the latter visits only occurred in papaya sites due to logistical constraints. In 2016, time between the first and second visit per site were separated by a minimum of 2.4 months and a maximum of 3.8 months. Since we have different sampling efforts between papaya and cattle pasture sites, we examined the potential bias by conducting analyses using only 2016 data, as well as using 2016–2017 data. As we found no qualitative differences in our results, we report here the results obtained using the complete dataset (2016–2017). We tested for an effect of transect distance to the Interoceanic Highway on diversity indices and assemblage composition (Appendix A), and did not find evidence of strong effects (p-value > 0.76 in all cases).
At each sampling site we established a transect in each of the three different vegetation types: forest interior, forest edge and agricultural land (papaya plantation or cattle pasture) (Figure 2). The distance between edge and forest transects as well as the distance between edge and agricultural land transects was 200 m; transects in the different vegetation types ran parallel and their length was –300 m. Along each transect we placed 5 sampling locations separated by approximately 70 m.

2.3. Bat Captures

We sampled bats using mist-nets. We assume that bat captures in particular vegetation types likely indicate their use of those areas [55]. Overall, bats were netted for 210 mist-net hours per study site and visit, where 1 mist-net hour equals one mist-net (12 m length by 3 m height; 36 mm mesh) open for 1 hour. Bats were captured on three consecutive nights in each sampling site per visit. We spaced visits by at least 10 weeks. We avoided sampling during inclement weather conditions and two days before and after full moon nights to minimize the effects of lunar phobia on bat activity [56]. Each night we sampled a different vegetation type from 17:30 to 23:30 (6 h). At each of the five sampling locations in each transect in forest interior and agricultural land, we placed a total of 10 mist-nets in pairs in an “L” shape (Figure 2). Along the edge transect we placed a total of 15 mist-nets in five sets of three nets in “T” shape (Figure 2); as this represented 50% greater effort than the other vegetation types, results for relative abundance are reported as a function of sample effort (i.e., bats captured per mist-net–hour). The difference in mist-net placement along edges responds to the need to sample bats flying both inside and outside the forest parallel to the edge, and those individuals that fly into and out of the forest.
We checked mist-nets for bats every 30 min. After removing bats from mist-nets, we placed them in individual cloth bags and took them to a temporary camp where we measured forearm length, weight, age, reproductive status, and additional measurements that were useful for species’ identification. To avoid including recaptures in the analysis, we marked individuals in a non-permanent way by clipping hair from the dorsal part of their body [22,57,58]. Species were identified in the field using identification guides and taxonomic keys [59,60,61,62]. For bat taxonomic classification, we followed Gardner [60] with modifications for Gardnerycteris crenulatum (before Mimon crenulatum), Sturnira giannae (before Sturnira lilium), and Tonatia maresi (before Tonatia saurophila) [63,64,65]. Individuals that could not be identified in the field were collected and placed in alcohol for later identification by comparison with museum samples. For handling bats, we followed the guidelines provided by the American Society of Mammalogists [66]. We used standard euthanasia methods [67]. This study was undertaken with the following permits: University of Florida IACUC Study #201708351 and the Peruvian permit Resolución Directoral Regional No. 948-2016-GOREMAD-GRRNYGA/DRFFS. For further details of sampling effectiveness, see species accumulation curves in Appendix B.

2.4. Traits

We used trait information generated by Scheiner et al. [43] for bats in the Manu National Park in Madre de Dios. Traits considered (1) diet (i.e., fruit, nectar, invertebrates, terrestrial vertebrates, fish, blood), (2) foraging location (i.e., open habitat, over water, above canopy, canopy, subcanopy, understory), (3) foraging method (i.e., aerial, gleaning, hover, other), (4) body size (i.e., mass, forearm length), (5) masticatory characteristics (i.e., greatest length of the skull, condylobasal length, molar tooth row length, breadth across molars, post-orbital constriction, breadth of braincase), and (6) flight characteristics (i.e., wing aspect ratio, wing loading). For the species that lacked functional trait information we followed Cisneros et al. [29] and estimated the missing values using the least squares regression line between forearm and trait using the values for other species in the same subfamily. In the case of missing categorical trait data, we used literature references [60,68] or the data from congeneric species. Only 7.8% of species traits were estimated or replaced (i.e., 90 of 1248 traits).

2.5. Vegetation Structure and Temperature Variation

At local scales, differences in temperature (i.e., variation between minimum and maximum temperature per night) and vegetation structure may influence which species occur in different areas [29,69,70]. In order to understand whether some vegetation structure measurements and temperature variation can explain the differences found in species composition, we measured vegetation characteristics per site. We measured seven variables to describe the vegetation structure in both forest interiors and forest edges: (1) canopy height, (2) tree density (>10 cm diameter at breast height), (3) basal area of large trees (>10 cm diameter at breast height), (4) small tree density (<10 cm diameter at breast height), (5) density of lianas (>1 cm diameter at breast height), (6) foliage height index, and (7) horizontal density. Vegetation measurements were taken during the 2016 visits to sites. We also measured minimum and maximum values of nighttime temperatures. For further information on vegetation measurements and variable selection, see Appendix C.

2.6. Data Analysis

For data analyses we focused on Phyllostomidae because mist-nets provide a good representation of this family [71], whereas bats of other families more readily detect and avoid mist-nets and are known to be under-sampled using this method.

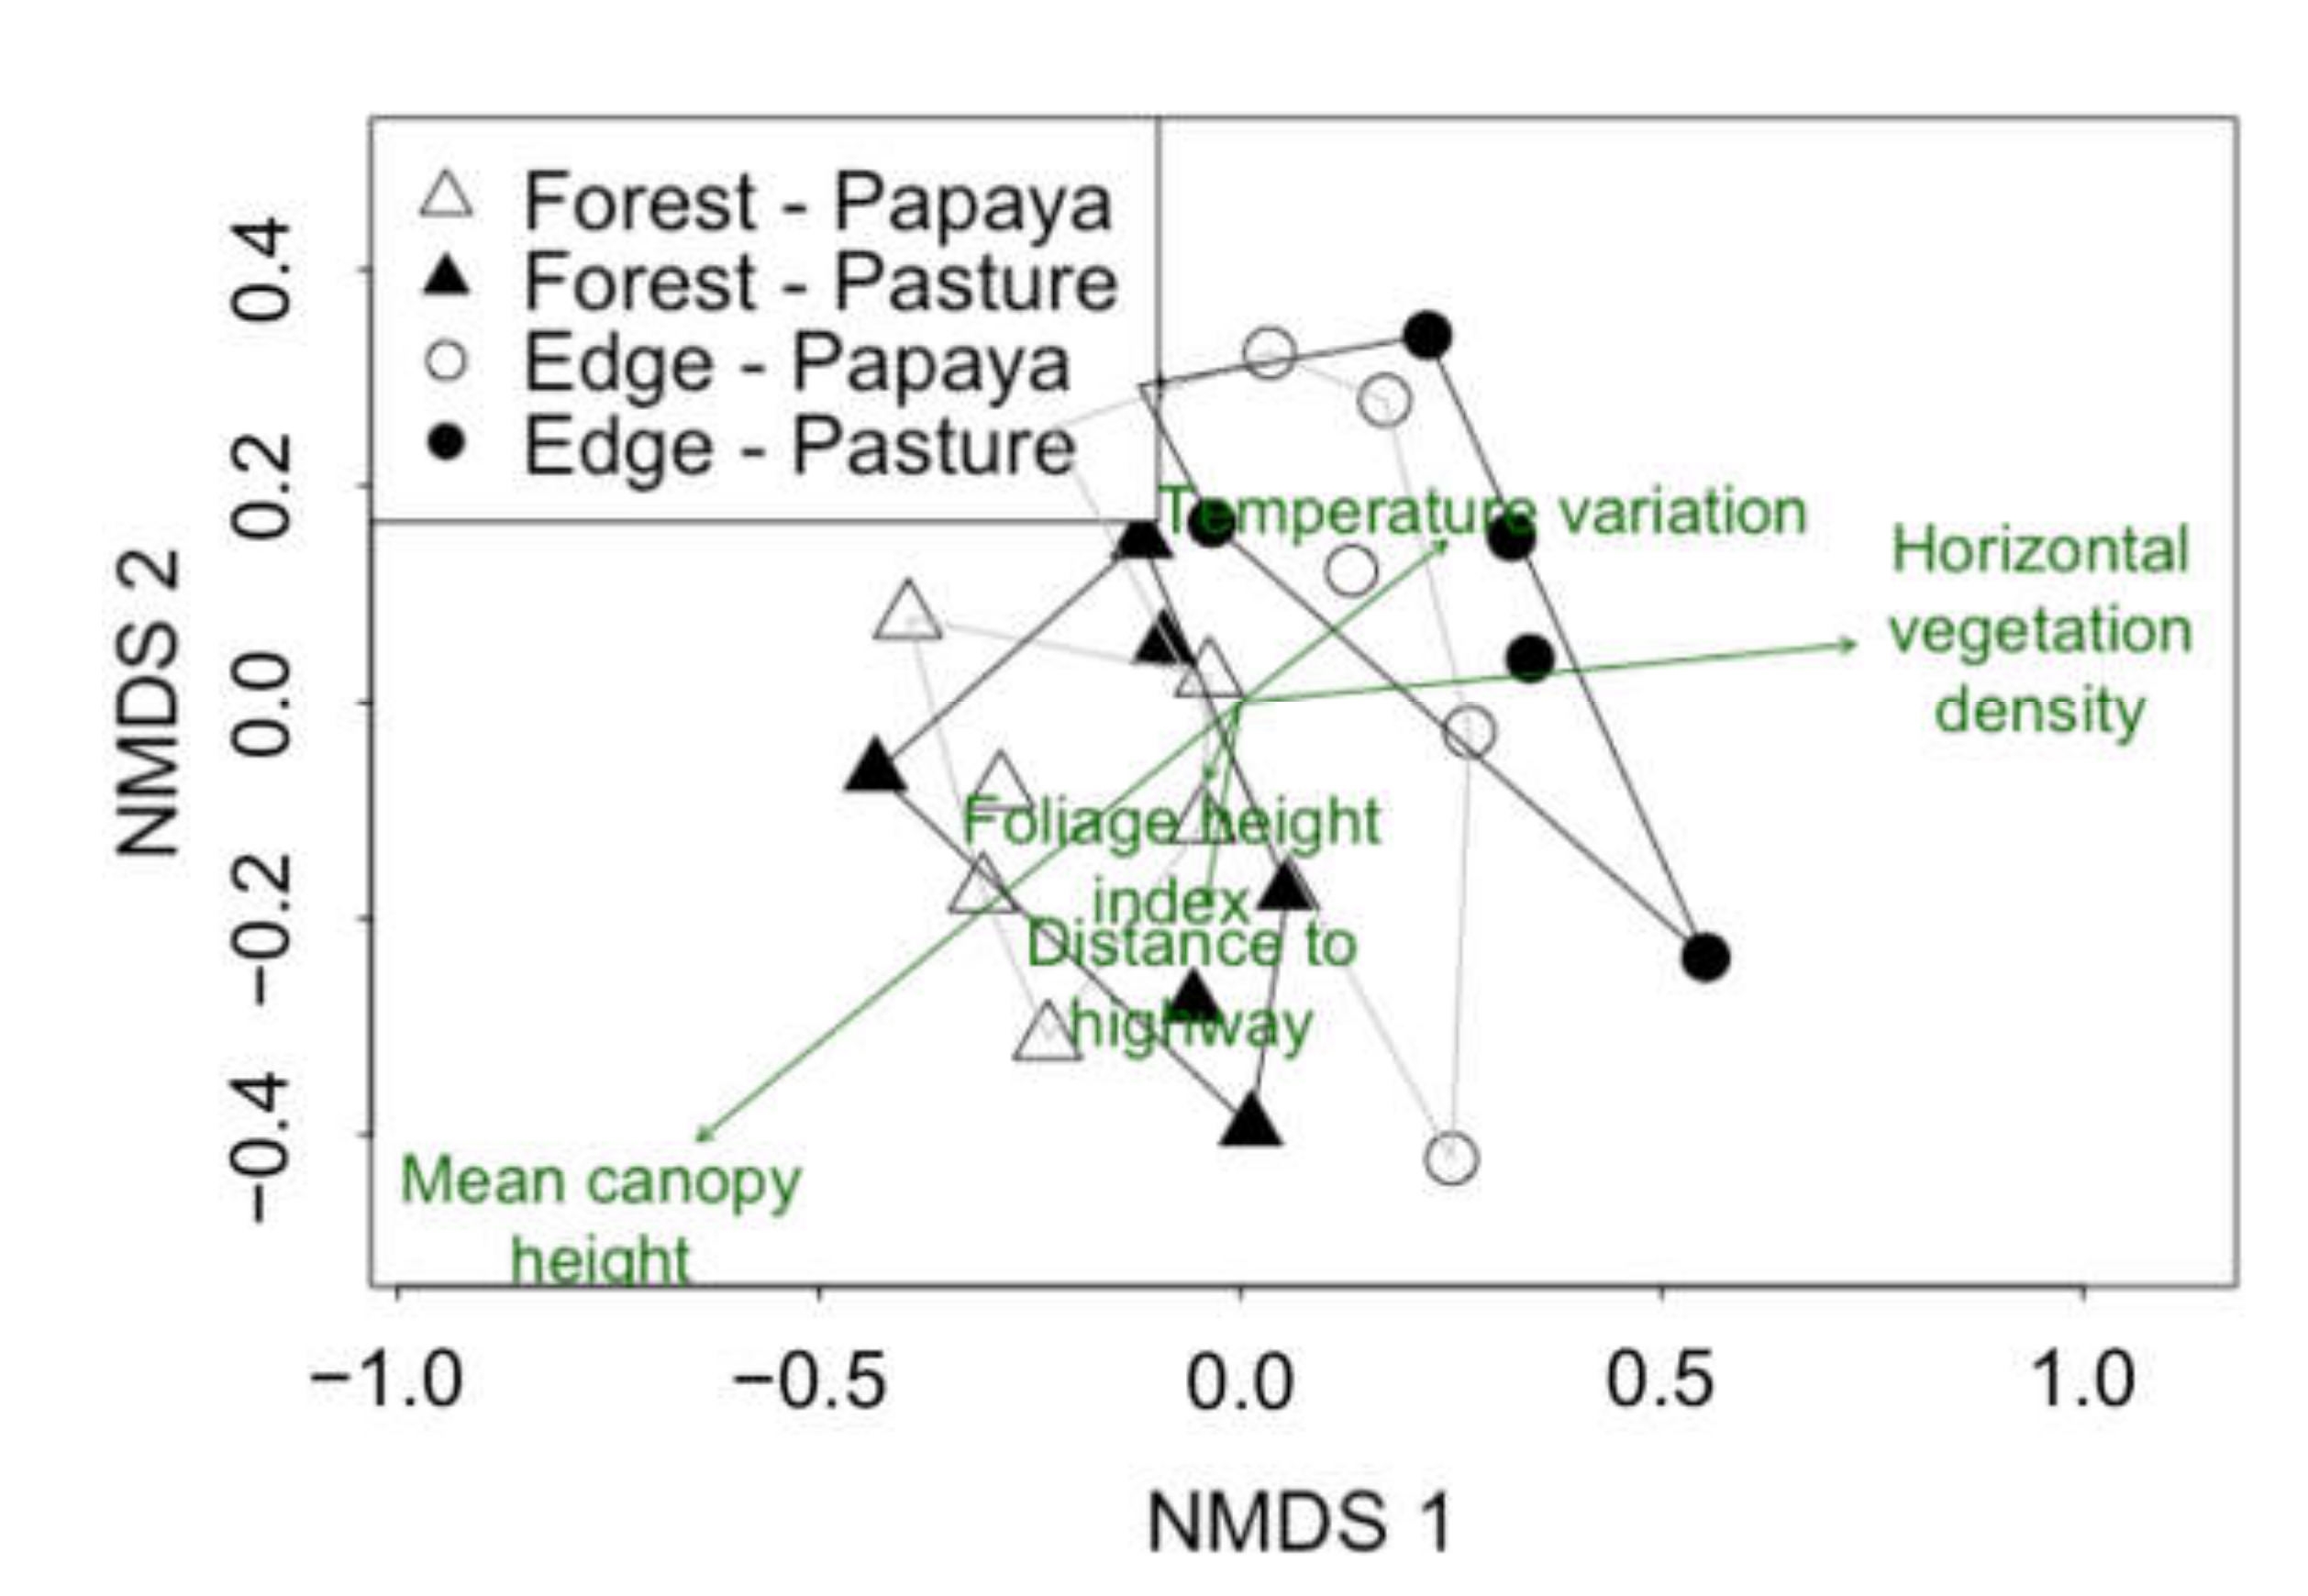
2.6.1. Effects of Agricultural Land on Composition of Bat Assemblages

To determine how agricultural activity affected bat composition in different vegetation types (forest edge, forest interior, agriculture), we used non-metric multidimensional scaling (NMDS) to analyze similarity in phyllostomid bat species composition. The matrices for these analyses had species in columns and vegetation type per site as rows; each cell contained the number of individuals captured at each vegetation type per site over all visits. We discarded species captured rarely (<5% of overall occurrence, or where present in 2 or less study transects from a total of 36). To create the dissimilarity matrix we used the Bray–Curtis method. As a first step we tested the dispersion of the data per site by evaluating the coefficient of variation (CV) in the number of individuals captured for each species. As CV exceeded 50%, we used Wisconsin double standardization [72] to transform the data where each element is divided first by its column maximum and then by the row total. To test for differences between vegetation types (agricultural land, forest interior and forest edge) between site categories and among vegetation types within site categories we used a permutational multivariate analysis of variance (PerMANOVA). We performed a Mantel test [73] using Euclidean geographic distance and assemblage similarity among sites to test whether species composition similarity was better explained by geographic distance than by other variables. We undertook the analysis in R environment. We used the packages “vegan” [74], “ade4” [75] and “MASS” [76] for NMDS analysis, “vegan” [74] and its function “adonis” for PerMANOVA analysis, and “ade4” [77] for Mantel test.
  • Influence of vegetation structure and temperature variation
We examined the degree to which vegetation structure and temperature variation explained the variation found in bat species composition using NMDS analysis between forest interiors and forest edges. We did not include agricultural land in the analysis because vegetation measurements were not made in those vegetation types. We combined bat species composition in forest interiors and edges in 12 sites with a secondary matrix that included variation in temperature, and the selected vegetation structure variables based on their variation between vegetation types and site categories (Supplementary Material).

2.6.2. Effects of Agricultural Land on Different Dimensions of Diversity

  • Taxonomic diversity
We calculated taxonomic diversity using species richness and capture rates excluding recaptures. For estimating species richness we used Jackknife 1, a non-parametric analysis, because it allows richness estimation bias reduction and is considered to be a good estimator when facing moderate variation in capture probabilities using short-term live-trapping studies, such as this study [78,79]. We used capture rates as a measure of bat relative abundance. For this we divided the number of individuals captured by the capture effort involved (individuals per 100 mist-net hour). We also show the captures rate as a function of percentage overall for species, excluding the species captured rarely across the study (<5% of overall occurrence). We used Moran’s I autocorrelation coefficient to test whether there was spatial autocorrelation among sampling sites.
We used analysis of variance (ANOVA) to examine if there was an effect of site category, vegetation type or a combined effect of vegetation type and site category (interaction) in taxonomic diversity (i.e., estimated species richness and capture rate). We performed analyses in R environment [80] and relied on the R package “vegan” [74] and its function “specpool” for estimating Jackknife 1 index. We used the package “stats” [80] and function “aov” for the ANOVA. For Moran’s I test, we used the package “ape” [81] and function “Moran.I”.
  • Functional diversity
We defined functional diversity following Scheiner et al. [43] using functional trait dispersion [1D(TM)] that measures the effective number of functionally distinct species taking into account species richness; the measure ranges between 1 and total number of species in all sites combined. We also used evenness of dispersion [1E(T)], which measures the extent to which species are equally dispersed in trait space; this measure ranges from 0 to 1, with the value of 1 occurring when the “effective number of functionally distinct species is close to the maximum” [41].
First, we standardized the continuous traits within each group using Wisconsin double standardization to equalize emphasis among traits and among species. We estimated the functional dissimilarity matrix for each group of traits using Jaccard dissimilarity for categorical variables, and Manhattan or mean character difference for continuous variables. We estimated the combined distance matrix averaging all the group-specific distances as done by [43]. We used this matrix to estimate the 1D(TM) and 1E(T) per vegetation type at each site.
Calculations were made in R Development, where we used the packages “vegan” [74] and the function “vegdist” to estimate the dissimilarity matrices. For 1D(TM) and 1E(T) we used a code and functions created by Shan Kothari (https://github.com/ShanKothari/DecomposingFD).
Similar to what we did for taxonomic diversity, we used Analysis of Variance (ANOVA) to examine if there was an effect of site category, vegetation type or a combined effect of vegetation type and site category (interaction) in functional diversity metric.
We also estimated guild richness following the classification by Kalko [82] based on foraging modes (aerial or gleaning), diet (carnivores, frugivores, insectivores, nectarivores, omnivores, piscivores, or sanguivores), and preferred habitat (background cluttered space, highly cluttered space, uncluttered space).
Data used for this study is deposited and available at https://ufdc.ufl.edu/l/IR00011163/00001.

3. Results

We accumulated 6045 mist-net hours over 87 capture nights (51 in papaya sites, 36 in pasture sites) during the 2016 and 2017 field seasons. We captured 3541 individuals, not including 95 recaptures (2.7% of the total), from 43 species of the family Phyllostomidae. Four species—Artibeus planirostris (1366 captures), Carollia perspicillata (935), Artibeus lituratus (289 captures), and Carollia brevicauda (216)–accounted for 79.2% of the total captures.
From the total captures, we collected 29 specimens that could not be identified in the field, which were deposited in the collection of the Centro de Ecología y Biodiversidad (CEBIO) in Lima, Peru. Individuals captured for all species registered and specimens collected during the present study are shown in Table 1.

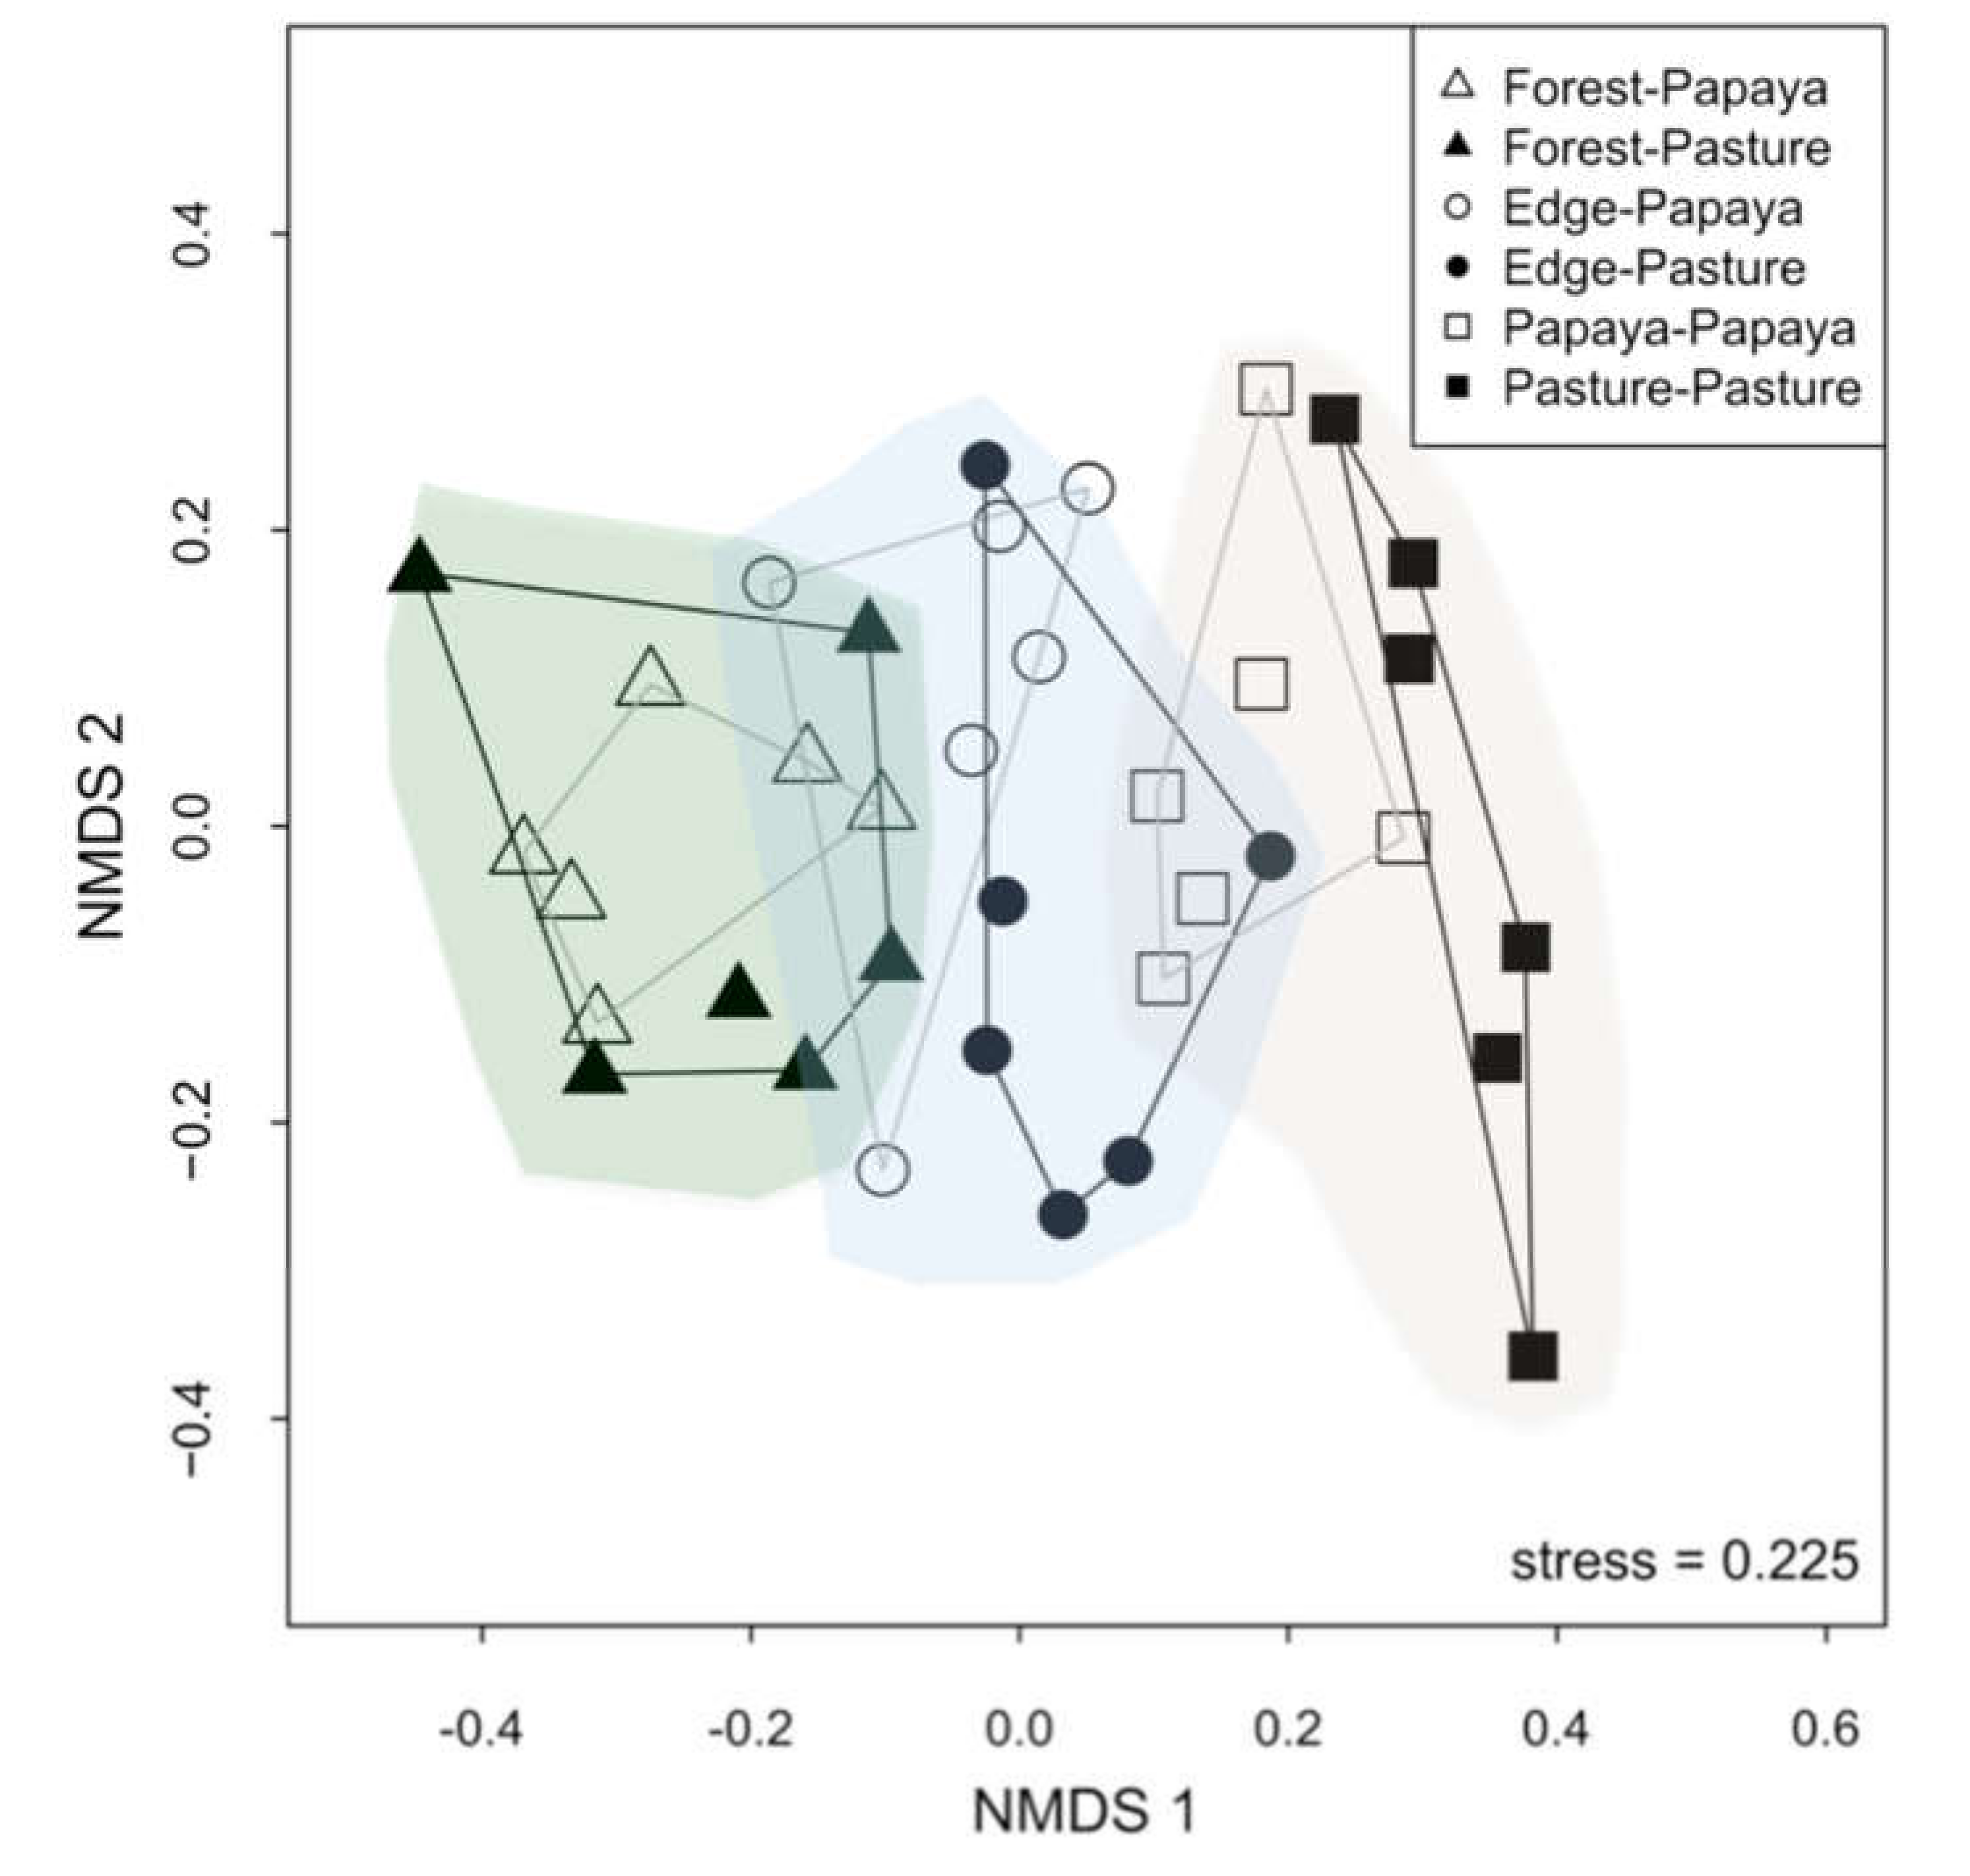
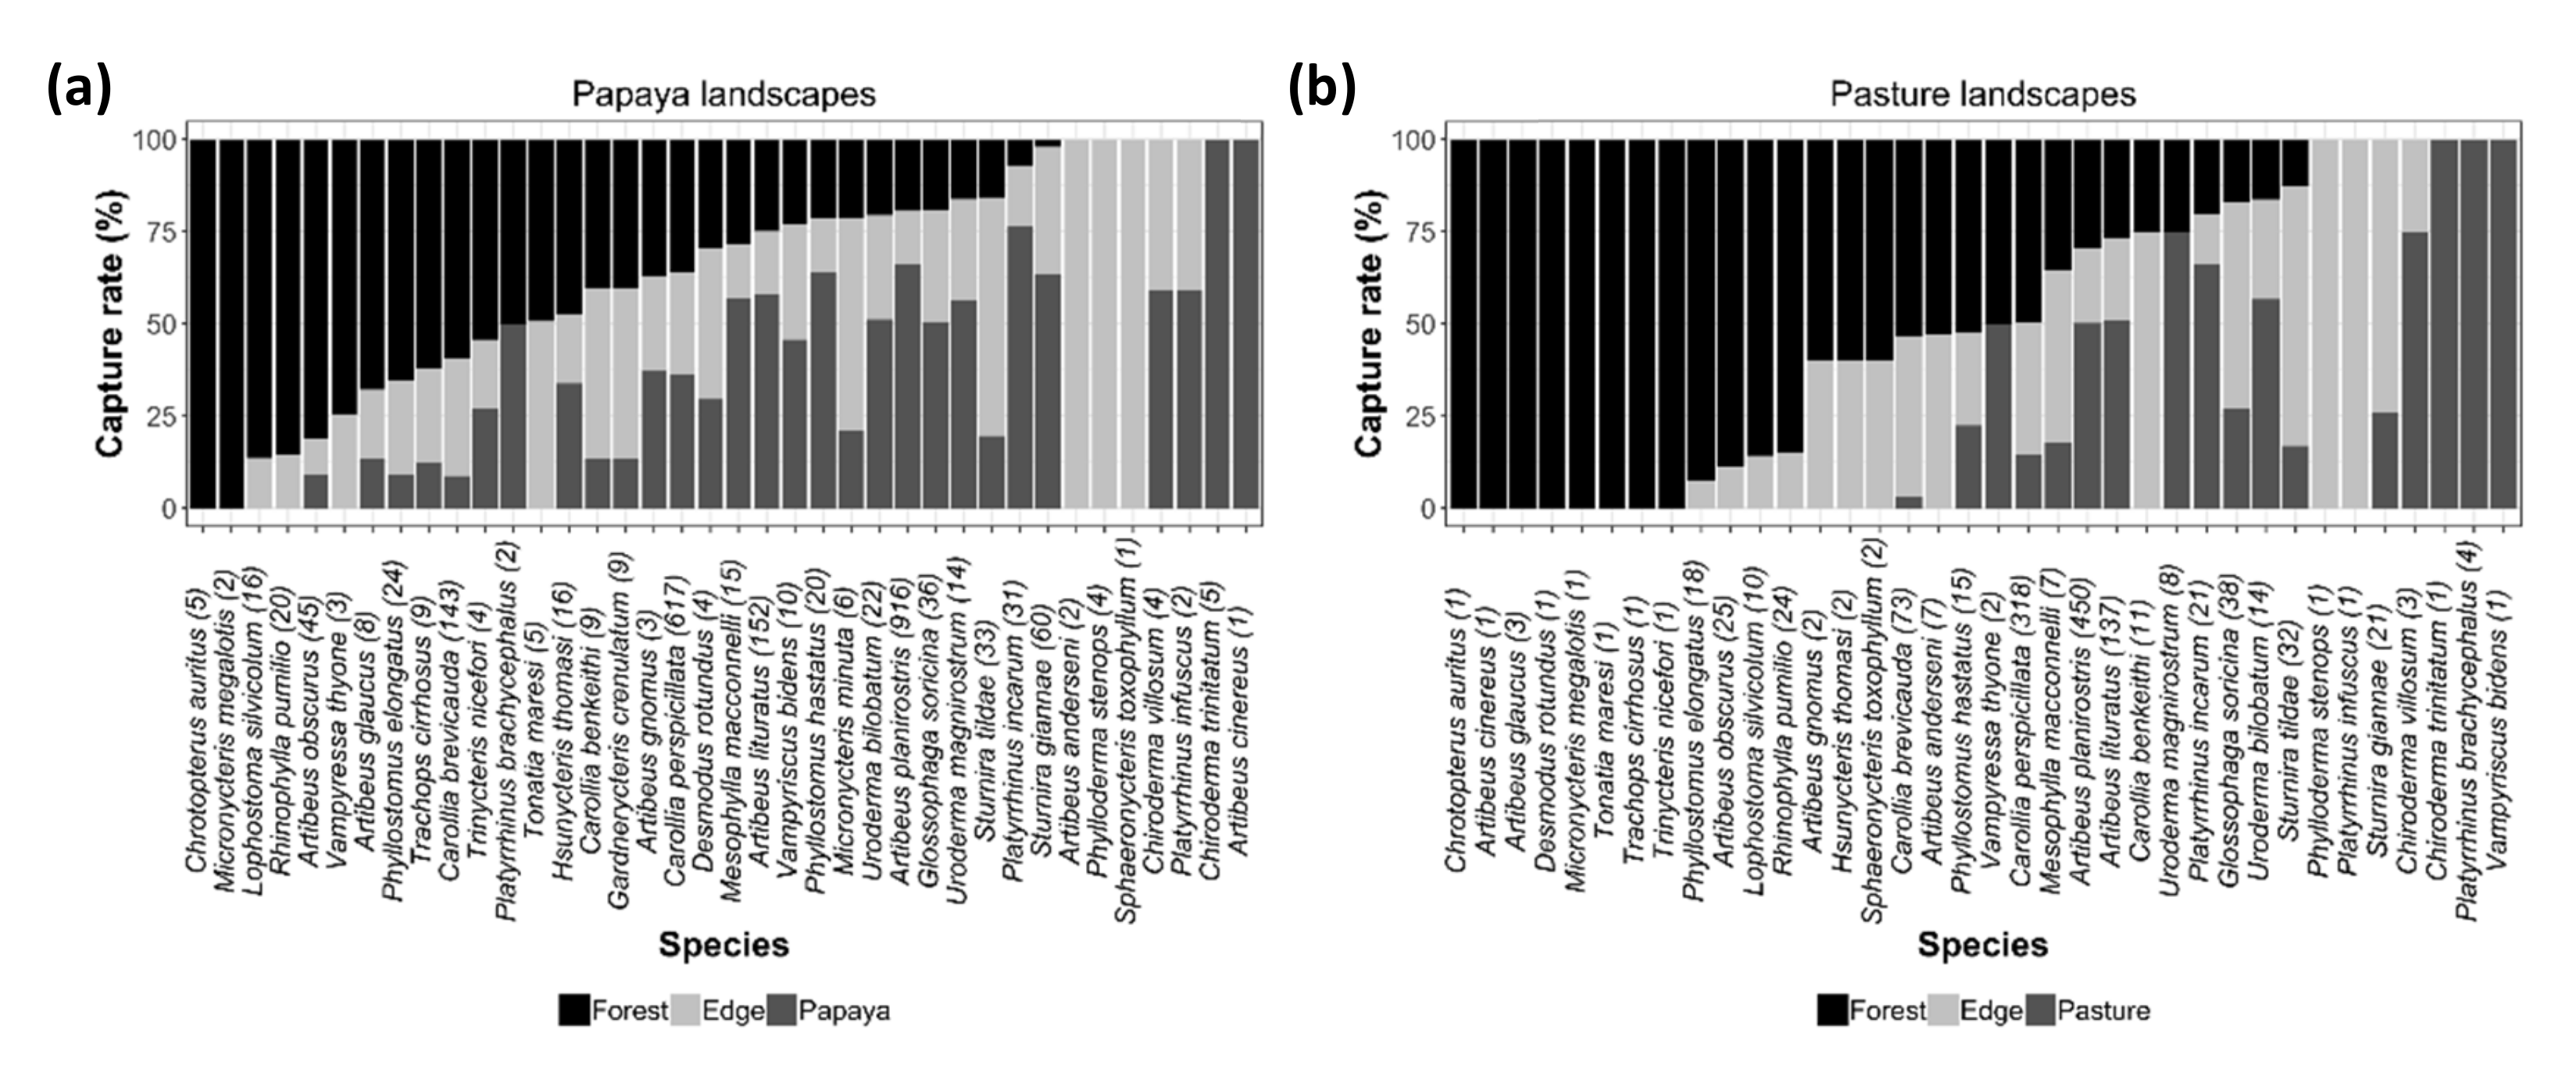
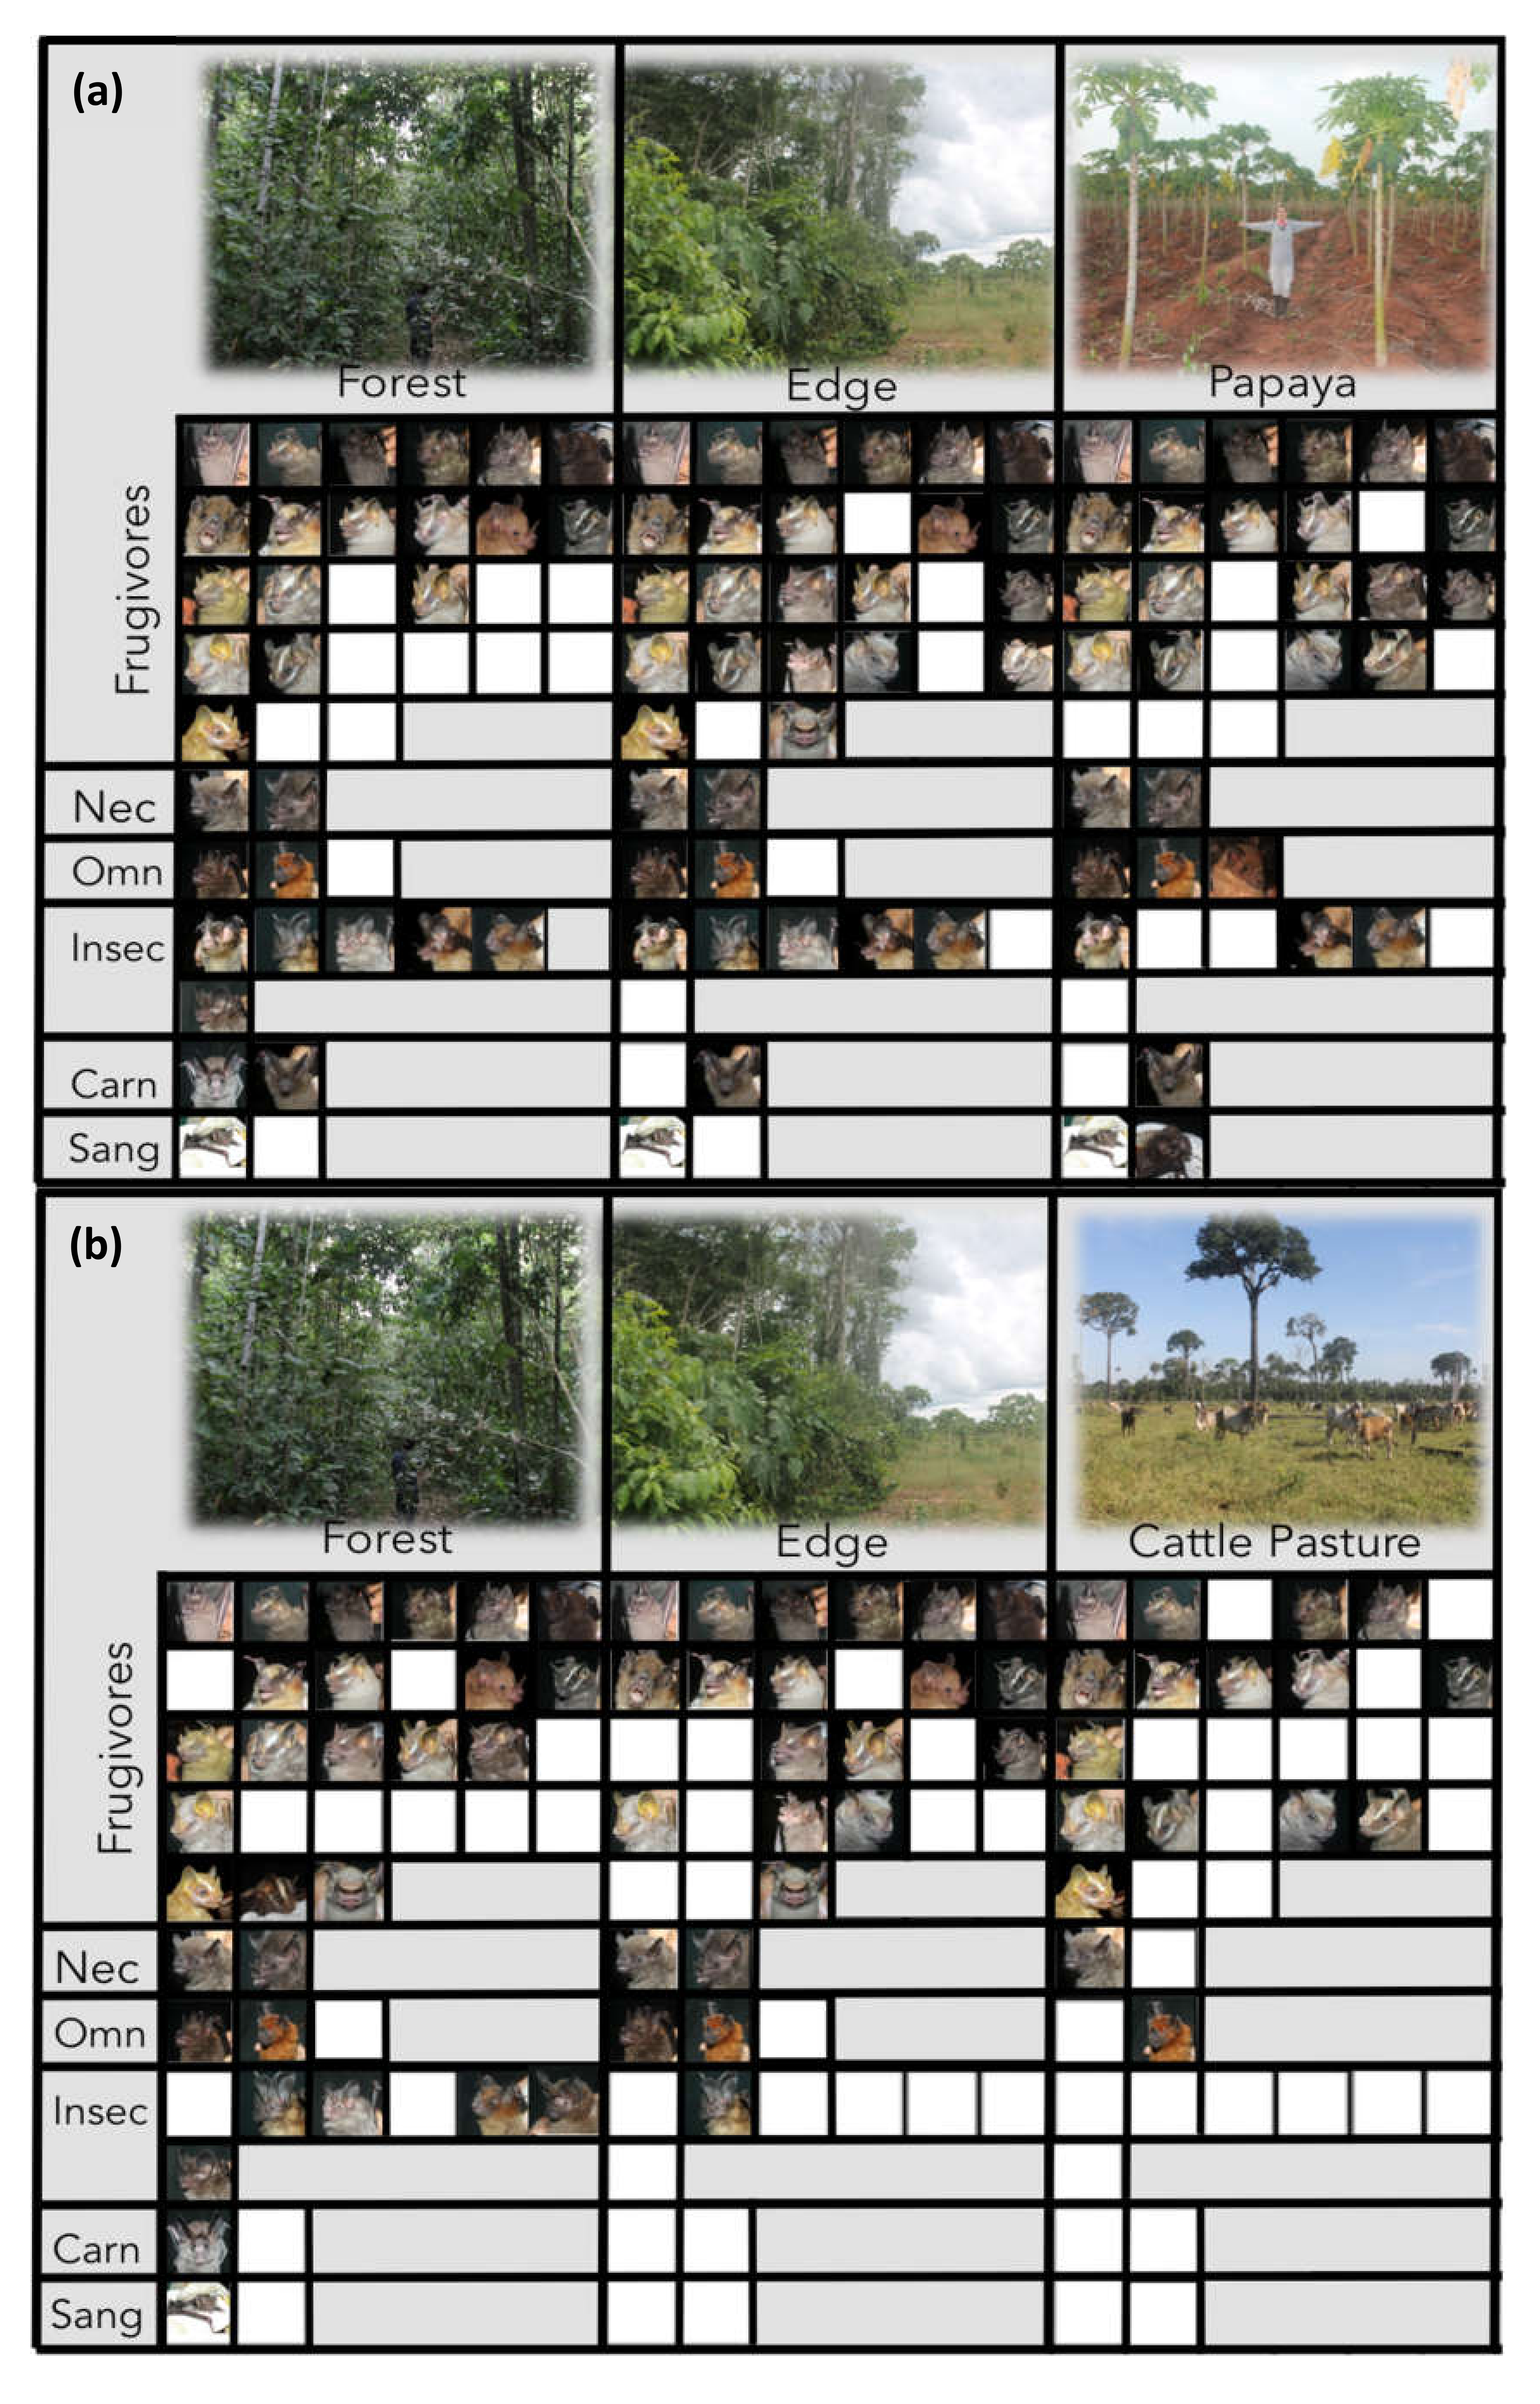
3.1. Effects of Agricultural Land on Composition of Bat Assemblages

We did not find evidence to support that agricultural land present in a site has an effect on composition of bat assemblages within vegetation types. We found no differences in species composition between forest interiors or forest edges from both site categories, neither between both agricultural land types (PerMANOVA forest interiors F = 0.844, p-value = 0.639; forest edges F = 1.468, p-value = 0.099, agricultural land F = 1.554, p-value = 0.119; Figure 3). However, vegetation type was a much better predictor of species composition than agricultural land present in a site. Species composition is largely separated by vegetation types along the first NMDS axis (PerMANOVA papaya sites: forest interior and forest edge F = 2.11, p-value = 0.013, forest edge and papaya F = 1.807, p-value = 0.048, forest interior and papaya F = 4.779, p-value = 0.002; cattle pasture sites: forest interior and forest edge F = 2.271, p-value = 0.004, forest edge and pasture F = 2.912, p-value = 0.002, forest interior and pasture F = 4.319, p-value = 0.002; Figure 3). We found no evidence that geographic distance among sites explained a similarity in composition of bat assemblages (Mantel test, correlation = 0.22, p-value = 0.083).
To examine the importance of vegetation structure and temperature variation in explaining finer-scale (i.e., among replicate) differences in bat composition, we used mean canopy height, foliage height index, horizontal density and variation in temperature as these variables exhibit variation as a function of vegetation type and site categories (see Appendix C).
Horizontal vegetation density and mean canopy height were important in explaining differences in bat species composition among forest edges and forest interiors. Forest edge assemblages of bats, relative to forest interior bats, were associated with greater variation in nightly temperatures, thicker vegetation, lower canopy heights and simpler vertical structure (Figure 4, Table 2).

3.2. Effects of Agricultural Land on Different Dimensions of Diversity

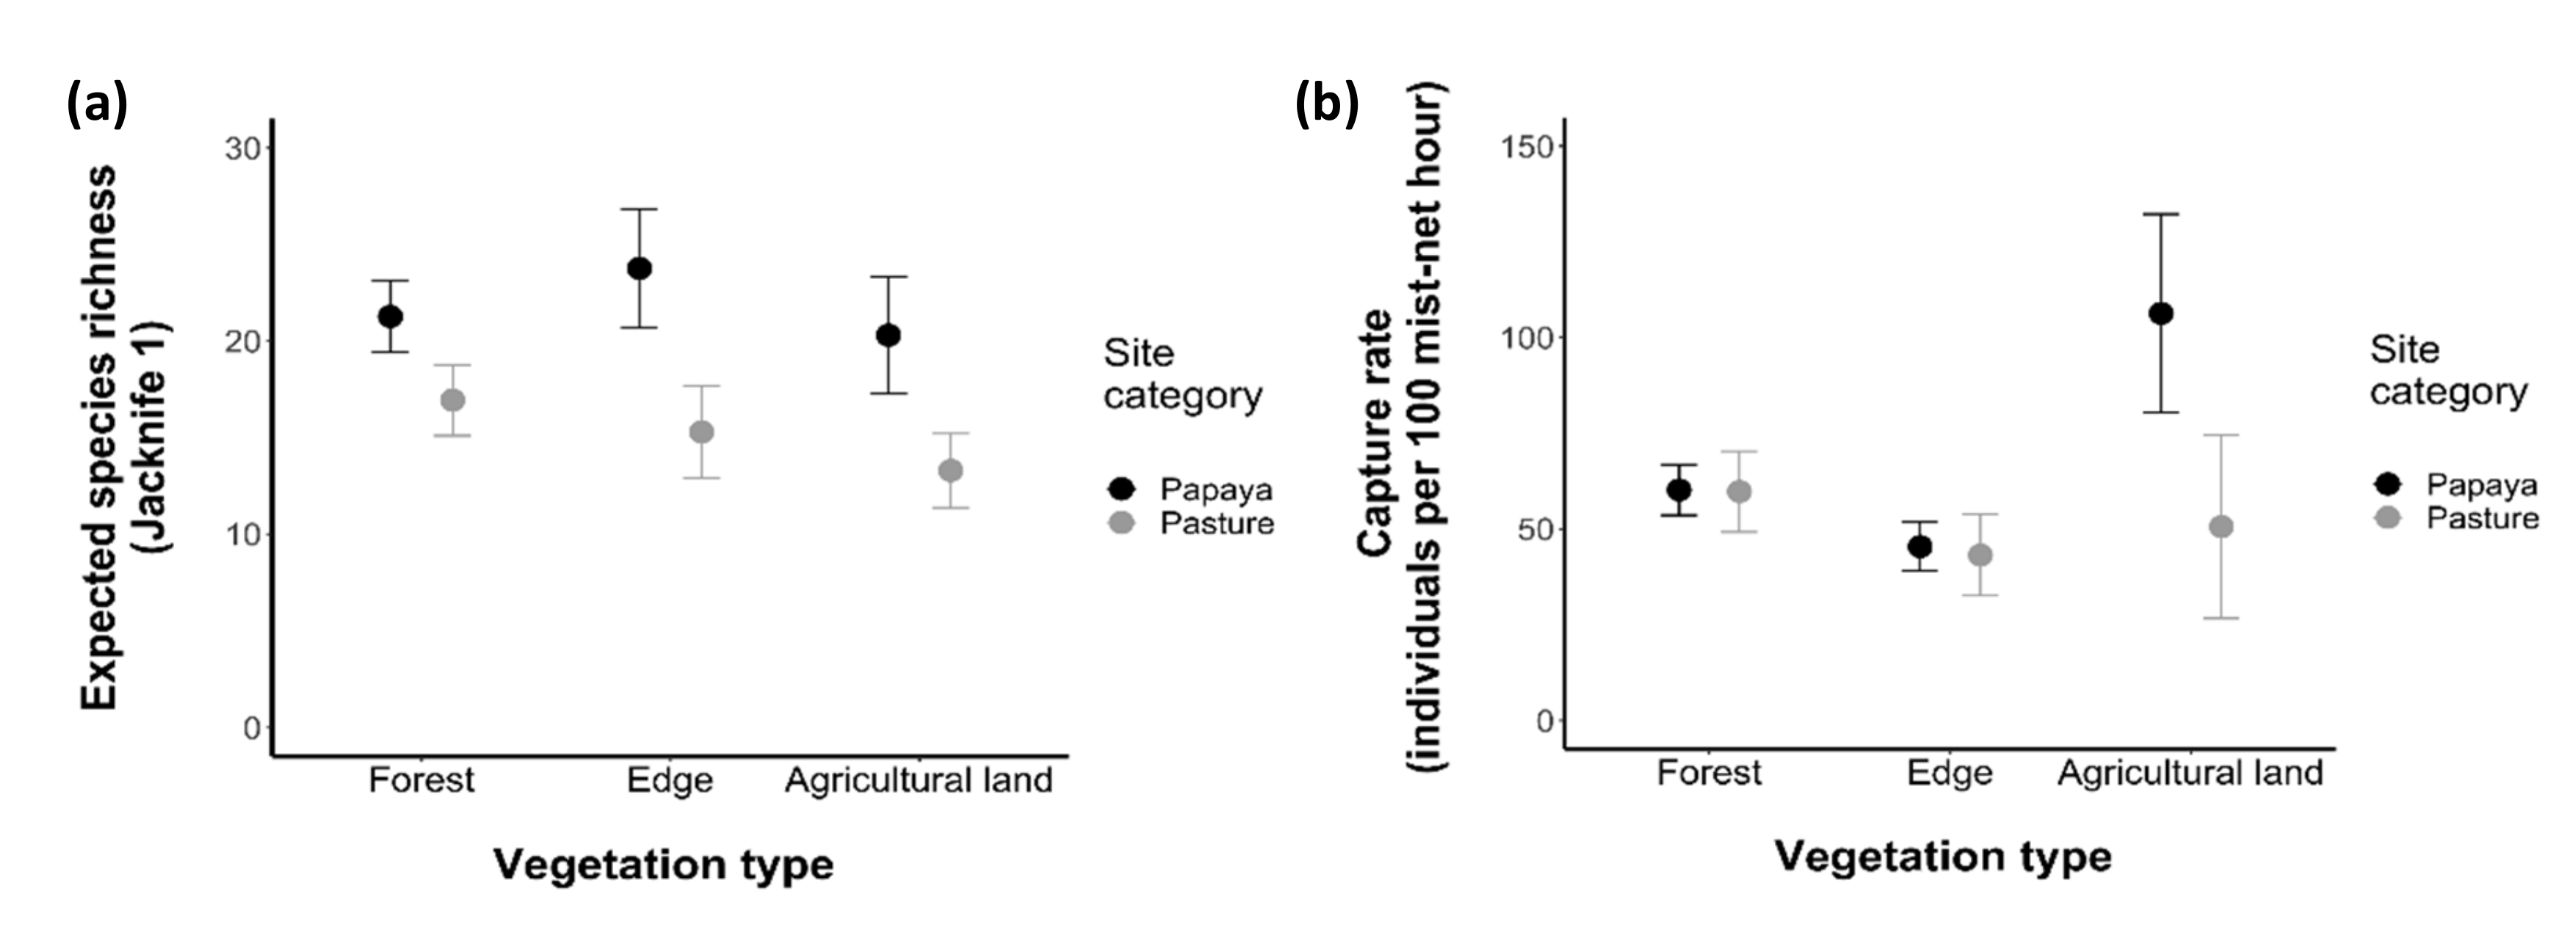
3.2.1. Taxonomic Diversity

Sites with papaya plantations showed similar total species richness but higher total captures (37 species and 36.03 individuals per 100 mist-net hour or 1270 captures) than cattle pasture sites (35 species and 35.55 individuals per 100 mist-net hour or 896 captures). Agricultural land in papaya plantation sites showed highest overall estimated species richness, while agricultural land in cattle pasture sites showed lowest overall estimated species richness (Table 3). We found no evidence of spatial autocorrelation in estimated species richness and capture rates among sampling sites per vegetation type, since the observed Moran’s I were not significantly different than the expected value (richness: forest interior p-value 0.13, forest edge 0.855, agricultural land 0.426; capture rates: forest interior p-value 0.349, forest edge 0.787, agricultural land 0.474).
Regarding our expectation that papaya plantations sites will show greater taxonomic diversity than cattle pasture sites, we found that expected species richness in vegetation types of papaya plantation sites was higher than vegetation types within cattle pasture sites (Figure 5a). Mean capture rate did not differ among vegetation types or between site categories, with the exception of agricultural land, with higher values in papaya plantations than cattle pasture (Figure 5b).
Bat species were not represented evenly among the various vegetation types. Among the species registered with more than 5% of overall occurrence, Chrotopterus auritus and Micronycteris megalotis were only found in forest, while Lophostoma silvicolum and Rhinophylla pumilio were mainly found in forest interior. In contrast, species found primarily in papaya plantation were Chiroderma trinitatum, Artibeus cinereus and Platyrrhinus incarum. In cattle pasture, Chiroderma trinitatum, Vampyriscus bidens and Platyrrhinus brachycephalus were only captured in pasture, while Uroderma magnirostrum and Chiroderma villosum were captured more frequently in pasture than forest interior and forest edge (Figure 6).
We tested whether site category, vegetation type, or their interaction explained taxonomic diversity (species richness and capture rates) and found only evidence for effects of site category (ANOVA F = 11.266, df = 1, p-value = 0.002, Table 4) on species richness (Table 4). Specifically, we found estimated species richness (Jackknife 1) to be higher in papaya sites than in pastures sites.

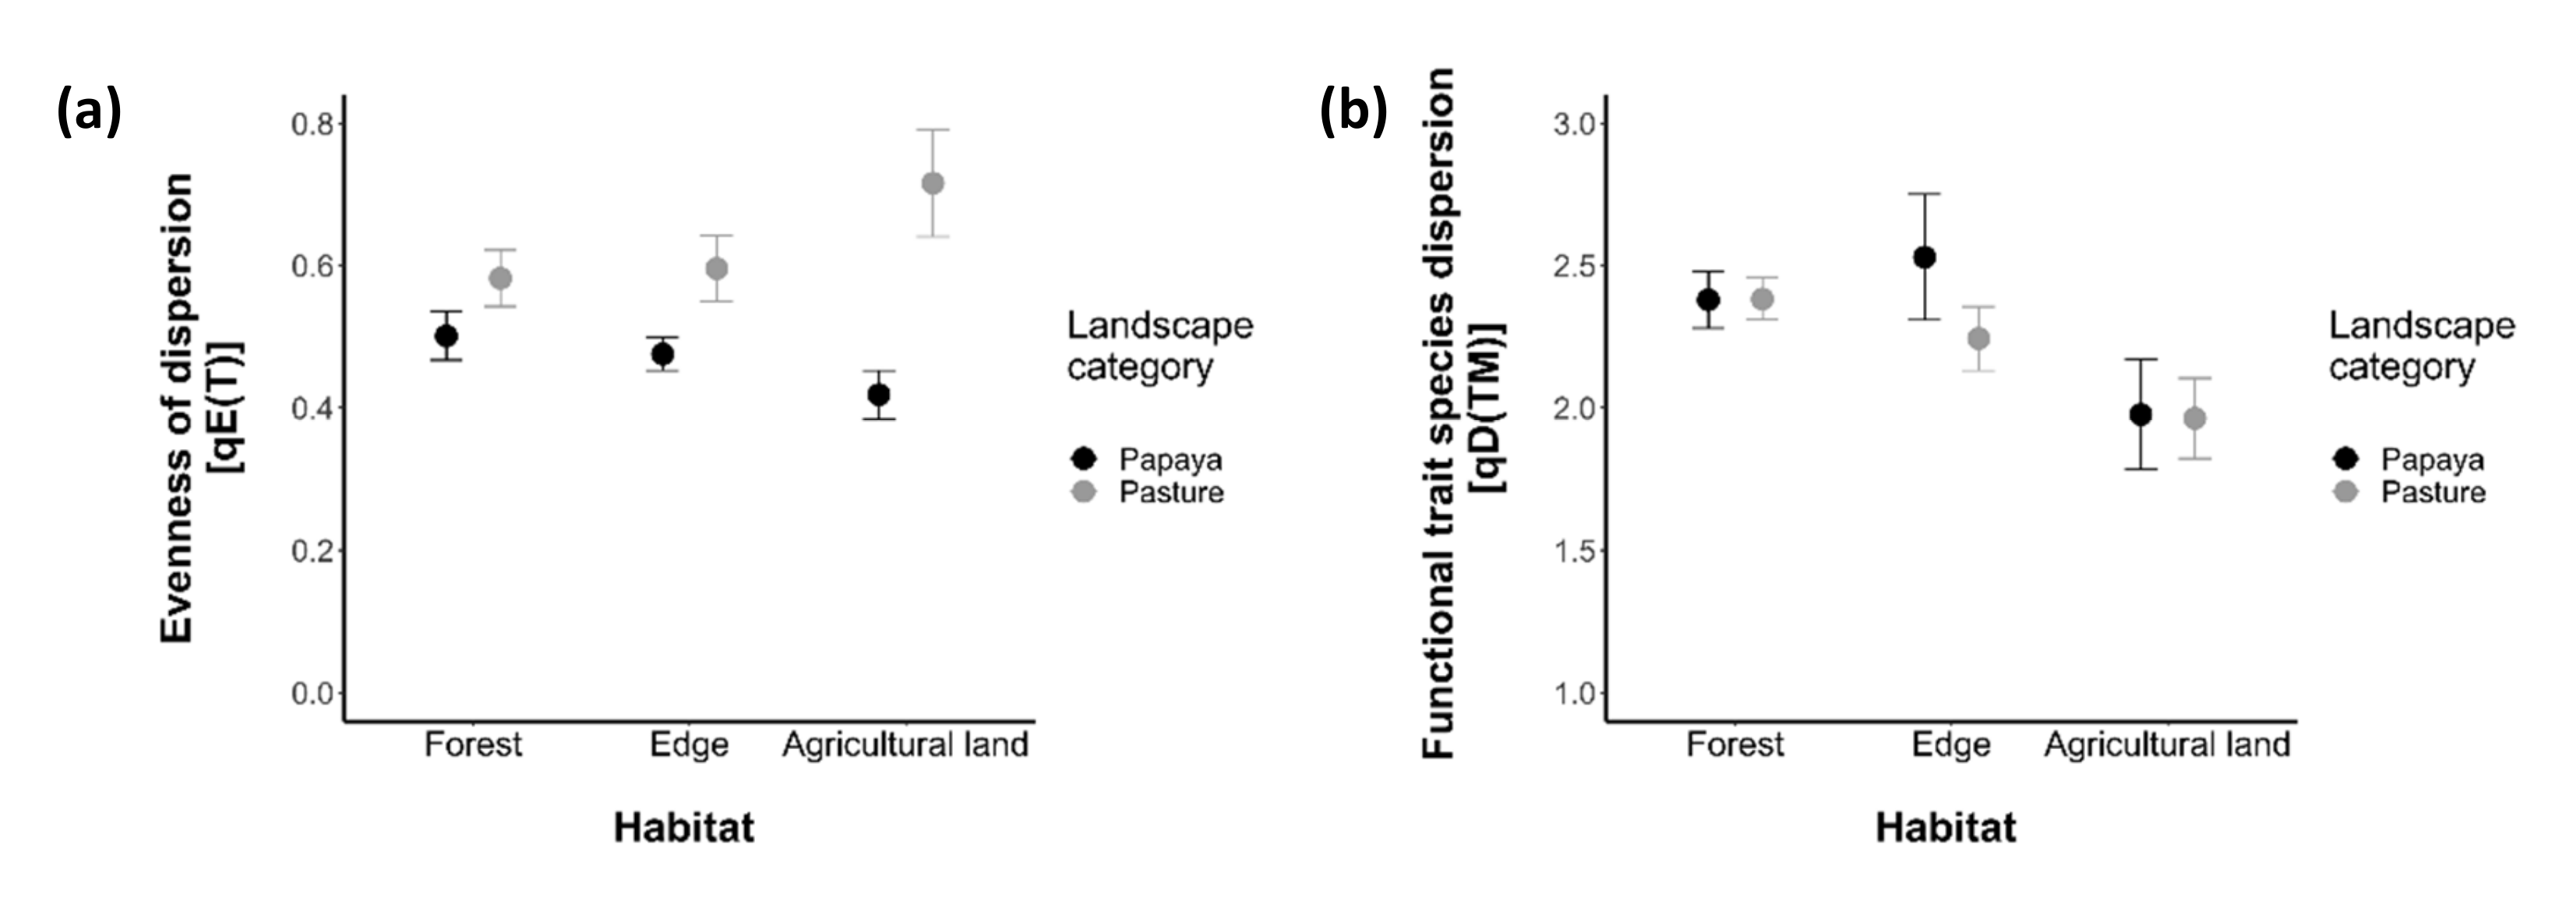
3.2.2. Functional Diversity

Functional diversity, measured by the guild richness and species per guild, was affected by the type of agricultural land present in the site. We found greater losses in guild richness in cattle pasture sites and in the cattle pasture land when compared to papaya plantation sites. According to Kalko [82] the species registered in the study area belong to six guilds captured during the study: highly cluttered space-gleaning frugivore, -gleaning nectarivore, -gleaning omnivore, -gleaning insectivore, -gleaning carnivore, -gleaning sanguivore (hereafter we will use the dietary characteristic for referring the guilds, i.e., frugivore, nectarivore, omnivore, insectivore, carnivore, sanguivore).
Forest between papaya plantation and cattle pasture sites showed a similar number of species per guild. Chrotopterus auritus, a carnivore, was only registered in the forest. However, the edges of cattle pasture sites showed higher losses of species of frugivores, insectivores, carnivores and sanguivores, compared to edges in papaya plantation sites. Some frugivorous bats captured in papaya plantations had papaya pulp in their mouths or feces, indicating consumption of these fruits. When comparing agricultural vegetation types, we captured fewer individual nectarivores and frugivores in the cattle pastures than in the papaya plantations (Figure 7). Moreover, insectivores, carnivores and sanguivores were completely absent from cattle pasture vegetation type.
When pooling together the information for each site category, functional trait species dispersion [1D(TM)] in papaya and pasture sites (9.61 and 9.83) showed similar values representing the number of effective functionally distinct species. Evenness of dispersion [1E(T)] (0.28 for papaya sites and 0.38 for pasture sites) showed that the number of functional distinct species are far from the maximum number of species.
When analyzing the data from vegetation types per site category, we found an effect of vegetation type (ANOVA F = 5.11, df = 2, p-value = 0.012, Table 5) on functional trait species dispersion [1D(TM)], with lower values in agricultural land compared to forest interior and forest edge (Figure 8), meaning a higher number of effective functionally distinct species were present in forest interior and edge than agricultural land. Also, the lack of variability in the mean dispersion shows a constant relationship between mean distance among species in functional groups and the proportion of species in each group across vegetation types and sites. The functional diversity metric values for vegetation types per site categories can be found in the Supplementary Material (Tables S1–S8).

4. Discussion

This study highlights the influence that different types of agricultural activities have on taxonomic as well as functional bat diversity, but also the strength of vegetation-type relationships on species composition and diversity. Our results suggest that vegetation type (i.e., forest interior, forest edge, pasture/papaya) best explains differences in bat species composition in this forest-agricultural landscape. Differences in vegetation types are known to drive patterns of diversity and species composition [51,83]. As was found for this study, vegetation structure differences among vegetation types often appear to correlate with vegetation type-specific patterns of species diversity and composition [33,84]. Specifically, we found that horizontal vegetation density and mean canopy height were important factors that explained differences in bat species composition between forest interiors and forest edges. Such vegetation differences also likely reflect differences in food resource availability that affect species abundance, diversity and composition [22,24,50,85]. In this study we selected forest edges that were distinct (i.e., a sharp edge between forest and agricultural land) and varied little among replicates in terms of structure. However, past studies have demonstrated that within forest edges, species responses may differ widely as a function of edge environmental characteristics, interactions among species, ecological flows that take place across the edges, or by interaction of multiple edge effects [54,86,87,88]. Here, bat species composition within edges were more similar to each other and “intermediate” between those of forest interiors and agricultural vegetation types.
Our results highlight how the type of agricultural activity can impact taxonomic and functional diversity of bats at the site level (i.e., agricultural land type and adjacent forest edges and forest interiors). Others have noted how certain agricultural land uses lack foraging and roosting resources for most bat species [11], while others may provide food resources or serve as transit areas for animals [89,90]. Moreover, certain agricultural practices, such as plantations, are better able to mitigate the effects of forest loss in biodiversity and the maintenance of ecological functions in human-modified areas. For example, frugivorous and nectarivorous bats have been reported to benefit from coffee and cocoa plantations where the forest canopy is maintained [50]. A meta-analysis that focused on neotropical bats found that, overall, human-modified areas may harbor more phyllostomid species than well-preserved forest, however, not all forest-dependent species used human-modified areas [50]. Cattle pastures and papaya plantation vegetation types likely differ in the way they impact bat diversity that inhabits those areas and the adjacent forest. Our finding that cattle pasture sites showed lower values of species richness than papaya plantation sites coincides with previous work [41,91]. Relative to cattle pastures, papaya plantations are a more recent activity in Madre de Dios [39]. Although the differences in bat diversity are likely a result of differences in vegetation structure, which may affect resources and vulnerability to predators, the differences we observed at a site level may also be a reflection of the longer-term impact of cattle pastures in the region.
In this study, both agricultural land types showed lower functional diversity than forest in terms of number of species and in the number of functionally distinct species. Cattle pastures showed complete loss of some functional groups and the highest number of missing species. The low diversity in cattle pasture sites likely reflected land management activities. Cattle pastures with little vegetation cover have been previously noted as largely unsuitable vegetation type for bats [92]. In the study area, cattle pastures had few or no trees, and thus, offered few feeding or roosting resources for bats. Previous work has related the loss of species and functional groups in agricultural land with changes in the diversity and abundance of resources on which bats feed [43]. Some bats avoid open vegetation types, like cattle pasture, because of increased risk to predation [55]. Furthermore, some bat species captured in cattle pastures may only be transients, crossing the area to reach other forests [93,94,95], while others like aerial insectivores and Desmodus rotundus, which feeds on cattle, may use resources in this vegetation type [50]. Surprisingly, however, we did not capture any D. rotundus in the cattle pastures, possibly because cattle were not located near mist-nets on sampling nights. In contrast to pastures, papaya plantations do provide food resources (i.e., papaya fruits) for some frugivorous bats (Carrasco-Rueda personal observation). During fieldwork we found evidence that Artibeus planirostris fed on papayas: captured individuals had papaya pulp in their mouths and feces. In addition to fruits, A. planirostris is also reported to eat papaya leaves [96]. Moreover, papaya plantations may provide cover that serves as protection from predators for frugivorous and non-frugivorous bats, or may offer roosting sites. During this study, however, we did not find evidence that papaya tree leaves were modified by tent-making bats. Despite providing resources for some bats, papaya plantations apparently lacked some forest species, mainly gleaning insectivores. The absence or loss of gleaning insectivores are likely related to their specialized diet and morphological adaptations that favor foraging and flying in forest vegetation rather than open areas [24,33,35,37,97]. We also found that the type of agricultural activity affects evenness of dispersion. Differences in dispersion between papaya sites and cattle pasture sites may be related with variation in niche partitioning [29,43], with fewer niches available in cattle pasture sites when compared to papaya sites.
We acknowledge that results from this study should be interpreted with the understanding of limitations in sampling. Due to the replication in the number of sites, our sampling effort per site was limited to two or three nights in each vegetation type. Further, we limited sampling from dusk to midnight during the dry season. Therefore, the overall sample effort might explain why some rare phyllostomid bat species were not registered during this study, or may have underestimated species that tend to be more active in the early morning hours or during the wet season. Our results, thus, do not reflect a complete sample of bat species, but rather the differences among species that are generally more common and more readily captured using the methods employed. We also acknowledge our results may be influenced by a sampling bias between open areas and forest interior. On one hand, Remsen and Good [98] argue that bird species that fly relatively longer distances in any one flight movement are more likely to be captured than species with short flights. In human-modified areas, bat species might be expected to use longer flights compared to forest interiors, and if so, may be more likely to be captured in open habitats. On the other hand, in human-modified areas mist-nets may be more easily detected and avoided by bats. Although distance to highway has been shown to impact bat communities in other studies [99,100,101], we found no effect of the Interoceanic Highway in explaining bat diversity indices nor species composition. In this region, traffic is relatively light with reduced speed limits, and these factors together with transects being located hundreds of meters, on average, from the highway may explain the lack of a road effect in our study. Finally, we are aware that mist-nets are known to capture mainly phyllostomid bats, which are the focus of the present study. All these factors may be affecting detection probabilities and thus our species richness estimates. To gain a more complete picture of the bat community using different land-use types, future studies should include sampling with acoustic methods. Recently, however, it was found that acoustic methods do not allow one to differentiate among phyllostomid subfamilies, genus or guilds [102]. These acoustic methods, though, are able to identify to species aerial insectivorous bats, which detect and avoid nets [102]. In addition, for studies wanting to monitor bat diversity over time, more replicates per location within any given year or season, as well as across time periods are needed to be able to estimate detectabilities and incorporate them in species estimates [103,104,105,106].
The differential impact of agricultural activities on bat diversity has potential management and conservation implications. Since papaya plantations appear to provide cover and food resources, they help maintain bat diversity in the region, especially when compared to cattle pastures that experience considerably reduced bat diversity. Furthermore, bat diversity in agricultural sites can provide benefits to landowners due to the ecological services they provide, especially pest control, which can potentially lower costs associated with the purchase of insecticides [107,108,109]. In the case of cattle pasture, mitigation activities, such as leaving or planting some fruit and other trees can improve the retention of bat diversity [55]. We recommend these minor modifications in pasture management as a tool to improve the maintenance of bat biodiversity in agricultural areas.

5. Conclusions

Overall, our results demonstrate that areas that harbor agricultural activities can maintain a considerable proportion of the expected bat diversity. However, we note that this region of Peru still has relatively large tracts of intact forest adjacent to agricultural lands when compared to other lowland forest areas, and our results may have differed in a more fragmented Amazonian landscape. Thus, in this region of Peru, bat diversity in agricultural areas benefits landowners through the ecological services they provide.

Supplementary Materials

The following are available online at https://www.mdpi.com/1424-2818/12/6/238/s1: Table S1: Functional diversity metric for papaya plantation sites, Table S2: Functional diversity metric for cattle pasture sites, Table S3: Functional diversity metric for forest interiors in papaya plantation sites, Table S4: Functional diversity metric for forest edges in papaya plantation sites, Table S5: Functional diversity metric for papaya plantation vegetation type, Table S6: Functional diversity metric for forest interior in cattle pasture sites, Table S7: Functional diversity metric for forest edge in cattle pasture sites, Table S8: Functional diversity metric for cattle pasture vegetation type.

Author Contributions

Conceptualization, F.C.-R. and B.A.L.; methodology, F.C.-R. and B.A.L.; formal analysis, F.C.-R.; data curation, F.C.-R.; writing—original draft preparation, F.C.-R.; writing—review and editing, B.A.L.; visualization, F.C.-R.; funding acquisition, F.C.-R. All authors have read and agreed to the published version of the manuscript.

Funding

Funds for this research were provided by Lewis and Clark Fund for Exploration and Field Research Grant by the American Philosophical Society, Cleveland Zoological Society (CZS) and Cleveland Metroparks Zoo (CMZ), and Bat Conservation International. The exploratory field season (2015) was funded by Dr. Stephen Perz and Consorcio Madre de Dios.

Acknowledgments

We thank Bruno Sanguinetti, Luis Masias, Jhon Farfán, Amanda Paredes, Nadia Mamani, Anggela Michi, Renzo Piana, Roberto Gutierrez, Juan Loja, Yessenia Apaza, and Luis Villena for their support during the exploratory field season (2015). We thank Sidney Novoa Sheppard for his support on image information, and Celia Estibur and Luis Chavez for their logistical support in Puerto Maldonado. We thank landowners who allowed access to their properties for the sampling period. We thank Brian Málaga, Juan Carlos Suaña, Yolanda Alcarraz, Diego Zavala, Luiggi Carrasco, Katherin Mares, A. Pinedo Malpartida, and Diego Juárez–Sánchez for their invaluable support during fieldwork. We thank Hugo T. Zamora-Meza for his support with identification of species, and Erika Paliza (CEBIO) who provided equipment for this study. We thank Rodrigo Medellín for useful early discussions of sampling design and preliminary results. We thank Diego Zavala for his support with map generation. We thank Francis “Jack” Putz, Andrew Noss, Luis Aguirre, Robert Fletcher for their valuable comments to the project design and data analysis. Finally, we thank anonymous reviewers who provided insightful comments that helped to improve this manuscript.

Conflicts of Interest

The authors declare no conflict of interest. The funders had no role in the design of the study; in the collection, analyses, or interpretation of data; in the writing of the manuscript; or in the decision to publish the results.

Appendix A

We tested the correlation between species captured and estimated species richness per transect and the distance to the Interoceanic Highway (in total and per vegetation type). We also included distance to highway as explanatory variable in the ANOVA for species richness and capture rate, and in the assemblage composition analysis. In most cases we did not see an effect of the highway in the diversity values or assemblage composition values (Table A1 and Table A2, Figure A1).
Table A1. Analysis of variance for estimated richness (Jackknife 1) and capture rate including distance to highway as a variable.
Taxonomic Diversity MetricVariabledfSum Sq.Mean Sq.F ValuePr(>F)
Capture RateSite Category1340734071.020.359
Distance to highway2942,87214780.4430.925
Residuals516,7013340
Capture RateVegetation type2702135110.7880.531
Distance to highway3042,59514200.3190.96
Residuals313,3644455
Species richness (jackknife1)Site Category1393.2393.25.0920.074
Distance to highway29739.225.50.330.974
Residuals5386.177.2
Species richness (jackknife1)Vegetation type301132.537.750.3290.956
Distance to highway242.221.110.1840.841
Residuals3343.9114.64
Table A2. Correlation values (r2) between the explanatory variables and the non-metric multidimensional scaling (NMDS) axis that compares forest interiors and forest edges.
VariableNMDS1NMDS2r2p
Foliage height index−0.401−0.9160.0040.962
Horizontal vegetation density0.9940.1100.3840.011
Mean canopy height−0.836−0.5480.4240.002
Temperature variation0.8310.5560.0520.564
Distance to highway−0.169−0.9860.0250.776
Figure A1. Non-metric multidimensional scaling (NMDS) with ordination based on Bray–Curtis dissimilarities to compare forest interiors and forest edges by site category. Triangles represent forest interiors and circles represent forest edges. Black-filled symbols represent vegetation types at papaya sites and empty symbols represent vegetation types at pasture sites. Vectors represent explanatory variables, including distance to the Interoceanic Highway, and their lengths represent the strengths of their relationship with NMDS axis. We excluded agricultural land from this analysis because vegetation measurements were only made at forest interiors and forest edges.
Diversity 12 00238 g0a1

Appendix B

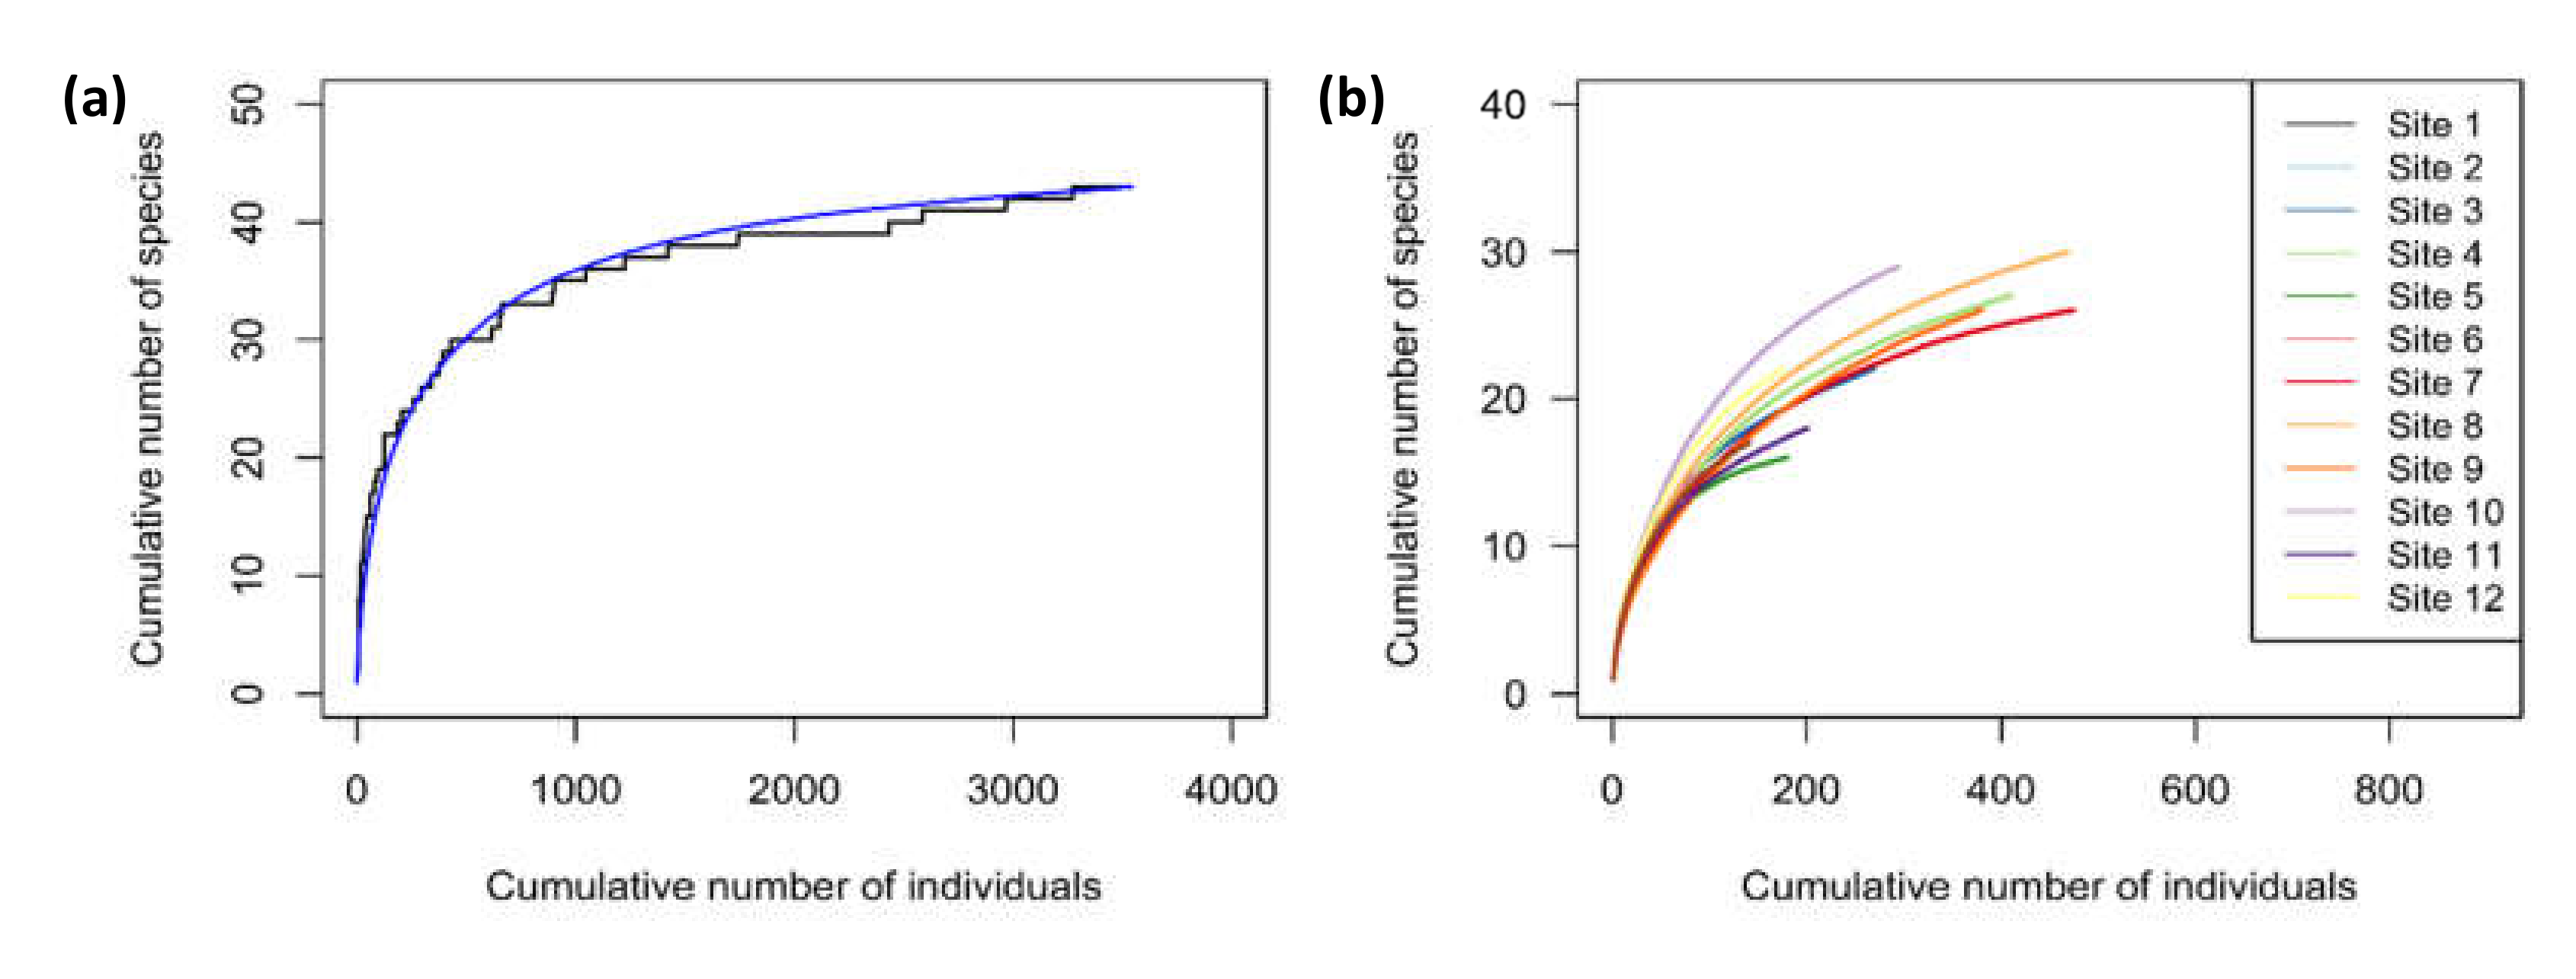
Sampling Effectiveness

We constructed species accumulation curves based on cumulative number of individuals captured to test the effectiveness of the sampling during the whole study and at each of the sites individually.
We performed analyses in R environment [80] and relied on the R package “vegan” [74] and its function “specaccum” for generating the species accumulation.
The generated species accumulation curve including all data shows leveling off of species with sample effort, suggesting that overall sampling was adequate to represent species likely encountered by mist-netting (Figure A2). Individual sites, however, did not necessarily reach asymptotes with the sampling effort expended (Figure A2).
Figure A2. Species accumulation curves; (a) cumulative number of species across all sites versus sample effort (number of individuals captured). Jagged curves represent data as it was collected. Smoothed line represents random collections of the data; (b) cumulative number of species per study site based on number of individuals captured.
Diversity 12 00238 g0a2

Appendix C

Appendix C.1. Vegetation Structure and Temperature Variation Measurement

Appendix C.1.1. Vegetation Structure

We measured seven variables to describe the vegetation structure in both forest interiors and forest edges: (1) canopy height, (2) tree density (>10 cm diameter at breast height), (3) basal area of large trees (>10 cm diameter at breast height) (4) small tree density (<10 cm diameter at breast height), (5) density of lianas (>1 cm diameter at breast height), (6) foliage height index, and (7) horizontal density. Vegetation measurements were taken during the 2016 visits to sites.
Canopy height was estimated by using a laser range finder (Nikon 8397 ACULON, Nikon, Melville, New York, NY, USA) to measure the tallest five trees at ten and five locations along the forest interior and forest edge transects, respectively (total of 25 trees per edge transect and 50 trees per forest transect; sampling locations were center of each of the 5 mist-net stations, plus 5 additional intermediate stations in forest interior transects). Using all measured trees, we estimated the mean of canopy tree height per transect in each vegetation type (forest interior and forest edge) per site category. We measured the difference in canopy height between site categories and between vegetation type using a paired t-test.
To estimate the density of trees > 10 cm of diameter at breast height (dbh) we used the point center quarter method [110]. We estimated the distance to the closest tree within each of four quadrats at 10 locations along each forest transect and five locations along each edge transect. We used mean distance from each of the points to estimate mean tree density for each transect (i.e., number of trees per hectare). We used tree diameter measurements to estimate mean basal area for trees >10 cm dbh in each vegetation type per site.
We estimated density of small trees (1–10 cm dbh) by counting all stems within plots (5 × 10 m) located at each of five sampling locations along the 300 m study transects in forests and edges. Plot samples were then “averaged” across transect and used to estimate density. We determined the density of lianas >1 cm dbh in the same 5 × 10 m plots.
We measured the foliage height index at each of the five sample locations in each forest and edge transects following a modified methodology based on MacArthur & MacArthur [111]. Using imaginary cylinders of 1 m diameter, we scored presence or absence of vegetation at intervals of 0–1 m, 1–2 m, 2–4 m, 4–8 m, 8–16 m, 16–24 m, 24–32 m and more than 32 m height sighting upwards. We compared the foliage height index using a similar approach used to characterize understory height diversity by Zellweger et al. [112]. We estimated a diversity index for each vegetation type (forest interior and forest edge) per site using the occurrence of vegetation in the different height intervals. We used the Simpson’s index of diversity (1-D) which takes into account both richness and evenness with values between 0, representing no diversity, and 1, representing high diversity.
Following Marsden et al. [113], we estimated the horizontal vegetation density of the understory using digital photographs. We took 20 pictures along each transect (four cardinal points at each of the five sampling locations) standing 5 m away from a 3.5 m by 1.5 m white screen. We kept the best two pictures per point at each transect. In each picture we cropped a section of approximately 2.25 m2 of the white screen, transformed them to a black-and-white format and estimated the percentage of black pixels. For image transformation, we used ImageJ2 software [114] and ArcMap (ArcGIS, ESRI, 2015, version 10.3.1) to estimate the percent vegetation covered as indicated by black pixels.

Appendix C.1.2. Temperature

We used data loggers (EL-USB-2-LCD +, Lascar Electronics) to measure temperature at 1.5 m above the ground being sure the unit’s sensors were under shade, in the center of each transect during the same period bats were sampled. Minimum and maximum values of nighttime temperatures were registered for each forest interior and forest edge transect for the nights sampled (from 17:30 to 23:30) during the first and second visits (temperature data during the third visit was not gathered due to logistical problems). We use the variation in temperature (measured as the difference between mean minimum and mean maximum daily nighttime temperatures registered) as an explanatory variable.
We analyzed the variation in the vegetation structure and temperature variation per vegetation type in order to decide which variables to include in the analysis in order to explain the variation in bat composition.
For canopy height, we did not find difference between same vegetation types from different site categories (forest edge between papaya and cattle pasture sites t = −1.215, df = 5, p-value = 0.278; forest interiors between papaya and cattle pasture sites t = 0.204, df = 5, p-value = 0.847). However the canopy height at forest edges and forest interiors differ within the same site category (vegetation types at papaya plantation site t = −4.1009, df = 5, p-value = 0.0093; vegetation types at cattle pasture site t = −4.510, df = 5, p-value = 0.006). When we tested whether site category, vegetation type, or their interaction explained variation in tree height, we only found evidence for vegetation type effects (ANOVA F = 14.155, df = 1, p-value = 0.012).
For mean density of trees >10 cm of diameter at breast height (dbh), we did not find difference between same vegetation types from different site categories neither different vegetation types differ within the same site category (forest edges between papaya and cattle pasture sites t = 0.132, df = 5, p-value = 0.900; forest interiors between papaya and cattle pasture sites t = −0.356, df = 5, p-value = 0.736, vegetation types at papaya plantation site t = 0.997, df = 5, p-value = 0.364; vegetation types at cattle pasture site t = 1.123, df = 5, p-value = 0.312). We did not find evidence for effects of site category, vegetation type, or their interaction.
For mean basal area for trees >10 cm dbh we did not find significant differences between same vegetation types from different site categories nor did vegetation types differ within the same site category (forest edges between papaya and cattle pasture sites t = −2.040, df = 5, p-value = 0.097; forest interiors between papaya and cattle pasture sites t = −0.894, df = 5, p-value = 0.412, vegetation types at papaya plantation site t = 0.198, df = 5, p-value = 0.851; vegetation types at cattle pasture site t = −0.949, df = 5, p-value = 0.386). We did not find evidence for significant effects of site category, vegetation type, or their interaction.
For mean density of small trees we found neither differences between same vegetation types from different site categories nor differences between vegetation types within the same site category (forest edges between papaya and cattle pasture sites t = −0.694, df = 5, p-value = 0.518; forest interiors between papaya and cattle pasture sites t = −0.621, df = 5, p-value = 0.562, vegetation types at papaya plantation site t = −1.087, df = 5, p-value = 0.327; vegetation types at cattle pasture site t = −0.844, df = 5, p-value = 0.437). When we tested whether site category, vegetation type, or their interaction explained variation in mean density of small trees we did not find evidence for any of those effects.
For mean density of lianas we found neither differences between same vegetation types from different site categories nor differences between vegetation types within the same site category (forest edges between papaya and cattle pasture sites t = 1.691, df = 5, p-value = 0.152; forest interiors between papaya and cattle pasture sites t = 1.899, df = 5, p-value = 0.116, vegetation types at papaya plantation site t = −1.588, df = 5, p-value = 0.173; vegetation types at cattle pasture site t = −1.015, df = 5, p-value = 0.357). When we tested whether site category, vegetation type, or their interaction explained variation in mean density of lianas, we did not find evidence for any of those effects.
For foliage height index, we found that the Simpson’s index of diversity between forest interiors differed between the two site categories (t = −2.966, df = 5, p-value = 0.031). However, diversity indices for foliage height did not differ for forest edges between papaya and cattle pasture sites (t = −0.749, df = 5, p-value = 0.488). Diversity indices for foliage height did not differ among vegetation types within the same site category (vegetation types at papaya plantation site t = −0.919, df = 5, p-value = 0.4; vegetation types at cattle pasture site t = −0.612, df = 5, p-value = 0.568). When we tested whether site category, vegetation type, or their interaction explained variation in foliage height indices we did not find evidence for effects of site category, vegetation type, or their interaction.
For horizontal density we tested whether site category, vegetation type, or their interaction explained variation in tree height, and we only found evidence for vegetation type effects (ANOVA F = 5.515, df = 1, p-value = 0.029). We did not find differences in the percentage of vegetation coverage between same vegetation types from different site categories nor did different vegetation types vary within the same site category (forest edges between papaya and cattle pasture sites t = −0.221, df = 5, p-value = 0.833; forest interiors between papaya and cattle pasture sites t = 0.52, df = 5, p-value = 0.625, vegetation types at papaya plantation site t = 2.358, df = 5, p-value = 0.065; vegetation types at cattle pasture site t = 0.941, df = 5, p-value = 0.39).
For variation in temperature, we did not find differences between same vegetation types from different site categories (forest edges between papaya and cattle pasture sites t = −0.332, df = 5, p-value = 0.753; forest interiors between papaya and cattle pasture sites t = 0.233, df = 5, p-value = 0.825). However, we did find significant differences in temperatures between forest edge and forest interiors within papaya plantation sites (t = 4.248, df = 5, p-value = 0.008) but not within cattle pasture sites (t = 2.506, df = 5, p-value = 0.054). When we tested whether site category, vegetation type, or their interaction explained variation in temperature we only found evidence for vegetation-type effects (ANOVA F = 8.928, df = 1, p-value = 0.007).

References

  1. Waters, C.N.; Zalasiewicz, J.; Summerhayes, C.; Barnosky, A.D.; Poirier, C.; Galuszka, A.; Cearreta, A.; Edgeworth, M.; Ellis, E.C.; Ellis, M.; et al. The Anthropocene is functionally and stratigraphically distinct from the Holocene. Science 2016, 351, aad2622. [Google Scholar] [CrossRef] [PubMed]
  2. McGill, B.J.; Dornelas, M.; Gotelli, N.J.; Magurran, A.E. Fifteen forms of biodiversity trend in the Anthropocene. Trends Ecol. Evol. 2015, 30, 104–113. [Google Scholar] [CrossRef]
  3. Foley, J.A.; DeFries, R.; Asner, G.P.; Barford, C.; Bonan, G.; Carpenter, S.R.; Chapin, F.S.; Coe, M.T.; Daily, G.C.; Gibbs, H.K.; et al. Global consequences of land use. Science 2005, 309, 570–574. [Google Scholar] [CrossRef] [PubMed] [Green Version]
  4. Mace, G.; Masundire, H.; Baillie, J. Biodiversity. In Ecosystems and Human Well Being, Current State and Trends: Millenium Ecosystem Assessment; Hassan, R., Scholes, R., Ash, N., Eds.; Island Press: New York, NY, USA, 2005; Volume 1, pp. 77–122. [Google Scholar]
  5. Bello, C.; Galetti, M.; Pizo, M.A.; Magnago, L.F.S.; Rocha, M.F.; Lima, R.A.F.; Peres, C.A.; Ovaskainen, O.; Jordano, P. Defaunation affects carbon storage in tropical forests. Sci. Adv. 2015, 1, e1501105. [Google Scholar] [CrossRef] [PubMed] [Green Version]
  6. Perez-Mendez, N.; Jordano, P.; Garcia, C.; Valido, A. The signatures of Anthropocene defaunation: Cascading effects of the seed dispersal collapse. Sci. Rep. 2016, 6, 24820. [Google Scholar] [CrossRef] [PubMed] [Green Version]
  7. Pimm, S.L.; Raven, P. Biodiversity—Extinction by numbers. Nature 2000, 403, 843–845. [Google Scholar] [CrossRef]
  8. Ramankutty, N.; Foley, J.A. Estimating historical changes in global land cover: Croplands from 1700 to 1992. Glob. Biogeochem. Cycles 1992, 13, 997–1027. [Google Scholar] [CrossRef]
  9. Asner, G.P.; Elmore, A.J.; Olander, L.P.; Martin, R.E.; Harris, A.T. Grazing systems, ecosystem responses, and global change. Annu. Rev. Environ. Resour. 2004, 29, 261–299. [Google Scholar] [CrossRef]
  10. Dirzo, R.; Raven, P.H. Global state of biodiversity and loss. Annu. Rev. Environ. Resour. 2003, 28, 137–167. [Google Scholar] [CrossRef] [Green Version]
  11. Frick, W.F.; Kingston, T.; Flanders, J. A review of the major threats and challenges to global bat conservation. Ann. N. Y. Acad. Sci. 2019, 1–21. [Google Scholar] [CrossRef]
  12. Godfray, H.C.J.; Garnett, T. Food security and sustainable intensification. Philos. Trans. R. Soc. Lond. B Biol. Sci. 2014, 369, 20120273. [Google Scholar] [CrossRef] [PubMed]
  13. Laurance, W.F.; Sayer, J.; Cassman, K.G. Agricultural expansion and its impacts on tropical nature. Trends Ecol. Evol. 2014, 29, 107–116. [Google Scholar] [CrossRef] [PubMed]
  14. Paini, D.R.; Sheppard, A.W.; Cook, D.C.; De Barro, P.J.; Worner, S.P.; Thomas, M.B. Global threat to agriculture from invasive species. Proc. Natl. Acad. Sci. USA 2016, 113, 7575–7579. [Google Scholar] [CrossRef] [Green Version]
  15. Phalan, B.; Bertzky, M.; Butchart, S.H.M.; Donald, P.F.; Scharlemann, J.P.W.; Stattersfield, A.J.; Balmford, A. Crop expansion and conservation priorities in tropical countries. PLoS ONE 2013, 8, e51759. [Google Scholar] [CrossRef] [Green Version]
  16. Rodrigues, J.L.M.; Pellizari, V.H.; Mueller, R.; Baek, K.; Jesus, E.C.; Paula, F.S.; Mirza, B.; Hamaoui, G.S., Jr.; Siu Mui, T.; Feigl, B.; et al. Conversion of the Amazon rainforest to agriculture results in biotic homogenization of soil bacterial communities. Proc. Natl. Acad. Sci. USA 2013, 110, 988–993. [Google Scholar] [CrossRef] [Green Version]
  17. Soares-Filho, B.S.; Nepstad, D.C.; Curran, L.M.; Cerqueira, G.C.; Garcia, R.A.; Ramos, C.A.; Voll, E.; McDonald, A.; Lefebvre, P.; Schlesinger, P. Modelling conservation in the Amazon basin. Nature 2006, 440, 520–523. [Google Scholar] [CrossRef]
  18. Medellin, R.A.; Equihua, M. Mammal species richness and habitat use in rainforest and abandoned agricultural fields in Chiapas, Mexico. J. Appl. Ecol. 1998, 35, 13–23. [Google Scholar] [CrossRef]
  19. Mendenhall, C.D.; Sekercioglu, C.H.; Brenes, F.O.; Ehrlich, P.R.; Daily, G.C. Predictive model for sustaining biodiversity in tropical countryside. Proc. Natl. Acad. Sci. USA 2011, 108, 16313–16316. [Google Scholar] [CrossRef] [Green Version]
  20. Vargas Espinoza, A.; Aguirre, L.F.; Galarza, M.I.; Gareca, E. Ensamble de murciélagos en sitios con diferente grado de perturbación en un bosque montano del Parque Nacional Carrasco, Bolivia. Mastozool Neotrop 2008, 15, 297–308. [Google Scholar]
  21. Estrada, A.; Coates-Estrada, R. Bats in continuous forest, forest fragments and in an agricultural mosaic habitat-island at Los Tuxtlas, Mexico. Biol. Conserv. 2002, 103, 237–245. [Google Scholar] [CrossRef]
  22. Harvey, C.A.; Gonzalez Villalobos, J.A. Agroforestry systems conserve species-rich but modified assemblages of tropical birds and bats. Biodivers. Conserv. 2007, 16, 2257–2292. [Google Scholar] [CrossRef]
  23. Lindenmayer, D.B.; Franklin, J.F. Conserving Forest Biodiversity: A Comprehensive Multiscaled Approach; Island Press: Washington, DC, USA, 2002; p. 351. [Google Scholar]
  24. Williams-Guillen, K.; Perfecto, I. Effects of Agricultural Intensification on the Assemblage of Leaf-Nosed Bats (Phyllostomidae) in a Coffee Landscape in Chiapas, Mexico. Biotropica 2010, 42, 605–613. [Google Scholar] [CrossRef] [Green Version]
  25. Dunning, J.B.; Danielson, B.J.; Pulliam, H.R. Ecological processes that affect populations in complex landscapes. Oikos 1992, 65, 169–175. [Google Scholar] [CrossRef] [Green Version]
  26. Daily, G.C. Ecological forecasts. Nature 2001, 411, 245. [Google Scholar] [CrossRef]
  27. Presley, S.J.; Cisneros, L.M.; Higgins, C.L.; Klingbeil, B.T.; Scheiner, S.M.; Willig, M.R. Phylogenetic and functional underdispersion in Neotropical phyllostomid bat communities. Biotropica 2018, 50, 135–145. [Google Scholar] [CrossRef]
  28. Castro-Luna, A.A.; Sosa, V.J.; Castillo-Campos, G. Quantifying phyllostomid bats at different taxonomic levels as ecological indicators in a disturbed tropical forest. Acta Chiropterol. 2007, 9, 219–228. [Google Scholar] [CrossRef]
  29. Cisneros, L.M.; Fagan, M.E.; Willig, M.R. Environmental and spatial drivers of taxonomic, functional, and phylogenetic characteristics of bat communities in human-modified landscapes. PeerJ 2016, 4, e2551. [Google Scholar] [CrossRef] [Green Version]
  30. Fenton, M.B.; Acharya, L.; Audet, D.; Hickey, M.B.C.; Merriman, C.; Obrist, M.K.; Syme, D.M.; Adkins, B. Phyllostomid bats (Chiroptera—Phyllostomidae) as indicators of habitat disruption in the Neotropics. Biotropica 1992, 24, 440–446. [Google Scholar] [CrossRef]
  31. Gorchov, D.L.; Rondon, X.J.; Cornejo, F.; Schaefer, R.L.; Janosko, J.M.; Slutz, G. Edge effects in recruitment of trees, and relationship to seed dispersal patterns, in cleared strips in the Peruvian Amazon. Ecol. Res. 2013, 28, 53–65. [Google Scholar] [CrossRef]
  32. Lacher, T.E., Jr.; Davidson, A.A.; Fleming, T.H.; Gómez-Ruiz, E.P.; McCraken, G.F.; Owen-Smith, N.; Peres, C.A.; Vander Wall, S.B. The functional roles of mammals in ecosystems. J. Mammal. 2019, 100, 942–964. [Google Scholar] [CrossRef] [Green Version]
  33. Medellin, R.A.; Equihua, M.; Amin, M.A. Bat diversity and abundance as indicators of disturbance in neotropical rainforests. Conserv. Biol. 2000, 14, 1666–1675. [Google Scholar] [CrossRef]
  34. Barlow, J.; Gardner, T.A.; Araujo, I.S.; Avila-Pires, T.C.; Bonaldo, A.B.; Costa, J.E.; Esposito, M.C.; Ferreira, L.V.; Hawes, J.; Hernandez, M.M.; et al. Quantifying the biodiversity value of tropical primary, secondary, and plantation forests. Proc. Natl. Acad. Sci. USA 2007, 104, 18555–18560. [Google Scholar] [CrossRef] [PubMed] [Green Version]
  35. Cisneros, L.M.; Fagan, M.E.; Willig, M.R. Effects of human-modified landscapes on taxonomic, functional and phylogenetic dimensions of bat biodiversity. Divers. Distrib. 2015, 21, 523–533. [Google Scholar] [CrossRef]
  36. Meyer, C.F.J.; Struebig, M.J.; Willig, M.R. Responses of tropical bats to habitat fragmentation, logging, and deforestation. In Bats in the Anthropocene: Conservation of Bats in a Changing World; Voigt, C.C., Kingston, T., Eds.; Springer International Publishing: Cham, Switzerland, 2016; pp. 63–103. [Google Scholar]
  37. Meyer, C.F.J.; Kalko, E.K.V. Assemblage-level responses of phyllostomid bats to tropical forest fragmentation: Land-bridge islands as a model system. J. Biogeogr. 2008, 35, 1711–1726. [Google Scholar] [CrossRef]
  38. Dourojeanni, M.J. Una nueva estrategia para el desarrollo de la Amazonía Peruana. RFP 1976, 6, 1–22. [Google Scholar]
  39. Papaya–Potential New Driver of Deforestation in Madre de Dios. Available online: https://maaproject.org/2016/papaya-peru/ (accessed on 16 April 2020).
  40. Klingbeil, B.T.; Willig, M.R. Seasonal differences in population-, ensemble- and community-level responses of bats to landscape structure in Amazonia. Oikos 2010, 119, 1654–1664. [Google Scholar] [CrossRef]
  41. Mendenhall, C.D.; Karp, D.S.; Meyer, C.F.J.; Hadly, E.A.; Daily, G.C. Predicting biodiversity change and averting collapse in agricultural landscapes. Nature 2014, 509, 213–217. [Google Scholar] [CrossRef]
  42. Saldanha Bueno, A.; Peres, C.A. The role of baseline suitability in assessing the impacts of land-use change on biodiversity. Biol. Conserv. 2020, 243, 108396. [Google Scholar] [CrossRef]
  43. Scheiner, S.M.; Kosman, E.; Presley, S.J.; Willig, M.R. Decomposing functional diversity. Methods Ecol. Evol. 2017, 8, 809–820. [Google Scholar] [CrossRef] [Green Version]
  44. Bovendorp, R.S.; Brum, F.T.; McCleery, R.A.; Baiser, B.; Loyola, R.; Cianciaruso, M.V.; Galetti, M. Defaunation and fragmentation erode small mammal diversity dimensions in tropical forests. Ecography 2019, 42, 23–35. [Google Scholar] [CrossRef]
  45. Farneda, F.Z.; Rocha, R.; Lopez-Baucells, A.; Groenenberg, M.; Silva, I.; Palmeirim, J.M.; Bobrowiec, P.E.D.; Meyer, C.F.J. Trait-related responses to habitat fragmentation in Amazonian bats. J. Appl. Ecol. 2015, 52, 1381–1391. [Google Scholar] [CrossRef]
  46. Farneda, F.Z.; Rocha, R.; Lopez-Baucells, A.; Sampaio, E.M.; Palmeirim, J.M.; Bobrowiec, P.E.D.; Grelle, C.E.V.; Meyer, C.F.J. The Road to Functional Recovery: Temporal Effects of Matrix Regeneration on Amazonian Bats. Trop. Conserv. Sci. 2018, 11, 1–4. [Google Scholar] [CrossRef] [Green Version]
  47. Farneda, F.Z.; Grelle, C.E.V.; Rocha, R.; Ferreira, D.F.; Lopez-Baucells, A.; Meyer, C.F.J. Predicting biodiversity loss in island and countryside ecosystems through the lens of taxonomic and functional biogeography. Ecography 2020, 43, 97–106. [Google Scholar] [CrossRef]
  48. Petchey, O.L.; Gaston, K.J. Functional diversity: Back to basics and looking forward. Ecol. Lett. 2006, 9, 741–758. [Google Scholar] [CrossRef] [PubMed]
  49. Cortes-Delgado, N.; Perez-Torres, J. Habitat edge context and the distribution of phyllostomid bats in the Andean forest and anthropogenic matrix in the Central Andes of Colombia. Biodivers. Conserv. 2011, 20, 987–999. [Google Scholar] [CrossRef]
  50. Garcia-Morales, R.; Badano, E.I.; Moreno, C.E. Response of Neotropical Bat Assemblages to Human Land Use. Conserv. Biol. 2013, 27, 1096–1106. [Google Scholar] [CrossRef]
  51. Daily, G.C.; Ceballos, G.; Pacheco, J.; Suzan, G.; Sanchez-Azofeifa, A. Countryside biogeography of neotropical mammals: Conservation opportunities in agricultural landscapes of Costa Rica. Conserv. Biol. 2003, 17, 1814–1826. [Google Scholar] [CrossRef]
  52. Sánchez-Cuervo, A.M.; de Santos Lima, L.; Dallmeier, F.; Garate, P.; Bravo, A.; Vanthomme, H. Twenty years of land cover change in the southeastern Peruvian Amazon: Implications for biodiversity conservation. Reg. Environ. Chang. 2020, 20. [Google Scholar] [CrossRef]
  53. Presidencia del Consejo de Ministros (PCM); Gobierno Regional de Madre de Dios (GOREMAD). Estudio de Diagnóstico y Zonificación Para el Tratamiento de la Demarcacion Territorial de la Provincia Tambopata; GOREMAD: Puerto Maldonado, Peru, 2010; Volume I, p. 310. Available online: http://www2.congreso.gob.pe/sicr/cendocbib/con4_uibd.nsf/007886A2CDEC740505257B7A0075FC13/%24FILE/doc_edz_tambopata.pdf (accessed on 28 May 2020).
  54. Murcia, C. Edge effects in fragmented forests—Implications for conservation. Trends Ecol. Evol. 1995, 10, 58–62. [Google Scholar] [CrossRef]
  55. Galindo-Gonzalez, J.; Sosa, V.J. Frugivorous bats in isolated trees and riparian vegetation associated with human-made pastures in a fragmented tropical landscape. Southwest Nat. 2003, 48, 579–589. [Google Scholar] [CrossRef]
  56. Saldana-Vazquez, R.A.; Munguia-Rosas, M.A. Lunar phobia in bats and its ecological correlates: A meta-analysis. Mamm. Biol. 2013, 78, 216–219. [Google Scholar] [CrossRef]
  57. Helbig-Bonitz, M.; Rutten, G.; Kalko, E.K.V. Fruit bats can disperse figs over different land-use types on Mount Kilimanjaro, Tanzania. Afr. J. Ecol. 2014, 52, 122–125. [Google Scholar] [CrossRef]
  58. Klingbeil, B.T.; Willig, M.R. Guild-specific responses of bats to landscape composition and configuration in fragmented Amazonian rainforest. J. App. Ecol. 2009, 46, 203–213. [Google Scholar] [CrossRef]
  59. Diaz, M.M.; Solari, S.; Aguirre, L.F.; Aguiar, L.M.S.; Barquez, R.M. Clave de Identificación de los Murciélagos de Sudamérica; Publicación Especial N° 2; PCMA (Programa de Conservación de los Murciélagos de Argentina): Tucumán, Argentina, 2016; p. 160. [Google Scholar]
  60. Gardner, A.L. Mammals of South America. Marsupials, Xenarthrans, Shrews, and Bats; University of Chicago Press: Chicago, IL, USA; London, UK, 2007; Volume 1, p. 669. [Google Scholar]
  61. Giannini, N.P.; Barquez, R.M. Sturnira erythromos. Mamm. Species 2003, 729, 1–5. [Google Scholar] [CrossRef]
  62. López-Baucells, A.; Rocha, R.; Bobrowiec, P.; Bernard, E.; Palmeirim, J.; Meyer, C. Field Guide to Amazonian Bats; INPA: Manaus, Brazil, 2016; p. 168. [Google Scholar]
  63. Basantes, M.; Tinoco, N.; Velazco, P.M.; Hofmann, M.J.; Rodriguez-Posada, M.E.; Camacho, M.A. Systematics and Taxonomy of Tonatia saurophila Koopman & Williams, 1951 (Chiroptera, Phyllostomidae). Zookeys 2020, 59–86. [Google Scholar] [CrossRef]
  64. Velazco, P.M.; Patterson, B.D. Small mammals of the Mayo River Basin in Northern Peru, with the description of a new species of Sturnira (Chiroptera: Phyllostomidae). Bull. Am. Mus. Nat. Hist. 2019, 1–67. [Google Scholar] [CrossRef] [Green Version]
  65. Hurtado, N.; Pacheco, V. Análisis filogenético del género Mimon Gray, 1847 (Mammalia, Chiroptera, Phyllosto midae) con la descripción de un nuevo género. Therya 2014, 5, 751–791. [Google Scholar] [CrossRef]
  66. Sikes, R.S. The Animal Care and Use Committee of the American Society of Mammalogists. 2016 Guidelines of the American Society of Mammalogists for the use of wild mammals in research and education. J. Mammal. 2016, 97, 663–668. [Google Scholar]
  67. AVMA. AVMA Guidelines for the Euthanasia of Animals: 2013 Edition; American Veterinary Medical Association: Schaumbutg, IL, USA, 2013; p. 102. [Google Scholar]
  68. Kwiecinski, G.G. Phyllostomus discolor. Mamm Species 2006, 801, 1–11. [Google Scholar] [CrossRef]
  69. García-García, J.L.; Santos-Moreno, A. Efectos de la estructura del paisaje y de la vegetación en la diversidad de murciélagos filostómidos (Chiroptera: Phyllostomidae) de Oaxaca, México. Rev. Biol. Trop. 2014, 62, 226–249. [Google Scholar] [CrossRef] [Green Version]
  70. Martins, A.C.M.; Willig, M.R.; Presley, S.J.; Marinho-Filho, J. Effects of forest height and vertical complexity on abundance and biodiversity of bats in Amazonia. Forest. Ecol. Manag. 2017, 391, 427–435. [Google Scholar] [CrossRef]
  71. Kalko, E.K.V. Organisation and diversity of tropical bat communities through space and time. ZACS 1998, 101, 281–297. [Google Scholar]
  72. Bray, J.R.; Curtis, J.T. An ordination of the upland forest communities of Southern Wisconsin. Ecol. Monogr. 1957, 27, 326–349. [Google Scholar] [CrossRef]
  73. Mantel, N. The detection of disease clustering and a generalized regression approach. Cancer Res. 1967, 27, 209–220. [Google Scholar] [PubMed]
  74. Oksanen, J.; Kindt, R.; Legendre, P.; O’Hara, R.B. Vegan: Community Ecology Package. Version 1.7-81. 2005. Available online: http://cran.r-project.org/i (accessed on 16 April 2020).
  75. Nenadic, O.; Greenacre, M. Correspondence Analysis in R, with two- and three-dimensional graphics: The ca package. J. Stat. Softw. 2007, 20, 1–13. [Google Scholar]
  76. Venables, W.N.; Ripley, B.D. Modern Applied Statistics with S, 4th ed.; Springer: New York, NY, USA, 2002; p. 495. [Google Scholar]
  77. Dray, S.; Dufour, A.; Chessel, D. The ade4 Package: Implementing the Duality Diagram for Ecologists. J. Stat. Softw. 2007, 22, 1–20. [Google Scholar] [CrossRef] [Green Version]
  78. Walther, B.A.; Moore, J.L. The concepts of bias, precision and accuracy, and their use in testing the performance of species richness estimators, with a literature review of estimator performance. Ecography 2005, 28, 815–829. [Google Scholar] [CrossRef]
  79. Burnham, K.P.; Overton, W.S. Robust estimation of population size when capture probabilities vary among animals. Ecology 1979, 60, 927–936. [Google Scholar] [CrossRef]
  80. R Core Team. R: A Language and Environment for Statistical Computing; R Foundation for Statistical Computing: Vienna, Austria, 2018; Available online: https://www.r-project.org (accessed on 16 April 2020).
  81. Paradis, E.; Schliep, K. Ape 5.0: An environment for modern phylogenetics and evolutionary analyses in R. Bioinformatics 2018, 35, 526–528. [Google Scholar] [CrossRef]
  82. Kalko, E.K.V. Diversity in tropical bats. In Tropical Biodiversity and Systematics, Proceedings of the International Symposium on Biodiversity and Systematics in Tropical Ecosystems, Bonn, Germany, 2–7 May 1994; Ulrich, H., Ed.; Zoologisches Forschungsinstitut und Museum Alexander Koenig: Bonn, Germany, 1997; pp. 13–43. [Google Scholar]
  83. Laurance, W.F.; Lovejoy, T.E.; Vasconcelos, H.L.; Bruna, E.M.; Didham, R.K.; Stouffer, P.C.; Gascon, C.; Bierregaard, R.O.; Laurance, S.G.; Sampaio, E. Ecosystem decay of Amazonian forest fragments: A 22-year investigation. Conserv. Biol. 2002, 16, 605–618. [Google Scholar] [CrossRef] [Green Version]
  84. Ober, H.K.; Hayes, J.P. Influence of vegetation on bat use of riparian areas at multiple spatial scales. J. Wildl. Manag. 2008, 72, 396–404. [Google Scholar] [CrossRef]
  85. Cleary, K.A.; Waits, L.; Finegan, B. Agricultural intensification alters bat assemblage composition and abundance in a dynamic Neotropical landscape. Biotropica 2016, 48, 667–676. [Google Scholar] [CrossRef]
  86. Cadenasso, M.L.; Pickett, S.T.A.; Weathers, K.C.; Jones, C.G. A framework for a theory of ecological boundaries. Bioscience 2003, 53, 750–758. [Google Scholar] [CrossRef]
  87. Fagan, W.E.; Cantrell, R.S.; Cosner, C. How habitat edges change species interactions. Am. Nat. 1999, 153, 165–182. [Google Scholar] [CrossRef] [PubMed]
  88. Ries, L.; Fletcher, R.J.; Battin, J.; Sisk, T.D. Ecological responses to habitat edges: Mechanisms, models, and variability explained. Annu. Rev. Ecol. Evol. Syst. 2004, 35, 491–522. [Google Scholar] [CrossRef] [Green Version]
  89. Arroyo-Rodríguez, V.; Pérez-Elissetche, G.K.; Ordóñez-Gómez, J.D.; González-Zamora, A.; Chavez, O.M.; Sánchez-López, S.; Chapman, C.A.; Moralez-Hernández, K.; Pablo-Rodríguez, M.; Ramos-Fernández, G. Spider monkeys in human-modified landscapes: The importance of the matrix. Trop. Conserv. Sci. 2017, 10, 1–13. [Google Scholar] [CrossRef] [Green Version]
  90. Syiem, B.L.N.; Goswami, V.R.; Vasudev, D. “In a tree by the brook, there’s a songbird who sings”: Woodlands in an agricultural matrix maintain functionality of a wintering bird community. PLoS ONE 2018, 13, e0201657. [Google Scholar] [CrossRef] [Green Version]
  91. de la Pena-Cuellar, E.; Benitez-Malvido, J.; Avila-Cabadilla, D.L.; Martinez-Ramos, M.; Estrada, A. Structure and diversity of phyllostomid bat assemblages on riparian corridors in a human-dominated tropical landscape. Ecol. Evol. 2015, 5, 903–913. [Google Scholar] [CrossRef]
  92. Silveira, J.M.; Louzada, J.; Barlow, J.; Andrade, R.; Mestre, L.; Solar, R.; Lacau, S.; Cochrane, M.A. A multi-taxa assessment of biodiversity change after single and recurrent wildfires in a Brazilian Amazon forest. Biotropica 2015, 48, 170–180. [Google Scholar] [CrossRef]
  93. Bernard, E.; Fenton, M.B. Bat mobility and roosts in a fragmented landscape in central Amazonia, Brazil. Biotropica 2003, 35, 262–277. [Google Scholar] [CrossRef]
  94. Gorrensen, P.M.; Willig, M.R. Landscape responses of bats to habitat fragmentation in Atlantic forest of Paraguay. J. Mammal. 2004, 85, 688–697. [Google Scholar] [CrossRef] [Green Version]
  95. Willig, M.R.; Presley, S.J.; Bloch, C.P.; Hice, C.L.; Yanoviak, S.P.; Diaz, M.M.; Chauca, L.A.; Pacheco, V.; Weaver, S.C. Phyllostomid bats of lowland Amazonia: Effects of habitat alteration on abundance. Biotropica 2007, 39, 737–746. [Google Scholar] [CrossRef]
  96. Cordero-Schmidt, E.; Medeiros-Guimarāes, M.; Vargas-Mena, J.C.; Carvalho, B.; Lopes Ferreira, R.; Rodriguez-Herrera, B.; Venticinque, E.M. Are leaves good option in Caatinga’s menu? First record of folivory in Artibeus planirostris (Phyllostomidae) in the semiarid forest, Brazil. Acta Chiropterol. 2016, 18, 489–497. [Google Scholar] [CrossRef]
  97. Faria, D. Phyllostomid bats of a fragmented landscape in the north-eastern Atlantic forest, Brazil. J. Trop. Ecol. 2006, 22, 531–542. [Google Scholar] [CrossRef] [Green Version]
  98. Remsen, J.V.; Good, D.A. Misuse of data from mist-net captures to assess relative abundance in bird populations. Auk 1986, 113, 381–398. [Google Scholar] [CrossRef]
  99. Claireau, F.; Bas, Y.; Pauwels, J.; Puechmaille, S.; Julien, J.F.; Machon, N.; Allegrini, B.; Kerbiriou, C. Major roads have important effects on insectivorous bats activity. Biol. Conserv. 2019, 235, 53–62. [Google Scholar] [CrossRef]
  100. Medinas, D.; Marques, J.T.; Mira, A. Assessing road effects on bats: The role of landscape, road features, and bat activity on road-kills. Ecol. Res. 2013, 28, 227–237. [Google Scholar] [CrossRef] [Green Version]
  101. Medinas, D.; Ribeiro, V.; Marques, J.T.; Silva, B.; Barbosa, A.M.; Rebelo, H.; Mira, A. Road effects on bat activity depend on surrounding habitat type. Sci. Total Environ. 2019, 660, 340–347. [Google Scholar] [CrossRef]
  102. Yoh, N.; Syme, P.; Rocha, R.; Meyer, C.F.J.; López-Baucells, A. Echolocation of Central Amazonian ‘whispering’ phyllostomid bats: Call design and interspecific variation. Mamm. Res. 2020. [Google Scholar] [CrossRef]
  103. Boulinier, T.; Nichols, J.D.; Sauer, J.R.; Hines, J.E.; Pollock, K.H. Estimating species richness: The importance of heterogeneity in species detectability. Ecology 1998, 79, 1018–1028. [Google Scholar] [CrossRef]
  104. Kéry, M.; Plattner, M. Species richness estimation and determinants of species detectability in butterfly monitoring programmes. Ecol. Entomol. 2007, 32, 53–61. [Google Scholar] [CrossRef]
  105. Kéry, M.; Royle, J.A. Hierarchical Bayes estimation of species richness and occupancy in spatially replicated surveys. J. Appl. Ecol. 2008, 45, 589–598. [Google Scholar] [CrossRef]
  106. Meyer, C.F.J.; Aguiar, L.M.S.; Aguirre, L.F.; Baumgarten, J.; Clarke, F.M.; Cosson, J.F.; Estrada Villegas, S.; Fahr, J.; Faria, D.; Furey, N.; et al. Accounting for detectability improves estimates of species richness in tropical bat surveys. J. Appl. Ecol. 2011, 48, 777–787. [Google Scholar] [CrossRef]
  107. Boyles, J.G.; Cryan, P.M.; McCracken, G.F.; Kunz, T.H. Economic Importance of Bats in Agriculture. Science 2011, 332, 41–42. [Google Scholar] [CrossRef]
  108. Karp, D.S.; Mendenhall, C.D.; Sandí, R.F.; Chaumont, N.; Ehrlich, P.R.; Hadly, E.A.; Daily, G.C. Forest bolsters bird abundance, pest control and coffee yield. Ecol. Lett. 2013, 16, 1339–1347. [Google Scholar] [CrossRef]
  109. Maas, B.; Karp, D.S.; Bumrungsri, S.; Darras, K.; Gonthier, D.; Huang, J.C.C.; Lindell, C.A.; Maine, J.J.; Mestre, L.; Mitchel, N.L.; et al. Bird and bat predation services in tropical forest and agroforestry landscapes. Biol. Rev. 2015, 91, 1081–1101. [Google Scholar] [CrossRef] [Green Version]
  110. Cottam, G.; Curtis, J.T. The use of distance measures in phytosociological sampling. Ecology 1956, 37, 451–460. [Google Scholar] [CrossRef]
  111. MacArthur, R.; MacArthur, J.W. On bird species-diversity. Ecology 1961, 42, 594–598. [Google Scholar] [CrossRef]
  112. Zellweger, F.; Baltensweiler, A.; Ginzler, C.; Roth, T.; Braunisch, V.; Bugmann, H.; Bollmann, K. Environmental predictors of species richness in forest landscapes: Abiotic factors versus vegetation structure. J. Biogeogr. 2016, 43, 1080–1090. [Google Scholar] [CrossRef]
  113. Marsden, S.J.; Fielding, A.H.; Mead, C.; Hussin, M.Z. A technique for measuring the density and complexity of understorey vegetation in tropical forests. For. Ecol. Manag. 2002, 165, 117–123. [Google Scholar] [CrossRef]
  114. Rueden, C.T.; Schindelin, J.; Hiner, M.C.; DeZonia, B.E.; Walter, A.E.; Arena, E.T.; Eliceiri, K.W. ImageJ2: ImageJ for the next generation of scientific image data. BMC Bioinform. 2017, 18, 529. [Google Scholar] [CrossRef] [PubMed]
Figure 1. Location of the 12 sampling sites in Madre de Dios, Peru.
Diversity 12 00238 g001
Figure 2. Sampling design. Dotted lines represent transects in each vegetation type. Solid short lines represent mist-nets. Dashed line represents the Interoceanic Highway.
Diversity 12 00238 g002
Figure 3. Non-metric multidimensional scaling (NMDS) with ordination based on Bray–Curtis dissimilarities to compare vegetation types by site category. Triangles represent forest interiors, circles represent forest edges, and squares represent agricultural land. Black-filled symbols represent vegetation types at papaya site category and empty symbols represent vegetation types at cattle pasture site category. Green shadow highlights forest interior, light blue shadow highlights forest edge, gray shadow highlights agricultural land. Vegetation types drives separation in replicates along the first axis.
Diversity 12 00238 g003
Figure 4. Non-metric multidimensional scaling (NMDS) with ordination based on Bray–Curtis dissimilarities to compare forest interiors and forest edges by site category. Triangles represent forest interiors and circles represent forest edges. Black-filled symbols represent vegetation types at papaya sites and empty symbols represent vegetation types at pasture sites. Vectors represent explanatory variables and their lengths represent the strengths of their relationship with NMDS axis. We excluded agricultural land from this analysis because vegetation measurements were only made at forest interiors and forest edges.
Diversity 12 00238 g004
Figure 5. Comparison between site categories and vegetation types. (a) Mean expected species richness obtained with Jackknife 1; (b) mean capture rates at different vegetation types within sites categories. Dots represent the mean values for the expected richness, taking the average of the replicates per vegetation type within each site category. Lines represent standard error bars (mean ± standard error (SE)).
Diversity 12 00238 g005
Figure 6. Percentage of captures rate for species that registered more than 5% of overall occurrence. Species are arranged from higher percentage in forest interior to only found in agricultural land. (a) Papaya plantations site category; (b) cattle pasture site category.
Diversity 12 00238 g006
Figure 7. Graphs show the presence and absence of phyllostomid species per trophic guilds at different vegetation types in both site categories. (a) Papaya sites; (b) cattle pasture sites. We show 43 positions per vegetation type corresponding to each of the phyllostomid species registered during the study. Species are grouped by trophic guilds. As an example, third position in the first row corresponds to the frugivore Artibeus obscurus that was registered in forest interior, forest edge, papaya plantation but absent in cattle pasture vegetation type. Also, all gleaning insectivores were lost in cattle pasture. Frugivores: highly cluttered space-gleaning frugivore, Nec: highly cluttered space-gleaning nectarivore, Omn: highly cluttered space-gleaning omnivore, Insec: highly cluttered space-gleaning insectivore, Carn: highly cluttered space-gleaning carnivore, Sang: highly cluttered space-gleaning sanguivore. Order of species per vegetation type: first line: Artibeus planirostris, Artibeus lituratus, Artibeus obscurus, Carollia pespicillata, Carollia brevicauda, Carollia benkeithi; second line: Sturnira giannae, Sturnira tildae, Platyrrhinus incarum, Platyrrhinus brachycephalus, Rhinophylla pumilio, Uroderma bilobatum; third line: Uroderma magnirostrum, Artibeus glaucus, Artibeus anderseni, Artibeus gnomus, Artibeus cinereus, Platyrrhinus infuscus; fourth line: Mesophylla macconnelli, Vamyriscus bidens, Phylloderma stenops, Chiroderma villosum, Chiroderma trinitatum, Chiroderma salvini; fifth lines: Vampyressa thyone, Vampyrodes caraccioli, Sphaeronycteris toxophyllum; sixth line: Glossophaga soricina, Hsunycteristhomasi; eitght line: Phyllostomus elongatus, Phyllostomus hastatus, Phyllostomus discolor, ninth line: Gardnerycteris crenulatum, Lophostoma silvicolum, Tonatia maresi, Micronycteris minuta, Trinycteris nicefori, Lophostoma brasiliense; tenth line: Micronycteris megalotis; eleventh line: Chrotopterus auritus, Trachops cirrhosus; twelfth line: Desmodus rotundus, Diphylla ecaudata.
Diversity 12 00238 g007
Figure 8. Comparison between site categories and vegetation types for: (a) evenness of dispersion [1E(T)], (b) functional trait dispersion [1D(TM)]. “q” represents the order of diversity metric that determines the weighting of proportional abundances; in the case of this study q equals 1 in the metric symbol. Dots represent the mean values pooling together the data for the vegetation types at all the study sites per category. Lines represent standard error bars (mean ± SE).
Diversity 12 00238 g008
Table 1. Individuals captured for all species registered and specimens collected during the present study. (HCIns) highly cluttered space gleaning insectivores, (Car) highly cluttered space gleaning carnivores, (San) highly cluttered space gleaning sanguivores, (Fru) highly cluttered space gleaning frugivores, (Nec) highly cluttered space gleaning nectarivores, (Omn) highly cluttered space gleaning omnivores.
SpeciesPapaya Plantation SitesCattle Pasture SitesTotalGuildCollection Number
EdgeForestAgricultural AreaEdgeForestAgricultural Area
Artibeus lituratus353582413363289FruCEBIOMAS0497
Artibeus obscurus6354421070Fru
Artibeus planirostris1781675711241212051366FruCEBIOMAS0505
Artibeus anderseni2004309FruCEBIOMAS0493, CEBIOMAS0495
Artibeus cinereus0010102Fru
Artibeus glaucus25103011FruCEBIOMAS0485, CEBIOMAS0498
Artibeus gnomus1111105FruCEBIOMAS0499
Carollia benkeithi53192020Fru
Carollia brevicauda58741139322216FruCEBIOMAS0484, CEBIOMAS0506
Carollia perspicillata22119719914513439935FruCEBIOMAS0490, CEBIOMAS0491
Chiroderma salvini1000001Fru
Chiroderma trinitatum0050016Fru
Chiroderma villosum2021027Fru
Chrotopterus auritus0500106Car
Desmodus rotundus2110105San
Diphylla ecaudata0010001San
Glossophaga soricina14616255874NecCEBIOMAS0496, CEBIOMAS0504, CEBIOMAS0508, CEBIOMAS0510, CEBIOMAS0512
Hsunycteris thomasi47511018NecCEBIOMAS0511
Lophostoma brasiliense0000101HCInsCEBIOMAS0503
Lophostoma silvicolum313028026HCIns
Mesophylla macconnelli34842122Fru
Micronycteris megalotis0200103HCInsCEBIOMAS0502
Micronycteris minuta4110006HCInsCEBIOMAS0500
Gardnerycteris crenulatum5310009HCInsCEBIOMAS0507
Phylloderma stenops4001005Fru
Phyllostomus discolor0010001Omn
Phyllostomus elongatus8142216042Omn
Phyllostomus hastatus441257335Omn
Platyrrhinus brachycephalus0110046Fru
Platyrrhinus incarum7222441352FruCEBIOMAS0509
Platyrrhinus infuscus1011003Fru
Rhinophylla pumilio4160519044Fru
Sphaeronycteris toxophyllum1001103Fru
Sturnira giannae26133170481FruCEBIOMAS0487
Sturnira tildae2445253465FruCEBIOMAS0488, CEBIOMAS0494, CEBIOMAS0492
Tonatia maresi3200106HCIns
Trachops cirrhosus35101010Car
Trinycteris nicefori1210105HCIns
Uroderma bilobatum841052736FruCEBIOMAS0486, CEBIOMAS0489
Uroderma magnirostrum52702622FruCEBIOMAS0501
Vampyressa thyone1200115Fru
Vampyriscus bidens42400111Fru
Vampyrodes caracciolli0000101Fru
Table 2. Correlation values (r2) between the explanatory variables and the non-metric multidimensional scaling (NMDS) axis that compares forest interiors and forest edges by site category in Figure 4.
VariableNMDS1NMDS2r2p
Foliage height index−0.491−0.8710.0050.95
Horizontal vegetation density0.9970.0740.3890.008
Mean canopy height−0.846−0.5330.4220.005
Temperature variation0.8550.5190.060.501
Table 3. Overall observed and estimated species richness for different vegetation types per site category. SE = standard error.
Site CategoryVegetation TypeObserved SpeciesJackknife 1Jackknife 1–SEIndividuals Captured
Papaya plantationForest interior3135.992.23620
Papaya plantationForest edge3439.992.44650
Papaya plantationAgricultural land3143.993.601011
Cattle pastureForest interior3143.973.60430
Cattle pastureForest edge2328.992.44466
Cattle pastureAgricultural land1720.991.99364
Table 4. Analysis of variance for estimated richness (Jackknife 1) and capture rate.
Taxonomic Diversity MetricVariabledfSum SquareMean SquareFp
Estimated species richnessvegetation type251.725.90.7410.485
site category1393.2393.211.2660.002
vegetation type:site category226.513.20.3790.688
Residuals301047.134.9
Capture ratevegetation type2702135112.2590.122
site category1340734072.1930.149
vegetation type:site category2592929641.9080.166
Residuals3046,6231554
Table 5. Analysis of variance for functional diversity metrics. 1E(T) = evenness of dispersion, 1D(TM) = functional trait species dispersion.
Functional Diversity MetricVariabledfSum SquareMean SquareFp
1E(T)vegetation type20.00670.00340.2750.761
site category10.24860.248620.358<0.001
vegetation type:site category20.07970.03993.2640.052
Residuals300.36630.0122
1D(TM)vegetation type21.370.695.1110.012
site category10.090.090.6510.426
vegetation type:site category20.160.080.5890.561
Residuals304.020.13

