Abstract
Surveys of managed honey bee colony losses worldwide have become fundamental for engineering a sustainable and systematic approach to protect honey bees. Though China is a member of the world’s apiculture superpowers, the investigation of honey bee colony losses from Chinese government was not formally launched until recently. In this study, we investigated the colony winter losses of the western honey bee (Apis mellifera) of four consecutive years in 2013–2017 from 19 provinces in China, with a total of 2387 responding Chinese beekeepers (195 hobby beekeepers, 1789 side-line beekeepers, 403 commercial beekeepers) providing the records of overwintering mortality of honey bee colonies. The calculated colony losses were 8.7%, a relatively low mortality below the world average. There still exist considerable variations in total losses among provinces (ranging from 0.9% to 22.0%), years (ranging from 8.1% to 10.6%) and scales of apiaries (ranging from 7.5% to 10.0%). Furthermore, we deeply analyzed and estimated the effects of potential risk factors on the colonies’ winter losses, and speculated that the queen problems, the operation sizes and proportion of new queens are leading causes of the high honey bee colony mortality in China. More research and advanced technical methods are still required for correlation analysis and verification in future surveys of managed honey bee colony winter losses.
1. Introduction
Honey bees, important pollinators, have been demonstrated to be capable of increasing yield in 96% of animal-pollinated crops, creating a value of 212 billion dollars annually [1,2]. However, feral and managed honey bee colony losses consistently maintained a very high level worldwide in recent years, and substantial concerns have been raised about the future availability of honey bee pollination services [3]. As a consequence, global surveys on the mortality rate of honey bee colonies continue to be carried out by scientists from various perspectives [4,5,6,7,8]. National surveys of managed honey bee colony losses have been performed and reported continuously in the United States for several years [9,10,11,12,13,14], as well as in Europe [5,6,15,16,17,18], Asia [19,20], and Africa [21]. It has been revealed in the United States, Europe, and other regions that honey bee colonies have a high mortality rate. The mortality of honey bee colonies is caused by multiple factors and these potential risk factors are also interacting, so the measures to lower colony decline should be as diversified as the causes [4,5,13,14]. These survey results show that potential risk factors driving honey bee colony decline could involve queen problems, diseases and parasites, the environment, beekeeping practices, etc., with a geographic bias toward several different regions, but the underlying causes still remain ambiguous [12,13,14,22,23]. To cope with inestimable colony losses and prevent population crashes, major beekeepers generally increase the number of honey bee colonies by purchasing package swarms of bees or splitting existing colonies. The protection and management of core colonies have been widely recognized as an increasingly extensive hedge against severe colony losses. China is one of the largest beekeeping countries with an estimated nine million managed colonies. Honey bee colonies overwintering in northern China (central, east, and west) usually occur in November to March, including Beijing, Hebei, and Shanxi provinces, etc. An overwinter period of higher latitude provinces in northern China will extend 10 days to a month and the temperature will be lower. But in southern China, some provinces are warm throughout the year without overwintering. For example, honey bees breed largely from December to February, collecting nectar from litchi and longan in Hainan. Queen replacement, migration, treatment against Varroa destructor, pollination, etc. are likely to affect colony status before overwintering. Chinese beekeepers feed the colonies with honeycombs or sugar for winter supply. Other management includes heat preservation, moisture, and rodent control, etc. Surveys of honey bee (A. mellifera) colony losses in China have been conducted since 2009 [19]. Previous studies have shown the western honey bee colony mortalities in China were at a relatively low level, which may be associated with China’s special practices of beekeeping [19]. Here, we reported the results of a continued survey of the colony winter losses from 2013 to 2017 and explored possible influencing factors using linear models.
2. Materials and Methods
2.1. Survey and Data Acquisition
The questionnaire of our survey is designed in accordance with the standardized questionnaire template from the COLOSS (prevention of honey bee COlony LOSSes) network, published by van der Zee et al. in 2013 and modified for the apicultural situation of China [24]. The questionnaire can be divided into two parts, that is, basic questions for collecting colony losses and apiary information, and optional questions for bee management and production. Optional questions include food, migration, bee race, queen replacement, pollination services, treatment against V. destructor, etc. All the data from this survey were collected through the questionnaire as shown below (Figure 1). Paper versions of the questionnaire were distributed to local beekeeping organizations, that delegated surveyors to randomly select and communicate with beekeepers face-to-face in daily visits or at an annual conference. All the completed questionnaires are then returned back to our center for a database update between October of the current year and April of the following year.
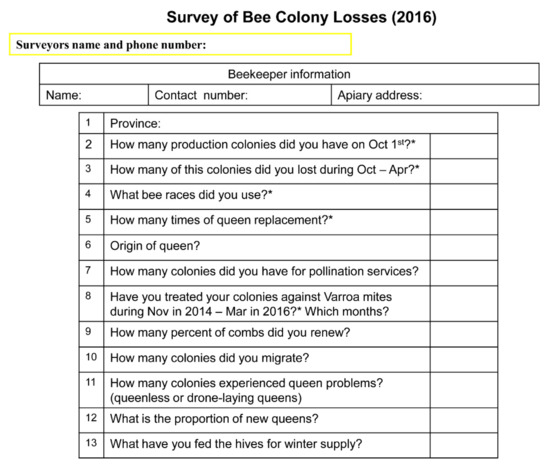
Figure 1.
An example of a modified questionnaire based on the standardized questionnaire from COLOSS monitoring working group combined with beekeeping situations in China. The asterisk indicates required questions that would not allow a blank response on the questionnaire.
2.2. Calculation and Statistical Analysis
Data were filtered to remove duplications and those with invalid entries (number of losses > original colony number, or number of overwintering colonies = 0), and the remaining data were used for data statistics. Regarding loss rates, “total loss” and “average loss” are two methods of loss rates calculation mentioned in van der Zee or others’ articles [10,24]. The average loss is the mean of the individual colony winter losses of all beekeepers. The total loss is the percentage of the total number of colonies lost divided by the total number of colonies in our sample. The author recommends the total loss rate, because “total loss” can reflect the loss situation of a whole group more accurately than “average loss”. Therefore, this study adopts the calculation method of the total loss rate and the formula is listed as below.
Regarding the operation size, the apiaries of China can be classified into the following three groups: hobby (1–50 colonies), side-line (51–200 colonies) and commercial (>200 colonies) using the criteria outlined by Chen et al. (2017) and Liu et al. (2016) rather than other surveys from foreign countries [11,13,14], because of the diversity of management style and scale between China and other countries. Confidence interval (CI) was calculated using an intercept-only generalized linear model (GLM) with a quasi-binomial distribution and a logit link function, reducing its overdispersion effect. Kruskal-Wallis rank sum test was used to explore the differences within sub-groups of respondents by “dunn” package. Confirmed by large quantities of investigations and studies, generalized linear mixed models (GLMMs) with binomial distributions are recommended to detect the impact of potential risk factors on honey bee colony losses, which incorporate both fixed and random effects, and this statistical analysis method is still adopted in this manuscript [5]. For further model fitting, we considered proportion of new queens, queen problems, migration, the operation size, pollination, frequency of requeening, comb renewal and treatment against V. destructor as fixed effects into the model, and random effects such as provinces, years and beekeepers were also included.
All statistical analyses were performed in R statistical software (R Development Core Team, Vienna, Austria, 2015). GLMMs analysis was carried out through the glmer function in the “lme4” package [5].
3. Results
3.1. Survey Data
From the surveyed years, we collected the most data in 2013–2014 (Figure S1a). The majority of respondents in our survey were side-line and commercial beekeepers (Figure S1b). Over half of the respondents replied that they changed queens once a year (Figure S1c), and all of the beekeepers treated V. destructor mites of their colonies (Figure S1d). The percentage of new combs built by honey bees was concentrated at 21–40% (Figure S1e). The percent of respondents or colonies with a 0–20% proportion of new queens made up roughly 80% (Figure S1f). Over 99% respondents or colonies limited the number of disabled queens to 30 (Figure S1g). Regarding the origins of queens, the beekeepers who bought queens from companies were more than the ones who reared queens by themselves in the side-line and commercial beekeepers (Figure S1h).
3.2. National Total Losses in Winter
In total, this survey recorded 2463 responses, from which 76 duplicates or invalid responses were removed. The remaining 2387 responses formed the analytic sample and comprise a total of 333,107 managed honey bee colonies for loss rates calculation, of which 1166 responses were in 2013–2014, 362 responses were in 2014–2015, 453 responses were in 2015–2016, and 406 responses were in 2016–2017 (Figure S1a). The colony numbers of each year were 178,802 (2013–2014), 44,799 (2014–2015), 57,928 (2015–2016), 51,578 (2016–2017), respectively (Figure S1a). Of the all valid responses, 37.0% respondents reported that they did not suffer colony winter losses. Total losses we calculated were comparatively low (8.7%, 95% CI: 8.2–9.2%) and varied from year to year, with the highest annual losses in 2014–2015 (10.5 %, 95% CI: 9.2–11.8%) and the lowest annual losses in 2016–2017 (8.1%, 95% CI: 7.1–9.1%), as shown in Figure 2. Kruskal-Wallis rank sum test was used for exploring potential differences within annual losses (χ2 = 54.5553, df = 3, all p-value < 0.005), and only the loss rate in 2013–2014 had significant differences compared with other years (Figure 2).
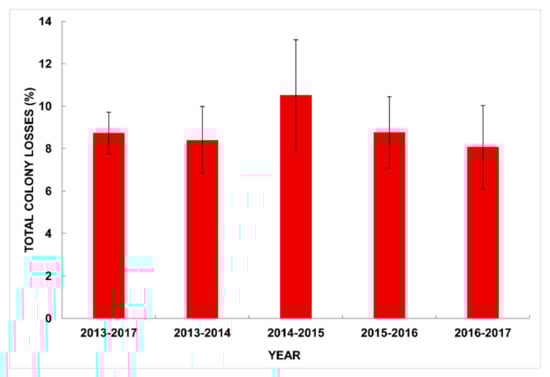
Figure 2.
Total colony winter losses for the different periods of years. Means and 95% confidence intervals are shown.
3.3. Losses by Operation Size (Apiary Size)
From the dataset of our survey, we figured out that the percentages of hobby, side-line and commercial beekeeping were 8.2% (N = 195), 74.9% (N = 1789) and 16.9% (N = 403), respectively (Figure S1b). The hobby managed a total amount of 6282 (1.9%) honey bee colonies with a 10.0% (95% CI: 7.7–12.3%) loss rate and 70.3% (N = 137) of this group reported no loss (Figure S1b). The side-line managed a total amount of 188,098 (56.5%) honey bee colonies with an 8.9% (95% CI: 8.3–9.4%) loss rate and 27.7% (N = 496) of this group reported no loss (Figure S1b). The commercial managed a total amount of 138,727 (41.6%) honey bee colonies with a 7.5% (95% CI: 6.0–8.9%) loss rate and 50.6% (N = 204) of this group reported no loss (Figure S1b). In accordance with the above data, nearly 60% of the colonies represented in our study were approximately managed by the side-line beekeepers or respondents. There exists an apparent difference among diverse types of apiaries. Four-year total losses suffered by commercial beekeepers tended to be lower than those suffered by side-line and hobby beekeepers. Larger scale apiary owners have lower mortalities. But for annual losses of different apiaries, the loss rate of commercial apiaries varies from 1.7% (95% CI: −0.02–3.3%) to 9.0% (95% CI: 6.8–11.2%) with the obvious fluctuation and the lowest value occurred in 2014–2015 (Figure 3). The difference was significant (χ2 = 27.2078, df = 3, all p-value < 0.001). The annual colony losses of hobby beekeepers came up to the peak of 13.3% (95% CI: 9.2–17.3%) in 2016–2017 with its other annual colony losses holding stably. The mortality of hobby beekeepers in 2016–2017 has significant difference with other years, tested by Kruskal-Wallis rank sum test (χ2 = 29.8676, df = 3, all p-value < 0.005). Shown in Figure 3, side-line beekeepers in 2013-2014 had significantly lower colony losses than hobby and commercial beekeepers (χ2 = 18.4817, df = 2, p-value < 0.01). In contrast to the total losses of different types of apiaries, the loss rate of side-line apiaries in 2015–2016 was significantly lower than the rest of the two types of apiaries (χ2 = 37.9973, df = 2, p-value < 0.001) (Figure 3). In conclusion, although special cases may occur in a certain year, theoretically, a general tendency is that larger operation size with smaller colony winter losses is evident and worthy of attention. Our previous survey reported that smaller apiaries tend to have lower mortalities, which disagrees with these current results [16]. But we found that the mortality trends of different operation sizes in a certain year was not always consistent with the overall trend, which appears in both of our surveys. We believe the factors that contribute to the results are very complex and more data and methods should be applied afterwards. Regardless of the operation size, colony losses are lower in China than in most of the other countries or regions of the world [5] (Figure 3).
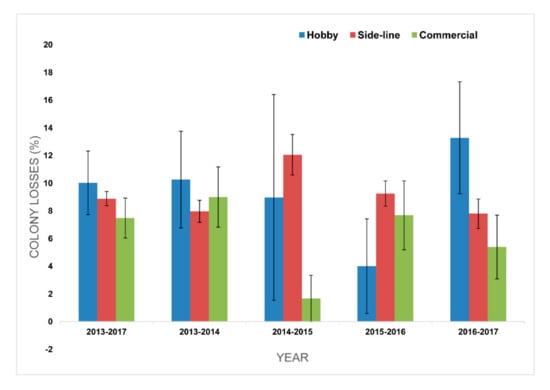
Figure 3.
Comparison of colony winter losses by different type of apiaries for the years 2013–2017, 2013–2014, 2014–2015, 2015–2016 and 2016–2017. Means and 95% confidence intervals are shown.
3.4. Losses by Province
The number of the apiaries and the colony losses in any surveyed provinces that operated exclusively in that province were summarized with a visible variation across 19 provinces of China (Table 1). The total losses calculated from the respondents’ records also varied substantially across provinces. The total losses experienced by several surveyed provinces ranged from 0.9% to 22.0% with a highest loss rate in Jiangxi (JX) province and a lowest loss rate in Yunnan (YN) province (Table 1 and Figure 4). The provinces surveyed with significantly low colony losses include Gansu (GS) 1.7% (95% CI: 1.1–2.5%) and Yunnan (YN) 0.9% (95% CI: −0.06–1.9%), which fell far below all other provinces surveyed. Jiangxi (JX) and Henan (HN) can be classified into one group with higher loss rates and their losses were 22.0% (95% CI: 13.2–30.8%), 19.4% (95% CI: 18.4–20.5%) (Table 1 and Figure 4). But only data of Jiangxi (JX) province for 2016–2017 and Yunnan (HN) province in 2013–2014 were collected and calculated, the colony losses may be biased and specificity in a given year cannot be completely ruled out (Figure S2). The following six provinces, Zhejiang (ZJ), Shanxi (SX), Beijing (BJ), Anhui (AH), Xinjiang (XJ) and Guangxi (GX) revealed that the colony losses were kept at a moderate level (Table 1). In accordance with the discrepancy of clime and geographical environment of China, we selected several representative provinces from this survey to analyze and compare the annual colony losses. As shown in the following table (Table 2), the candidate provincial loss rates for a single year were also calculated and these provinces are Hainan (HN), Sichuan (SC), Gansu (GS), Henan (HEN), Jilin (JL) and Liaoning (LN), respectively. The loss rate of four consecutive years in Jilin (JL) province was basically maintained at a low level, which was lower than the total colony winter loss of this survey. Accidentally, Sichuan (SC) province demonstrated extremely low mortality in 2014–2015, which was possibly caused by the favorable climate in that year, the abundant nectar and pollen plant resources or the policy welfare. The specific reasons are still to be determined. The loss rates of Gansu (GS) province were also comparatively stable and maintained the lowest level of six selected provinces over the years, which cannot be separated from the long apiculture history and excellent beekeeping skills. Henan (HEN) province showed the highest loss of 22.5% (95% CI: 21.4–23.7%) in 2014–2015, which exceeded the losses in 2013–2014 and 2016–2017. In Liaoning (LN) province, annual loss was highest in 2013–2014, followed by declines in 2015–2016 and 2016–2017.

Table 1.
Provincial total winter losses (%, CI 95%) and number of apiaries in 2013–2017.
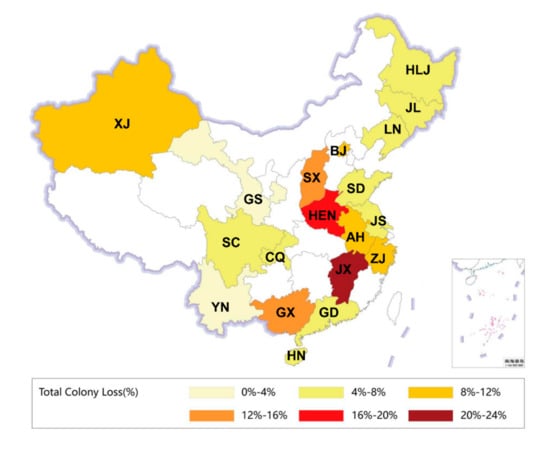
Figure 4.
Total colony winter losses (%) by different provinces of China.
Table 2.
Annual total winter losses (%, CI 95%) in Hainan (HN), Sichuan (SC), Gansu (GS), Henan (HEN), Jilin (JL), Liaoning (LN) province.
3.5. Potential Risk Factor
A total of 2387 respondents answered the questions about frequency of requeening, bee races, comb renewal, treatment against V. destructor, queen problem, proportion of new queens, apiary size, etc., in our survey. Based on the analysis methods previously presented by van der Zee et al. [5], we also used the GLMMs method to evaluate the effect of candidate risk factors on colony winter losses. Before assessment, a null generalized linear mixed model was adapted for our collected valid data including provinces, beekeepers and years as random factors. Next, we screened the above primary explanatory factors (as the covariates) for the risk of loss, one factor at a time, including queen problems, frequency of requeening, comb renewal, treatment against V. destructor, proportion of new queens and apiary size. Besides the treatment against V. destructor, the remaining factors were highly-significant fixed factors on colony winter losses. In this survey, we referred to the test process of modeling fitting in previous articles published by our group in 2016 [19], the results of which indicated that a full model with provinces, beekeepers and years still provided a better fit, and this part of the data is not shown. After examining the fixed factors individually, we constructed a full model containing all of the above significant covariates and three random factors. However, comb renewal, frequency of requeening or treatment against V. destructor showed no significant effect when taken together rather than individually. Therefore, dimensionality reduction was carried out for the above three risk factors to obtain the final model only with queen problems, proportion of new queens and apiary size as the covariates (Table 3). From daily communication with beekeepers or respondents, it can be seen that beekeepers who suspected queen problems as being responsible for colony winter losses tended to suffer higher losses than those who suspected races or winter supply failure as the major causes of colony winter losses, which to some extent is consistent with this survey’s results. Our result indicates the colonies with queen problems have a higher risk of losses, which is consistent with the results of previous surveys [19]. Indeed, in many studies, the queen problem is regarded as an important negative factor for colony survival [18,25,26]. In this survey, we found that proportion of new queens is significantly associated with colony winter losses. An Austrian survey proved that when beekeepers exchanged more than one-fourth of their old queens before winter, then the colony losses would be significantly reduced [18,27,28,29]. Apiary size also significantly affects colony winter losses. Significantly different loss rates among apiary sizes were already summarized before [7,30]. We also found that there is no significant correlation between treatment against V. destructor and loss rate, which is in disagreement with many previous studies [8,9,11,14,17]. It has been reported that Varroa spp. mites control failure has significant negative effects on colony losses [8,9,11,14,17]. V. destructor mites are present in China [31,32]. We think that insufficient data may explain the insignificance of treatment against V. destructor on colony losses in the GLMMs analysis. We only surveyed whether the respondents treated V. destructor mites, and all of the respondents answered ‘Yes’ (Figure S1d). We recommend further studies so as to have better insight into this issue by adding the method and the effect of treatment against V. destructor.
Table 3.
Analysis of fixed effects in the final model.
4. Discussion
China has a large number of managed honey bee colonies and beekeepers. Our survey covers 2463 beekeepers, constituting ~0.8% of all beekeepers (including A. mellifera and A. cerana beekeepers). The number of colonies involved is 333,107 constituting ~5.6% of A. mellifera colonies in China. The coverage is lower than that of other studies [12,13,14], however, this study focuses on A. mellifera beekeepers instead of A. cerana beekeepers, and therefore the representation is higher than this figure. But without the knowledge of the number of A. mellifera beekeepers, it is hard to have an estimate. Due to difficulties in surveying among beekeepers in China, our study represents great efforts. Beekeepers in China are not required to register, and therefore contact information is not readily available. In addition, email is not common for communications among beekeepers, and questionnaires had to be distributed in other forms, such as printouts in meetings and training sessions, telephone communication, etc. Such forms of communication are time consuming and expansion to a larger scale is difficult. It is possible to expand the survey in digital form in the future with networking cellphone applications such as Wechat, as it is important to establish a way to reach out to beekeepers, especially to those located in remote mountainous areas with below average internet coverage. In China, apiaries are mostly located in mountainous areas and beekeepers aging is significant, therefore coverage deviation caused by the low internet/electronic access will arise if surveys are only done through the electronic/network method. To our knowledge, this is among the largest surveys on colony winter losses in China. Also, our respondents may be biased toward the more active beekeepers because we are more likely to get in contact with the active beekeepers than those who are less active. To minimize bias, questionnaires were sent to local beekeeping organizations who have better knowledge of local beekeepers, and the beekeeping organizations were requested to minimize bias such as geographical representation. However, inference in terms of the whole population is a possibility and thus data should be approached with caution.
Investigations were done in the main beekeeping provinces of China, but it is still not practical for us to cover all of the apiculture provinces. Handover of vulnerability or imperfect cooperation sometimes leads to a lack of losses data in a certain year and province, causing an effect on the final outcomes and conclusions. Despite these shortcomings, the present survey still had coverage of losses feedback data from most parts of China. In the future, our methods of questionnaire collection could be further diversified to ensure the randomness of data, by adopting new communication methods.
In this study we conducted a detailed investigation and analysis of colony winter losses status in China for the four consecutive years from 2013 to 2017 with a comparatively low loss rate of 8.7%, which is lower than the total colony losses (10.1%, 95% CI: 9.5–10.7%) of A. mellifera from 2010 to 2013 [19]. At present, China has about 6.8 million honey bee (A. mellifera) colonies and more than three hundred thousand beekeepers. It is estimated from this survey that China suffers approximately 591,600 colonies losses each year on average. A loss of 12.8% in the current study can be considered as acceptable by the respondents, and our total colony losses reported in this survey is within the acceptable level [11]. First of all, it is shown that 62.6% of beekeepers replace the queens once a year and 96.5% of the colonies were ones with a replaced queen by beekeepers in this survey. With high frequency and proportion of requeening by Chinese beekeepers, the stability and survival of honey bee colonies can be greatly improved by the emergence of young queens [5,24,33]. Second, in the past, most beekeepers in China were likely to choose self-rearing for several generations, but this will lead to a simple genetic background, thereby not allowing for a varied environment, which is prejudicial to the honey bee colony survival. Nowadays, more Chinese beekeepers will regularly buy different commercial queens to enrich the genetic diversity of their colonies. Meanwhile, mating of the queens was always free and polyandrous [34,35]. In this way novel genetic diversity and distant heterosis could enhance the possibility of colony survival in harsh conditions [36,37]. Lastly, Chinese beekeepers have regarded treatment against V. destructor as a routine operation to prevent the occurrence of mite damage.
Colony losses variation among different provinces may be attributed to a number of reasons including beekeeping practices, climates, human activities, genetic composition and enemies/food, etc., [3,37,38]. Reasons for constant mortality level among the provinces need to be fully investigated. This survey has revealed that the mortality of Henan province has continued to remain at a high level compared with other provinces, which is in accordance with the survey results by Liu et al., who implied that the high mortality in Henan province may be related to the extensive use of pollen substitutes [19]. The pattern of colony losses in one province mainly remaining consistent and stable in all the surveyed years can be also observed in this survey. However, there is no such pattern of colony losses in the United States or other regions [9,11,14]. It is possible that differences in beekeeping habits are one of the key factors contributing to this gap. Afterwards, we should continue to track the colony losses of each province. If the colony losses from one province fluctuates dramatically in a single year, the crisis can be discovered without delay and effective intervention can be carried out to provide suggestions to policymakers.
As mentioned above, despite some abnormal cases, the trend of larger apiaries having lower colony winter losses can be still summarized (Figure 3). Beekeepers with a larger number of colonies are at a lower risk of colony losses, which has also been mentioned in some Austrian studies [17,18,39]. We speculate the reasons for this trend in China may be contributable to the following factors. First, in China, genetic composition of large apiaries is likely to be more diversified, resulting in the colonies being more stable [40,41,42]. Commercial beekeepers of China are used to regularly buying different commercial queens to supplement the genetic diversity of the colony (Figure S1h). Second, more standardized management and comprehensive disinfection and epidemic prevention from large apiaries help to reduce the probability of colony health problems, and then lower the colony losses to some extent. Third, beekeepers in larger apiaries have better training and richer experience than hobbyist beekeepers. However, the underlying causes are complex and further studies are needed to test the hypothesis.
By GLMMs analysis, we found that queen problems, apiary size and proportion of new queens have significant influences on colony winter losses. Many previous studies have demonstrated that there is a significant correlation between queen problems and colony losses, as is also shown in our survey [5,25,33] (Table 3). Those respondents who claimed that they suffered more serious queen problems often experienced higher colony losses. Queen problems partly reflect the health status of existing colonies, such as in-hive parasites or pesticide residues, etc. In our survey, the proportion of new queens is also one of the potential risk factors of colony losses, which is in accordance with van der Zee et al., 2014 [5]. Increasing the proportion of young queens can improve colony health and raise the brood and oviposition number of the colony [28,33,43]. It was mentioned that young queens lowered the risk of colony loss [28,33,43]. Our data showed that colony loss rates are significantly affected by apiary size. As mentioned above, larger apiaries of China have a lower risk of colony winter losses. Most of China’s beekeepers are side-line or commercial beekeepers (Figure S1b). We analyzed that genetic diversity, standardized management and beekeeping practice may explain this result, and may even be caused by the combination of these effects. Further investigations into beekeeping management should be carried out in the future. Unexpectedly, judging by the GLMM analysis from our survey the treatment against V. destructor showed to be insignificant for the impact of colony winter losses (Table 3). First, A. mellifera are known to be more susceptible to V. destructor mites than A. cerana. In China, A. mellifera beekeepers use V. destructor mite control as a routine practice, and the number of colonies without treatment against V. destructor in the survey was not sufficient for the analysis of V. destructor mites as a risk factor. In our survey, all of the respondents had at least once treatment against V. destructor. Therefore, insufficient data resulted in low statistical ability. Second, the current questionnaire does not include the types of treatment against V. destructor or the effects, and such information can be informative for our future surveys.
5. Conclusions
Our survey has recorded the colony winter losses of 19 provinces in China and has showed that loss rates vary among different years, provinces and the apiary sizes. We found that the national total losses of Western honey bee (A. mellifera) colonies in China is at a low level. By generalized linear mixed effects models (GLMMs) in this survey, queen problems, the apiary sizes and proportion of new queens rather than treatment against V. destructor, frequency of requeening and comb renewal were identified as risk factors with significant influences on colony winter losses. We concluded that a healthy, young and well-mated queen is an important factor for colony overwintering survival, probably because younger queens have stronger spawning ability and can build stronger colonies than older queens. Larger apiaries with lower risk of losses may be attributed to beekeeping management, colony genetic background or even a combination of these effects. In our survey, insufficient data led to a lack of analysis results about the treatment against V. destructor. But we do not think the treatment against V. destructor is irrelevant, as it is still a very necessary measure to reduce the loss rate. Although there is a correlation between the above risk factors and colony winter losses in this survey, it does not confirm a causal relationship without rigorous experiments that are yet to be performed and illustrated. Concerning the objective existence of a high level of unexplained variation, wider potential risk factors and more randomized sampling methods should be applied in future investigations.
Supplementary Materials
The following are available online at https://www.mdpi.com/1424-2818/12/9/318/s1, Figure S1: Data distribution of the survey. (a) Annual distribution in four years. (b) Apiary size distribution. (c) Distribution of respondents with different times of requeening. (d) Treatment against V. destructor distribution. (e) Distribution of respondents with different percents of new combs. (f) Distribution of respondents with different percents of new queens. (g) Distribution of respondents with different numbers of disabled queens. (h) Distribution of respondents with different origins of queens in three kind of apiaries, Figure S2: Annual colony winter losses (%) by the investigated provinces from 2013–2017. (a) Annual winter colony losses (%) by the investigated provinces in 2013–2014. (b) Annual winter colony losses (%) by the investigated provinces in 2014–2015. (c) Annual winter colony losses (%) by the investigated provinces in 2015–2016. (d) Annual colony winter losses (%) by the investigated provinces in 2016–2017.
Author Contributions
J.T. and C.M. analyzed the data and wrote the manuscript; X.C., Z.L. and H.W. collected the data; J.T., C.M., C.C. and W.S. conceived and designed the study; All authors read, revised, and approved the manuscript. All authors have read and agreed to the published version of the manuscript.
Funding
This work was funded by Chinese Academy of Agricultural Sciences, the Agricultural Science and Technology Innovation Program (CAAS-ASTIP-2018-IAR); National Natural Science Foundation of China (NO. 31802145) to X.C. and the earmarked fund for Modern Agro-industry Technology Research System (CARS-44-KXJ1) to W.S.; Fundamental Scientific Research Fund and Self-independent Innovation fund to J.T.
Acknowledgments
We appreciate all beekeepers and surveyors for providing the original data for this survey. We would also like to thank Hongxia Zhao, Shidong Liu, Bingbing Hu, Wenzhong Qi and other staff members from the beekeeping organizations and Apicultural management agencies of various provinces for their participation. Thanks to Chao Liu for her assistance and suggestions in statistical analysis and modeling.
Conflicts of Interest
The authors declare no conflict of interest.
Abbreviations:
COLOSS—prevention of honey bee COlony LOSSes.
References
- Klein, A.M.; Vaissiere, B.E.; Cane, J.H.; Steffan-Dewenter, I.; Cunningham, S.A.; Kremen, C.; Tscharntke, T. Importance of pollinators in changing landscapes for world crops. Proc. R. Soc. B Biol. Sci. 2007, 274, 303–313. [Google Scholar] [CrossRef] [PubMed]
- Potts, S.G.; Biesmeijer, J.C.; Kremen, C.; Neumann, P.; Schweiger, O.; Kunin, W.E. Global pollinator declines: Trends, impacts and drivers. Trends Ecol. Evol. 2010, 25, 345–353. [Google Scholar] [CrossRef] [PubMed]
- Goulson, D.; Nicholls, E.; Botias, C.; Rotheray, E.L. Bee declines driven by combined stress from parasites, pesticides, and lack of flowers. Science 2015, 347, 1435. [Google Scholar] [CrossRef] [PubMed]
- van der Zee, R.; Pisa, L.; Andonov, S.; Brodschneider, R.; Charriere, J.D.; Chlebo, R.; Coffey, M.F.; Crailsheim, K.; Dahle, B.; Gajda, A.; et al. Managed honey bee colony losses in Canada, China, Europe, Israel and Turkey, for the winters of 2008–9 and 2009–10. J. Apic. Res. 2012, 51, 100–114. [Google Scholar] [CrossRef]
- van der Zee, R.; Brodschneider, R.; Brusbardis, V.; Charriere, J.D.; Chlebo, R.; Coffey, M.F.; Dahle, B.; Drazic, M.M.; Kauko, L.; Kretavicius, J.; et al. Results of international standardised beekeeper surveys of colony losses for winter 2012–2013: Analysis of winter loss rates and mixed effects modelling of risk factors for winter loss. J. Apic. Res. 2014, 53, 19–34. [Google Scholar] [CrossRef]
- Brodschneider, R.; Gray, A.; Adjlane, N.; Ballis, A.; Brusbardis, V.; Charriere, J.D.; Chlebo, R.; Coffey, M.F.; Dahle, B.; de Graaf, D.C.; et al. Multi-country loss rates of honey bee colonies during winter 2016/2017 from the COLOSS survey. J. Apic. Res. 2018, 57, 452–457. [Google Scholar] [CrossRef]
- Castilhos, D.; Bergamo, G.C.; Gramacho, K.P.; Goncalves, L.S. Bee colony losses in Brazil: A 5-year online survey. Apidologie 2019, 50, 263–272. [Google Scholar] [CrossRef]
- Currie, R.W.; Pernal, S.F.; Guzman-Novoa, E. Honey bee colony losses in Canada. J. Apic. Res. 2010, 49, 104–106. [Google Scholar] [CrossRef]
- Vanengelsdorp, D.; Caron, D.; Hayes, J.; Underwood, R.; Henson, M.; Rennich, K.; Spleen, A.; Andree, M.; Snyder, R.; Lee, K.; et al. A national survey of managed honey bee 2010–11 winter colony losses in the USA: Results from the bee informed partnership. J. Apic. Res. 2012, 51, 115–124. [Google Scholar] [CrossRef]
- Spleen, A.M.; Lengerich, E.J.; Rennich, K.; Caron, D.; Rose, R.; Pettis, J.S.; Henson, M.; Wilkes, J.T.; Wilson, M.; Stitzinger, J.; et al. A national survey of managed honey bee 2011–12 winter colony losses in the United States: Results from the bee informed partnership. J. Apic. Res. 2013, 52, 44–53. [Google Scholar] [CrossRef]
- Steinhauer, N.A.; Rennich, K.; Wilson, M.E.; Caron, D.M.; Lengerich, E.J.; Pettis, J.S.; Rose, R.; Skinner, J.A.; Tarpy, D.R.; Wilkes, J.T.; et al. A national survey of managed honey bee 2012–2013 annual colony losses in the USA: Results from the bee informed partnership. J. Apic. Res. 2014, 53, 1–18. [Google Scholar] [CrossRef]
- Lee, K.V.; Steinhauer, N.; Rennich, K.; Wilson, M.E.; Tarpy, D.R.; Caron, D.M.; Rose, R.; Delaplane, K.S.; Baylis, K.; Lengerich, E.J.; et al. A national survey of managed honey bee 2013–2014 annual colony losses in the USA. Apidologie 2015, 46, 292–305. [Google Scholar] [CrossRef]
- Seitz, N.; Traynor, K.S.; Steinhauer, N.; Rennich, K.; Wilson, M.E.; Ellis, J.D.; Rose, R.; Tarpy, D.R.; Sagili, R.R.; Caron, D.M.; et al. A national survey of managed honey bee 2014–2015 annual colony losses in the USA. J. Apic. Res. 2016, 54, 292–304. [Google Scholar] [CrossRef]
- Kulhanek, K.; Steinhauer, N.; Rennich, K.; Caron, D.M.; Sagili, R.R.; Pettis, J.S.; Ellis, J.D.; Wilson, M.E.; Wilkes, J.T.; Tarpy, D.R.; et al. A national survey of managed honey bee 2015–2016 annual colony losses in the USA. J. Apic. Res. 2017, 56, 328–340. [Google Scholar] [CrossRef]
- Gajger, I.T.; Tomljanovic, Z.; Petrinec, Z. Monitoring health status of Croatian honey bee colonies and possible reasons for winter losses. J. Apic. Res. 2015, 49, 107–108. [Google Scholar] [CrossRef]
- Topolska, G.; Gajda, A.; Iminska, U. Temporal and spatial patterns of honeybee colony winter losses in Poland from autumn 2006 to spring 2012; Survey based on self-selected samples. J. Apic. Sci. 2018, 62, 121–133. [Google Scholar] [CrossRef]
- Morawetz, L.; Koglberger, H.; Griesbacher, A.; Derakhshifar, I.; Crailsheim, K.; Brodschneider, R.; Moosbeckhofer, R. Health status of honey bee colonies (Apis mellifera) and disease-related risk factors for colony losses in Austria. PLoS ONE 2019, 14, e0219293. [Google Scholar] [CrossRef]
- Oberreiter, H.; Brodschneider, R. Austrian COLOSS survey of honey bee colony winter losses 2018/19 and analysis of hive management practices. Diversity 2020, 12, 99. [Google Scholar] [CrossRef]
- Liu, Z.G.; Chen, C.; Niu, Q.S.; Qi, W.Z.; Yuan, C.Y.; Su, S.K.; Liu, S.D.; Zhang, Y.S.; Zhang, X.W.; Ji, T.; et al. Survey results of honey bee (Apis mellifera) colony losses in China (2010–2013). J. Apic. Res. 2016, 55, 29–37. [Google Scholar] [CrossRef]
- Chen, C.; Liu, Z.G.; Luo, Y.X.; Xu, Z.; Wang, S.H.; Zhang, X.W.; Dai, R.G.; Gao, J.L.; Chen, X.; Guo, H.K.; et al. Managed honeybee colony losses of the Eastern honeybee (Apis cerana) in China (2011–2014). Apidologie 2017, 48, 692–702. [Google Scholar] [CrossRef]
- Pirk, C.W.W.; Human, H.; Crewe, R.M.; vanEngelsdorp, D. A survey of managed honey bee colony losses in the Republic of South Africa—2009 to 2011. J. Apic. Res. 2014, 53, 35–42. [Google Scholar] [CrossRef]
- Gajger, I.T.; Sakac, M.; Gregorc, A. Impact of thiamethoxam on honey bee queen (Apis mellifera carnica) reproductive morphology and physiology. Bull. Environ. Contam. Toxicol. 2017, 99, 297–302. [Google Scholar] [CrossRef] [PubMed]
- Gajger, I.T.; Svecnjak, L.; Bubalo, D.; Zorat, T. Control of Varroa destructor mite infestations at experimental apiaries situated in Croatia. Diversity 2020, 12, 12. [Google Scholar] [CrossRef]
- van der Zee, R.; Gray, A.; Holzmann, C.; Pisa, L.; Brodschneider, R.; Chlebo, R.; Coffey, M.F.; Kence, A.; Kristiansen, P.; Mutinelli, F.; et al. Standard survey methods for estimating colony losses and explanatory risk factors in Apis mellifera. J. Apic. Res. 2013, 52, 1–36. [Google Scholar] [CrossRef]
- vanEngelsdorp, D.; Tarpy, D.R.; Lengerich, E.J.; Pettis, J.S. Idiopathic brood disease syndrome and queen events as precursors of colony mortality in migratory beekeeping operations in the eastern United States. Prev. Vet. Med. 2013, 108, 225–233. [Google Scholar] [CrossRef]
- Amiri, E.; Strand, M.K.; Rueppell, O.; Tarpy, D.R. Queen quality and the impact of honey bee diseases on queen health: Potential for interactions between two major threats to colony health. Insects 2017, 8, 48. [Google Scholar] [CrossRef]
- Akyol, E.; Yeninar, H.; Karatepe, M.; Karatepe, B.; Ozkok, D. Effects of queen ages on Varroa (Varroa destructor) infestation level in honey bee (Apis mellifera caucasica) colonies and colony performance. Ital. J. Anim. Sci. 2016, 6, 143–149. [Google Scholar] [CrossRef]
- Ricigliano, V.A.; Mott, B.M.; Floyd, A.S.; Copeland, D.C.; Carroll, M.J.; Anderson, K.E. Honey bees overwintering in a southern climate: Longitudinal effects of nutrition and queen age on colony-level molecular physiology and performance. Sci. Rep. 2018, 8. [Google Scholar] [CrossRef]
- Simeunovic, P.; Stevanovic, E.; Cirkovic, D.; Radojicic, S.; Lakic, N.; Stanisic, L.; Stanimirovic, Z. Nosema ceranae and queen age influence the reproduction and productivity of the honey bee colony. J. Apic. Res. 2015, 53, 545–554. [Google Scholar] [CrossRef]
- Gray, A.; Brodschneider, R.; Adjlane, N.; Ballis, A.; Brusbardis, V.; Charrire, J.D.; Chlebo, R.; Coffey, M.F.; Cornelissen, B.; da Costa, C.A.; et al. Loss rates of honey bee colonies during winter 2017/18 in 36 countries participating in the COLOSS survey, including effects of forage sources. J. Apic. Res. 2019, 58, 479–485. [Google Scholar] [CrossRef]
- Zhou, T.; Anderson, D.L.; Huang, Z.Y.; Huang, S.X.; Yao, J.; Ken, T.; Zhang, Q.W. Identification of Varroa mites (Acari: Varroidae) infesting Apis cerana and Apis mellifera in China. Apidologie 2004, 35, 645–654. [Google Scholar] [CrossRef][Green Version]
- Li, J.L.; Qin, H.R.; Wu, J.; Sadd, B.M.; Wang, X.H.; Evans, J.D.; Peng, W.J.; Chen, Y.P. The prevalence of parasites and pathogens in Asian honeybees Apis cerana in China. PLoS ONE 2012, 7, e47955. [Google Scholar] [CrossRef] [PubMed]
- Genersch, E.; von der Ohe, W.; Kaatz, H.; Schroeder, A.; Otten, C.; Buchler, R.; Berg, S.; Ritter, W.; Muhlen, W.; Gisder, S.; et al. The German bee monitoring project: A long term study to understand periodically high winter losses of honey bee colonies. Apidologie 2010, 41, 332–352. [Google Scholar] [CrossRef]
- Tarpy, D.R. Genetic diversity within honeybee colonies prevents severe infections and promotes colony growth. Proc. R. Soc. B Biol. Sci. 2003, 270, 99–103. [Google Scholar] [CrossRef]
- Tarpy, D.R.; Seeley, T.D. Lower disease infections in honeybee (Apis mellifera) colonies headed by polyandrous vs monandrous queens. Sci. Nat. 2006, 93, 195–199. [Google Scholar] [CrossRef]
- Costa, C.; Lodesani, M.; Bienefeld, K. Differences in colony phenotypes across different origins and locations: Evidence for genotype by environment interactions in the Italian honeybee (Apis mellifera ligustica)? Apidologie 2012, 43, 634–642. [Google Scholar] [CrossRef]
- Buchler, R.; Costa, C.; Hatjina, F.; Andonov, S.; Meixner, M.D.; Le Conte, Y.; Uzunov, A.; Berg, S.; Bienkowska, M.; Bouga, M.; et al. The influence of genetic origin and its interaction with environmental effects on the survival of Apis mellifera L. colonies in Europe. J. Apic. Res. 2014, 53, 205–214. [Google Scholar] [CrossRef]
- Le Conte, Y.; Ellis, M.; Ritter, W. Varroa mites and honey bee health: Can Varroa explain part of the colony losses? Apidologie 2010, 41, 353–363. [Google Scholar] [CrossRef]
- Brodschneider, R.; Moosbeckhofer, R.; Crailsheim, K. Surveys as a tool to record winter losses of honey bee colonies: A two year case study in Austria and South Tyrol. J. Apic. Res. 2010, 49, 23–30. [Google Scholar] [CrossRef]
- Mattila, H.R.; Seeley, T.D. Genetic diversity in honey bee colonies enhances productivity and fitness. Science 2007, 317, 362–364. [Google Scholar] [CrossRef]
- Oldroyd, B.P.; Fewell, J.H. Genetic diversity promotes homeostasis in insect colonies. Trends Ecol. Evol. 2007, 22, 408–413. [Google Scholar] [CrossRef] [PubMed]
- Tarpy, D.R.; vanEngelsdorp, D.; Pettis, J.S. Genetic diversity affects colony survivorship in commercial honey bee colonies. Sci. Nat. 2013, 100, 723–728. [Google Scholar] [CrossRef] [PubMed]
- Giacobino, A.; Molineri, A.; Cagnolo, N.B.; Merke, J.; Orellano, E.; Bertozzi, E.; Masciangelo, G.; Pietronave, H.; Pacini, A.; Salto, C.; et al. Queen replacement: The key to prevent winter colony losses in Argentina. J. Apic. Res. 2016, 55, 335–341. [Google Scholar] [CrossRef]


© 2020 by the authors. Licensee MDPI, Basel, Switzerland. This article is an open access article distributed under the terms and conditions of the Creative Commons Attribution (CC BY) license (http://creativecommons.org/licenses/by/4.0/).