Article

Using Ecological Niche Models for Population and Range Estimates of a Threatened Snake Species (Crotalus oreganus) in Canada

1
Aquila Conservation & Environment Consulting, C.P. 87 Carlsbad Springs, Ottawa, ON K0A 1K0, Canada
2
Environment and Climate Change Canada, Canadian Wildlife Service, 1238 Discovery Ave, 1st Floor, Kelowna, BC V1V 1V9, Canada
3
Corvidae Environmental Consulting, 6526 Water Street, Sooke, BC V9Z 0X1, Canada
4
Department of Natural Resource Science, Thompson Rivers University, 805 TRU Way, Kamloops, BC V2C 0C8, Canada
5
Environment and Climate Change Canada, Science and Technology Branch, Wildlife Research Division, 5421 Robertson Road, Delta, BC V4K 3N2, Canada
*
Author to whom correspondence should be addressed.
Diversity 2021, 13(10), 467; https://doi.org/10.3390/d13100467
Submission received: 30 June 2021 / Revised: 3 September 2021 / Accepted: 5 September 2021 / Published: 26 September 2021
(This article belongs to the Special Issue Advances in the Conservation and Ecology of Rattlesnakes)

Abstract

:
Modelling the distribution and abundance of species at risk is extremely important for their conservation and management. We used ecological niche models (ENMs) to predict the occurrence of western rattlesnakes (Crotalus oreganus) in British Columbia (BC), Canada. We applied this to existing population estimates to support a threshold of occurrence for management and conservation. We also identified predictors influencing rattlesnake distribution and abundance in this region. Using a Geographic Information Systems platform, we incorporated ENMs, capture–mark–recapture (CMR) and radio-telemetry results, province-wide observations, Landsat imagery and provincial databases for agricultural land use to produce quantitative, spatially explicit, population estimates across BC. Using available western rattlesnake habitat estimated at 183.9 km2 and averaging estimates calculated from densities in three study populations, we generated a mean adult population size of 9722 (±SD 3009; 0.8 relative index of occurrence [RIO] threshold). Only a small area (21.6 km2) of suitable land cover was located within protected areas, potentially protecting an estimated 1144 (±354) adults. Most suitable land cover was within 500 m of roads (170.6 km2), representing potential habitat being used by an estimated 9017 (±2791) adults. At the threshold RIO value chosen (0.8), only a very small area of farmland provided suitable land cover. Our results highlight the possibility of high mortality rates for western rattlesnakes near roads and the fact that protected areas do not provide sufficient coverage to conserve the population. Given that this species has relatively low mobility and high site fidelity to home ranges, our population estimate for BC provides a useful reference for the northern part of the species’ range. It also fulfills a need to estimate population size within political jurisdictions where conservation management decisions are made, as well as presenting a method that can be applied to other parts of the range, including the southern United States. Our study provides an important benchmark for future monitoring of western rattlesnakes in BC using a repeatable and transparent approach. Similar applications can be extrapolated and applied for other threatened species to identify and quantify population distributions and threats, further supporting conservation prioritization tools to be used to maximize the effectiveness of conservation strategies under financial constraints.

1. Introduction

Unprecedented declines and extinctions are negatively affecting global biodiversity [1,2,3,4]. These declines are likely to be exacerbated by the recent coronavirus pandemic, which is leading to increased destruction of natural land cover and illegal wildlife trade [5]. The root causes of biodiversity declines are multifaceted, with the two most apparent drivers being resource extraction and agriculture, followed by urban and industrial development, invasive species and the spread of disease [6,7]. Cumulative effects are important to consider as well; for example, climate change is predicted to alter species’ distributions as well as the magnitude and severity of other threats [8,9]. Thus, it is increasingly important in systematic conservation planning [10,11] to map species and other components of biodiversity so that management options can be spatially prioritized and threats quantified and mitigated [12,13,14].
Species that are least resilient to mounting environmental perturbations are most at risk [8]. In the case of reptiles, six major threats are “habitat loss and degradation, introduced invasive species, environmental pollution, disease, unsustainable use, and global climate change” [15,16]. While no species of reptiles are endemic to Canada, all Canadian snake species reach their northern range limits within the borders of the country. These peripheral populations thus experience naturally-occurring constraints, such as non-annual reproduction, low population densities, and short activity seasons [17,18]. At-risk populations with ranges that straddle the Canada–United States border are considered especially problematic—likely because synchronizing efforts to maintain population health and manage species on each side of the border is difficult—and maintaining connectivity range-wide is key to resilience [19,20,21]. Protecting these peripheral populations is critical for three reasons: first, many of these species have relatively small ranges [21]; second, many wildlife populations in North America have a tendency to collapse towards the northern limits of their distribution [22]; and third, peripheral populations may display genetic traits not apparent elsewhere in the range of the species [23].
Conservation planning and assessment for snakes is relatively difficult [24]. Members of the suborder are often rare, secretive, cryptic and active under relatively limited environmental conditions (annually), while occurring in a wide diversity of vegetation and land cover types [25]. More than 82% of snake species worldwide lack sufficient information to even assess their conservation status [26], and long-term studies are rare (e.g., [27,28]). Such information is needed urgently because reptiles are among the most rapidly declining taxa globally [29,30,31,32,33] and yet they play key roles in ecological food webs [27]. Snake distribution is strongly associated with spatial thermal homogeneity, and ever-evolving anthropogenically-altered lands may facilitate drastic alterations in the heterogeneity of thermal properties on the landscape [34,35,36]. Furthermore, many snake species have a unique combination of life history characteristics such as delayed sexual maturity, high adult survival and longevity with low fecundity [37]. In addition, many species have strong spatial fidelity to, and communal use of, traditional denning sites in which to overwinter (hibernacula), as well as summer foraging grounds and seasonal migration corridors between landscape features used multiple times over an annual cycle (e.g., western rattlesnake [38,39,40]; prairie rattlesnake—Crotalus viridis [41]; eastern diamondback rattlesnake—Crotalus adamanteus [37]; garter snakes—Thamnophis atratus [27]. This renders snakes highly vulnerable to landscape perturbations or direct mortality [42]. It magnifies the need for approaches that effectively assess population size and status, and the importance of identifying critical habitat necessary for long-term persistence. Population declines can be difficult to detect and quantify; hence, long-term studies of natural populations and communities are generally regarded as indispensable for understanding normal population trends and fluctuations [43]. The challenge in demonstrating whether observed trends in estimated population sizes constitute normal fluctuations or “unnatural” declines is that most field studies of herpetofauna lack the duration or consistency to make such determinations convincingly [44].
In Canada, the western rattlesnake (Crotalus oreganus) occurs in British Columbia (BC), as the province represents the northernmost limit of the species’ range which extends south through Washington, central Idaho, northern California and Oregon (Figure 1a [45]). Less than 5% of the species’ North American range occurs in Canada, and within the country all five geographic region subpopulations are disjunct from each other and two (Thompson-Nicola, Vernon; see Figure 1) are now disjunct from populations in the United States [46]. Conservation of this species is further complicated by the fact that rattlesnakes in Canada are persecuted (probably more so than non-venomous snakes), and in addition, the species is cryptic and widely distributed in a variety of vegetation types and elevations [46,47,48].Although globally listed as ‘Least Concern’ by IUCN [45] in Canada, the western rattlesnake is listed on Schedule 1 of the federal Species at Risk Act (SARA) as a federally-threatened species at risk [46]. In BC, western rattlesnakes generally occur in grassland ecosystems which are largely restricted to valley bottoms [35,46,49] and are comprised largely of the Bunchgrass, Ponderosa Pine, and Interior Douglas-fir Biogeoclimatic Zones (BGC [50]). Western rattlesnakes have also been found in the Engelmann Spruce-Douglas-Subalpine Fir zone [51]. Only a small portion (estimated at 15%) currently lies within protected areas [52]. Despite numerous threats, relevant and accurate population estimates and contemporary demographic parameters, as well as detailed assessments of remaining western rattlesnake habitat at local, regional or range-wide extents are limited [28]. Without accurate population estimates and information on habitat availability for this imperiled species, implementing and monitoring conservation efforts across its range continue to be compromised.
Here, we use three machine learning ecological niche models based on occurrence data and Landsat imagery to estimate the range-wide available habitat and population size of the western rattlesnake in BC. Ecological niche models (or ENMs) provide information for establishing species boundary mapping [53] and are extremely useful for monitoring the status of species at risk, as well as for systematic conservation planning efforts [54]. Although the terms species distribution modelling (SDM) and ENM are often used to describe the same concept, Feng et al. [55] suggested that the difference was that SDMs tend to focus more on the geographic distribution of species, while ENMs are more strongly geared to analyzing components of the fundamental ecological niche. These models have been used successfully to map species distributions for other snake species, including western rattlesnakes in California and Oregon, U.S.A. [56], midget faded rattlesnakes (Crotalus oreganus concolor) in Wyoming [57], eastern hog-nosed snakes (Heterodon platirhinos) in Ontario, Canada [58], invasive frogs in Hawaii [59] and amphibians in Europe [60]. Specifically, Spear et al. [57] used MaxEnt to determine factors relating to abundance of rattlesnakes, including distance to urban areas. Moreover, the importance of validating the predictions produced by ecological niche models with both empirical distributions and expert opinion was recently highlighted by Sarquis et al. [61] in their study of Bothrops alternatus, a venomous snake species in Argentina.
One challenge with using ENMs is deriving estimates of abundance and thresholds of occurrence [62]. Another is that ecologists often must choose between conducting small-scale local intensive studies over long periods to obtain detailed demographic information, versus more extensive studies using locational data over larger areas of the species’ range (often lacking true absence records and with few repeated observations). Here, we address these issues by combining observational data with climate and land cover GIS layers to quantify the area of habitat that could be used by western rattlesnakes throughout BC, with density estimates from capture–mark–recapture (CMR) studies on western rattlesnake populations [28,63]. Because we know that snakes are vulnerable to the impact of roads [64] and bio-accumulation of pesticides within the study area [65] we also examined the proportion of land cover suitable for western rattlesnakes that occurs within and outside the following designations: protected areas, a road buffer and agricultural land. Our specific goals were to determine: (1) the first approximate estimate of available habitat and population size for the western rattlesnake in BC based on observational data, and use supporting estimates from den counts to determine a threshold of occurrence; (2) the effects of different land cover and topographical variables on presence of western rattlesnakes; and different scenarios—including or excluding protected areas, roads and a 500 m buffer, and agricultural land—on models of the BC population estimate. Our approach enabled us to utilize both the concepts of prior assessments from den counts, intensive studies at specific locales, and observational data from throughout the range in BC to provide the best possible large-scale population estimate for this species in Canada to date.

2. Materials and Methods

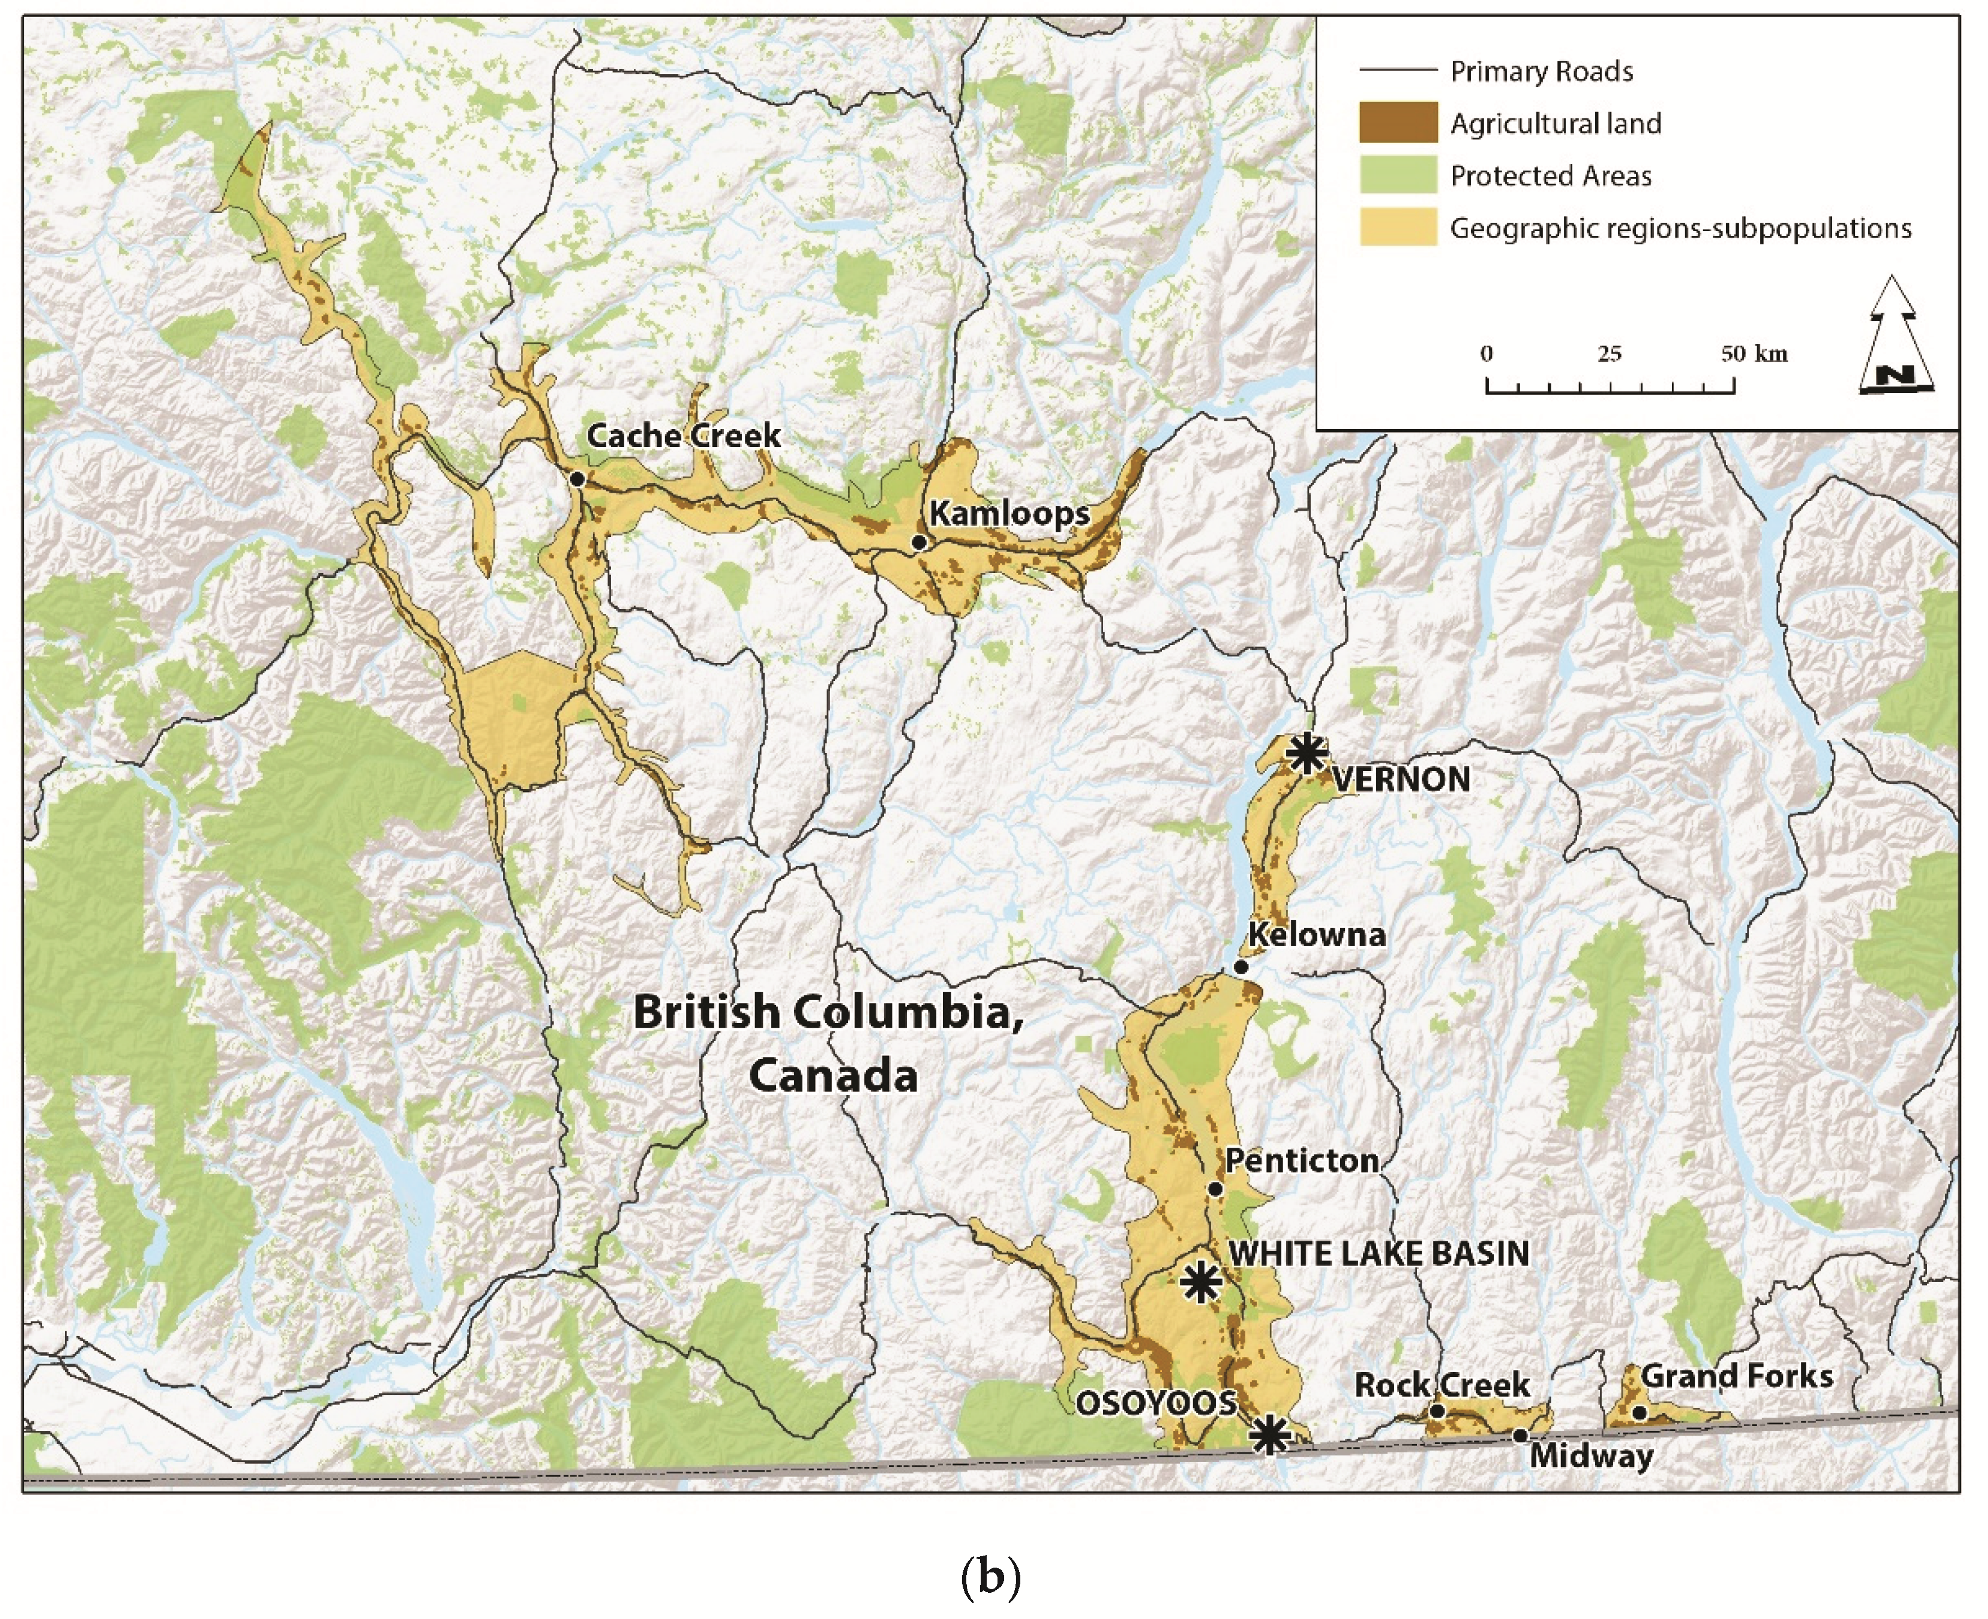
2.1. Western Rattlesnake Distribution in Study Area

Five putatively disjunct subpopulations of western rattlesnakes occur in BC [23], within valley systems of the southern part of the province shown as different polygons based on observational data from the BC Conservation Data Centre in Figure 1a (Figure 1b shows protected area and agriculture overlays—see later). The three largest portions of the range fall within the watersheds of the Thompson-Nicola Rivers (in the northwest), and Vernon, together with the Okanagan-Similkameen Rivers (the main southern part of the range), in addition to two smaller populations that occur in the Midway/Rock Creek and Grand Forks area (in the southeast of the province; Figure 1a).

2.2. Species Observations

For the spatial analysis and population estimate, we used observational data gathered throughout the geographical range archived by the BC Conservation Data Centre [66] and based on the Wildlife Species Inventory [67] databases. The government of BC houses reports and spatial data resulting from research projects. These can include location points resulting from surveys (including radiotelemetry and capture–mark–recapture studies), incidental observations (e.g., citizen science—Conservation Data Centre observations confirmed by experts and Wildlife Species Inventory observations by experts/biologists, external published reports, and some direct submissions) and museum collections. As throughout their range [68,69,70,71,72], in BC, the western rattlesnake relies on hibernacula to overwinter. Following egress in the spring, the snakes migrate to, and move throughout, their summer habitat to forage and mate, returning to their hibernacula in autumn [40,49,73]. Snake locations away from dens were linked to hibernacula within a straight-line distance of 3.6–4 km radius based on previous studies [35,48], so the data we used represented observations at den sites (one den would count as one location), as well as encounters away from dens during the active season summer months. Because of restrictions on use of data from Indigenous and private land, we could only use den data from public and government federal lands. Therefore, for this study, we only used data from approximately one-quarter of the known den sites in BC. These dens were spatially dispersed throughout the rattlesnake’s range in BC. Thus, both dens and observational data away from dens were included in our models.
Of the total data points obtained from the Conservation Data Centre, 1702 were survey observations (targeted surveys which could include observations where surveys were performed but no snakes found, up to 2019), 1002 were incidental (ad hoc) observations (up to 2019), and 145 were data points obtained from individual snakes monitored during radio telemetry studies [74,75]. There was a total of 85 Conservation Data Centre element occurrences that could potentially represent one or more dens. Although we used all available data (1900s to 2019), most observations (60%) were post-2002. Observations varied in accuracy. For example, point observations collected using Global Positioning Systems, GPS (post-1997) were of greater accuracy (3 m, often with a 10–12 m buffer), whereas element occurrence polygons from historical observations had lower accuracy (250 m, or in a few rare cases, 1 km). We used the centroids of these polygons as our observation points.
We also tried to ensure that all observations were as relevant as possible to contemporary land cover (rattlesnake occurrences may have declined [45] or rattlesnakes may have been extirpated from many historical locations due to continued anthropogenic development) using the following steps. First, we removed duplicate and/or overlapping observation locations using spatial analyses in R [76]. Snake observations clustered in the same area could represent records of the same individual snake (i.e., multiple counting) or individuals aggregated at den sites. To alleviate this potential bias, we used the package ‘spThin’ [77] to select records that were a minimum distance apart. Based on average daily movements of rattlesnakes [49] and studies of other reptile species, we selected a minimum distance of 500 m between sightings to minimize the probability of counting the same individual twice and spatial autocorrelation issues. Some researchers working on rattlesnakes or other snake species have used a larger distance (1 km) between sightings [56,78]. However, using distances > 500 m in our study would have substantially reduced sample sizes. The R package spThin deployed a randomization nearest-neighbor distance (NND) to select spatially independent observations, meaning that the filtered data were less biased than the original observations and are merely a subsample of a larger set. The resulting rattlesnake observation data comprised 675 observations.

2.3. Environmental Covariates

We examined candidate and proxy environmental variables that best explained western rattlesnake distribution based on rattlesnake ecology and factors known to influence their distribution and abundance [35,39,56,75]. Except for climate variables, all of the environmental features were in ESRI raster format and had the same geographic extent and pixel size (30 × 30 m—Table S1). Because rattlesnakes rely on behavioral thermoregulation to maintain their body temperature [79,80], solar radiation and weather variables are relevant for predicting their occurrence [36]. Therefore, we used minimum monthly temperatures and mean monthly precipitation from the active (non-hibernation) period for rattlesnakes in BC (1 April to 30 September, 1 km pixel size) from Chelsa bioclim data available at: http://chelsa-climate.org/bioclim/ accessed October 2020 [81,82]. Note that although rattlesnakes are active in Idaho [68,70] and northern/coastal California and western Oregon [72] until October or November, this typically is not the case in BC. We created a raster layer to average the climate (temperature and precipitation) information from April to September. We then resampled this raster layer from a 1 km pixel size to a 30 × 30 m pixel size using the nearest-neighbor resampling method to keep all environmental data at the same resolution. We used long-term averages from the period of data available (1979–2013). Lastly, we built the ‘Potential Annual Incoming Insolation’ layer using SAGA GIS [83].
Ruggedness can not only impact snake mobility, but it can also create a diversity of microclimates enabling snakes to locate suitable thermal surfaces, even though the overall averaged thermal index may be unsuitable for a particular area [36]. Thus, a second key factor in estimating the distribution and abundance of rattlesnakes is topography [84,85]. Since many topographic features are highly inter-correlated (e.g., slope, topographic position) and may be used in combination as habitat cues by rattlesnakes, we used a ‘ruggedness’ index [36]. This was calculated directly using the ‘Terrain Ruggedness Index’ in SAGA GIS [83]. We also included elevation in models (upper limit 2000 m) from provincial Digital Elevation Models [86].
In BC, the strongest cover associations that rattlesnakes have are with rock outcrops, talus slopes, shrub-steppe/grassland, riparian and open pine forests [35,39,87]. Therefore, the third GIS layer that we used contained categorical land cover variables derived from a supervised satellite imagery Landsat classification from the North American Environmental Atlas [88] and updated provincial land cover [89]. We used all 19 categories of available land cover from the atlas and the province (Table S1) to make sure that no gaps in coverage existed and that the vintage of this land cover classification was the period 2009–2011. We also used a grassland land cover layer from the GIS sources of the Grassland Conservation Council of British Columbia (Table S1).
Roadways fragment snake habitat and are also a source of mortality [64,90,91]. The warm surfaces of roads are presumably attractive to snakes for thermoregulation and so many snakes are killed by vehicles, often intentionally (N. Bertram and J. Surgenor, personal communication and [92]). To test for the effect of transportation infrastructure as a predictor, we used a road layer for the province derived from GeoBC’s Digital Road Atlas [93]. We included a range of road types, noting that road placement probably has a greater impact on rattlesnakes than road type. Road density was used as an index of the influence of roads on rattlesnake distribution and abundance and also may serve as a proxy for land cover fragmentation and quality of habitat for rattlesnakes. Similarly, other types of human disturbance could influence the distribution and abundance of rattlesnakes, including the low elevation parts of ski hills and golf courses which we derived from an agricultural land use database compiled by the BC Department of Agriculture (see Table S1).
While pesticide exposure (through bio-accumulation in prey items) and interactions with humans or machines can pose risks for snakes [65], agricultural landscapes also often harbor food resources, access to water and relatively stable vegetation types (e.g., orchards or pasture). We therefore included several agricultural land cover types in our models—including intensively-farmed cropland (comprised of cultivated crops, fallow land, transitional cropland), vineyards and berries (combined) and perennial agricultural land of ecological value known to be used by rattlesnakes (orchards-fruit trees; see Table S1).

2.4. Model Development

ENMs are based on correlations between species’ locations and environmental variables within the environment in which they occur [94]. We deployed ENMs to develop relative index of occurrence (RIO) maps that were used to predict occurrence of western rattlesnakes over BC. Based on their high performance (ROC area under the curve metric—AUC [95]), the ones we chose were Random Forests [96], MaxEnt [97], and Generalized Boosting Models, also called Boosted Regression Trees [98]; further details on why these model platforms were selected are in Supplement S1. Three ENMs were used in conjunction to reduce the effect of individual-model variation in model outputs (see [99]). We ran all models in the BIOMOD2 statistical package in R [100]. We also considered the recommendations of Hao et al. [101] and followed logical protocols (e.g., [102]). We fine-tuned the MaxEnt model parameters using the ENMeval package [103] and Random Forests and Generalized Boosting Models with the BIOMOD2 package (ntree and ntry parameters) [100]. We focus on the general patterns and areas where snake density was significantly higher (‘hot spots’) and areas where density was significantly lower (‘cold spots’) of the predictions.
Because many presence observations of rattlesnakes were opportunistic, we made a sampling bias layer (i.e., using the density of observation points). We then randomly selected 5000 pixels that had higher values in the sampling bias layer; thus, there was a higher probability of the pixel being selected as a background point. Using these background points in the presence/background model will result in them having the same bias as presence-observation points [104,105].
Having identified relevant environmental covariates as predictors for rattlesnake occurrence, we conducted exploratory analyses, including calculating Pearson correlations for all pairs of variables (Table S2). Removing highly correlated variables is not necessary for Random Forests, MaxEnt, or Generalized Boosting Models but we did this to avoid data redundancy, to ease interpretation of model outputs (i.e., response curves) and to speed up model computation time. Most variable pairs showed low correlations (<0.50; Table S2); however, because there was a highly significant correlation between ruggedness and other topographic variables (e.g., slope, r = 0.89), we assumed that using only one variable would be adequate for the model and that relationships would be similar for both ruggedness and other topographic variables. Similarly, temperature and elevation were highly correlated (r = −0.95), and solar insolation and aspect were strongly related (correlations were not performed because aspect was a categorical variable). We considered elevation (DEM) and solar insolation to be the more proximate functional factors for rattlesnake habitat use [56,106], and therefore we omitted temperature and aspect from our final models. We compared model performance between Random Forests, MaxEnt and Generalized Boosting Models using the AUC for the most reasonable predictions and inferences [107,108]. We calculated metrics of model performance as performed by LeClere et al. [109] such as AUC [95] as described in DeLong et al. [110] and also included other metrics (Cohen’s kappa [111] and true skill statistics (TSS) [112]). AUC provides a measure of the model’s discriminatory ability (threshold-independent measures of model performance); thus, an AUC value of 0.5 demonstrates that a model’s discrimination is no greater than expected by chance, whereas a value of 1 is indicative of perfect discrimination; values of >0.8 provide excellent discrimination [95]. Cohen’s kappa statistic provides a correction for the overall accuracy of model predictions by the accuracy expected to occur by chance (see [113]. Thus, kappa values range from −1 to +1, where +1 indicates perfect agreement and values < 1 indicate that performance is no different than would occur randomly [111]. Lastly, TSS, corrects for the dependency problems of kappa, but retains all of the advantages of the former method [112].
Recently, estimation of kappa and TSS from presence-only models has been criticized for two reasons. First the lack of true absences precludes the computation of an unbiased confusion matrix, and second, in the case of kappa, it is overly sensitive to presence [114,115]. Therefore, to verify our results, we conducted a second model run for the ensemble model and computed the Boyce Index. This index provided an independent measure of model performance and is largely insensitive to species prevalence and provides additional information on model quality [116]. To evaluate the predictive power of our models, we followed Huettmann and Gottschalk [117] and divided data into two groups: 1) a training dataset (75% of data) used to create the initial model; and 2) an independent test dataset (25% of data) which we used to test model quality [95] and to ensure accuracy and repeatability. This approach focuses on predictions first and then inferences from those predictions [107]. Although it may not be an issue with our data, we controlled for the possibility of over-fitting by using a regularization multiplier (RM) of 1 (as in the default version of MaxEnt) which we considered appropriate for our model. We used the ENMeval package in R [103] and checked RM values ranging from 0.5 to 10, in 0.5 increments. The combination of RM values (20 different values) and feature classes (FCs, 5 different classes) resulted in 100 different model combinations from which we selected the best model using Akaike’s Information Criterion (AIC). Lastly, we created an ensemble (averaged) model [99,101,118] from all model platforms which we used to calculate our population estimates. This was carried out using BIOMOD2 and was performed by overlaying the lattices from the models and based on their TSS values. To convert the continuous predictions (from 0 to 1) to binary values, we developed thresholds at the mean RIO value as well as values of 0.5, 0.6, 0.7, 0.7, 0.75, 0.8 and 0.99 (Table S3).

2.5. Population Estimate for BC

We used population density data from three intensively-studied small study areas in BC (Figure 1; see Table 1). The study sites included (1) Osoyoos—an 11-year study (2002–2012) based on intensive capture–mark–recapture (CMR) of snakes [28]; (2) White Lake Basin area, approximately 34 km north-northwest of Osoyoos, where densities were estimated between 2015 and 2018 [63,119]; (3) Kalamalka Provincial Park and neighboring ranch near Vernon, approximately 140 km north of Osoyoos (2018–2020) [51]. Note that we only included the most recent estimates for adults in 2020 from the ranch and provincial park in Vernon combined (mean 65.9, 95% CL 58-4-73.4) as there has been a 10–33% population decline in this area since 1983. We therefore calculated the adult population estimate as a product of rattlesnake habitat availability (km2) times the density estimates from each of the Osoyoos, White Lake Basin and Vernon study areas and then taking an overall average. We then determined the threshold at which rattlesnakes would be considered present [120]. To do this, we first chose a critical RIO threshold value from the ensemble model from Random Forests, MaxEnt and Generalized Boosting Models. Based on prior estimates from den counts [121], we investigated several candidate thresholds (Table S3) and chose an RIO threshold value of 0.8, which was approximately 75% of the maximum, from sightings (see also [108]). This value provided the most realistic population estimate, was consistent with estimates from counts of snakes at dens by J. Hobbs [121] and was also verified by expert opinion (J. Hobbs, pers. comm. provided a provincial estimate of an upper limit of ~8K western rattlesnakes in BC and M. Sarell, pers. comm. inspected the ROC maps for accuracy). We divided the land cover pixels into two groups (‘suitable’ and ‘unsuitable’ land cover) by using predicted pixel values based on the sampled sighting locations at the 0.8 threshold. Pixels with values greater than or equal to this threshold value were considered suitable land cover (i.e., ‘habitat’) for rattlesnakes in our model outputs. We then converted the pixels of suitable land cover into polygons. We calculated how many pixels were included in the RIO model in the additional range area (km2) equal to or above that threshold value. We extracted all land cover polygons within or intersecting the buffer polygons generated in the first step and used these as the basis of the total area of rattlesnake habitat in BC. We then calculated the area of suitable land cover within the buffered pixels.
We also used a very conservative threshold to calculate our final population estimate, which meant that only the land cover areas with the highest suitability were included (see thresholds; Table S3).

2.6. Scenarios of Protected Areas, Roads and Agricultural Land

We ran three scenarios to evaluate the impact of: (1) adding or subtracting protected areas, (2) adding or subtracting the area of roads (buffered—see later), and (3) adding or subtracting agricultural land on the western rattlesnake population estimate. For each scenario, the area of suitable land cover for western rattlesnakes was calculated (km2).
In our first scenario, we counted pixels included in the RIO threshold within protected areas in the distributional range and those outside. The protected areas layer (Figure 1), which included National Parks, National Wildlife Areas, Migratory Bird Sanctuaries, and provincial parks, was obtained from Environment and Climate Change Canada [122]. While on the one hand protected areas could protect western rattlesnakes from persecution, on the other hand some protected areas have high numbers of human visitors and disturbance can influence movements or survival of snakes.
The second scenario we ran included and excluded roadsides from the population estimate calculations. We did this by buffering and masking a 500 m area from roads (Figure 1). The 500 m criterion was based on a study demonstrating that timber rattlesnake (Crotalus horridus) and Louisiana pine snake (Pituophis ruthveni) numbers were depleted by >50% in areas occurring within 450 m of roads with moderate traffic [123]. Note that we were not able to determine traffic volume from GIS and therefore selected mostly paved roads, which we assumed, on average, would have moderate traffic and perhaps pose a greater threat of road mortality to snakes [124].
Depending on farming intensity and cover types, agricultural land may or may not be a suboptimal land cover type for rattlesnakes in BC [48]. Therefore, for our last scenario, we postulated that rattlesnakes avoided agricultural lands (Figure 1). To test the influence of agricultural land on the RIO models and subsequent population estimates, we calculated the number of pixels assigned to land cover suitable for rattlesnake occupancy inside and outside of agricultural land.

3. Results

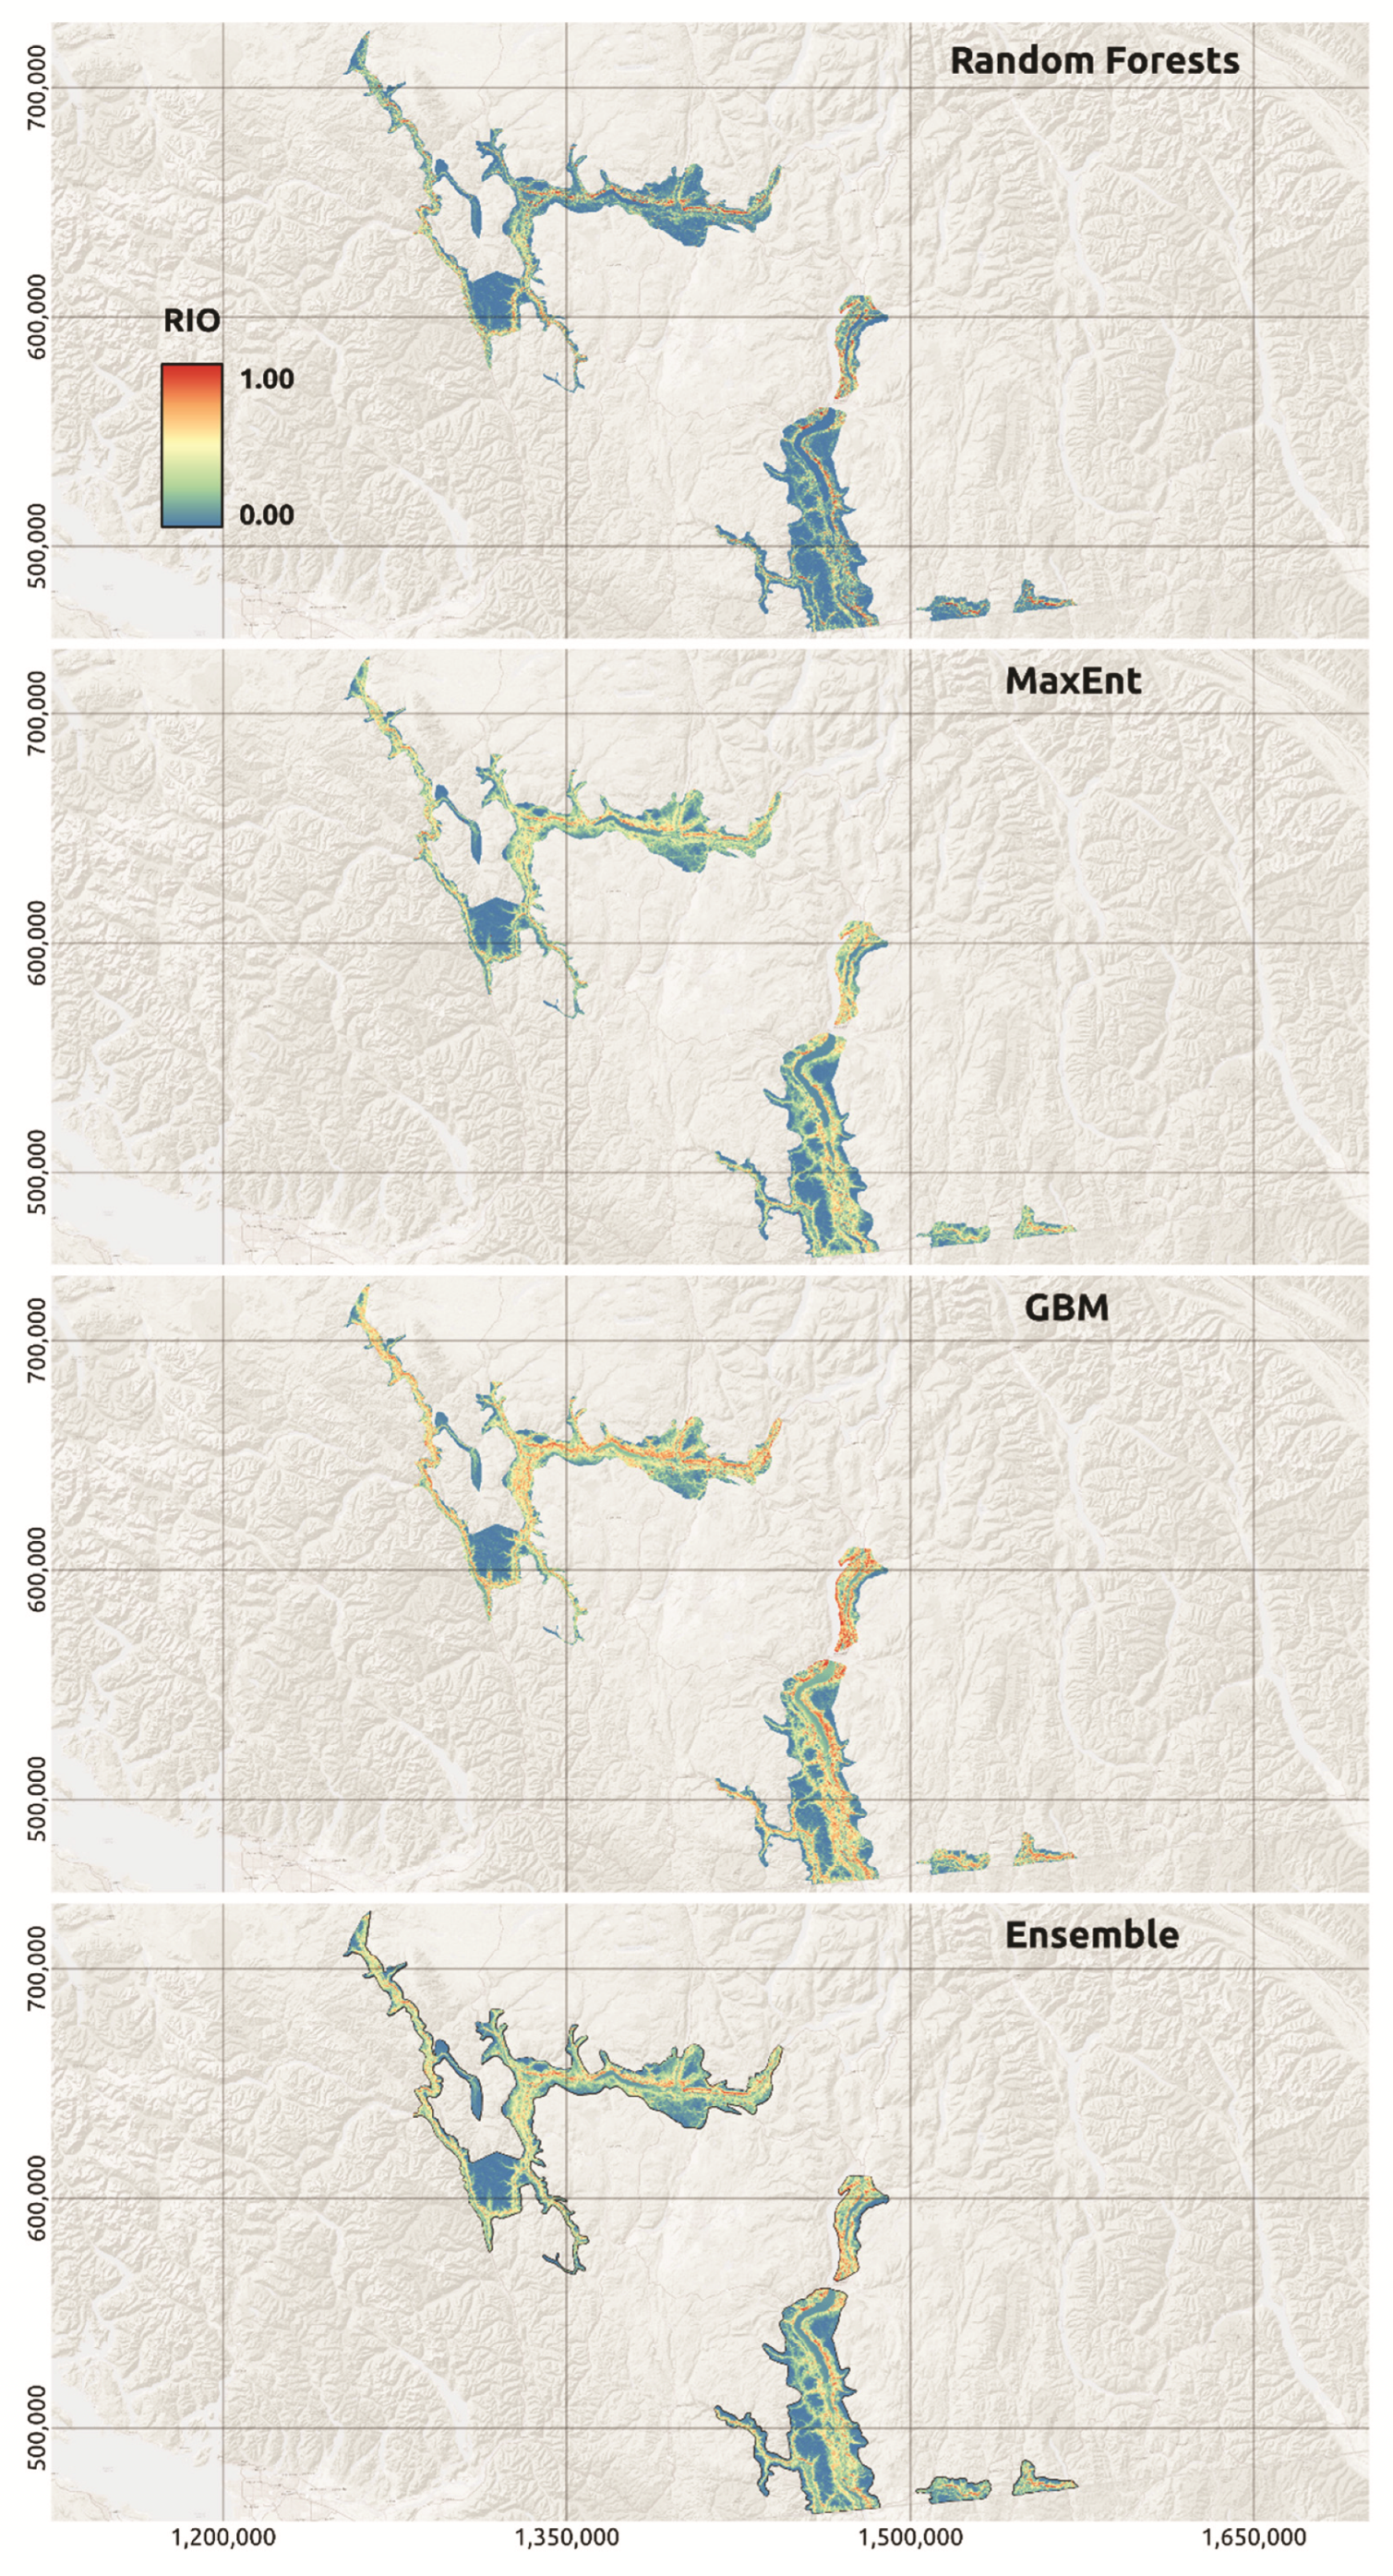
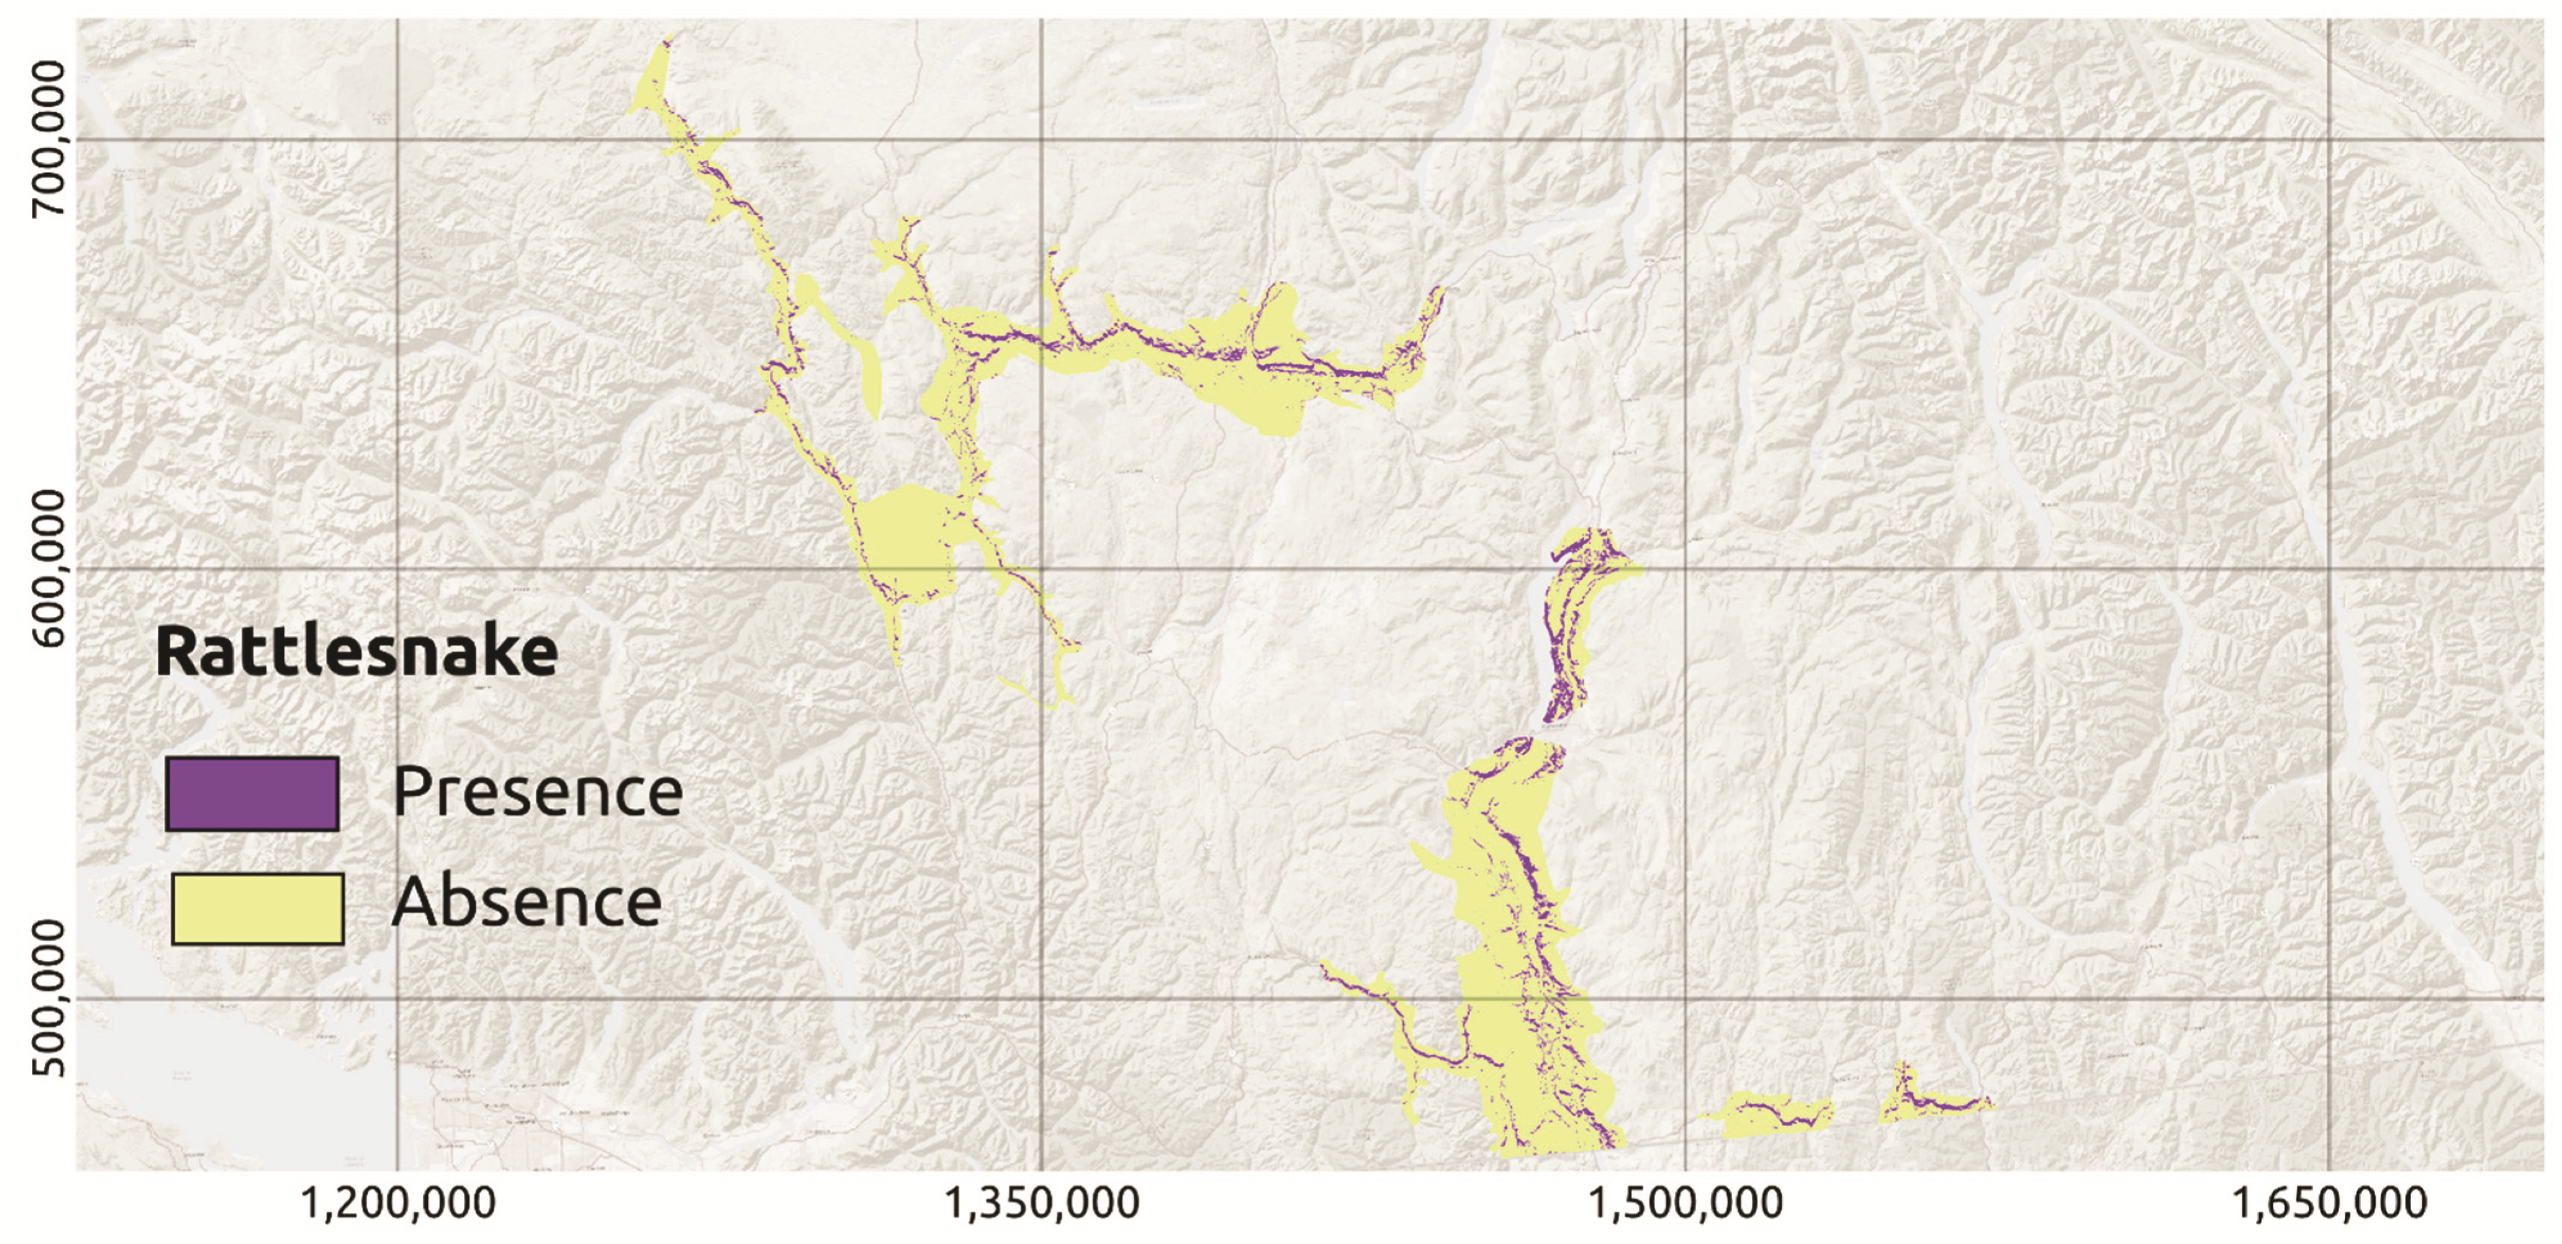
3.1. Relative Index of Occurrence (RIO) Models

In order of performance, Generalized Boosting Models were best (AUC 0.79, Kappa 0.30, TSS 0.45), followed by Random Forests (AUC 0.77, Kappa 0.28, TSS 0.41), and MaxEnt (AUC 0.74, Kappa 0.25, TSS 0.37). Overall performance from the ensemble model was high (AUC 0.79, TSS 0.44) and we used this model to perform the population estimates (Table 1; we also compared estimates using each study region separately). The separate ensemble model run to cross check results using the Boyce Index indicated similarly high performance: ensemble model, 0.95; GBM, 0.90; Random Forests, 0.84, and MaxEnt, 0.90.
The RIO maps indicated that the highest-quality land cover occurs in many of the same areas as known dens for rattlesnakes, providing confirmation of the accuracy of our models. In the Thompson-Nicola range (Figure 1), the highest-quality indices were in the central portions, while in the Okanagan they are often along edges (lakes, such as Okanagan Lake) and in Vernon high concentrations were at the western edges and southern part of the range (Figure 2 and Figure 3). Examination of the mean values for each of the small study areas generally demonstrated that Osoyoos had the highest RIO values, followed by Vernon Provincial Park, Vernon Ranch and White Lake Basin (Table 2). For all models, the RIO values were much lower for the entire range, than within the small study areas (Table 2). This was expected as the small study areas had high habitat quality for western rattlesnakes.
The most important variables in all model platforms were elevation followed by annual insolation, land cover and ruggedness (Table 3). When the three model platforms were compared, there were some differences in the percent contribution of the variables (Table 3). Inspection of model response (partial dependence) curves for relationships between rattlesnake presence and different environmental parameters matched existing biological knowledge for the species (Figure S1). Overall, western rattlesnakes demonstrated a positive response to elevations between 0 and 1000 m, and increased with higher solar insolation and increased ruggedness (to a plateau).

3.2. Range-Wide Rattlesnake Population Estimate in Canada and Scenarios

Although the range of estimates depended on the RIO threshold value used (Table S3), the final one chosen based on prior den counts was 0.8, giving a very realistic mean estimate of 9722 (±SD 3009) adult snakes from the ensemble model (separate population estimates using local densities from Osoyoos, White Lake and Vernon provided estimates of 10,702, 6344 and 12,118, respectively; see Table S3). The overall population estimate using the mean RIO threshold of 0.446 was extremely high (Table 4) and over-represented the suitability of land cover throughout the species’ range (Table S3).
We estimated the area of land represented by protected areas within the western rattlesnake’s range in BC to be 923 km2. Within these protected areas, only 21.63 km2 (2.3%) was available as the most highly suitable land cover, giving an estimate of 1144 (±354) adult snakes (or 11.8% of the total population estimated) within protected areas. A large proportion of the most highly suitable land for rattlesnakes was within 500 m of roads and estimated at 170.6 km2. Taking the mean estimate from densities in the three small study areas therefore gave a total of 9017 (±2791) adults (92.8% of the total population). Although agricultural land area within the rattlesnake range in BC was estimated to cover an area of 298 km2, the area of farmland identified by our models as being of high suitability for rattlesnakes was extremely small (<1 km2).

4. Discussion

Our results provide the first quantitative and spatially explicit population estimates for western rattlesnakes across its Canadian geographical range using observational data and capture–mark–recapture results. This study of model-based estimates differs from some previous studies in that it was based on the range-wide data from BC (Conservation Data Centre), GIS land cover, topography, land use and climate data, much of which are publicly available (albeit with restrictions in place for access to rattlesnake observational data due to the threatened status of the species). Other recent studies of edge of range rattlesnake populations using modelling approaches include those by Hecker et al. [72] who used MaxEnt to develop ENMs in California and Oregon and Yousefi et al. [126] who conducted similar research in Iran. However, our approach is novel in that it combines results from intensive studies, including an 11-year demographic study at the Osoyoos Indian Reserve [28] and shorter-term studies at White Lake [63,127] and Vernon [51], with observational data of western rattlesnakes from throughout its range in BC. Our models reveal that only a small proportion of the population is likely conserved within protected areas. Our models also provide support for concern regarding the potential direct and indirect impacts that roads have on rattlesnakes in BC due to the large area of suitable land cover adjacent to major roadways in valley bottoms.
Our main goal of confirming previous den count estimates was supported by the estimated 9722 adults from our modeling and is probably the most conservative, realistic and defensible. One of the criteria for federal designation of the western rattlesnake in Canada as ‘threatened’ requires an estimated population size of <10,000 individuals—this specific criterion was not invoked in the most recent re-assessment of Western Rattlesnakes [46], but rather the numbers and decline of mature individuals were cited. An earlier approximation of the number of western rattlesnakes in BC suggested that there “could be fewer than 2000 or over 25,000” total individuals (COSEWIC, 2004 [46]). This estimate was based on Macartney’s (1981–1983) den counts (8 to 133 individuals per den) at a specific study site in the north Okanagan, and a provincial estimate of 392 confirmed dens. More recently, Hobbs [121] used head counts at 318 dens to arrive at an estimate of 3943 to 7896 rattlesnakes in BC. Despite the fact that estimating the total population from single or few den visits is subject to detectability biases—not all snakes present at dens can be counted and many dens are hard to find—the upper limit of the estimate from dens is aligned (~20%) of our estimates and given that both methods have inherent error. Therefore, we believe that our population estimates for adults based on quantitative mark-recapture estimates and most of the available rattlesnake observational data confirm the most robust estimates available to date. The estimate from the mean threshold may represent a potential population size for the western rattlesnake in BC, based on land cover and other environmental covariates.
Our overall adult population estimates could be inflated due to the fact that we used density estimates from the Okanagan valley, which has been identified as having the land cover types most highly correlated with rattlesnake presence in Canada and has the longest active season [46]. We drew upon data generated from three intensive rattlesnake studies, all occurring in the Okanagan, thus potential inflation of our estimates could have occurred given that we extrapolated to the rest of the snake’s range. For example, our density estimates from Osoyoos, where rattlesnakes have been monitored and conserved over the long-term [28] were high, despite the fact that the southern portion is experiencing extremely high rates of human development; in contrast, in the north Okanagan (Vernon), suitable rattlesnake land cover is relatively undisturbed. The other intensive study area, White Lake Basin, is protected and essentially ‘pristine’ [63], harboring relatively high densities of rattlesnakes that are still considerably lower than that at Osoyoos (34.5/km2). Both densities at the Osoyoos and White Lake are much lower than those at Vernon (see range of estimates in Table S3). Although, Macartney [87] found overall densities of 155.8 individuals/km2 in the two neighboring subpopulations (provincial park 123.4/km2; ranch 219.6/km2) near Vernon, many changes have occurred in this area over the intervening 30 years. Some of the dens in the Vernon study are no longer occupied, and the population has declined by ≈50% (overall density 93.5/km2, provincial park 61.9, ranch 151.7 [51]). Although taking a mean estimate from all three study areas is conservative, nevertheless within the BC range of western rattlesnakes these three areas have high habitat quality.
It is also important to note that our models did not simply extrapolate densities from localized estimates of snake densities to the entire range within BC. The purpose of the RIO map was to control for land cover suitability in the rest of the range and we purposefully included only cells with high ‘habitat quality’ in our population estimates. As with all modelling exercises, our outputs are subject to potential biases due to the limitations of the data that we incorporated. For example, the only climate data available were at 1 km resolution and we had to rescale these data to 30 m resolution to match our other predictor variables. We do not think this will have a great influence on our model results for three reasons: (1) climate variables would not change significantly at finer scales but are important to include; (2) including topographic variables such as ruggedness at a fine resolution is important because of considerable topographic variation within the areas used by rattlesnakes; using a 1 km resolution would lose much of this critical detail; and (3) the rattlesnake observations were a mix of more recent GPS-based point data (3 m accuracy, with a buffer of 10–12 m), or derived from the centroids of larger variable-sized polygon locations (almost all 250 m accuracy).
All models and estimates of population size involve assumptions, and require decisions to be made, but their products are more defensible and repeatable than estimates based on anecdotal observations or expert opinion alone. Because the Conservation Data Centre and other observations of rattlesnakes were not randomly sampled, spatial survey biases could occur by over-representing highly sampled areas (e.g., provincial parks or other protected areas) or because the data were not statistically independent (spatial autocorrelation due to multiple observations from the same individuals).
Although our ENMs models performed well, and high AUC values were obtained, it should be emphasized that these models represent a first approximation. They are also subject to sampling bias since incidental observations of rattlesnake housed by the Conservation Data Centre are more likely to be gathered from accessible areas such as those close to roads or residential areas. Supporting this, a large percentage of the highest-quality land cover from the models, and consequently a large proportion of the estimated population, was found within 500 m of roads. Whether this is a real effect (roads pass through the valley bottoms which represent the highest-quality land cover) or an artefact due to sampling biases (more snakes are observed close to roads in the opportunistic Conservation Data Centre observations) requires further research. However, it is known that almost all habitat for rattlesnakes in BC is bisected by roads so controlling for this sampling bias is extremely difficult [121]. Note that we did attempt to minimize potential biases in the background data by building a sampling bias layer (see methods and details in [104,105]. One area for consideration is further modification (ideally using LiDAR data) by stratifying within suitable vegetation types and ranking specific crown closures and vegetation classes.
It may be useful to further separate the data into different subsets and build specific ENMs for training and testing within these subsets. For example, separate models could be built for dens or subsets of older versus more contemporary observations. Separate models for historical (e.g., pre-2002 or pre-GPS availability in 1997) versus contemporary (post-2002, aligning with individual study site temporal spans) may provide a handle on the influence of population declines on our models. Although we did conduct separate models for dens in earlier model runs, we could only use a limited subset of the approximately 477 dens (392 confirmed) in the province because of the confidentiality reasons previously mentioned (see Materials and Methods). To confirm our results, future models could consider using abundance data from these den counts in relation to the landscape mosaic and connectivity for rattlesnake habitat using point process models (e.g., [128]). Using dens as observation data points for rattlesnakes must also consider that reported den locations may be biased as not all dens are found.
To improve future models, more detailed analysis using demographic models, as well as their assumptions, effects of landscape heterogeneity, climate data and solar radiation where data become available would be useful. We used spatially explicit estimates of presence based on modelling which were adjusted according to the intensive study area average estimates. More process-models such as spatially explicit population viability models could also be developed [129].
Our estimates suggest that although the species is not imminently threatened with extirpation because there are ~10,000 estimated individuals, there is cause for concern about the long-term viability of the population [127]. This is especially so given effects of habitat loss and degradation and the likelihood that, in its Canadian range, the western rattlesnake population is declining [28]. This situation, coupled with the fact that rattlesnake habitat loss continues while incorporating regularly updated satellite land cover imagery presents challenges and makes estimates of this species’ population size a ‘moving target’. For example, Atkins [51] recently demonstrated that the population at Vernon has declined by 10–33% over the last 30 years. These population declines in the western rattlesnake may parallel those in another large snake in BC—the Great Basin gophersnake, (Pituophis catenifer deserticola) [130]. For that species, models estimated adult population declines of up to 40–50% over three generations based on road mortality and other threats such as accidental and intentional killing [131]. Similarly, western yellow-bellied racers (Coluber constrictor mormon) experience high road mortality, even in comparison to rattlesnakes and gophersnakes [63].
Given the status and apparent decline in abundance of western rattlesnakes, it is of concern that (according to our models) a low percentage of the population (based on highest-quality land cover) is projected to occur within protected areas. A similar situation occurs in the case of the Great basin gophersnake, which also has its core geographic range in Canada in the Okanagan valley [132]. Supporting this, Deguise and Kerr [133] found that only 1.5% of areas with >30 endangered species were protected in Canada. It is therefore critically important that non-protected lands be managed for rattlesnake conservation. For example, extensive rangelands appear to provide habitat for rattlesnakes and in some areas (e.g., Vernon) have higher densities than a neighboring protected area (see above [51]). There is also evidence that rattlesnakes in provincial parks, or other areas with high human use, rattle less frequently due to disturbance [51]. Our results support findings elsewhere that protected areas alone are not sufficient for biodiversity conservation, and as in the case of the western rattlesnake, their value is dependent on representation, access and human visitation levels, and management effectiveness [134].
The most contiguous area of suitable land cover for the western rattlesnake in BC occurs in the most southerly portion of its range where agricultural land and roads are most prevalent (i.e., the Okanagan valley). Over the past 100 years, 77% of Idaho Fescue (Festuca idahoensis spp. idahoensis) and 68% of the antelope-brush (Purshia tridentata) and needle-and-thread grass (Hesperostipa comata)—important vegetation types for western rattlesnakes— have been lost and replaced by agriculture and urban land use in the Okanagan [135,136]. Geographically, conversion to agriculture or urban and industrial uses has resulted in more than 47.6% loss of native grasslands in the northern Okanagan Basin and substantial losses in the South Okanagan Highlands (38.6%), South Okanagan Basin (20.5%) and Thompson Basin (20.0% [52]). Recent trends for land conversions to vineyards in the southern interior of BC has further reduced land cover quality for rattlesnakes by removing previously heterogeneous agricultural landscapes containing hay fields, orchards and vegetable crops, interspersed with natural vegetation. As well, preparation for vineyards includes removal of topsoil and subsoil contouring, removing the natural cover that harbors rodent prey populations. At least some agricultural areas could be attractive to snakes because they provide water, diverse landscapes as well as prey, and contain patches of natural or semi-natural land cover [7]. Although Spear et al. [56] did not include the area of agricultural land in models directly, they determined ‘resistance’ values for land cover types, including agricultural land, which were assigned the same value as invasive vegetation, railways, low housing density or very rough terrain. Recent evidence suggests that rattlesnakes in disturbed landscapes have lower body condition than those in undisturbed landscapes in BC [75]. Thus, agricultural land and urban areas may act as population sinks, as may areas where road expansion is ongoing [123]. If managed in a holistic way (such as organic farming regimes, including intercropping with native vegetation), agricultural land may provide habitat for rattlesnakes and snakes should be conserved for the ecosystem services they provide (e.g., preying on agricultural pests such as mice and voles). Clearly, more research is needed to investigate the role of agricultural land in supporting or impacting this species, especially given the rate of land conversion. Because of the coincidence of rattlesnake distribution with areas under residential development in BC and/or due to their attraction to roads, our study highlights and further supports the potential negative impact of roads because of the close proximity of high value rattlesnake land cover types. Indeed, road placement may have a greater bearing on road mortality than road type, given that many roads are in valley bottoms where most snakes occur [121]. Even at low traffic volumes, roads in BC can have a devastating impact on rattlesnake populations, as demonstrated by the recent Population Viability Analysis by Winton et al. [127].

5. Conclusions

Estimating population sizes of species across their range (within and across political jurisdictions) is important for setting targets and evaluating population changes over time. This can be used as a baseline for ongoing monitoring, management and species conservation. Similar studies to ours have been carried out for other rare species—scaly-sided mergansers (Mergus squamatus) and various crane species in China [137,138], as well red pandas (Ailurus fulgens) in Nepal [108]. Our models serve as only one important approach for trend monitoring and future re-assessments of the status of western rattlesnakes in BC. They may not be sufficiently sensitive to monitor trends in a declining population. However, models based on new observations of rattlesnakes, ideally including density estimates from a broader area, could be used to verify and track potential declines, especially if paired with data on population structure and recruitment. Not only do models such as ours provide critical information for the conservation and management of the western rattlesnake in BC but they also can be used for spatial conservation planning purposes and wider conservation decision making [12,139,140]. Most importantly, our models provide the first quantitative and spatially explicit population estimates for western rattlesnakes across its Canadian geographical range.
Models such as ours can be used to quantify the impact of habitat loss and other threats for landscape-level conservation planning purposes and habitat restoration using Marxan (https://marxansolutions.org/ accessed 21 September 2021), prioritzR [141] or other spatial prioritization tools and/or cumulative effects assessment [108,142,143,144,145,146,147,148]. Our study provides an empirical framework, including a transparent and repeatable process, to conduct such models for other species at risk and their habitat. If these were combined and overlaid, then the identification of hotspots for species at risk would allow threats and protected areas (e.g., critical habitat for recovery) to be prioritized spatially and in relation to competing resource development, thereby facilitating persistence of a broader group of at-risk species’ populations.

Supplementary Materials

The following are available online at https://www.mdpi.com/article/10.3390/d13100467/s1, Table S1. Descriptions and sources for variables included in models. Supplement S1. Model selection. Table S2 Supplementary Results: Pearson correlation coefficients for environmental covariates. Table S3. Thresholds. Figure S1. Response curves of rattlesnake occurrence in response to predictor variables used in individual models and ensemble model. Each graph shows how rattlesnakes’ Relative Index of Occurrence changes based on different values of each variable.

Author Contributions

Conceptualization, D.A.K., J.R.M., J.A.H., K.W.L., C.A.B.; methodology, D.A.K., S.K.; software, S.K.; validation, S.K.; formal analysis, S.K., D.A.K.; investigation, D.A.K., J.R.M., J.A.H., K.W.L., C.A.B.; resources, C.A.B.; data curation, S.K., D.A.K.; writing—original draft preparation, D.A.K.; writing—review and editing, D.A.K., S.K., J.R.M., J.A.H., K.W.L., C.A.B.; visualization, S.K., D.A.K.; supervision, D.A.K., C.A.B.; project administration, D.A.K., C.A.B.; funding acquisition, C.A.B. All authors have read and agreed to the published version of the manuscript.

Funding

This research was funded by Environment and Climate Change Canada and I. and T.C. Kirk.

Institutional Review Board Statement

Not applicable (no animals were handled during this specific study).

Data Availability Statement

The rattlesnake observation data are archived by the British Columbia Conservation Data Centre as part of the Wildlife Species Inventory (WHI) managed by the BC Ministry of Environment. Because the species is classified as Threatened under the Species at Risk Act in Canada (2003), and suffers from direct and indirect persecution, these data are under strict confidentiality agreements; contact Conservation Data [email protected]. Digital elevation model spatial data are available upon request from the BC Ministry of Forests, Land, Natural Resource Operations and Rural Development. The Agricultural Land Cover data are available on special request from the BC Department of Agriculture (https://catalogue.data.gov.bc.ca/dataset/92e17599-ac8a-47c8-877c-107768cb373c—accessed 4 November 2020. Land cover data are freely available at http://www.cec.org/files/atlas/?z=3&x=-93.1641&y=61.9803&lang=en&layers=polbounds%2Clandcover2015ls&opacities=100%2C100&labels=false—accessed 10 October 2020; climate data at https://chelsa-climate.org/—accessed 10 October 2020; Grassland Conservation Council of British Columbia GIS grassland land cover; https://a100.gov.bc.ca/pub/acat/public/viewReport.do?reportId=54174; accessed 23 November 2020; DEM data from the Government of British Columbia at https://www2.gov.bc.ca/gov/content/data/geographic-data-services/topographic-data/elevation/digital-elevation-model—accessed 4 November 2020; and road data from: https://www2.gov.bc.ca/gov/content/data/geographic-data-services/topographic-data/roads—accessed 10 October 2020.

Acknowledgments

This study was partially funded by Environment and Climate Change Canada. Research funding was also provided to the lead author by I. Kirk and T.C. Kirk while on sabbatical. This research benefitted greatly from many earlier discussions with colleagues that helped us to develop and refine our methodology; C. Millar helped with initial planning, V. Thomasson provided advice, and F. Iredale sent links to digital elevation models. We thank L. Andrusiak, O. Dyer, and J. Hobbs for suggestions about previous draft models; early versions of the original manuscript were improved by comments from E. Lomas, S. Winton, and especially J. Hobbs. We especially thank the British Columbia Conservation Data Centre, and particularly K. Stipec and D. Demarchi for speedy handling of our data requests. We also thank C. Roesler (BC Department of Agriculture) for facilitating the data-sharing agreement with Environment and Climate Change Canada to use the Agricultural Land Reserve data, R. Oostlander (Ministry of Forests, Lands, Natural Resource Operations and Rural Development) for sharing cumulative effects data layers, and Grasslands Conservation Council of BC for grassland GIS data sources. Thanks to R. Reudink who created the shapefile for Figure 1 and especially A. Hebb who created our final map. G. MacGregor and R. Chapman provided excellent support and advice with GIS layers. M. Atkins shared preliminary data from his Master’s thesis. M. Sarell and J. Hobbs checked the relative index occurrence maps for accuracy. We thank the Nk’Mip Desert Cultural Centre and the Osoyoos Indian Band for their support and oversight of the original field data collection for the CMR study, logistics and use of their facilities; this study was conducted in the traditional lands of the unceded territories of the Syilx Nation, Sto:lo Nation, the Nlaka’pamux, and the Secwépemc Nations. We appreciate the very helpful comments from three anonymous reviewers and the Associate Editor, Michael J. Dreslik, which greatly improved our manuscript. The analytical steps taken and views expressed in this paper are solely those of the authors.

Conflicts of Interest

The authors declare no conflict of interest.

References

  1. Butchart, S.H.M.; Walpole, M.; Collen, B.; Van Strien, A.; Scharlemann, J.P.W.; Almond, R.E.A.; Baillie, J.E.M.; Bomhard, B.; Brown, C.; Bruno, J.; et al. Global Biodiversity: Indicators of Recent Declines. Science 2010, 328, 1164–1168. [Google Scholar] [CrossRef] [PubMed]
  2. Pimm, S.L.; Jenkins, C.N.; Abell, R.; Brooks, T.M.; Gittleman, J.L.; Joppa, L.N.; Raven, P.H.; Roberts, C.M.; Sexton, J.O. The Biodiversity of Species and Their Rates of Extinction, Distribution, and Protection. Science 2014, 344. [Google Scholar] [CrossRef] [PubMed]
  3. Waldron, A.; Miller, D.C.; Redding, D.; Mooers, A.; Kuhn, T.S.; Nibbelink, N.; Roberts, J.T.; Tobias, J.A.; Gittleman, J.L. Reductions in Global Biodiversity Loss Predicted from Conservation Spending. Nature 2017, 551, 364–367. [Google Scholar] [CrossRef]
  4. Diaz, S.; Settele, J.; Brondizio, E.; Ngo, H.T.; Gueze, M.; Agard, J.; Arneth, A.; Balvanera, P.; Brauman, K.; Butchart, S.; et al. Summary for Policymakers of the Global Assessment Report on Biodiversity and Ecosystem Services; Intergovernmental Science-Policy Platform on Biodiversity and Ecosystem Services: Bonn, Germany, 2019. [Google Scholar]
  5. Gibbons, D.W.; Sandbrook, C.; Sutherland, W.J.; Akter, R.; Bradbury, R.; Broad, S.; Clements, A.; Crick, H.Q.P.; Elliott, J.; Gyeltshen, N.; et al. The Relative Importance of COVID-19 Pandemic Impacts on Biodiversity Conservation Globally. Conserv. Biol. 2021. [Google Scholar] [CrossRef]
  6. Maxwell, S.L.; Fuller, R.A.; Brooks, T.M.; Watson, J.E.M. Biodiversity: The Ravages of Guns, Nets and Bulldozers. Nature 2016, 536, 143–145. [Google Scholar] [CrossRef]
  7. Shamoon, H.; Maor, R.; Saltz, D.; Dayan, T. Increased Mammal Nocturnality in Agricultural Landscapes Results in Fragmentation Due to Cascading Effects. Biol. Conserv. 2018, 226, 32–41. [Google Scholar] [CrossRef]
  8. Bellard, C.; Bertelsmeier, C.; Leadley, P.; Thuiller, W.; Courchamp, F. Impacts of Climate Change on the Future of Biodiversity. Ecol. Lett. 2012, 15, 365–377. [Google Scholar] [CrossRef] [Green Version]
  9. Staudinger, M.D.; Carter, S.L.; Cross, M.S.; Dubois, N.S.; Duffy, J.E.; Enquist, C.; Griffis, R.; Hellmann, J.J.; Lawler, J.J.; O’Leary, J.; et al. Biodiversity in a Changing Climate: A Synthesis of Current and Projected Trends in the US. Front. Ecol. Environ. 2013, 11, 465–473. [Google Scholar] [CrossRef] [Green Version]
  10. Margules, C.; Pressey, R. Systematic Conservation planning. Nature 2000, 405, 243–253. [Google Scholar] [CrossRef] [PubMed]
  11. Possingham, H.P.; Wilson, K.A.; Andelman, S.J.; Vynne, C.H. Protected areas: Goals, limitations, and design. In Principles of Conservation Biology; Groom, M.J., Meffe, G.K., Carroll, C.R., Eds.; Sinauer Associates Inc.: Sunderland, MA, USA, 2006; pp. 509–533. [Google Scholar]
  12. Czech, B.; Krausman, P.R.; Devers, P.K. Economic Associations among Causes of Species Endangerment in the United States. BioScience 2000, 50, 593–601. [Google Scholar] [CrossRef] [Green Version]
  13. Leverington, F.; Costa, K.L.; Courrau, J.; Pavese, H.; Nolte, C.; Marr, M.; Coad, L.; Burgess, N.; Bomhard, B.; Hockings, M.; et al. Management Effectiveness Evaluation in Protected Areas—A Global Study. Second Edition 2010. Environ. Manag. 2010, 46, 685–698. [Google Scholar] [CrossRef]
  14. Carwardine, J.; O’Connor, T.; Legge, S.; Mackey, B.; Possingham, H.P.; Martin, T.G. Prioritizing Threat Management for Biodiversity Conservation. Conserv. Lett. 2012, 5, 196–204. [Google Scholar] [CrossRef] [Green Version]
  15. Gibbons, J.W.; Scott, D.E.; Ryan, T.J.; Buhlmann, K.A.; Tuberville, T.D.; Metts, B.S.; Greene, J.L.; Mills, T.; Leiden, Y.; Poppy, S.; et al. The Global Decline of Reptiles, Déjà Vu Amphibians. BioScience 2000, 50, 653–666. [Google Scholar] [CrossRef] [Green Version]
  16. Lesbarrères, D.; Ashpole, S.L.; Bishop, C.A.; Blouin-Demers, G.; Brooks, R.J.; Echaubard, P.; Govindarajulu, P.; Green, D.M.; Hecnar, S.J.; Herman, T.; et al. Conservation of Herpetofauna in Northern Landscapes: Threats and Challenges from a Canadian Perspective. Biol. Conserv. 2014, 170, 48–55. [Google Scholar] [CrossRef]
  17. Gregory, P.T. Biology and conservation of a cold climate snake fauna. In Ecology, Conservation and Status of Reptiles in Canada; Seburn, C.N.L., Bishop, C.A., Eds.; SSAR, Herpetological Conservation 2: Salt Lake City, UT, USA, 2007; pp. 41–56. [Google Scholar]
  18. Gregory, P.T. Northern Lights and Seasonal Sex: The Reproductive Ecology of Cool-Climate Snakes. Herpetol. 2009, 65, 1–13. [Google Scholar] [CrossRef]
  19. Bunnell, F.L.; Campbell, R.W.; Squires, K.A. Conservation Priorities for Peripheral Species: The Example of British Columbia. Can. J. For. Res. 2004, 34, 2240–2247. [Google Scholar] [CrossRef]
  20. Gibson, S.Y.; Van Der Marel, R.C.; Starzomski, B.M. Climate Change and Conservation of Leading-Edge Peripheral Populations. Conserv. Biol. 2009, 23, 1369–1373. [Google Scholar] [CrossRef]
  21. Thornton, D.H.; Wirsing, A.J.; Lopez-Gonzalez, C.; Squires, J.R.; Fisher, S.; Larsen, K.W.; Peatt, A.; Scrafford, M.A.; Moen, R.A.; Scully, A.E.; et al. Asymmetric Cross-Border Protection of Peripheral Transboundary Species. Conserv. Lett. 2018, 11, 1–9. [Google Scholar] [CrossRef] [Green Version]
  22. Fraser, D. Species at the Edge: The Case for Listing of “Peripheral” Species. In Proceedings of the Conference on the Biology and Management of Species and Habitats at Risk, Kamloops, BC, Canada, 15–19 February 1999; pp. 49–54. [Google Scholar]
  23. Schmidt, D.A.; Govindarajulu, P.; Larsen, K.W.; Russello, M.A. Genotyping-in-Thousands by Sequencing Reveals Marked Population Structure in Western Rattlesnakes to Inform Conservation Status. Ecol. Evol. 2020, 10, 7157–7172. [Google Scholar] [CrossRef]
  24. Parker, W.S.; Plummer, M.V. Population ecology. In Snakes Ecology and Evolutionary Biology; Seigel, R.A., Collins, J.T., Novak, S.S., Eds.; MacMillan Publishing Company: New York, NY, USA, 1987; pp. 253–301. [Google Scholar]
  25. DeGregorio, B.A.; Putman, B.J.; Kingsbury, B.A. Which Habitat Selection Method Is Most Applicable to Snakes. Herpetol. Conserv. Biol. 2011, 6, 372–382. [Google Scholar]
  26. IUCN. The IUCN Red List of Threatened Species. Available online: http://www.iucnredlist.org/technical-documents/categories-and-criteria (accessed on 15 April 2021).
  27. Lind, A.J.; Welsh, H.H.; Tallmon, D.A. Garter Snake Population Dynamics from a 16-Year Study: Considerations for Ecological Monitoring. Ecol. Appl. 2005, 15, 294–303. [Google Scholar] [CrossRef] [Green Version]
  28. Maida, J.R.; Kirk, D.A.; McKibbin, O.; Row, J.R.; Larsen, K.W.; Stringham, C.; Bishop, C.A. Population Estimate, Survivorship and Generation Time of the Northern Pacific Rattlesnake (Crotalus o. oreganus) at Its Northern-Most Range Limits. Herpetol. Conserv. Biol. 2018, 13, 662–672. [Google Scholar]
  29. Reading, C.J.; Luiselli, L.M.; Akani, G.C.; Bonnet, X.; Amori, G.; Ballouard, J.M.; Filippi, E.; Naulleau, G.; Pearson, D.; Rugiero, L. Are Snake Populations in Widespread Decline? Biol. Lett. 2010, 6, 777–780. [Google Scholar] [CrossRef] [PubMed] [Green Version]
  30. Durso, A.M.; Willson, J.D.; Winne, C.T. Needles in Haystacks: Estimating Detection Probability and Occupancy of Rare and Cryptic Snakes. Biol. Conserv. 2011, 144, 1508–1515. [Google Scholar] [CrossRef]
  31. McCluskey, E.; Matthews, S.; Ligocki, I.; Holding, M. The Importance of Historical Land Use in the Maintenance of Early Successional Habitat for an Endangered Rattlesnake. Glob. Ecol. Conserv. 2016, 13, e00370. [Google Scholar] [CrossRef]
  32. Luiselli, L.; Vignoli, L.; Rugiero, L.; Meek, R. Declining Occupancy Rates in the Hibernacula of Aspic Vipers (Vipera aspis) in Italy and France; Evidence for Climatic Effects? Herpetol. J. 2018, 28, 137–142. [Google Scholar]
  33. Saha, A.; McRae, L.; Dodd, C.K.; Gadsden, H.; Hare, K.M.; Lukoschek, V.; Böhm, M. Tracking Global Population Trends: Population Time-Series Data and a Living Planet Index for Reptiles. J. Herpetol. 2018, 52, 259–268. [Google Scholar] [CrossRef] [Green Version]
  34. Shine, R.; Lemaster, M.; Wall, M.; Langkilde, T.; Mason, R. Why Did the Snake Cross the Road? Effects of Roads on Movement and Location of Mates by Garter Snakes (Thamnophis sirtalis parietalis). Ecol. Soc. 2004, 9. [Google Scholar] [CrossRef]
  35. Harvey, J.A. Thermal Influences on Summer Habitat Use by Western Rattlesnakes (Crotalus oreganus) in British Columbia. Master’s Thesis, Thompson Rivers University, Kamloops, BC, Canada, 2015. [Google Scholar]
  36. Harvey, J.A.; Larsen, K.W. Rattlesnake Migrations and the Implications of Thermal Landscapes. Mov. Ecol. 2020, 8, 1–13. [Google Scholar] [CrossRef]
  37. Waldron, J.L.; Welch, S.M.; Bennett, S.H.; Kalinowsky, W.G.; Mousseau, T.A. Life History Constraints Contribute to the Vulnerability of a Declining North American Rattlesnake. Biol. Conserv. 2013, 159, 530–538. [Google Scholar] [CrossRef]
  38. Gienger, C.M.; Beck, D.D. Northern Pacific Rattlesnakes (Crotalus oreganus) Use Thermal and Structural Cues to Choose Overwintering Hibernacula. Can. J. Zool. 2011, 1090, 1084–1090. [Google Scholar] [CrossRef] [Green Version]
  39. Lomas, E.; Maida, J.R.; Bishop, C.A.; Larsen, K.W. Movement Ecology of Northern Pacific Rattlesnakes (Crotalus o. oreganus) in Response to Disturbance. Herpetologica 2019, 75, 153–161. [Google Scholar] [CrossRef]
  40. Gomez, L.; Larsen, K.W.; Gregory, P.T. Contrasting Patterns of Migration and Habitat Use in Neighboring Rattlesnake Populations. J. Herpetol. 2015, 49, 371–376. [Google Scholar] [CrossRef]
  41. Gardiner, L.E.; Somers, C.M.; Parker, D.L.; Poulin, R.G. Microhabitat Selection by Prairie Rattlesnakes (Crotalus viridis) at the Northern Extreme of Their Geographic Range. J. Herpet. 2015, 49, 131–137. [Google Scholar] [CrossRef]
  42. Row, J.R.; Blouin-Demers, G.; Weatherhead, P.J. Demographic Effects of Road Mortality in Black Ratsnakes (Elaphe obsoleta). Biol. Conserv. 2007, 137, 117–124. [Google Scholar] [CrossRef]
  43. Tinkle, D.W. Long-Term Field Studies. BioScience 1979, 29, 717. [Google Scholar] [CrossRef]
  44. Pechmann, J.H.K.; Wilbur, H.M. Putting Declining Amphibian Populations in Perspective: Natural Fluctuations and Human Impacts. Herpetol. 1994, 50, 65–84. [Google Scholar]
  45. Hammerson, G.A.; Frost, D.R.; Hollingsworth, B. Crotalus Oreganus. The IUCN Red List of Threatened Species 2007: E.T64326A12769216. Available online: https://www.iucnredlist.org/species/64326/12769216 (accessed on 27 July 2021).
  46. Committee on the Status of Endangered Wildlife in Canada (COSEWIC). COSEWIC Assessment and Status Report on the Western Rattlesnake Crotalus oreganus in Canada; Committee on the Status of Endangered Wildlife in Canada: Ottawa, ON, Canada, 2015. [Google Scholar]
  47. Bertram, N.; Larsen, K.W.; Surgenor, J. Identification of Critical Habitats and Conservation Issues for the Western Rattlesnake and Great Basin Gopher Snake within the Thompson-Nicola Region of British Columbia; Final Report for the British Columbia Ministry of Water, Land and Air Protection and the Habitat Trust Conservation Fund of British Columbia: Kamloops, BC, Canada, 2001; 53p. [Google Scholar]
  48. Gomez, L.M. Habitat Use and Movement Patterns of the Northern Pacific Rattlesnake in British Columbia. Master’s Thesis, Thompson Rivers University, Kamloops, BC, Canada, 2007. [Google Scholar]
  49. Lomas, E.V. Effects of Disturbance on the Northern Pacific Rattlesnake (Crotalus oreganus oreganus) in British Columbia. Master’s Thesis, Thompson Rivers University, Kamloops, BC, Canada, 2013. [Google Scholar]
  50. BC Ministry of Forest and Range Biogeoclimatic Ecosystem Classification Program. Available online: https://www.for.gov.bc.ca/hre/becweb/ (accessed on 14 October 2020).
  51. Atkins, M.C.P. Temporal and Spatial Responses of Western Rattlesnakes (Crotalus oreganus) to Landscape Management Changes. Master’s Thesis, Thompson Rivers University, Kamloops, BC, Canada, 2021. [Google Scholar]
  52. The Grassland Conservation Council of British Columbia. Mitigating the Fragmentation and Development of BC’s Grasslands Problem Analysis and Strategic Plan; Grasslands Conservation Council of British Columbia: Kamloops, BC, Canada, 2005; 103p. [Google Scholar]
  53. Tôrres, N.M.; De Marco, P.; Santos, T.; Silveira, L.; de Almeida Jácomo, A.T.; Diniz-Filho, J.A.F. Can Species Distribution Modelling Provide Estimates of Population Densities? A Case Study with Jaguars in the Neotropics. Divers. Distrib. 2012, 18, 615–627. [Google Scholar] [CrossRef]
  54. Rodríguez, J.P.; Brotons, L.; Bustamante, J.; Seoane, J. The Application of Predictive Modelling of Species Distribution to Biodiversity Conservation. Divers. Distrib. 2007, 13, 243–251. [Google Scholar] [CrossRef]
  55. Feng, X.; Park, D.S.; Walker, C.; Peterson, A.T.; Merow, C.; Papeş, M. A Checklist for Maximizing Reproducibility of Ecological Niche Models. Nat. Ecol. Evol. 2019, 3, 1382–1395. [Google Scholar] [CrossRef] [Green Version]
  56. Spear, S.; Cosentino, B.; Hall, B.; Kavanagh, D.; McRae, B.; Shirk, A. Appendix A. 9. Habitat Connectivity for Western Rattlesnake (Crotalus oreganus) in the Columbia Plateau Ecoregion. In Washington Connected Landscapes Project: Analysis of the Columbia Plateau Ecoregion; Washington’s Department of Fish and Wildlife, and Department of Transportation: Olympia, WA, USA, 2010; pp. 1–27. [Google Scholar]
  57. Spear, S.F.; Parker, J.M.; Peterson, C.R.; Jenkins, C.L.; Waits, L.P. Modeling the Effect of Roads on Habitat Area and Connectivity of Midget Faded Rattlesnakes (Crotalus oreganus concolor) across Southwest Wyoming. In The Biology of Rattlesnakes II; Dreslik, M.J., Hayes, W.K., Beaupre, S.J., Mackessy, S.P., Eds.; ECO Herpetological Publishing and Distribution: Rodeo, NM, USA, 2017; pp. 22–33. ISBN 9781938850547. [Google Scholar]
  58. Thomasson, V. Habitat Suitability Modeling for the Eastern Hog-Nosed Snake, Heterodon platirinos, in Ontario. Master’s Thesis, University of Ottawa, Ottawa, ON, Canada, 2012. [Google Scholar]
  59. Bisrat, S.A.; White, M.A.; Beard, K.H.; Richard Cutler, D. Predicting the Distribution Potential of an Invasive Frog Using Remotely Sensed Data in Hawaii. Divers. Distrib. 2012, 18, 648–660. [Google Scholar] [CrossRef]
  60. Préau, C.; Trochet, A.; Bertrand, R.; Isselin-Nondedeu, F. Modeling Potential Distributions of Three European Amphibian Species Comparing ENFA and MaxEnt. Herpetol. Conserv. Biol. 2018, 13, 91–104. [Google Scholar]
  61. Sarquis, J.A.; Cristaldi, M.A.; Arzamendia, V.; Bellini, G.; Giraudo, A.R. Species Distribution Models and Empirical Test: Comparing Predictions with Well-Understood Geographical Distribution of Bothrops alternatus in Argentina. Ecol. Evol. 2018, 8, 10497–10509. [Google Scholar] [CrossRef] [Green Version]
  62. Yen, P.P.W.; Huettmann, F.; Cooke, F. A Large-Scale Model for the at-Sea Distribution and Abundance of Marbled Murrelets (Brachyramphus marmoratus) during the Breeding Season in Coastal British Columbia, Canada. Ecol. Modell. 2004, 171, 395–413. [Google Scholar] [CrossRef]
  63. Winton, S.A. Impacts of Road Mortality on the Western Rattlesnake (Crotalus oreganus) in British Columbia. Master’s Thesis, Thompson Rivers University, Kamloops, BC, Canada, 2018. [Google Scholar]
  64. Winton, S.A.; Taylor, R.; Bishop, C.A.; Larsen, K.W. Estimating Actual versus Detected Road Mortality Rates for a Northern Viper. Glob. Ecol. Conserv. 2018, 16, e00476. [Google Scholar] [CrossRef]
  65. Bishop, C.A.; Williams, K.E.; Kirk, D.A.; Nantel, P.; Reed, E.; Elliott, J.E. A Population Model of the Impact of a Rodenticide Containing Strychnine on Great Basin Gophersnakes (Pituophis catenifer deserticola). Ecotoxicology 2016, 25, 1390–1405. [Google Scholar] [CrossRef]
  66. British Columbia Government. British Columbia Conservation Data Centre. Available online: https://www2.gov.bc.ca/gov/content/environment/plants-animals-ecosystems/conservation-data-centre (accessed on 24 May 2019).
  67. Government of British Columbia Wildlife Data and Information. Available online: https://www.canada.ca/en/environment-climate-change/services/species-risk-public-registry.html (accessed on 24 May 2019).
  68. Diller, L.V.; Wallace, R.L. Comparative Ecology of Two Snake Species (Crotalus viridis and Pituophis melanoleucus) in Southwestern Idaho. Herpetologic 1996, 52, 343–360. [Google Scholar]
  69. Diller, L.V.; Wallace, R.L. Growth, Reproduction, and Survival in a Population of Crotalus viridis oreganus in North Central Idaho. Herpetol. Monogr. 2002, 16, 26–45. [Google Scholar] [CrossRef]
  70. Wallace, R.L.; Diller, L.V. Variation in Emergence, Egress, and Ingress among Life-History Stages and Sexes of Crotalus viridis oreganus in Northern Idaho. J. Herpetol. 2001, 35, 583–589. [Google Scholar] [CrossRef]
  71. Putman, B.J.; Lind, C.; Taylor, E.N. Does Size Matter? Factors Influencing the Spatial Ecology of Northern Pacific Rattlesnakes (Crotalus oreganus oreganus) in Central California. Copeia 2013, 485–492. [Google Scholar] [CrossRef]
  72. Hecker, L.J.; Bean, W.T.; Marks, S.B. Compensatory Microhabitat Selection by Northern Pacific Rattlesnakes (Crotalus oreganus oreganus) in a Cool and Wet Macroclimate. J. Herpetol. 2020, 54, 39–49. [Google Scholar] [CrossRef]
  73. Maida, J.R.; Bishop, C.A.; Larsen, K.W.; Maida, J.R.; Bishop, C.A.; Larsen, K.W. Migration and Disturbance: Impact of Fencing and Development on Rattlesnake Spring Movements in British Columbia. Can. J. Zool. 2020, 98, 1–12. [Google Scholar] [CrossRef]
  74. Brown, J.R.; Bishop, C.A.; Brooks, R.J. Effectiveness of Short-Distance Translocation and Its Effects on Western Rattlesnakes. J. Wildl. Manag. 2009, 73, 419–425. [Google Scholar] [CrossRef]
  75. Lomas, E.; Larsen, K.W.; Bishop, C.A. Persistence of Northern Pacific Rattlesnakes Masks the Impact of Human Disturbance on Weight and Body Condition. Anim. Conserv. 2015, 18, 548–556. [Google Scholar] [CrossRef]
  76. R Development Core Team. R: A Language and Environment for Statistical Computing: Version 3.0.1; R Development Core Team: Vienna, Austria, 2016. [Google Scholar]
  77. Aiello-Lammens, A.M.E.; Vilela, B.; Anderson, R.P.; Bjornson, R.; Weston, S.; Aiello-lammens, M.M.E.; America, S. Functions for Spatial Thinning of Species Occurrence Records for Use in Ecological Models. Package ‘SpThin’. Version 0.2.0. R: A Language and Environment for Statistical Computing; R Foundation for Statistical Computing: Vienna, Austria, 2019. [Google Scholar]
  78. Thomasson, V.; Blouin-Demers, G. Using Habitat Suitability Models Considering Biotic Interactions to Inform Critical Habitat Delineation: An Example with the Eastern Hog-Nosed Snake (Heterodon platirhinos) in Ontario, Canada. Can. Wildl. Biol. Manag. 2015, 4, 1–17. [Google Scholar]
  79. Wills, C.A.; Beaupre, S.J. An Application of Randomization for Detecting Evidence of Thermoregulation in Timber Rattlesnakes (Crotalus horridus) from Northwest Arkansas. Physiol. Biochem. Zool. 2000, 73, 325–334. [Google Scholar] [CrossRef] [PubMed]
  80. Putman, B.J.; Clark, R.W. Behavioral Thermal Tolerances of Free-Ranging Rattlesnakes (Crotalus oreganus) during the Summer Foraging Season. J. Therm. Biol. 2017, 65, 8–15. [Google Scholar] [CrossRef]
  81. Karger, D.N.; Conrad, O.; Böhner, J.; Kawohl, T.; Kreft, H.; Soria-Auza, R.W.; Zimmermann, N.E.; Linder, H.P.; Kessler, M. Data from: Climatologies at High Resolution for the Earth’s Land Surface Areas; Dryad: Berlin-Brandenburg, Germany, 2017. [Google Scholar]
  82. Karger, D.N.; Conrad, O.; Böhner, J.; Kawohl, T.; Kreft, H.; Soria-Auza, R.W.; Zimmermann, N.E.; Linder, H.P.; Kessler, M. Climatologies at High Resolution for the Earth’s Land Surface Areas. Sci. Data. 2017, 4, 170122. [Google Scholar] [CrossRef] [Green Version]
  83. Conrad, O.; Bechtel, B.; Bock, M.; Dietrich, H.; Fischer, E.; Gerlitz, L.; Wehberg, J.; Wichmann, V.; Böhner, J. System for Automated Geoscientific Analyses (SAGA) v 2.1.4. Geosci. Model Dev. 2015, 8, 1991–2007. [Google Scholar] [CrossRef] [Green Version]
  84. Bauder, J.M.; Akenson, H.; Peterson, C.R. Movement Patterns of Prairie Rattlesnakes (Crotalus v. viridis) across a Mountainous Landscape in a Designated Wilderness Area. J. Herpetol. 2015, 49, 377–387. [Google Scholar] [CrossRef]
  85. Bauder, J.M.; Breininger, D.R.; Bolt, M.R.; Legare, M.L.; Jenkins, C.L.; Rothermel, B.B.; McGarigal, K. Multi-Level, Multi-Scale Habitat Selection by a Wide-Ranging, Federally Threatened Snake. Landsc. Ecol. 2018, 33, 743–763. [Google Scholar] [CrossRef]
  86. Ministry of Forests, Lands, Natural Resource Operations and Rural Development (Government of British Columbia). Digital Elevation Model. Available online: https://www2.gov.bc.ca/gov/content/data/geographic-data-services/topographic-data/elevation/digital-elevation-model (accessed on 2 August 2021).
  87. Macartney, J.M. The Ecology of the Northern Pacific Rattlesnake, Crotalus Viridis Oreganus, in British Columbia. Master’s Thesis, University of Victoria, Victoria, BC, Canada, 1985. [Google Scholar]
  88. Commission for Environmental Cooperation (CEC). North American Environmental Atlas. Available online: http://www.cec.org/files/atlas/?z=3&x=93.1641&y=61.9803&lang=en&layers=polbounds%2Clandcover2015ls&opacities=100%2C100&labels=false (accessed on 20 September 2020).
  89. Latifovic, R.; Pouliot, D.; Olthof, I. Circa 2010 Land Cover of Canada: Local Optimization Methodology and Product Development. Remote Sens. 2017, 9, 1098. [Google Scholar] [CrossRef] [Green Version]
  90. Clark, R.W.; Brown, W.S.; Stechert, R.; Zamudio, K.R. Roads, Interrupted Dispersal, and Genetic Diversity in Timber Rattlesnakes. Conserv. Biol. 2010, 24, 1059–1069. [Google Scholar] [CrossRef]
  91. Paterson, J.E.; Baxter-Gilbert, J.; Beaudry, F.; Carstairs, S.; Chow-Fraser, P.; Edge, C.B.; Lentini, A.M.; Litzgus, J.D.; Markle, C.E.; McKeown, K.; et al. Road Avoidance and Its Energetic Consequences for Reptiles. Ecol. Evol. 2019, 9, 9794–9803. [Google Scholar] [CrossRef] [PubMed] [Green Version]
  92. Andrews, K.M.; Gibbons, J.W. How Do Highways Influence Snake Movement? Behavioral Responses to Roads and Vehicles. Copeia 2005, 2005, 772–782. [Google Scholar] [CrossRef] [Green Version]
  93. GeoBC. GeoBC Atlas Integrated Transportation Network (Dgtl_Road_Atlas.Gdb); GeoBC: Victoria, BC, Canada, 2018.
  94. Wiersma, Y.F.; Huettmann, F.; Drew, C.A. Introduction. Landscape Modeling of Species and Their Habitats: History, Uncertainty, and Complexity. In Predictive Species and Habitat Modeling in Landscape Ecology: Concepts and Applications; Drew, C.A., Wiersma, Y.F., Huettmann, F., Eds.; Springer: New York, NY, USA, 2011; pp. 1–313. ISBN 9781441973894. [Google Scholar]
  95. Fielding, A.H.; Bell, J.F. A Review of Methods for the Assessment of Prediction Errors in Conservation Presence/Absence Models. Environ. Conserv. 1997, 24, 38–49. [Google Scholar] [CrossRef]
  96. Cutler, A.; Cutler, D.R.; Stevens, J.R. Random Forests. In Ensemble Machine Learning: Methods and Applications; Zhang, C., Ma, Y., Eds.; Springer Science+Business Media, LLC: Berlin, Germany, 2012; pp. 157–175. [Google Scholar] [CrossRef]
  97. Phillips, S.J.; Dudík, M. Modeling of Species Distribution with Maxent: New Extensions and a Comprehensive Evaluation. Ecograpy 2008, 31, 161–175. [Google Scholar] [CrossRef]
  98. Elith, J.; Leathwick, J.R.; Hastie, T. A Working Guide to Boosted Regression Trees. J. Anim. Ecol. 2008, 77, 802–813. [Google Scholar] [CrossRef]
  99. Araújo, M.B.; New, M. Ensemble Forecasting of Species Distributions. Trends Ecol. Evol. 2007, 22, 42–47. [Google Scholar] [CrossRef] [PubMed]
  100. Thuiller, W.; Georges, D.; Engler, R.; Breiner, F. Ensemble Platform for Species Distribution Modeling. Package ‘biomod2’. Version 3.4.6. R: A Language and Environment for Statistical Computing; R Foundation for Statistical Computing: Vienna, Austria, 2020. [Google Scholar]
  101. Hao, T.; Elith, J.; Guillera-Arroita, G.; Lahoz-Monfort, J.J. A Review of Evidence about Use and Performance of Species Distribution Modelling Ensembles like BIOMOD. Divers. Distrib. 2019, 25, 839–852. [Google Scholar] [CrossRef]
  102. Zurell, D.; Franklin, J.; König, C.; Bouchet, P.J.; Dormann, C.F.; Elith, J.; Fandos, G.; Feng, X.; Guillera-Arroita, G.; Guisan, A.; et al. A Standard Protocol for Reporting Species Distribution Models. Ecography. 2020, 43, 1261–1277. [Google Scholar] [CrossRef]
  103. Muscarella, A.R.; Galante, P.J.; Soley-Guardia, M.; Boria, R.A.; Kass, J.M.; Uriarte, M.; Anderson, R.P.; Muscarella, M.R. Automated Runs and Evaluations of Ecological Niche Models, Package ‘ENMeval’. Version 0.3.1. R: A Language and Environment for Statistical Computing; R Foundation for Statistical Computing: Vienna, Austria, 2020. [Google Scholar]
  104. Phillips, S.J.; Dudík, M.; Elith, J.; Graham, C.H.; Lehmann, A.; Leathwick, J.; Ferrier, S. Sample Selection Bias and Presence-Only Distribution Models: Implications for Background and Pseudo-Absence Data. Ecol. Appl. 2009, 19, 181–197. [Google Scholar] [CrossRef] [PubMed] [Green Version]
  105. Syfert, M.M.; Smith, M.J.; Coomes, D.A. The Effects of Sampling Bias and Model Complexity on the Predictive Performance of MaxEnt Species Distribution Models. PLoS ONE 2013, 8. [Google Scholar] [CrossRef] [Green Version]
  106. Ernst, C.H.; Ernst, E.M. Venomous Reptiles of the United States, Canada, and Northern Mexico, Vol. 2, Crotalus; Ernst, C.H., Ernst, E.M., Eds.; John Hopkins University Press: Baltimore, NJ, USA, 2011; 424p. [Google Scholar]
  107. Breiman, L. Statistical Modelling: The Two Cultures. Stat. Sci. 2001, 16, 199–215. [Google Scholar] [CrossRef]
  108. Kandel, K.; Huettmann, F.; Suwal, M.K.; Ram Regmi, G.; Nijman, V.; Nekaris, K.A.I.; Lama, S.T.; Thapa, A.; Sharma, H.P.; Subedi, T.R. Rapid Multi-Nation Distribution Assessment of a Charismatic Conservation Species Using Open Access Ensemble Model GIS Predictions: Red Panda (Ailurus fulgens) in the Hindu-Kush Himalaya Region. Biol. Conserv. 2015, 181, 150–161. [Google Scholar] [CrossRef]
  109. Leclere, J.; Oberdorff, T.; Belliard, J.; Leprieur, F. A Comparison of Modeling Techniques to Predict Juvenile 0+ Fish Species Occurrences in a Large River System. Ecol. Inform. 2011, 6, 276–285. [Google Scholar] [CrossRef]
  110. DeLong, E.R.; DeLong, D.M.; Clarke-Pearson, D.L. Comparing the Areas under Two or More Correlated Receiver Operating Characteristic Curves: A Nonparametric Approach. Biometrics 1988, 44, 837–845. [Google Scholar] [CrossRef] [PubMed]
  111. Cohen, J. A Coefficient of Agreement for Nominal Scales. Educ. Psychol. Meas. 1960, 20, 37–46. [Google Scholar] [CrossRef]
  112. Allouche, O.; Tsoar, A.; Kadmon, R. Assessing the Accuracy of Species Distribution Models: Prevalence, Kappa and the True Skill Statistic (TSS). J. Appl. Ecol. 2006, 43, 1223–1232. [Google Scholar] [CrossRef]
  113. Lu, N.; Jia, C.X.; Lloyd, H.; Sun, Y.H. Species-Specific Habitat Fragmentation Assessment, Considering the Ecological Niche Requirements and Dispersal Capability. Biol. Conserv. 2012, 152, 102–109. [Google Scholar] [CrossRef]
  114. Lütolf, M.; Kienast, F.; Guisan, A. The Ghost of Past Species Occurrence: Improving Species Distribution Models for Presence-Only Data. J. Appl. Ecol. 2006, 43, 812–815. [Google Scholar] [CrossRef]
  115. Merow, C.; Smith, M.J.; Silander, J.A. A Practical Guide to MaxEnt for Modeling Species’ Distributions: What It Does, and Why Inputs and Settings Matter. Ecography 2013, 36, 1058–1069. [Google Scholar] [CrossRef]
  116. Hirzel, A.H.; le Lay, G.; Helfer, V.; Randin, C.; Guisan, A. Evaluating the Ability of Habitat Suitability Models to Predict Species Presences. Ecol. Model. 2006, 199, 142–152. [Google Scholar] [CrossRef]
  117. Huettmann, F.; Gottschalk, T. Predictive Species and Habitat Modeling in Landscape Ecology: Concepts and Applications. In Predictive Modeling in Landscape Ecology; Springer: New York, NY, USA, 2011; pp. 189–208. [Google Scholar]
  118. Dormann, C.F.; Calabrese, J.M.; Guillera-Arroita, G.; Matechou, E.; Bahn, V.; Bartoń, K.; Beale, C.M.; Ciuti, S.; Elith, J.; Gerstner, K.; et al. Model Averaging in Ecology: A Review of Bayesian, Information-Theoretic, and Tactical Approaches for Predictive Inference. Ecol. Monogr. 2018, 88, 485–504. [Google Scholar] [CrossRef] [Green Version]
  119. Winton, S.; Skurikhina, A.; Larsen, K. White Lake Snake Road Mortality: 2015–2018 Synthesis Report; Prepared for Environment and Climate Change Canada, Wildlife Research Division, Science and Technology Branch; Minister of the Environment and Climate Change: Gatineau, QC, Canada, 2019. [Google Scholar]
  120. Liu, C.; Newell, G.; White, M. On the Selection of Thresholds for Predicting Species Occurrence with Presence-Only Data. Ecol. Evol. 2016, 6, 337–348. [Google Scholar] [CrossRef] [PubMed] [Green Version]
  121. Hobbs, J. Den Survey and Population Estimate of the Northern Pacific Rattlesnake in BC; Unpublished Report; Government of British Columbia: Victoria, BC, Canada, 2013. [Google Scholar]
  122. Environment and Climate Change Canada. Canadian Protected and Conserved Areas Database. Available online: https://www.canada.ca/en/environment-climate-change/services/national-wildlife-areas/protected-conserved-areas-database.html (accessed on 4 October 2020).
  123. Rudolph, D.C.; Burgdorf, S.J.; Conner, R.N.; Schaefer, R.R. Preliminary Evaluation of the Impact of Roads and Associated Vehicular Traffic on Snake Populations in Eastern Texas. In Proceedings of the Third International Conference on Wildlife Ecology and Transportation; Fl-ER-73-99; Evink, G.L., Garrett, P., Zeigler, D., Eds.; Florida Department of Transportation: Tallahassee, FL, USA, 1999; pp. 129–136. [Google Scholar]
  124. Fortney, A.N.; Poulin, R.G.; Martino, J.A.; Parker, D.L.; Somers, C.M. Proximity to Hibernacula and Road Type Influence Potential Road Mortality of Snakes in Southwestern Saskatchewan. Can. Field-Nat. 2012, 126, 194–203. [Google Scholar] [CrossRef]
  125. Meredith, M.; Kruschke, J. Highest (Posterior) Density Intervals. Package ‘HDInterval’. Version 0.2.2 R: A Language and Environment for Statistical Computing; R Foundation for Statistical Computing: Vienna, Austria, 2020. [Google Scholar]
  126. Yousefi, M.; Ahmadi, M.; Nourani, E.; Behrooz, R.; Rajabizadeh, M.; Geniez, P.; Kaboli, M. Upward Altitudinal Shifts in Habitat Suitability of Mountain Vipers since the Last Glacial Maximum. PLoS ONE 2015, 10. [Google Scholar] [CrossRef] [Green Version]
  127. Winton, S.A.; Bishop, C.A.; Larsen, K.W. When Protected Areas Are Not Enough: Low-Traffic Roads Projected to Cause a Decline in a Northern Viper Population. Endanger. Species Res. 2020, 41, 131–139. [Google Scholar] [CrossRef] [Green Version]
  128. Renner, I.W.; Warton, D.I. Equivalence of MAXENT and Poisson Point Process Models for Species Distribution Modeling in Ecology. Biometrics 2013, 69, 274–281. [Google Scholar] [CrossRef]
  129. Heinrichs, J.A.; Lawler, J.J.; Schumaker, N.H. Intrinsic and Extrinsic Drivers of Source-Sink Dynamics. Ecol. Evol. 2016, 6, 892–904. [Google Scholar] [CrossRef] [Green Version]
  130. Environment and Climate Change Canada. Recovery Strategy for the Western Rattlesnake (Crotalus oreganus), the Great Basin Gophersnake (Pituophis Catenifer Deserticola) and the Desert Nightsnake (Hypsiglena chlorophaea) in Canada (Proposed); Species at Risk Act Recovery Strategy Series; Environment and Climate Change Canada: Ottawa, ON, Canada, 2017; Part 1, 28p, Part 2, A. 37p. B. 36p. C. 28p. Available online: https://www.registrelep-sararegistry.gc.ca/virtual_sara/files/plans/rs_south_interior_snakes_e_proposed.pdf (accessed on 4 September 2021).
  131. Reed, E.T. Population Model for Female Great Basin Gophersnake; Unpublished Report to the Committee on the Status of Endangered Wildlife in Canada: Ottawa, ON, Canada, 2013. [Google Scholar]
  132. Williams, K.E.; Hodges, K.E.; Bishop, C.A. Small Reserves around Hibernation Sites May Not Adequately Protect Mobile Snakes: The Example of Great Basin Gophersnakes (Pituophis catenifer deserticola) in British Columbia. Can. J. Zool. 2012, 90, 304–312. [Google Scholar] [CrossRef]
  133. Deguise, I.E.; Kerr, J.T. Protected Areas and Prospects for Endangered Species Conservation in Canada. Conserv. Biol. 2006, 20, 48–55. [Google Scholar] [CrossRef]
  134. Maxwell, S.L.; Cazalis, V.; Dudley, N.; Hoffmann, M.; Ana, S.L.; Stolton, S.; Visconti, P.; Woodley, S.; Maron, M.; Strassburg, B.B.N.; et al. Area-Based Conservation in the Twenty-first Century. Nature 2020, 586, 217–227. [Google Scholar] [CrossRef] [PubMed]
  135. Austin, M.A.; Buffett, D.A.; Nicolson, D.J.; Scudder, G.G.E.; Stevens, V. Taking Nature’s Pulse: The Status of Biodiversity in British Columbia. 2008, pp. 1–268. Available online: www.biodiversitybc.org (accessed on 4 September 2021).
  136. Lea, T. Historical (Pre-Settlement) Ecosystems of the Okanagan Valley and Lower Similkameen Valley of British Columbia—Pre-European Contact to the Present. Davidsonia 2008, 19, 3–36. [Google Scholar]
  137. Zeng, Q.; Zhang, Y.; Sun, G.; Duo, H.; Wen, L.; Lei, G. Using Species Distribution Model to Estimate the Wintering Population Size of the Endangered Scaly-Sided Merganser in China. PLoS ONE 2015, 10, 1–12. [Google Scholar] [CrossRef]
  138. Mi, C.; Huettmann, F.; Sun, R.; Guo, Y. Combining Occurrence and Abundance Distribution Models for the Conservation of the Great Bustard. PeerJ 2017, 2017, 1–20. [Google Scholar] [CrossRef] [Green Version]
  139. Cushman, S.A.; Huettmann, F. Spatial Complexity, Informatics, and Wildlife Conservation; Springer: New York, NY, USA, 2010; ISBN 9784431877714. [Google Scholar]
  140. Drew, C.A.; Wiersma, Y.F.; Huettmann, F. Predictive Species and Habitat Modeling in Landscape Ecology: Concepts and Applications; Springer: New York, NY, USA, 2011. [Google Scholar]
  141. Schuster, R.; Hanson, J.O.; Strimas-Mackey, M.; Bennett, J.R. Exact integer linear programming solvers outperform simulated annealing for solving conservation planning problems. PeerJ 2020, 8, e9258. [Google Scholar] [CrossRef]
  142. Gonzales, E.K.; Arcese, P.; Schulz, R.; Bunnell, F.L. Strategic Reserve Design in the Central Coast of British Columbia: Integrating Ecological and Industrial Goals. Can. J. For. Res. 2003, 33, 2129–2140. [Google Scholar] [CrossRef]
  143. Lyet, A.; Thuiller, W.; Cheylan, M.; Besnard, A. Fine-Scale Regional Distribution Modelling of Rare and Threatened Species: Bridging GIS Tools and Conservation in Practice. Divers. Distrib. 2013, 19, 651–663. [Google Scholar] [CrossRef]
  144. Baltensperger, A.P.; Huettmann, F. Predictive Spatial Niche and Biodiversity Hotspot Models for Small Mammal Communities in Alaska: Applying Machine-Learning to Conservation Planning. Landsc. Ecol. 2015, 30, 681–697. [Google Scholar] [CrossRef]
  145. Cattarino, L.; Hermoso, V.; Carwardine, J.; Kennard, M.J.; Linke, S. Multi-Action Planning for Threat Management: A Novel Approach for the Spatial Prioritization of Conservation Actions. PLoS ONE 2015, 10, 1–18. [Google Scholar] [CrossRef] [PubMed] [Green Version]
  146. Firn, J.; Maggini, R.; Chadès, I.; Nicol, S.; Walters, B.; Reeson, A.; Martin, T.G.; Possingham, H.P.; Pichancourt, J.B.; Ponce-Reyes, R.; et al. Priority Threat Management of Invasive Animals to Protect Biodiversity under Climate Change. Glob. Chang. Biol. 2015, 21, 3917–3930. [Google Scholar] [CrossRef] [PubMed] [Green Version]
  147. Firn, J.; Martin, T.G.; Chadès, I.; Walters, B.; Hayes, J.; Nicol, S.; Carwardine, J. Priority Threat Management of Non-Native Plants to Maintain Ecosystem Integrity across Heterogeneous Landscapes. J. Appl. Ecol. 2015, 52, 1135–1144. [Google Scholar] [CrossRef] [Green Version]
  148. Shackelford, N.; Standish, R.J.; Ripple, W.; Starzomski, B.M. Threats to Biodiversity from Cumulative Human Impacts in One of North America’s Last Wildlife Frontiers. Conserv. Biol. 2018, 32, 672–684. [Google Scholar] [CrossRef] [PubMed] [Green Version]
Figure 1. (a). Current range of the western rattlesnake (Crotalus oreganus) in British Columbia, Canada. The five geographic regions (putatively disjunct populations) in Canada are shown in different colors. Stars show location of intensive capture–mark–recapture study areas and data sources for our models; water is shown in light blue. Inset map shows global range in United States and Canada (see main text for sources for inset map and for Digital Elevation Model, DEM; Table S1 for roads). (b). Map showing current range of the western rattlesnake (Crotalus oreganus) in British Columbia, Canada, with protected areas and agricultural land overlaid. Stars show location of intensive capture–mark–recapture study areas and data sources for our models; (see main text and Table S1 for sources).
Diversity 13 00467 g001aDiversity 13 00467 g001b
Figure 2. Relative index of occurrence (RIO) maps for western rattlesnakes (Crotalus oreganus) in British Columbia, generated for the model platforms Random Forests, MaxEnt, Generalized Boosting Models (GBMs) and the Ensemble model. Polygons show five geographic regions (Figure 1a,b). The closer the RIO values are to 1, the higher the probability of occurrence of the species. Note the scale is in meters.
Diversity 13 00467 g002
Figure 3. Occurrence map for western rattlesnakes (Crotalus oreganus) in British Columbia, Canada for the Ensemble model. The closer the values are to 1, the higher the probability of occurrence of the species. Polygons show five geographic regions (Figure 1a,b). Note the scale is in meters.
Diversity 13 00467 g003
Table 1. Estimates of population size and density of adult (A) and adult and juvenile (A + J) western rattlesnakes (Crotalus oreganus) in three previous studies in BC (near White Lake Basin, Osoyoos, and Vernon). 1 CMR = capture–mark–recapture. 2 SE (Standard Error relates to density snakes/km2).
Study AreaYearArea (km2)Population Size (CMR) 1Density (snakes/km2)SE 2
AA + JAA + JAA + J
Osoyoos 2002–20124.50262N/A58.2N/A
White Lake Basin2015–20189.0731354534.560.14.68.6
Vernon—provincial park and ranch198311.4964177784.6155.817.244.3
Vernon—provincial park and ranch202011.4751106665.993.543.866.6
Kalamalka Provincial Park19837.644593858.6123.415.237.2
Kalamalka Provincial Park20207.632047042.161.934.247.7
Vernon ranch19833.9506856129.9219.613.226.2
Vernon ranch20203.9391592100.4151.719.931.7
Table 2. Comparison of mean relative index of occurrence (RIO) values for western rattlesnakes (Crotalus oreganus) from different model platforms for three study areas (near White Lake Basin, Osoyoos, and Vernon) and entire range in British Columbia, Canada. Values show the mean ± SD. 1 GBMs—Generalized Boosting Models.
Random ForestsMaxEntGBMs 1Ensemble
White Lake Basin0.24 ± 0.250.33 ± 0.220.43 ± 0.250.34 ± 0.23
Osoyoos 0.65 ± 0.260.48 ± 0.140.64 ± 0.130.60 ± 0.15
Vernon—provincial park0.44 ± 0.320.52 ± 0.210.64 ± 0.190.55 ± 0.22
Vernon—ranch0.32 ± 0.290.46 ± 0.170.54 ± 0.220.45 ± 0.22
Entire study area 0.26 ± 0.230.25 ± 0.220.33 ± 0.260.18 ± 0.24
Table 3. Relative importance of different environmental variables in three ecological niche models (ENMs) for western. rattlesnakes (Crotalus oreganus) in British Columbia, Canada. Elevation was the most important variable in all models. 1 GBMs—Generalized Boosting Models.
VariableRandom ForestsMaxEntGBMs 1Ensemble
Precipitation0.190.110.100.08
Annual insolation0.340.150.210.20
Elevation0.520.510.480.50
Land cover classification0.240.140.210.19
Ruggedness0.230.120.190.15
Road density0.170.090.090.07
Table 4. Adult population estimates for entire range of the western rattlesnake (Crotalus oreganus) in British Columbia, Canada using the Ensemble model from Random Forests, MaxEnt and Generalized Boosting Models.
Threshold (TSS) 1# of Suitable Pixels 2Estimate 3Standard Deviation 4
0.446176655184,05326,019
0.5139807666,52120,592
0.684596440,25112,460
0.745260821,5356666
0.7531317714,9014613
0.820431997223009
0.9912<10.18
1 TSS = true skill statistics; lower 95% highest density interval (HDI) = 0.001; upper 95% HDI = 0.71 (and corresponding estimates = 20,179 and 392,747). HDI was calculated using R package [125]. 2 Number of suitable pixels counted within range of western rattlesnake. 3 Population estimate for snakes calculated by multiplying # of suitable pixels × 0.0009 km2 × density/km2 estimates for each of three study areas and then averaged. 4 Standard deviation of estimates from three study areas.
Publisher’s Note: MDPI stays neutral with regard to jurisdictional claims in published maps and institutional affiliations.

