
Leaf Elemental Concentrations, Stoichiometry, and Resorption in Guam’s Coastal Karst Forests


Western Pacific Tropical Research Center, University of Guam, Mangilao, GU 96923, USA
Diversity 2021, 13(11), 545; https://doi.org/10.3390/d13110545
Submission received: 22 September 2021
/
Revised: 23 October 2021
/
Accepted: 26 October 2021
/
Published: 29 October 2021
Abstract
:Greater knowledge concerning the interspecific diversity of the plant leaf ionome is required to effectively understand the spatiotemporal dynamics of biogeochemistry, but Micronesia has been ignored in this literature. The objectives of this study were to quantify the leaf ionome, resorption efficiency, and stoichiometry of leaves from 25 plant species representing Guam’s coastal karst forests. Carbon and nitrogen were quantified by dry combustion, and other minerals and metals were quantified by spectrometry. Nitrogen and calcium concentrations in Guam’s green leaves exceeded the published global means, but manganese and copper concentrations were less than the global means. The remainder of the elements were within the expected ranges. Nutrient resorption rates exhibited a decreasing order of potassium > phosphorus > nitrogen > zinc > copper. The term “accretion efficiency” is introduced to describe the accumulation of an element throughout leaf aging and senescence, and calcium and iron exhibited substantial accretion efficiency in this study. Stoichiometry relations indicated that Guam’s karst forest is most limited by phosphorus and then secondarily limited by nitrogen, although several individual taxa exhibited co-limitation by potassium. Five of the species are officially listed on extinction threat lists. Of these, the Malvaceae tree Heriteria longipetiolata exhibited leaf traits depicting the most recalcitrant litter characteristics, and the Fabaceae tree Serianthes nelsonii exhibited leaf traits depicting the most labile litter characteristics. The contributions of these two tree species to spatiotemporal diversity in biogeochemistry appear to be profound, indicating species recovery efforts are of paramount importance for maintaining ecosystem function and soil heterotroph biodiversity in northern Guam.
1. Introduction
The uptake of minerals and metals from soils is essential for sustaining plant health and growth. Ionomics is the study of elemental mineral and metal concentrations and relationships in plant tissues [1,2,3]. By comparing relative elemental concentration within and among plants, much can be learned about the physical location of these elements in a forest and the biogeochemical cycling that sustains the health of a forest. Therefore, the study of the mineral nutrition of plants has long been a central component of ecology [4], and is important in several aspects of plant physiology [5].
An adequate understanding of the ionome of co-existing plant species enables the calculation of response variables that increase our understanding of forest community ecology. One example is the comparison of concentrations of pairs of elements among organisms which enables various interpretations in the field of ecological stoichiometry [6,7,8,9]. These methods increase knowledge of how resource availability influences organismal function in complex ecosystems [10]. By directly comparing the relative concentrations of nitrogen, phosphorus, and potassium, an estimation of which of these macronutrients are most limiting of plant growth in a given space and time is achievable [11,12,13,14]. A second example is the calculation of the relative re-mobilization of elements in leaves as they senesce. These elements are returned to stem tissues prior to litterfall in a process that conserves resources at the organismal level, reduces nutrient turnover at the community level, and slows the pace of litter decomposition by reducing the amount of nutrients available to litter and soil heterotrophs [15,16,17,18].
Guam is a part of the Mariana Island archipelago, and is the largest island in Micronesia. Silviculture and ecology research has been lacking, so the evidence-informed knowledge that conservationists and restorationists need is insufficient. Previously, only two native tree species have been the subject of leaf nutrient studies. Cycas micronesica K.D. Hill is the region’s only gymnosperm, and leaf nutrient relations have been determined for in situ and ex situ settings [19,20]. However, a direct comparison of this unique tree’s leaf chemistry with other plant species in the same space and time has not been reported. Elaeocarpus joga Merr. was studied in garden and in situ settings to reveal unexpectedly low leaf potassium (K) concentrations [21]. These results illuminate a clear need for the inclusion of more Guam forest species in leaf nutrient studies to determine whether K limitation is widespread.
Community-level distribution patterns of carbon and soil-derived plant nutrients are not known for the Mariana Island forests. Therefore, the objective of this study was to conduct a broad survey of 25 native plant species in a constrained space and time to determine leaf ionome, resorption, and stoichiometry traits. The results may identify the nutrients that are most limiting to productivity and serve as a benchmark for future research designed to understand the influence of global changes on forest nutrient relations.
2. Materials and Methods
The Guam study site included the northeast coastal zone, characterized by a single coralline soil series (clayey-skeletal, gibbsitic, nonacid, isohyperthermic Lithic Ustorthents). All of the selected species were sympatric within this karst habitat, which ranged in latitude from 13.4306° to 13.6259° N, ranged in longitude from 144.8092° to 144.9364° E, and ranged in elevation from 50 to 160 m above sea level. Five of the species in the dataset were limited in population and are found on published lists of endangered species. The occurrence of Typhoon Dolphin on 15 May 2015 defoliated most of the northern forest trees, and this defoliation event was exploited as a unique opportunity to obtain green leaf samples from the listed trees without taking samples directly from the protected trees. Green and senesced leaf samples were collected from the detritus layer by exploiting the litterfall zone for the various taxa within 48 h of the tropical cyclone defoliation event. Fully expanded green leaves and senesced leaves with partial chlorosis and partial necrosis were selected for the samples. The assignment of dislodged leaves to specific trees was enabled by the biodiversity and leeward litterfall zone. In most cases, this was achieved by collecting leaves from small stems that were dislodged, not from individual leaves that were dislodged. This approach ensured that the senesced leaf tissue was fresh and the two leaf ages were appropriately paired.
There were 23 spermatophyte and two pteridophyte species selected for inclusion in this dataset to provide a wide array of functional groups (Table A1). Each spermatophyte species was represented by six single-tree replications, with the exception of Serianthes nelsonii Merr. This species is critically endangered and the Guam population is represented by a single mature tree. For this large-canopied tree, paired green and senesced litter samples were collected from six circumscribed zones in the litterfall footprint created by the tropical cyclone. Therefore, a total of 133 plants were included in the dataset for the spermatophyte species. The two terrestrial pteridophyte species Asplenium polyodon G. Forst. and Nephrolepis hirsutula (G. Forst.) C. Presl were not defoliated by the tropical cyclone. Green and senesced leaves were collected from the same plants to ensure fidelity in the pairing. Each of six fern replications was represented by up to five individual adjacent plants to ensure that enough tissue was available for the analyses.
All selected leaf samples were devoid of observable insect damage. All selected plants were located at least 50 m inside intact forest communities to ensure that edge trees were avoided. All selected plants were adjacent to other native plants to ensure non-native plants did not influence the microsite. All plants were located on sites with no observable historical anthropogenic disturbance, with the exception of C. micronesica. At the time of this study, Guam’s in situ populations of this tree had been threatened by ubiquitous infestations of the invasive armored scale Aulacaspis yasumatsui Takagi for 10 years. There were several permanent plots in northern Guam where the trees had been protected with systemic insecticides. All C. micronesica samples were obtained from a protected plot that was located within the footprint of this study. This managed plot had been used for various other research objectives [22,23,24].
The six green and six senesced leaf samples for each of the 25 species were dried for 48 h at 75 °C in a forced draft oven, and then milled to pass through a 20-mesh screen. Total carbon (C) and nitrogen (N) content was determined by dry combustion (FLASH EA1112 CHN Analyzer, Thermo Fisher, Waltham, MA, USA) [25]. Milled leaflet samples were also digested by a microwave system with nitric acid and peroxide, then 16 elements were quantified by inductively coupled plasma optical emission spectrometry (ICP-OES; Spectro Genesis; SPECTRO Analytical Instruments, Kleve, Germany). These were the macronutrients K, phosphorus (P), calcium (Ca), and magnesium (Mg); the micronutrients manganese (Mn), iron (Fe), zinc (Zn), boron (B), copper (Cu), and nickel (Ni); and the metals/metalloids selenium (Se), lead (Pb), arsenic (As), cadmium (Cd), cobalt (Co), and chromium (Cr).
Green and senesced leaf samples were further analyzed to determine cellulose concentration according to AOAC International [26]. Moreover, leaf tissue lignin concentration was determined according to the acetyl-bromide method [27].
The stoichiometric relationships between consequential nutrient pairs were calculated. For green leaf tissue, the quotients N:P, N:K, and K:P were calculated. For green and senesced leaves, the quotients C:N, lignin:N, and cellulose:N were calculated.
The chemical characteristics of this karst soil series are well-documented [28], but individual trees of Guam’s native species may modify the localized edaphic traits via plant-soil feedback [29,30]. In order to characterize the soil traits directly associated with the sampled trees, one 15 cm soil core was obtained beneath each sampled plant halfway between the main stem and the canopy dripline. For some species which preferentially colonized karst outcrops, an intact soil core was not achievable. For these few plants, the mineral soils within the karst pockets were collected. The study footprint was divided into four equal latitudinal zones, and all cores within each zone were combined and homogenized. This enabled four replications for the analysis and evaluation of the soil chemistry that directly influenced the sampled plants. Total C and N content was determined by dry combustion. Available P was determined by the Olsen method [31]. Other macro- and micro-nutrients were quantified following digestion with diethylenetriaminepentaacetic acid [32]. Analysis was performed using ICP-OES. The chemical traits of these soils are shown in Table A2.
The analysis of variance methods was similar for all concentrations for each of the 18 quantified elements for green and senesced tissue, the cellulose and lignin concentrations for senesced leaf tissue, and the stoichiometry quotients. For elements which were quantified in both green and senesced leaf tissue, the analysis was conducted separately for each leaf age. Levene’s test for homogeneity of variances was applied for each element. Green leaf C, K, Mg, and N; senesced leaf C, K, N, and P; and cellulose exhibited homogeneous variances. Therefore, the PROC GLM procedure in SAS (SAS Institute, Cary, NC, USA) was employed for analysis of variance. Green leaf As, B, Ca, Cd, Co, Cr, Cu, Fe, Mn, Ni, P, Pb, Se, and Zn; senesced leaf As, B, Ca, Cd, Co, Cr, Cu, Fe, Mg, Mn, Ni, Pb, Se, and Zn; lignin; and all calculated stoichiometry variables exhibited heterogeneous variances. Therefore, the PROC MIXED procedure in SAS was employed for each analysis of variance, which allowed a designation of unequal variance for each analysis. For variables which were significant, means separation was accomplished with the Tukey-Kramer post hoc test of each pairwise comparison.
Nutrient remobilization or accumulation during leaf aging and senescence was determined for each of the 18 elements by the formula ((green-senesced)/green) × 100. When this calculation is positive, the metric is defined as “resorption efficiency” for non-structural elements that are mobilized and returned to the stem tissue during leaf senescence [15,16]. When the calculation is negative, the metric defines the relative accumulation which occurs for individual elements from the age of full leaf expansion until leaf senescence. This metric has been called “null resorption” [33]; here, I introduce use of the term “accretion efficiency” for this metric. A statistical test of the differences among the species was difficult due to the heterogeneous variances and different direction of resorption versus accretion. Therefore, the data are presented as means ± standard error.
3. Results
3.1. Green Leaf Element Concentrations
The macronutrient concentrations of green leaves revealed considerable variation among the 25 taxa (Figure 1). The mean leaf N was 23.3 mg·g−1 and exhibited a 2.6-fold range. The taxa separated into eight overlapping groups. The leaf P was greatest for Artocarpus mariannensis Trécul and Ochrosia oppositifolia (Lam.) K. Schum., and there were five overlapping groups among the remaining 23 taxa. The mean leaf P was 1.38 mg·g−1. The mean leaf K was 10.9 mg·g−1, exhibiting a 3.3-fold range, and the means separated into seven overlapping groups. The mean leaf Ca was 15.8 mg·g−1, and the taxa separated into six overlapping groups. The mean leaf Mg was greatest for N. hirsutula and Tabernaemontana rotensis (Kaneh.) P.T. Li, and the overall mean was 4.6 mg·g−1. The relative ranges in Ca and Mg values were greater than those for other macronutrients, with a 4.5-fold difference among the taxa. The mean leaf C was 454.2 mg·g−1, and the leaf C was not different among the taxa.
The micronutrient concentrations of green leaves revealed more relative range in values among the taxa than the macronutrient concentrations did (Figure 2). The differences found were from a 8.2-fold range for Mn to a 120-fold range for Ni. The concentrations ranked in magnitude as Mn > Fe > B > Zn > Cu > Ni. Leaf B was greatest for Ficus prolixa G. Forst. and Meiogyne cylindrocarpa (Burck) Heusden, and there were six overlapping groups for the other 23 species. All other micronutrients exhibited considerable overlap among the values, with four significant groups for Zn to seven groups for Cu.
Non-essential metals and metalloids were present in green leaves with concentrations up to only 4 µg·g−1 for Se in Pisonia grandis R. Br. leaves (Figure 3). All six measured elements exhibited values below 0.5 µg·g−1 for many of the taxa. The concentrations ranked in magnitude as Se > Pb > As > Cr > Co > Cd. No species emerged as a universal metal accumulator for all six elements, with the ranking of species in the upper end of the range in concentration shifting among the species for each of the elements.
There were several outlier groups where one or two taxa were significantly different from the remainder of the taxa for As, B, Co, Cr, and P. This always occurred at the upper end of the range of concentrations, and never at the lower end of the range. Therefore, similarities in values of green leaf element concentrations among these Guam karst forest plants were greater for the plant species that exhibited values below the overall means.
3.2. Green Leaf Stoichiometry and Nutrient Limitations
The N:P mean for all 25 taxa was 18.2, and a 3.8-fold difference occurred among the taxa (Figure 4). Five of the taxa exhibited N:P that indicated co-limitation of N and P, 12 of the taxa exhibited N:P that indicated P limitation, and eight of the taxa exhibited N:P that indicated N limitation. The N:K mean for all 25 taxa was 2.2, which was slightly above the global N:K value that signifies co-limitation of N and K. Fourteen of these Guam forest species had concentrations which indicated N limitation relative to K, and 11 of the species were K-limited relative to N. The K:P mean for all 25 taxa was 8.4, which greatly exceeded the global K:P value that signifies co-limitation. The relative range for K:P exceeded that for the other two quotients, with a 4.1-fold difference among the data.
These data collectively indicate that P limitation is profound in the majority of Guam’s karst forest plant species. For example, all of the taxa were P-limited relative to K, and most of the taxa were limited or co-limited by P relative to N. Some of the species exhibited overt single element limitations. For example, N. hirsutula was near the upper end of the range for N:P and K:P, but was near the lower end of the range for N:K. These relationships illuminate acute P limitation and secondary K limitation for this abundant fern. In contrast, E. joga was near the upper end of the N:K range and near the lower end of the K:P range. These relationships illuminate acute K limitation for this large canopy tree. Aglaia mariannensis, Eugenia bryanii Kaneh., and Eugenia reinwardtiana (Blume) A.Cunn. ex DC. emerged as severely N-limited plants, ranking at or near the lowest quotient for N:P and N:K. Pisonia grandis emerged as acutely P-limited compared to N, and acutely K-limited compared to N, and based on the K:P quotient, this large tree was more limited by P than by K.
3.3. Leaf Stoichiometry Predicts Litter Quality
The range of green leaf lignin concentration ranged from about 100 to about 300 mg·g−1 (Figure 5). The means separated into four overlapping groups. Cellulose concentrations were similar in range to those of lignin, and the means separated into five overlapping groups. The C:N of green leaves exhibited a three-fold range and the means separated into five overlapping groups. The lignin:N values of green leaves exhibited a 8.8-fold range, and the lignin:N value of Heritiera longipetiolata Kaneh. green leaves greatly exceeded that of the other species. The cellulose:N values exhibited a 5.7-fold difference among the species, and the means separated into six overlapping groups.
3.4. Senesced Leaf Element Concentrations
The macronutrient concentrations for senesced leaves were much lower than for green leaves and revealed considerable variation among the 25 taxa (Figure 6). Mean leaf N was 13.0 mg·g−1 and exhibited a 3.3-fold range. The taxa separated into seven overlapping groups. The mean leaf P was 0.6 mg·g−1, with a substantial range in the data, exhibiting a 7.9-fold difference among the taxa. Leaf P was greatest for A. mariannensis. Mean leaf K was 3.7 mg·g−1, exhibited an 8.3-fold range, and the means separated into four overlapping groups. Leaf Ca exhibited a mean of 30.9 mg·g−1 and there was a 4.0-fold difference among the taxa. Leaf Mg mean was 4.4 mg·g−1. The relative range in Mg values was 4.5-fold among the taxa. Senesced leaf C mean was 446.8 mg·g−1 and the taxa separated into two large overlapping groups.
The differences in micronutrient concentrations of senesced leaves did not align with those of green leaves, with some elements revealing resorption efficiency and others revealing accretion efficiency (Figure 7). The differences observed were from an 8.0-fold range for Mn to a 122-fold range for Ni. The senesced leaf concentrations ranked in magnitude as Fe > Mn > B > Zn > Cu > Ni, with Fe replacing Mn as the micronutrient present at greatest concentration when compared to green leaves. Within the data for each element, the general rankings among the taxa were similar for green and senesced leaves.
Non-essential metals and metalloids were present in senesced leaves with concentrations up to 10 µg·g−1 for Se in Intsia bijuga (Colebr.) Kuntze leaves (Figure 8). All six measured elements exhibited values below 0.5 µg·g−1 for some of the taxa. The concentrations ranked in magnitude as Se > Pb > As > Cr > Cd > Co, with Co replacing Cd as the least abundant metal/metalloid when compared with green leaves. The relative order of senesced leaf metal and metalloid concentration changed among the taxa when compared with green leaves. The senesced leaf metals and metalloids tended to exhibit one to three taxa with much greater concentrations than the remainder of taxa, then more similar concentrations for the remaining taxa.
3.5. Senesced Leaf Stoichiometry and Litter Quality
The range in senesced leaf lignin concentration was similar to that of cellulose, with these two macromolecules ranging from about 100 to about 300 mg·g−1 (Figure 9). Lignin concentrations of senesced leaves of C. micronesica and H. longipetiolata were greater than those of the other 23 species, which separated into five overlapping groups. Cellulose concentrations of senesced leaves of H. longipetiolata, Pandanus dubius Spreng., and Pandanus tectorius Parkinson ex Du Roi were greater than those of the other 22 species, which separated into five overlapping groups. Elaeocarpus joga and S. nelsonii were the only two species which were positioned near the low end of the range of concentrations for both of these macromolecules. The C:N of senesced leaves ranged in value up to ≈70, and exhibited a three-fold range among the species. The lignin:N of senesced leaves exhibited values up to about 43, with a 8.6-fold difference among the species. The cellulose:N values ranged up to about 41, with a 6.8-fold difference among the species.
3.6. Resorption and Accretion
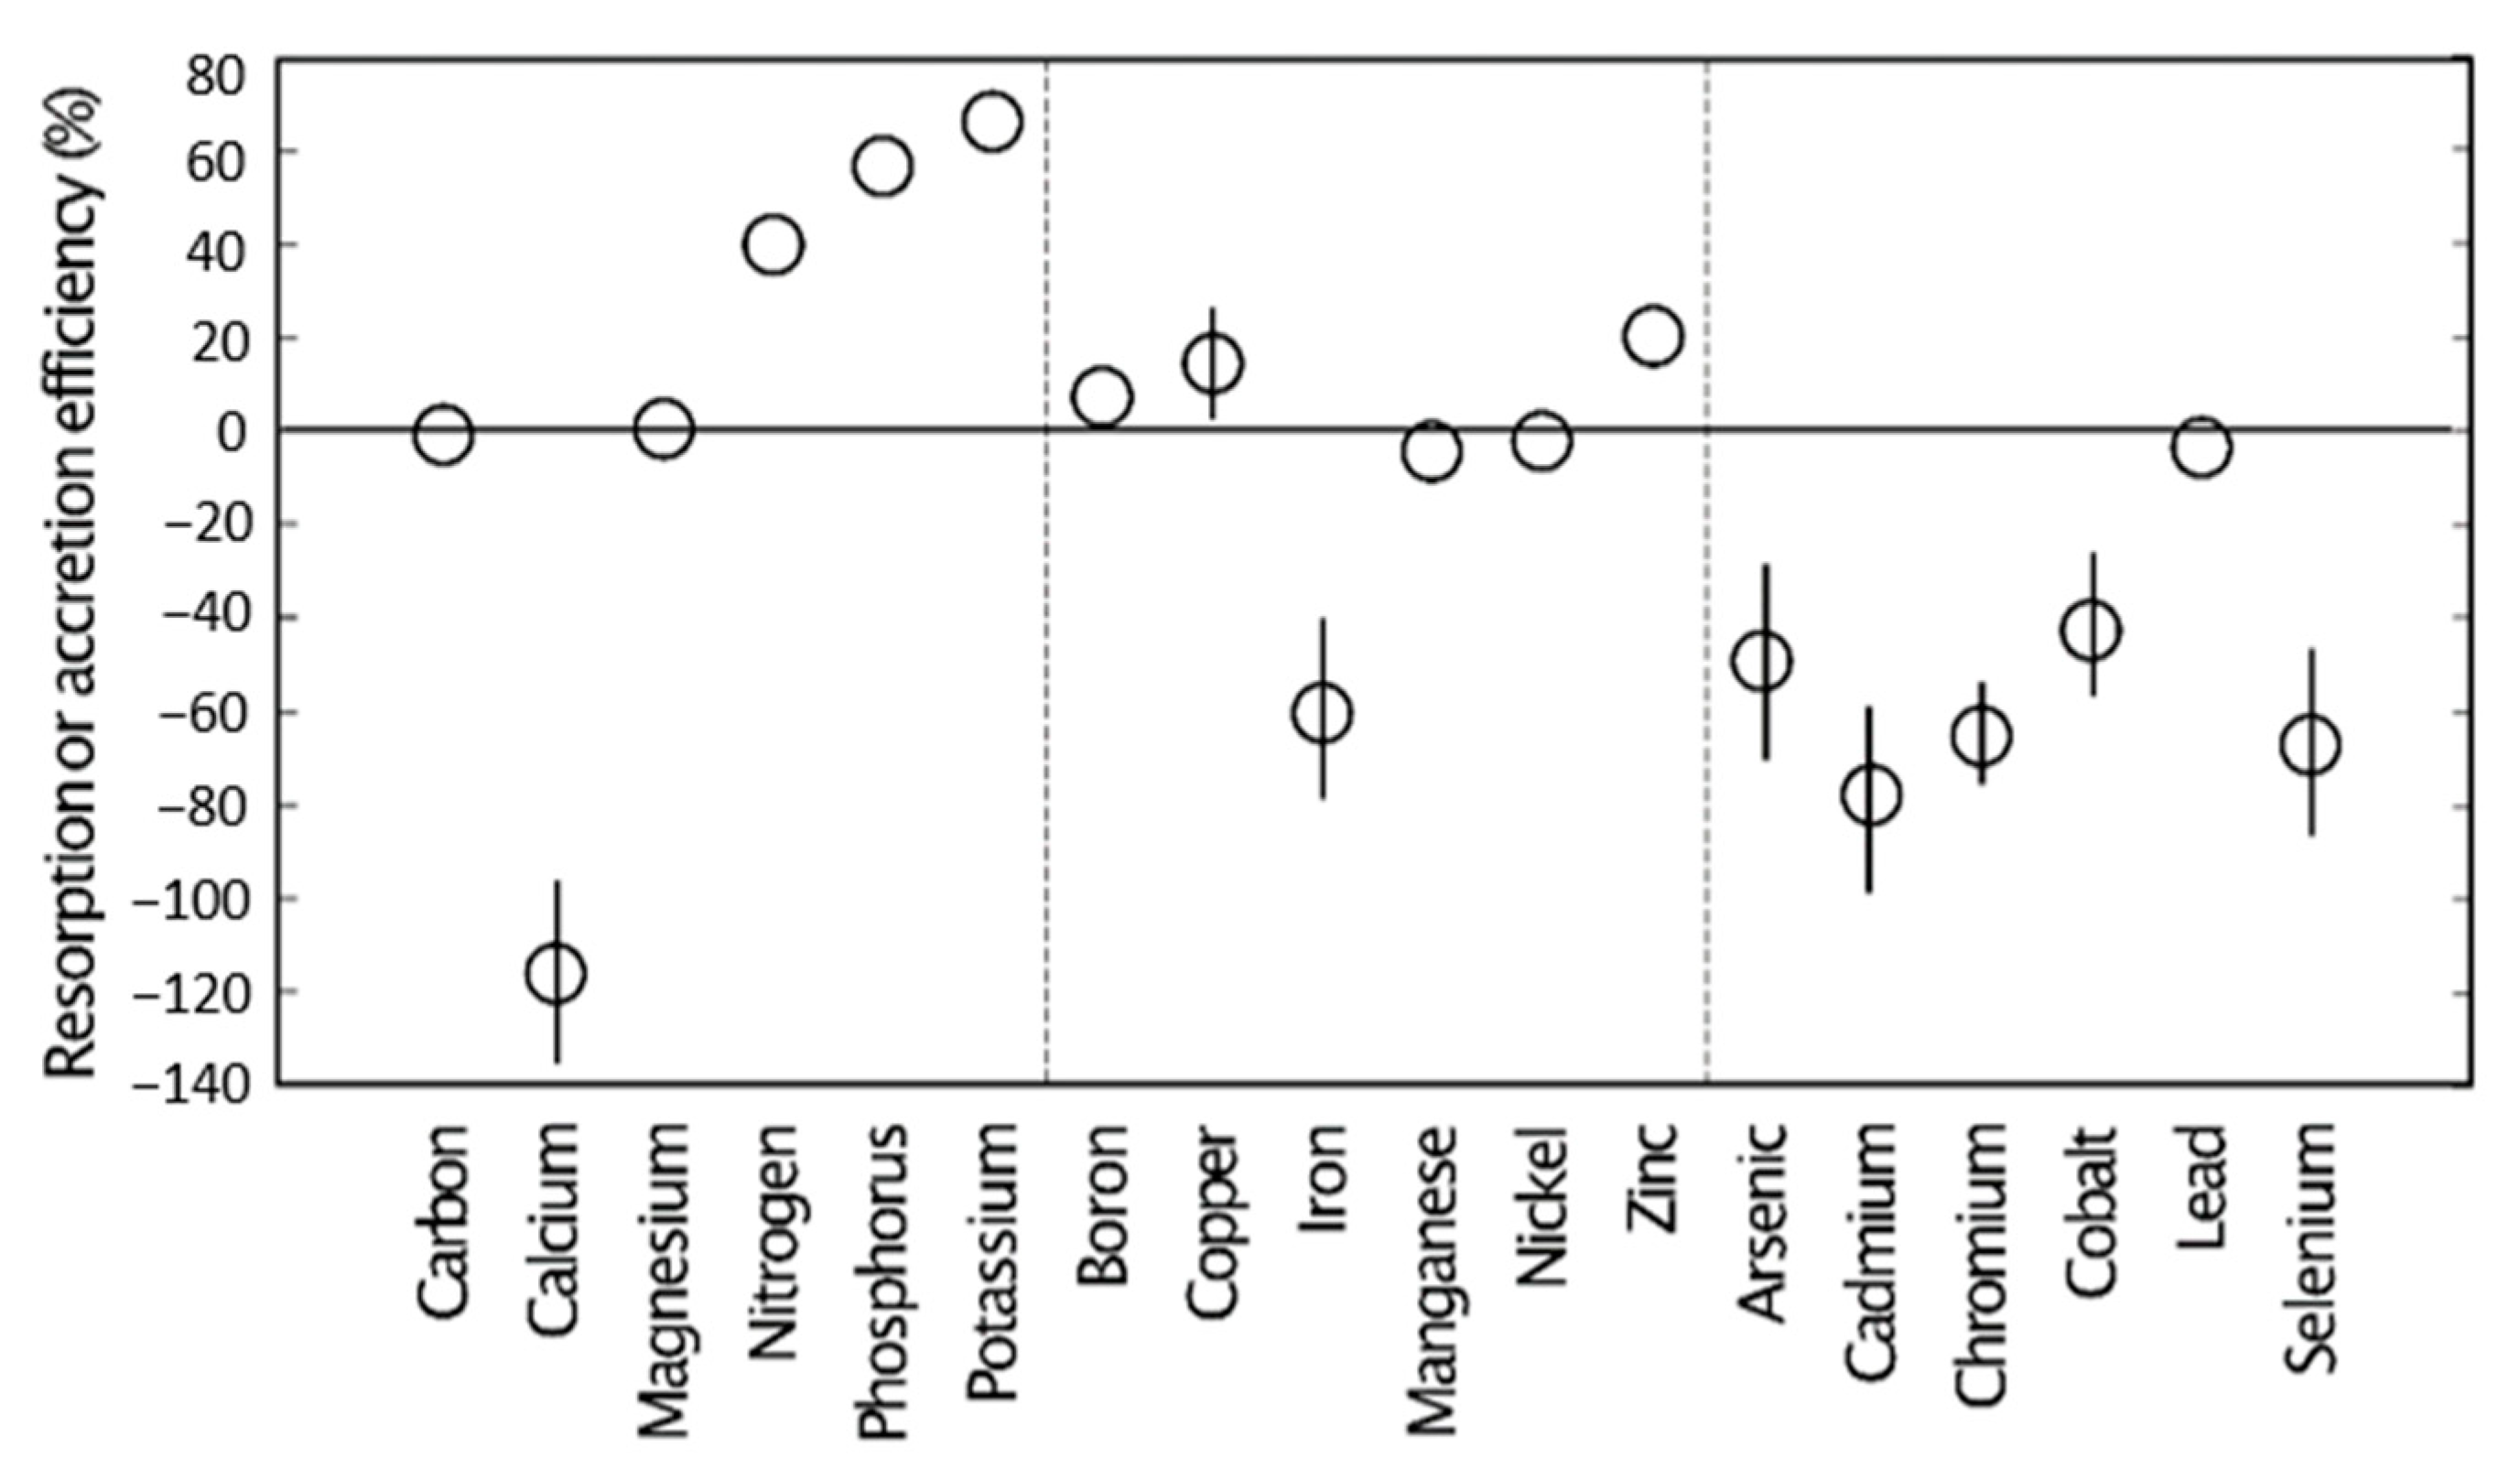
The macronutrients N, P, and K decreased considerably in concentration as leaves aged from the mature green stage to the senesced stage (see Table A3). Almost 70% of leaf K and 60% of leaf P were removed and translocated back to stems prior to leaf senescence (Figure 10). Leaf N resorption was also considerable, with a mean of about 40%. In contrast, leaf Ca concentration increased dramatically as leaves aged and senesced (see Table A4), with the Ca concentration more than doubling throughout the lifespan of leaves. The macronutrients C and Mg exhibited minimal changes in concentration throughout the lifespan of the leaves in this study.
The micronutrients Cu and Zn were also reabsorbed by stems prior to leaf senescence, but to a much lesser degree than for the macronutrients (Figure 10). The micronutrient Fe increased in concentration as leaves aged, as revealed by a 60% accretion efficiency. In contrast, B, Mn, and Ni concentrations exhibited minimal change throughout the lifespan of the leaves in this study.
Five of the quantified metals and metalloids increased in concentration as leaves aged, with accretion efficiency ranging in value from ≈40% for Co to ≈75% for Cd (Figure 10). In contrast, Pb exhibited minimal change in concentration throughout the lifespan of the leaves.
4. Discussion
Exploitation of 300 leaf samples collected over a two-day time span within a constrained habitat range representing 25 native species from 18 families determined the concentrations of 12 plant nutrients and six metals/metalloids for northern Guam karst forest habitat. Inclusion of several qualitative functional types was enabled by the selection of eudicot angiosperms, gymnosperms, monocot angiosperms, pteridophytes, and trees associated with N-fixing root symbionts. These published Guam data may now inform several global research agendas. First, compilations of large datasets to understand leaf traits that represent global canons [34,35,36,37] have not included data from Micronesian islands. Co-occurrence of at least four plant species in the same habitat is desired for the addition of new data to the global dataset [35], so these Guam data are available to add a Micronesian island to this global agenda. Second, karst habitats provide unique features that plants must cope with to thrive. In addition to the physical outcrops which limit the amounts of mineral soil available for root exploration, the soil reaction and calcium carbonate reduce phyto-availability of the plant nutrients Cu, Fe, Mn, P, and Zn [38,39]. More dedicated research into karst plants such as the taxa discussed herein may provide globally relevant answers to plant adaptation [40]. Third, our future ability to understand how native biodiversity responds to human-induced global change factors [41,42,43,44] will require benchmarks. For example, global warming may lead to taxon-specific changes in leaf nutrient concentrations [45]. The Guam leaf traits reported herein may provide that benchmark for future studies as Guam and other Micronesian islands respond to the influence of global change factors.
The portion of the leaf ionome comprising essential nutrients is the functional ionome [39]. Comparisons of these Guam leaf traits with the global traits [34,36,37,46,47,48] may enable a greater understanding of the native plant communities. The ranges of mass-based green leaf elemental concentrations were within published global datasets, but the means deviated for some of the elements. For example, the mean Mn and Cu concentrations in Guam’s green leaves were less than the global means. In contrast, the mean N and Ca concentrations in Guam’s green leaves exceeded the global means. The greater Ca in Guam’s karst forest green leaves may be explained by the excessive pH and calcium carbonate in the soils [37], and more research is needed for Guam habitats from volcanic soils. Although Ca has not been studied as extensively as N and P, its direct influence on nutrient cycling, C sequestration, and pedogenesis is recognized [47,49].
Tian et al. [48] reported N and P means for Oceania that were less than half of those reported herein for Guam. However, their data representing Oceania were restricted to Australia and New Zealand. Guam is located in Oceania, and these findings indicate that the inclusion of more insular forest habitats in the data used to represent Oceania in global leaf ionome comparisons is warranted.
Eudicot angiosperm species represented the largest plant group in this study. There were two pteridophyte species, and these ferns exhibited greater Cu, K, Mg, Ni, and Zn concentrations than the remainder of the species, and less Cr, lignin, and Mn than the remainder of the species. There were two monocot species, and these Pandanus trees exhibited greater cellulose, Fe, and Mn than the remainder of the species, and less B, Mg, and P than the remainder of the species. There were three species associated with N-fixing root symbionts. These three tree species exhibited green leaf N that was 23% greater and senesced leaf N that was 48% greater than the remainder of the species. The differences in relative N concentration, as influenced by leaf age, were a result of a N resorption efficiency of only 32% for the trees with N-fixing endosymbionts, as compared to a 44% resorption efficiency for the remainder of the species.
These results illuminate the importance of phylogenetic and functional group diversity, and the profound influence that this diversity has on nutrient cycling in this Guam forest. Indeed, tree species characteristics and litter mixtures exert many direct and indirect controls over ecosystem properties, such as the heterotrophic soil microbial community [50,51].
4.1. Stoichiometry
The mean of the 25 taxa in this northern Guam karst forest exhibited a green leaf C:N:P relationship of 329:17:1. The reported mean of widespread forest foliage is 469:13:1 [52], and the reported global mean of all terrestrial plants is 375:13:1 [53]. These relationships indicate that less C may be sequestered in Guam’s arboreal layer in relation to N and P than in the global forest mean.
Guam’s N:P mean of 18.2 was greater than the global N:P mean of ≈16 [35,37]. Large-scale comparisons indicate that a N:P of about 10 is optimal for plant growth—a N:P above ≈16 signifies P limitation, and a N:P below ≈14 signifies N limitation [4,11,12,13,14]. Although the Guam population mean for N:P indicated collective P limitation, the N:P for eight of the species indicated N limitation. A leaf N:K below 2.1 signifies N limitation, and a N:K above 2.1 signifies K limitation [13]. The Guam population mean for N:K was remarkably close to 2.1, indicating co-limitation of N and K at the population level. The majority of the individual species exhibited N:K that signified N limitation. The two Eugenia species were positioned at the extreme end of the spectrum, indicating N limitation based on N:P and N:K. A leaf K:P above 3.4 signifies P limitation, and a K:P below 3.4 signifies K limitation [13]. The Guam population mean for K:P was 8.4, indicating extreme population-level P limitation in relation to K availability. Collectively, these stoichiometry relations indicate Guam’s karst forest is most limited by P and secondarily limited by N, although several taxa exhibited co-limitation by K. Based on the K, N:K, and K:P relations, E. joga appears to be the species that is most limited by K.
Senesced leaf C, lignin, cellulose, and N stoichiometry are important for predicting litter decomposition dynamics [4,54,55,56] and the influences on rhizodeposition and microbial activity [57]. The two Pandanus species and H. longipetiolata consistently appeared on the left, signifying recalcitrant litter, and S. nelsonii consistently appeared on the right, signifying labile litter. Litter incubation studies will be required to confirm decomposition dynamics among the species and the influence of litter identity mixing.
Broad interpretations of nutrient limitations based on N:P may lead to interpretation errors [58,59]. However, my comparisons among individual taxa add to important interpretations of functional diversity in Guam’s forests. Moreover, the comprehensive assessment of all N:P:K interactions point to P as being the most limiting nutrient in northern Guam, and this is the first report to convey these findings.
4.2. Threatened Species Traits
Five of the taxa in this study are listed on the United States Endangered Species Act [60,61]. Policy-makers and conservation practitioners require evidence-informed answers to critical questions in order to adequately conserve these plants. The paucity of peer-reviewed publications limits the accuracy of most conservation and restoration agendas throughout Micronesia. For example, only one of these species is supported by a federal recovery plan, and this plan identifies the lack of research as a constraint to species recovery [62]. These are the first in situ biology data published for E. bryanii, H. longipetiolata, and T. rotensis. Although the results of some in situ studies have been published for S. nelsonii [30,63,64,65], the data herein are the first published data on leaf ionome relations. Cycas micronesica has been the subject of numerous publications containing in situ and ex situ data on leaf nutrient relations [19,20]. However, the inclusion of C. micronesica in this dataset represents the first time that leaf nutrient relations have been determined within the same space and time with numerous other sympatric taxa.
Plant species diversity and the variation in the functional traits that accompany this diversity are critical for sustaining ecosystem services such as carbon storage, nutrient cycling, and spatial heterogeneity of plant and microbe biodiversity [65,66,67,68]. These issues illuminate the damage to ecosystem function that may accompany localized extirpations of a threatened plant species. Indeed, when an insular population of a tree species is endangered, the concept of functional redundancy becomes important in the prediction of what may happen if local extirpations occur. Functional redundancy occurs when two more taxa contribute similar ecosystem services, such that loss of one of the organisms does not lead to functional loss [69,70,71,72]. The coexistence of functionally similar taxa has been called the portfolio effect [73]. Within this context, a focus on species which perform unique functions should become an integral component of conservation and restoration efforts to ensure resilience in the face of a changing world [74]. In the context of the data reported herein, the species that exhibit means that are mid-range in Figure 1, Figure 2, Figure 3, Figure 4, Figure 5, Figure 6, Figure 7, Figure 8 and Figure 9 do not exhibit particularly unique traits, and loss of one of these organisms would be theoretically buffered against the loss of the biogeochemistry functions they provide. In contrast, loss of one of the species with means that are the least or greatest in Figure 1, Figure 2, Figure 3, Figure 4, Figure 5, Figure 6, Figure 7, Figure 8 and Figure 9 may risk more damage to the ecosystem services of a habitat.
For example, two of these species emerge as outliers in the ranking of species for several of the influential litter quality traits. The Malvaceae tree H. longipetiolata was positioned hear the minimum end of the spectrum for senesced leaf N and near the maximum end of the spectrum for senesced leaf lignin, cellulose, C:N, lignin:N, and cellulose:N. In contrast, the Fabaceae tree S. nelsonii was positioned near the maximum end of the spectrum for senesced leaf N and near the minimum end of the spectrum for senesced leaf lignin, cellulose, C:N, lignin:N, and cellulose:N. The unique contributions of these two tree species to biogeochemical cycling dynamics in northern Guam appear to be profound, indicating that the extirpation of these taxa from the palette of Guam’s trees will directly damage the biodiversity of the detritus and soil food web due to a habitat-level constraint of litter quality diversity of the remaining litterfall.
Two of these threatened tree species associate with N-fixing root endosymbionts, revealing their importance in contributing N into the biosphere and pedosphere. The historical abundance of the legume tree S. nelsonii is not known, because pre-threat data on abundance were not recorded. The in situ Guam population has been reduced to a single mature tree [75]. The gymnosperm C. micronesica was the most abundant tree on Guam in 2002 [76], immediately prior to the 2003 invasion of the armored scale A. yasumatsui [77]. In situ mortality following infestations of this cycad-specific scale began in 2005, and as of 2020, the mortality had reached 96% [78]. The addition of atmospheric N to terrestrial systems is a crucial ecosystem service provided by these trees, and the ongoing declines in plant abundance carry a concomitant decline in the volume of N additions. Other risks associated with loss of C. micronesica have been discussed previously [79].
4.3. Leaf Aging and Senenence Dynamics
Leaf senescence is a highly choreographed process whereby some non-structural components are disassembled, mobilized, and absorbed by phloem tissue in subtending stems, thereby making them available for newly developing vegetative and reproductive organs [80,81]. Leaf aging and senescence dynamics in this northern Guam karst forest caused the species differences in leaf element concentrations to become less different with age. This assertion is validated by the number of groups of that were significantly different when comparing the green leaf data with the senesced leaf data. The green leaf element concentrations (Figure 1, Figure 2 and Figure 3) separated into a mean of 6.1 different groups, but the senesced leaf element concentrations (Figure 6, Figure 7 and Figure 8) separated into a mean of 4.3 different groups. The amplitude of absolute leaf nutrient concentration differences among the Guam forest species was influenced by resorption efficiency dynamics. For elements that were efficiently absorbed during leaf senescence (see Table A3), the range in differences among the species was greatly reduced in senesced leaves. For elements that exhibited accretion during leaf aging and senescence (see Table A4), the range in differences among the species was greatly increased in senesced leaves.
Global N resorption means have been compiled for numerous macronutrients and micronutrients [15,16,17,18,82,83]. The Guam resorption efficiency means reported herein were lower than global means for C, N, Ca, Mg, Cu, and B. Resorption efficiencies for K, P, and Zn in this study were similar or within the range of global means. Accretion efficiency for Fe in Guam’s karst forests was more than double that for the global mean. These relationships collectively indicate that the species representing Guam’s karst forests appear to be less efficient at nutrient recycling by way of resorption prior to leaf senescence than the average plant species represented in the global data.
The macromolecule lignin exhibited minimal changes in concentration during leaf aging. The macromolecule cellulose increased slightly with leaf age for the species at the high end of the senesced concentration range but did not change with leaf age for the species at the low end of the senesced concentration range. These patterns have been reported for other species [84]. Carbon investments into leaf cellulose and lignin represent investments into leaf toughness, which contributes directly to leaf lifespan [85].
4.4. Tropical Cyclones and Nutrient Cycling
Guam is positioned within the most active tropical cyclone zone worldwide [86]. The influence of these stochastic large-scale abiotic stressors is so strong that Guam’s forests have been called “typhoon forests” [87].
The unique opportunity provided by the 15 May 2015 passage of Typhoon Dolphin provided an empirical look at the influence of tropical cyclone defoliation on litter quality in Guam’s northern karst forests. For example, senesced leaves which exemplify natural litterfall exhibited a mean N concentration of 13 mg·g−1, with a maximum of about 20 mg·g−1 (Figure 6). In contrast, green leaves exhibited a mean N concentration of 23 mg·g−1, with a maximum of about 35 mg·g−1 (Figure 1). These data indicate a 57% increase in the influence of N on litter quality as a result of a tropical cyclone. By comparing the stoichiometry traits for green leaves (Figure 5) with senesced leaves (Figure 9), similar conclusions can be drawn. The mean C:N was 38 for senesced leaves and only 21 for green leaves, the mean lignin:N was 15 for senesced leaves and only 8 for green leaves, and the mean cellulose:N was 16 for senesced leaves and only 8 for green leaves. These litter quality traits predict an acceleration of litter decomposition and nutrient turnover as a direct result of tropical cyclone behavior in this northern Guam karst forest. Clearly, Guam’s frequent tropical cyclones not only influence physiognomy [87], they also profoundly influence the spatiotemporal dynamics of the island’s biogeochemistry.
The primary drivers of increased litter quality following tropical cyclone defoliation in Guam’s forests appeared to be the macronutrient concentrations of the litter, not the C or the C-based macromolecules. Indeed, the differences in Ca, N, P, and K between green and senesced leaves were substantial, but the differences in C, lignin, and cellulose were minimal.
4.5. Future Directions
The findings reported herein begin to apply the leaf economics spectrum ethos to Guam’s forests, but non-nutrient leaf traits have not been reported for Guam’s forest species. In order to fully integrate Guam’s forest species into the global leaf economics spectrum research agenda, addition of the influence of species on maximum net photosynthesis, leaf longevity, and specific leaf area [34,35] may be some of the more important leaf traits to add to the Guam ecology research agenda.
The differences in leaf chemistry for C. micronesica, I. bijuga, and S. nelsonii leaf litter predicted the influence of species on the release of C and N from incubated litter [88]. The litter quality traits reported herein are useful for predicting the rates of nutrient turnover, but litter decomposition studies replicated in situ will be required to move beyond estimates and obtain the required empirical evidence.
Infestations of three insect herbivores elicited changes in leaf litter quality for C. micronesica [89]. Leaves exhibiting leaf herbivory were avoided during the sampling procedures in the present study. The influence of herbivory on leaf ionomics of the remaining species in this study are not known.
We are beginning to learn more about the various factors that influence how plants control leaf nutrient relations [90]. However, the manner in which organismal and habitat characteristics affect the leaf ionome, stoichiometry, and resorption remains unanswered for Guam’s forests. Long-term nutrient manipulation studies provide valuable information for interpreting nutrient limitations and cycling in forest productivity. These types of studies require commitments that are decadal, not annual. Guam ecology research suffers from a history of being stifled by the mindset of short-term funding cycles, and the net result is that few long-term studies have been enacted [91]. Applying leaf ionome generalizations developed from non-tropical studies does not appear to satisfactorily explain tropical forest behaviors [92]. The initiation of long-term N and P nutrient addition studies within Micronesian forest plots would greatly expand our understanding of nutrient cycling and limitations on productivity in the region.
Funding
This research was funded in part by the United States Forest Service grant numbers 13-DG-11052021-210 and 17-DG-11052021-217 and United States Department of Agriculture NIFA grant number GUA0801.
Institutional Review Board Statement
Not applicable.
Data Availability Statement
The data presented in this study are available in the Appendix A.
Acknowledgments
I thank Gil Cruz for aid in field methods, Nirmala Dongol for aid in tissue collation and preparation, and Dallas Johnson for statistical analyses.
Conflicts of Interest
The funder had no role in the design of the study; in the collection, analyses, or interpretation of data; in the writing of the manuscript, or in the decision to publish the results.
Appendix A

Table A1.
List of plant species selected to represent Guam’s northern karst forest.
| Species | Family | Notes |
|---|---|---|
| Artocarpus mariannensis Trécul | Moraceae | Eudicot tree |
| Asplenium polyodon G. Forst. | Aspleniaceae | Fern |
| Bikkia tetrandra (L.f.) A. Rich. | Rubiaceae | Eudicot shrub |
| Cordia subcordata Lam. | Boraginaceae | Eudicot tree |
| Cycas micronesica K.D. Hill 1,2 | Cycadaceae | Gymnosperm tree |
| Elaeocarpus joga Merr. | Elaeocarpaceae | Eudicot tree |
| Eugenia bryanii Kaneh. 2 | Myrtaceae | Eudicot shrub |
| Eugenia reinwardtiana (Blume) A.Cunn. ex DC. | Myrtaceae | Eudicot tree |
| Ficus prolixa G. Forst. | Moraceae | Eudicot tree |
| Heritiera longipetiolata Kaneh. 2 | Malvaceae | Eudicot tree |
| Hibiscus tiliaceus L. | Malvaceae | Eudicot tree |
| Intsia bijuga (Colebr.) Kuntze 1 | Fabaceae | Eudicot tree, Caesalpinoideae |
| Macaranga thompsonii Merr. | Euphorbiaceae | Eudicot tree |
| Meiogyne cylindrocarpa (Burck) Heusden | Annonaceae | Eudicot tree |
| Morinda citrifolia L. | Rubiaceae | Eudicot tree |
| Nephrolepis hirsutula (G. Forst.) C. Presl | Nephrolepidaceae | Fern |
| Ochrosia mariannensis A.DC. | Apocynaceae | Eudicot tree |
| Ochrosia oppositifolia (Lam.) K. Schum. | Apocynaceae | Eudicot tree |
| Pandanus dubius Spreng. | Pandanaceae | Monocot tree |
| Pandanus tectorius Parkinson ex Du Roi | Pandanaceae | Monocot tree |
| Pisonia grandis R. Br. | Nyctaginaceae | Eudicot tree |
| Premna serratifolia L. | Lamiaceae | Eudicot tree |
| Scaevola taccada (Gaertn.) Roxb. | Goodeniaceae | Eudicot shrub |
| Serianthes nelsonii Merr. 1,2 | Fabaceae | Eudicot tree, Mimosoidae |
| Tabernaemontana rotensis (Kaneh.) P.T. Li 2 | Apocynaceae | Eudicot tree |
1 Associated with nitrogen-fixing root symbionts. 2 Listed under the United States Endangered Species Act.
Table A2.
The concentration of plant nutrients in mineral soils from Guam’s northeastern coastal karst forests. Mean ± standard error, n = 4.
Table A2.
The concentration of plant nutrients in mineral soils from Guam’s northeastern coastal karst forests. Mean ± standard error, n = 4.
| Variable | Soil Trait |
|---|---|
| pH | 7.98 ± 0.14 |
| Calcium | 7.96 ± 0.19 mg·g−1 |
| Carbon | 91.42 ± 5.65 mg·g−1 |
| Copper | 6.29 ± 0.64 µg·g−1 |
| Iron | 32.77 ± 2.13 µg·g−1 |
| Magnesium | 884.25 ± 32.38 µg·g−1 |
| Manganese | 63.12 ± 5.15 µg·g−1 |
| Nitrogen | 8.03 ± 0.68 mg·g−1 |
| Phosphorus | 82.25 ± 7.36 µg·g−1 |
| Potassium | 596.63 ± 19.55 µg·g−1 |
| Zinc | 16.37 ± 3.24 µg·g−1 |
Table A3.
Resorption efficiency (%) of macro- and micro-nutrients in leaves of 25 plant species from Guam’s northern karst forests. n = 6.
Table A3.
Resorption efficiency (%) of macro- and micro-nutrients in leaves of 25 plant species from Guam’s northern karst forests. n = 6.
| Species | Nitrogen | Phosphorus | Potassium | Carbon 1 | Magnesium | Zinc | Copper | Boron |
|---|---|---|---|---|---|---|---|---|
| Aglaia mariannensis | 48 | 45 | 52 | 1 | 0.4 | 5 | 44 | 6 |
| Asplenium polyodon | 53 | 61 | 59 | 13 | 0.8 | 4 | 11 | 20 |
| Bikkia tetrandra | 59 | 58 | 78 | 7 | 2.3 | 22 | 1 | 12 |
| Cordia subcordata | 79 | 76 | 85 | 12 | 0.3 | 7 | 3 | 11 |
| Cycas micronesica | 24 | 53 | 73 | −6 | 0.4 | 12 | 1 | 3 |
| Elaeocarpus joga | 31 | 74 | 82 | 4 | 3.3 | 33 | 1 | 4 |
| Eugenia bryanii | 41 | 38 | 70 | 11 | 1.2 | 38 | 5 | 3 |
| Eugenia reinwardtiana | 38 | 42 | 66 | 2 | 0.7 | 45 | 13 | 3 |
| Ficus prolixa | 42 | 46 | 48 | 0 | 11.8 | 33 | 43 | 7 |
| Heritiera longipetiolata | 44 | 77 | 81 | −1 | 8.7 | 6 | 32 | 6 |
| Hibiscus tiliaceus | 37 | 62 | 56 | 1 | 4.2 | 15 | 1 | 15 |
| Intsia bijuga | 35 | 70 | 74 | 0 | 1.0 | 30 | 1 | 33 |
| Macaranga thompsonii | 54 | 47 | 81 | 0 | 2.7 | 32 | 51 | 10 |
| Meiogyne cylindrocarpa | 38 | 44 | 62 | 0 | 0.9 | 27 | 55 | 18 |
| Morinda citrifolia | 21 | 49 | 62 | 0 | 1.9 | 6 | 6 | 4 |
| Nephrolepis hirsutula | 50 | 70 | 65 | 8 | 0.7 | 10 | 10 | 11 |
| Ochrosia mariannensis | 41 | 49 | 61 | 0 | 4.7 | 33 | 36 | 6 |
| Ochrosia oppositifolia | 49 | 58 | 72 | 0 | 1.0 | 15 | 42 | 6 |
| Pandanus dubius | 36 | 63 | 59 | −12 | 7.8 | 6 | 1 | 4 |
| Pandanus tectorius | 23 | 57 | 74 | −10 | 0.8 | 10 | 8 | 5 |
| Pisonia grandis | 49 | 69 | 54 | 2 | 0.6 | 29 | 9 | 12 |
| Premna serratifolia | 37 | 73 | 64 | 0 | 14.7 | 17 | 9 | 14 |
| Scaevola taccada | 56 | 82 | 81 | 1 | 0.7 | 23 | 23 | 3 |
| Serianthes nelsonii | 37 | 55 | 67 | 5 | 1.6 | 64 | 12 | 11 |
| Tabernaemontana rotensis | 35 | 42 | 57 | 1 | 2.2 | 18 | 4 | 3 |
| PPI 2 | 73.2 | 53.7 | 43.5 | 99.7 | 97.8 | 93.3 | 99.7 | 92.5 |
1 Negative values are percent accretion. 2 Phenotypic plasticity index: ((greatest mean-least mean)/greatest mean) × 100.
Table A4.
Accretion efficiency (%) of nutrients and metals in leaves of 25 plant species from Guam’s northern karst forests. n = 6.
Table A4.
Accretion efficiency (%) of nutrients and metals in leaves of 25 plant species from Guam’s northern karst forests. n = 6.
| Species | Calcium | Iron | Manganese | Nickel | Lead | Arsenic | Cadmium | Chromium | Cobalt | Selenium |
|---|---|---|---|---|---|---|---|---|---|---|
| Aglaia mariannensis | 83 | 6 | 2.3 | 0.3 | 1.6 | 155 | 115 | 197 | 225 | 109 |
| Asplenium polyodon | 233 | 5 | 1.8 | 0.5 | 3.2 | 116 | 329 | 65 | 4 | 10 |
| Bikkia tetrandra | 147 | 102 | 1.6 | 0.9 | 1.3 | 12 | 22 | 162 | 9 | 49 |
| Cordia subcordata | 133 | 4 | 2.5 | 0.1 | 0.6 | 50 | 10 | 51 | 122 | 22 |
| Cycas micronesica | 195 | 151 | 1.7 | 0.3 | 0.9 | 156 | 250 | 103 | 92 | 95 |
| Elaeocarpus joga | 74 | 45 | 1.1 | 1.8 | 1.5 | 7 | 87 | 78 | 32 | 76 |
| Eugenia bryanii | 215 | 3 | 1.1 | 0.3 | 1.1 | 59 | 120 | 99 | 9 | 21 |
| Eugenia reinwardtiana | 88 | 126 | 0.9 | 0.1 | 0.9 | 55 | 86 | 107 | 4 | 40 |
| Ficus prolixa | 60 | 30 | 1.0 | 10.0 | 1.5 | 6 | 162 | 15 | 27 | 358 |
| Heritiera longipetiolata | 53 | 233 | 1.2 | 0.1 | 0.3 | 6 | 22 | 188 | 25 | 10 |
| Hibiscus tiliaceus | 76 | 117 | 1.6 | 0.3 | 1.3 | 87 | 107 | 121 | 171 | 28 |
| Intsia bijuga | 14 | 2 | 0.1 | 0.3 | 0.1 | 14 | 28 | 20 | 4 | 278 |
| Macaranga thompsonii | 95 | 4 | 1.0 | 5.0 | 1.7 | 2 | 10 | 2 | 4 | 11 |
| Meiogyne cylindrocarpa | 98 | 5 | 1.0 | 8.6 | 0.5 | 79 | 121 | 12 | 17 | 22 |
| Morinda citrifolia | 126 | 119 | 1.8 | 0.7 | 0.1 | 13 | 9 | 80 | 19 | 24 |
| Nephrolepis hirsutula | 334 | 2 | 0.5 | 0.5 | 0.9 | 3 | 8 | 11 | 10 | 15 |
| Ochrosia mariannensis | 150 | 5 | 1.5 | 0.7 | 0.5 | 130 | 10 | 4 | 11 | 39 |
| Ochrosia oppositifolia | 97 | 6 | 1.4 | 0.1 | 0.2 | 3 | 3 | 5 | 10 | 20 |
| Pandanus dubius | 116 | 194 | 2.1 | 3.8 | 0.1 | 119 | 35 | 60 | 28 | 94 |
| Pandanus tectorius | 101 | 217 | 1.3 | 3.1 | 0.3 | 55 | 22 | 116 | 15 | 136 |
| Pisonia grandis | 20 | 25 | 1.5 | 3.6 | 3.6 | 19 | 46 | 4 | 31 | 19 |
| Premna serratifolia | 4 | 43 | 1.7 | 7.5 | 1.1 | 10 | 250 | 22 | 94 | 16 |
| Scaevola taccada | 53 | 6 | 1.3 | 0.5 | 0.9 | 24 | 22 | 42 | 30 | 7 |
| Serianthes nelsonii | 216 | 27 | 0.6 | 6.0 | 0.3 | 13 | 38 | 6 | 6 | 121 |
| Tabernaemontana rotensis | 61 | 5 | 1.4 | 1.7 | 0.4 | 8 | 6 | 33 | 38 | 22 |
| PPI 1 | 98.8 | 99.3 | 95.7 | 99.5 | 97.8 | 98.5 | 99.2 | 99.7 | 98.3 | 98.2 |
1 Phenotypic plasticity index: ((greatest mean-least mean)/greatest mean) × 100.
References
- Lahner, B.; Gong, J.; Mahmoudian, M.; Smith, E.L.; Abid, K.B.; Rogers, E.E.; Guerinot, M.L.; Harper, J.F.; Ward, J.M.; McIntyre, L.; et al. Genomic scale profiling of nutrient and trace elements in Arabidopsis thaliana. Nat. Biotechnol. 2003, 21, 1215–1221. [Google Scholar] [CrossRef]
- Salt, E.D.; Baxter, I.; Lahner, B. Ionomics and the study of the plant ionome. Annu. Rev. Plant Biol. 2008, 59, 709–733. [Google Scholar] [CrossRef] [PubMed] [Green Version]
- White, P.J.; Brown, P.H. Plant nutrition for sustainable development and global health. Ann. Bot. 2010, 105, 1073–1080. [Google Scholar] [CrossRef] [Green Version]
- Aerts, R.; Chapin, F.S., III. The mineral nutrition of wild plants revisited: A reevaluation of processes and patterns. Adv. Ecol. Res. 2000, 30, 1–67. [Google Scholar]
- Souri, M.K.; Hatamian, M. Aminochelates in plant nutrition: A review. J. Plant Nutr. 2019, 42, 67–78. [Google Scholar] [CrossRef]
- Ingestad, T. New concepts on soil fertility and plant nutrition as illustrated by research on forest trees and stands. Geoderma 1987, 40, 237–252. [Google Scholar] [CrossRef]
- Walworth, J.L.; Sumner, M.E. The diagnosis and recommendation integrated system (DRIS). Adv. Soil Sci. 1987, 6, 149–188. [Google Scholar]
- Sterner, R.W.; Elser, J. Ecological Stoichiometry: The Biology of Elements from Molecules to the Biosphere; Princeton Univ. Press: Princeton, NJ, USA, 2002; p. 439. [Google Scholar]
- Körner, C. The grand challenges in functional plant ecology. Front. Plant Sci. 2011, 2, 1. [Google Scholar] [CrossRef] [Green Version]
- Sardans, J.; Janssens, I.A.; Ciais, P.; Obersteiner, M.; Peñuelas, J. Recent advances and future research in ecological stoichiometry. Perspect. Plant Ecol. Evol. Syst. 2021, 50, 125611. [Google Scholar] [CrossRef]
- Koerselman, W.; Meuleman, A.F.M. The vegetation N:P ratio: A new tool to detect the nature of nutrient limitation. J. Appl. Ecol. 1996, 33, 1441–1450. [Google Scholar] [CrossRef]
- Güsewell, S.; Koerselman, M. Variation in nitrogen and phosphorus concentrations of wetland plants. Perspect. Plant Ecol. 2002, 5, 37–61. [Google Scholar] [CrossRef]
- Olde Venterink, H.; Wassen, M.J.; Verkroost, A.W.M.; de Ruiter, P.C. Species richness-productivity patterns differ between N-, P- and K-limited wetlands. Ecology 2003, 84, 2191–2199. [Google Scholar] [CrossRef]
- Wang, M.; Moore, T.R. Carbon, nitrogen, phosphorus, and potassium stoichiometry in an ombrotrophic peatland reflects plant functional type. Ecosystems 2014, 17, 673–684. [Google Scholar] [CrossRef]
- Killingbeck, K.T. The terminological jungle revisited: Making a case for use of the term resorption. Oikos 1986, 46, 263–264. [Google Scholar] [CrossRef]
- Aerts, R. Nutrient resorption from senescing leaves of perennials: Are there general patterns? J. Ecol. 1996, 84, 597–608. [Google Scholar] [CrossRef]
- Killingbeck, K.T. Nutrients in senesced leaves: Key to search for potential resorption and resorption proficiency. Ecology 1996, 77, 1716–1727. [Google Scholar] [CrossRef]
- Freschet, G.T.; Cornelissen, J.H.C.; van Logtestijn, R.S.P.; Aerts, R. Substantial nutrient resorption from leaves, stems and roots in a subarctic flora: What is the link with other resource economics traits? New Phytol. 2010, 186, 879–889. [Google Scholar] [CrossRef]
- Deloso, B.E.; Krishnapillai, M.V.; Ferreras, U.F.; Lindström, A.J.; Calonje, M.; Marler, T.E. Chemical element concentrations of cycad leaves: Do we know enough? Horticulturae 2020, 6, 85. [Google Scholar] [CrossRef]
- Marler, T.E.; Lindström, A.J. Leaf nutrients of two Cycas L. species contrast among in situ and ex situ locations. J. Threat. Taxa 2020, 12, 16831–16839. [Google Scholar] [CrossRef]
- Marler, T.E.; Lawrence, J.H. Leaf and soil nutrient relations of Elaeocarpus joga Merr. in oceanic island calcareous soils. HortScience 2015, 50, 1644–1649. [Google Scholar] [CrossRef]
- Marler, T.E. Stem carbohydrates and adventitious root formation of Cycas micronesica following Aulacaspis yasumatsui infestation. HortScience 2018, 53, 1125–1128. [Google Scholar] [CrossRef] [Green Version]
- Marler, T.E.; Cruz, G.N. Source and sink relations mediate depletion of intrinsic cycad seed carbohydrates by Aulacaspis yasumatsui infestation. HortScience 2019, 54, 1712–1717. [Google Scholar] [CrossRef] [Green Version]
- Marler, T.E.; Cruz, G.N. Cycas micronesica stem carbohydrates decline following leaf and male cone growth events. Plants 2020, 9, 517. [Google Scholar] [CrossRef]
- Dumas, J.B.A. Procedes de L’analyse Organique. Ann. Chim. Phys. 1831, 47, 198–205. [Google Scholar]
- AOAC. Official Method 973. 18 fibre (acid detergent) and lignin in animal feed. In Official Methods of Analysis of AOAC International, 16th ed.; AOAC International: Arlington, VA, USA, 1997; pp. 28–29. [Google Scholar]
- Iiyama, K.; Wallis, A.F.A. Determination of lignin in herbaceous plants by an improved acetyl bromide procedure. J. Sci. Food Agric. 1990, 51, 145–161. [Google Scholar] [CrossRef]
- Young, F.J. Soil Survey of Territory of Guam; U.S. Dept. of Agric. Soil Conservation Service: Washington, DC, USA, 1988. [Google Scholar]
- Marler, T.E.; Krishnapillai, M.V. Cycas micronesica trees alter local soil traits. Forests 2018, 9, 565. [Google Scholar] [CrossRef] [Green Version]
- Marler, T.E. Late successional tree species in Guam create biogeochemical niches. Communic. Integr. Biol. 2019, 12, 86–90. [Google Scholar] [CrossRef] [Green Version]
- Olsen, S.R.; Cole, C.V.; Watanabe, F.S.; Dean, L.A. Estimation of Available Phosphorus in Soils by Extraction with Sodium Bicarbonate; U.S. Dept. of Agric.: Washington, DC, USA, 1954; Volume 939. [Google Scholar]
- Berghage, R.D.; Krauskopf, D.M.; Warncke, D.D.; Widders, I. Micronutrient testing of plant growth media extractant, identification and evaluation. Commun. Soil Sci. Plant Anal. 1987, 18, 1089–1109. [Google Scholar] [CrossRef]
- Bahamonde, H.A.; Fernández, V.; Gyenge, J.; Mattenet, F.; Peri, P.L. Essential nutrient and trace element foliar resorption of two co-existing Nothofagus species grown under different environmental conditions in Southern Patagonia. Front. Plant Sci. 2019, 10, 1542. [Google Scholar] [CrossRef] [Green Version]
- Wright, I.J.; Reich, P.B.; Westoby, M.; Ackerly, D.D.; Baruch, Z.; Bongers, F.; Cavender-Bares, J.; Chapin, T.; Cornelissen, J.H.; Diemer, M.; et al. The worldwide leaf economics spectrum. Nature 2004, 428, 821–827. [Google Scholar] [CrossRef]
- Wright, I.J.; Reich, P.B.; Cornelissen, J.H.; Falster, D.S.; Garnier, E.; Hikosaka, K.; Lamont, B.B.; Lee, W.; Oleksyn, J.; Osada, N.; et al. Assessing the generality of global leaf trait relationships. New Phytol. 2005, 166, 485–496. [Google Scholar] [CrossRef]
- Watanabe, T.; Broadley, M.R.; Jansen, S.; White, P.J.; Takada, J.; Satake, K.; Takamatsu, T.; Tuah, S.J.; Osaki, M. Evolutionary control of leaf element composition in plants. New Phytol. 2007, 174, 516–523. [Google Scholar] [CrossRef]
- Xing, K.; Niinemets, Ü.; Rengel, Z.; Onoda, Y.; Xia, J.; Chen, H.Y.H.; Zhao, M.; Han, W.; Li, H. Global patterns of leaf construction traits and their covariation along climate and soil environmental gradients. New Phytol. 2021, in press. [Google Scholar] [CrossRef] [PubMed]
- White, P.; George, T.; Dupuy, L.; Karley, A.; Valentine, T.; Wiesel, L.; Wishart, J. Root traits for infertile soils. Front. Plant Sci. 2013, 4, 193. [Google Scholar] [CrossRef] [PubMed] [Green Version]
- Neugebauer, K.; Broadley, M.R.; El-Serehy, H.A.; George, T.S.; McNicol, J.W.; Moraes, M.F.; White, P.J. Variation in the angiosperm ionome. Physiol. Plant. 2018, 163, 306–322. [Google Scholar] [CrossRef] [Green Version]
- Liu, C.; Huang, Y.; Wu, F.; Liu, W.; Ning, Y.; Huang, Z.; Tang, S.; Liang, Y. Plant adaptability in karst regions. J. Plant Res. 2021, 134, 889–906. [Google Scholar] [CrossRef]
- Güsewell, S. N:P ratios in terrestrial plants: Variation and functional significance. New Phytol. 2004, 164, 243–266. [Google Scholar] [CrossRef]
- Hooper, D.U.; Adair, E.C.; Cardinale, B.J.; Byrnes, J.E.; Hungate, B.A.; Matulich, K.L.; Gonzalez, A.; Duffy, J.E.; Gamfeldt, L.; O’Connor, M.I. A global synthesis reveals biodiversity loss as a major driver of ecosystem change. Nature 2012, 486, 105–108. [Google Scholar] [CrossRef] [PubMed]
- Sardans, J.; Rivas-Ubach, A.; Peñuelas, J. The C: N: P stoichiometry of organisms and ecosystems in a changing world: A review and perspectives. Perspect. Plant Ecol. Evol. Syst. 2012, 14, 33–47. [Google Scholar] [CrossRef]
- Sala, O.E.; Chapin, F.S.; Armesto, J.J.; Berlow, E.; Bloomfield, J.; Dirzo, R.; Huber-Sanwald, E.; Huenneke, L.F.; Jackson, R.B.; Kinzig, A.; et al. Global biodiversity scenarios for the year 2100. Science 2000, 287, 1770–1774. [Google Scholar] [CrossRef]
- Wu, T.; Qu, C.; Li, Y.; Li, X.; Zhou, G.; Liu, S.; Chu, G.; Meng, Z.; Lie, Z.; Liu, J. Warming effects on leaf nutrients and plant growth in tropical forests. Plant Ecol. 2019, 220, 663–674. [Google Scholar] [CrossRef]
- Reich, P.B.; Oleksyn, J. Global patterns of plant leaf N and P in relation to temperature and latitude. Proc. Natl. Acad. Sci. USA 2004, 101, 11001–11006. [Google Scholar] [CrossRef] [Green Version]
- Reich, P.B.; Oleksyn, J.; Modrzynski, J.; Mrozinski, P.; Hobbie, S.E.; Eissenstat, D.M.; Chorover, J.; Chadwick, O.A.; Hale, C.M.; Tjoelker, M.G. Linking litter calcium, earthworms and soil properties: A common garden test with 14 tree species. Ecol. Lett. 2005, 8, 811–818. [Google Scholar] [CrossRef]
- Tian, D.; Yan, Z.; Niklas, K.J.; Han, W.; Kattge, J.; Reich, P.B.; Luo, Y.; Chen, Y.; Tang, Z.; Hu, H.; et al. Global leaf nitrogen and phosphorus stoichiometry and their scaling exponent. Natl. Sci. Rev. 2018, 5, 728–739. [Google Scholar] [CrossRef] [Green Version]
- Lovett, G.M.; Arthur, M.A.; Crowley, K.F. Effects of calcium on the rate and extent of litter decomposition in a northern hardwood forest. Ecosystems 2016, 19, 87–97. [Google Scholar] [CrossRef]
- Joly, F.-X.; Milcu, A.; Scherer-Lorenzen, M.; Jean, L.-K.; Bussotti, F.; Dawud, S.M.; Müller, S.; Pollastrini, M.; Raulund-Rasmussen, K.; Vesterdal, L.; et al. Tree species diversity affects decomposition through modified micro-environmental conditions across European forests. New Phytol. 2017, 214, 1281–1293. [Google Scholar] [CrossRef] [Green Version]
- Gillespie, L.M.; Hättenschwiler, S.; Milcu, A.; Wambsganss, J.; Shihan, A.; Fromin, N. Tree species mixing affects soil microbial functioning indirectly via root and litter traits and soil parameters in European forests. Funct. Ecol. 2021, in press. [Google Scholar] [CrossRef]
- McGroddy, M.E.; Daufresne, T.; Hedin, L.O. Scaling of C:N:P stoichiometry in forests worldwide: Implications of terrestrial Redfield-type ratios. Ecology 2004, 85, 2390–2401. [Google Scholar] [CrossRef]
- Elser, J.J.; Fagan, W.F.; Denno, R.F.; Dobberfuhl, D.R.; Folarin, A.; Huberty, A.; Interlandi, S.; Kilham, S.S.; McCauley, E.; Schulz, K.L.; et al. Nutritional constraints in terrestrial and freshwater food webs. Nature 2000, 408, 578–580. [Google Scholar] [CrossRef] [PubMed]
- Enríquez, S.C.M.D.; Duarte, C.M.; Sand-Jensen, K. Patterns in decomposition rates among photosynthetic organisms: The importance of detritus C: N: P content. Oecologia 1993, 94, 457–471. [Google Scholar] [CrossRef]
- Aerts, R. Climate, leaf litter chemistry and leaf litter decomposition in terrestrial ecosystems: A triangular relationship. Oikos 1997, 79, 439–449. [Google Scholar] [CrossRef]
- Cornwell, W.K.; Cornelissen, J.H.; Amatangelo, K.; Dorrepaal, E.; Eviner, V.T.; Godoy, O.; Hobbie, S.E.; Hoorens, B.; Kurokawa, H.; Pérez-Harguindeguy, N.; et al. Plant species traits are the predominant control on litter decomposition rates within biomes worldwide. Ecol. Lett. 2008, 11, 1065–1071. [Google Scholar] [CrossRef]
- Semchenko, M.; Xue, P.; Leigh, T. Functional diversity and identity of plant genotypes regulate rhizodeposition and soil microbial activity. New Phytol. 2021, in press. [Google Scholar] [CrossRef] [PubMed]
- Yan, Z.; Tian, D.; Han, W.; Tang, Z.; Fang, J. An assessment on the uncertainty of the nitrogen to phosphorus ratio as a threshold for nutrient limitation in plants. Ann. Bot. 2017, 120, 937–942. [Google Scholar] [CrossRef] [PubMed]
- Du, E.; Terrer, C.; Pellegrini, A.F.; Ahlström, A.; van Lissa, C.J.; Zhao, X.; Xia, N.; Wu, X.; Jackson, R.B. Global patterns of terrestrial nitrogen and phosphorus limitation. Nat. Geosci. 2020, 13, 221–226. [Google Scholar] [CrossRef]
- United States Fish and Wildlife Service. Determination of endangered status for Serianthes nelsonii Merr. (Hayun lagu or Tronkon Guafi). Fed. Regist. 1987, 52, 4907–4910. [Google Scholar]
- United States Fish & Wildlife Service. Endangered and threatened wildlife and plants; endangered status for 16 species and threatened status for 7 species in Micronesia. Fed. Regist. 2015, 80, 59424–59497. [Google Scholar]
- United States Fish and Wildlife Service. Recovery Plan for Serianthes Nelsonii; USFWS: Portland, OR, USA, 1994. [Google Scholar]
- Marler, T.E.; Cascasan, A.N. Number of emerged seedlings and seedling longevity of the non-recruiting, critically endangered Håyun lågu tree Serianthes nelsonii Merr. (Fabales: Leguminosae) are influenced by month of emergence. J. Threat. Taxa 2015, 7, 8221–8225. [Google Scholar] [CrossRef] [Green Version]
- Marler, T.; Musser, C. Potential stressors leading to seedling mortality in the endemic Håyun lågu tree (Serianthes nelsonii Merr.) in the island of Guam. Trop. Conserv. Sci. 2015, 8, 738–744. [Google Scholar] [CrossRef] [Green Version]
- Marler, T.E.; Cruz, G.N. Extreme wind events influence seed rain and seedling dynamics of Guam’s Serianthes nelsonii Merr. Trop. Conserv. Sci. 2019, 12, 1–6. [Google Scholar] [CrossRef]
- Knops, J.M.H.; Bradley, K.L.; Wedin, D.A. Mechanisms of plant species impacts on ecosystem nitrogen cycling. Ecol. Lett. 2002, 5, 454–466. [Google Scholar] [CrossRef] [Green Version]
- Cong, W.F.; van Ruijven, J.; Mommer, L.; De Deyn, G.B.; Berendse, F.; Hoffland, E. Plant species richness promotes soil carbon and nitrogen stocks in grasslands without legumes. J. Ecol. 2014, 102, 1163–1170. [Google Scholar] [CrossRef]
- Semchenko, M.; Saar, S.; Lepik, A. Intraspecific genetic diversity modulates plant–soil feedback and nutrient cycling. New Phytol. 2017, 216, 90–98. [Google Scholar] [CrossRef] [Green Version]
- Lawton, J.H.; Brown, V.K. Redundancy in ecosystems. In Biodiversity and Ecosystem Function; Schulze, E.D., Mooney, H.A., Eds.; Springer: Berlin, Germany, 1993; pp. 255–270. [Google Scholar]
- Mouchet, M.A.; Villéger, S.; Mason, N.W.H.; Mouillot, D. Functional diversity measures: An overview of their redundancy and their ability to discriminate community assembly rules. Funct. Ecol. 2010, 24, 867–876. [Google Scholar] [CrossRef]
- Ricotta, C.; de Bello, F.; Moretti, M.; Caccianiga, M.; Cerabolini, B.E.; Pavoine, S. Measuring the functional redundancy of biological communities: A quantitative guide. Methods Ecol. Evol. 2016, 7, 1386–1395. [Google Scholar] [CrossRef] [Green Version]
- Biggs, C.R.; Yeager, L.A.; Bolser, D.G.; Bonsell, C.; Dichiera, A.M.; Hou, Z.; Keyser, S.R.; Khursigara, A.J.; Lu, K.; Muth, A.F.; et al. Does functional redundancy affect ecological stability and resilience? A review and meta-analysis. Ecosphere 2020, 11, e03184. [Google Scholar] [CrossRef]
- Doak, D.F.; Bigger, D.; Harding, E.K.; Marvier, M.A.; O’Malley, R.E.; Thomson, D. The statistical inevitability of stability–diversity relationships in community ecology. Am. Nat. 1998, 151, 264–276. [Google Scholar] [CrossRef]
- Walker, B. Biodiversity and ecological redundancy. Conserv. Biol. 1992, 6, 18–23. [Google Scholar] [CrossRef]
- Wiles, G.; Williams, E. Serianthes nelsonii . IUCN Red List Threat. Species 2017. [Google Scholar] [CrossRef]
- Donnegan, J.A.; Butler, S.L.; Grabowiecki, W.; Hiserote, B.A.; Limtiaco, D. Guam’s Forest Resources, 2002; Resource Bulletin PNW-RB-243; U.S. Department of Agriculture, Forest Service, Pacific Northwest Research Station: Portland, OR, USA, 2004. [Google Scholar]
- Marler, T.E. Cycad aulacaspis scale invades the Mariana Islands. Mem. N. Y. Bot. Gard. 2012, 106, 20–35. [Google Scholar]
- Marler, T.E.; Krishnapillai, M.V. Longitude, forest fragmentation, and plant size influence Cycas micronesica mortality following island insect invasions. Diversity 2020, 12, 194. [Google Scholar] [CrossRef]
- Marler, T.E.; Lindström, A.J. The value of research to selling the conservation of threatened species: The case of Cycas micronesica (Cycadopsida: Cycadales: Cycadaceae). J. Threat. Taxa 2014, 6, 6523–6528. [Google Scholar] [CrossRef]
- Guo, Y.; Ren, G.; Zhang, K.; Li, Z.; Miao, Y.; Guo, H. Leaf senescence: Progression, regulation, and application. Mol. Hortic. 2021, 1, 5. [Google Scholar] [CrossRef]
- Zentgraf, U.; Andrade, A.G.; Doll, J. Editorial for special issue “leaf senescence” in plants. Plants 2021, 10, 1490. [Google Scholar] [CrossRef]
- Vergutz, L.; Manzoni, S.; Porporato, A.; Novais, R.F.; Jackson, R.B. Global resorption efficiencies and concentrations of carbon and nutrients in leaves of terrestrial plants. Ecol. Monogr. 2012, 82, 205–220. [Google Scholar] [CrossRef] [Green Version]
- Chen, H.; Reed, S.C.; Lü, X.; Xiao, K.; Wang, K.; Li, D. Global resorption efficiencies of trace elements in leaves of terrestrial plants. Funct. Ecol. 2021, 35, 1596–1602. [Google Scholar] [CrossRef]
- Mediavilla, S.; González-Zurdo, P.; García-Ciudad, A.; Escudero, A. Morphological and chemical leaf composition of Mediterranean evergreen tree species according to leaf age. Trees 2011, 25, 669–677. [Google Scholar] [CrossRef]
- Kitajima, K.; Llorens, A.M.; Stefanescu, C.; Timchenko, M.V.; Lucas, P.W.; Wright, S.J. How cellulose-based leaf toughness and lamina density contribute to long leaf lifespans of shade-tolerant species. New Phytol. 2012, 195, 640–652. [Google Scholar] [CrossRef]
- Marler, T.E. Pacific island tropical cyclones are more frequent and globally relevant, yet less studied. Front. Environ. Sci. 2014, 2, 42. [Google Scholar] [CrossRef] [Green Version]
- Stone, B.C. America’s Asiatic flora: The plants of Guam. Amer. Sci. 1971, 59, 308–319. [Google Scholar]
- Marler, T.E. Perennial trees associating with nitrogen-fixing symbionts differ in leaf after-life nitrogen and carbon release. Nitrogen 2020, 1, 10. [Google Scholar] [CrossRef]
- Marler, T.E.; Dongol, N. Three invasive insects alter Cycas micronesica leaf chemistry and predict changes in biogeochemical cycling. Commun. Integr. Biol. 2016, 9, e1208324. [Google Scholar] [CrossRef] [PubMed]
- Chen, H.; Reed, S.C.; Lü, X.; Xiao, K.; Wang, K.; Li, D. Coexistence of multiple leaf nutrient resorption strategies in a single ecosystem. Sci. Total Environ. 2021, 772, 144951. [Google Scholar] [CrossRef] [PubMed]
- Marler, T.E. Reciprocal garden study reveals acute spatial-edaphic adaptation for Cycas micronesica. Diversity 2021, 13, 237. [Google Scholar] [CrossRef]
- Waring, B.G. A meta-analysis of climatic and chemical controls on leaf litter decay rates in tropical forests. Ecosystems 2012, 15, 999–1009. [Google Scholar] [CrossRef]
Figure 1.
Macronutrient concentration (mg·g−1) of green leaf tissue from 25 plant species from Guam’s northern karst forests. (a) Nitrogen, p < 0.001; (b) phosphorus, p < 0.001 p < 0.001; (c) potassium, p < 0.001; (d) calcium, p < 0.001; (e) magnesium, p < 0.001; (f) Carbon, p = 0.643. Means separation by the Tukey-Kramer post hoc test. Means with the same letters are not significantly different. n = 6.
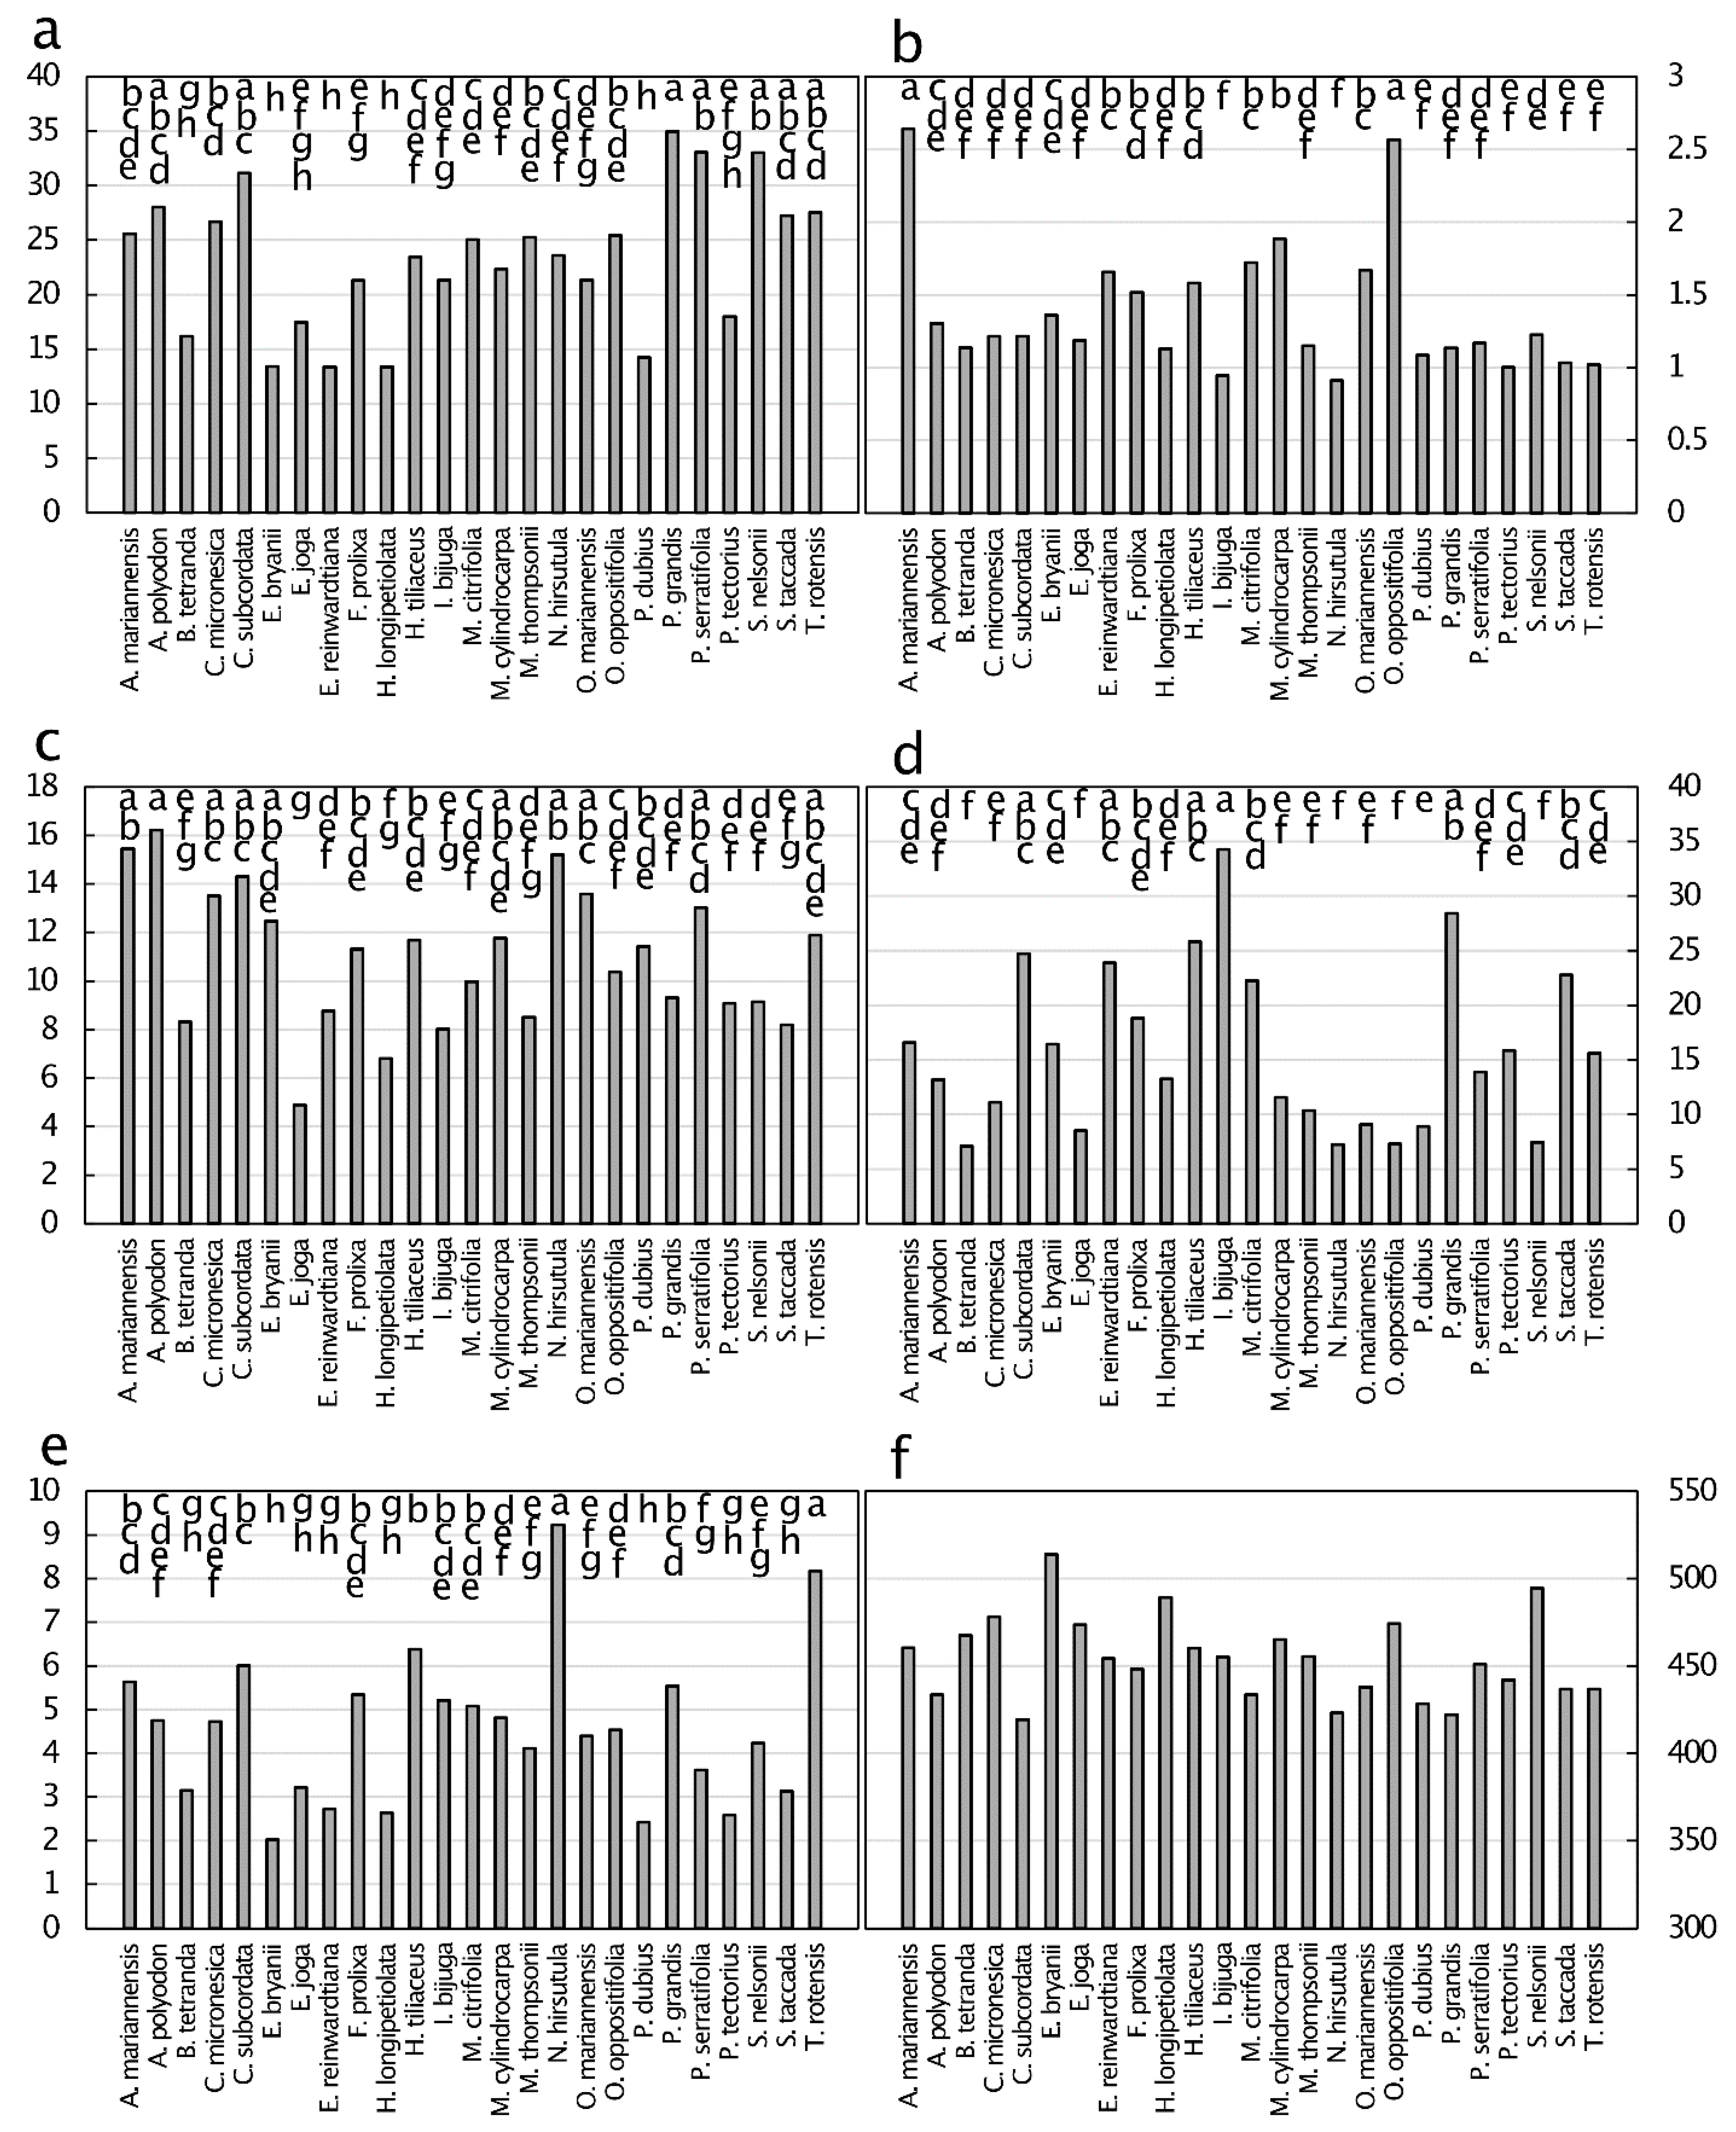
Figure 2.
Micronutrient concentration (µg·g−1) of green leaf tissue from 25 plant species from Guam’s northern karst forests. (a) Manganese, p < 0.001; (b) iron, p < 0.001; (c) zinc, p < 0.001; (d) boron, p < 0.001; (e) copper, p < 0.001; (f) nickel, p < 0.001. Means separation by the Tukey-Kramer post hoc test. Means with the same letters are not significantly different. n = 6.
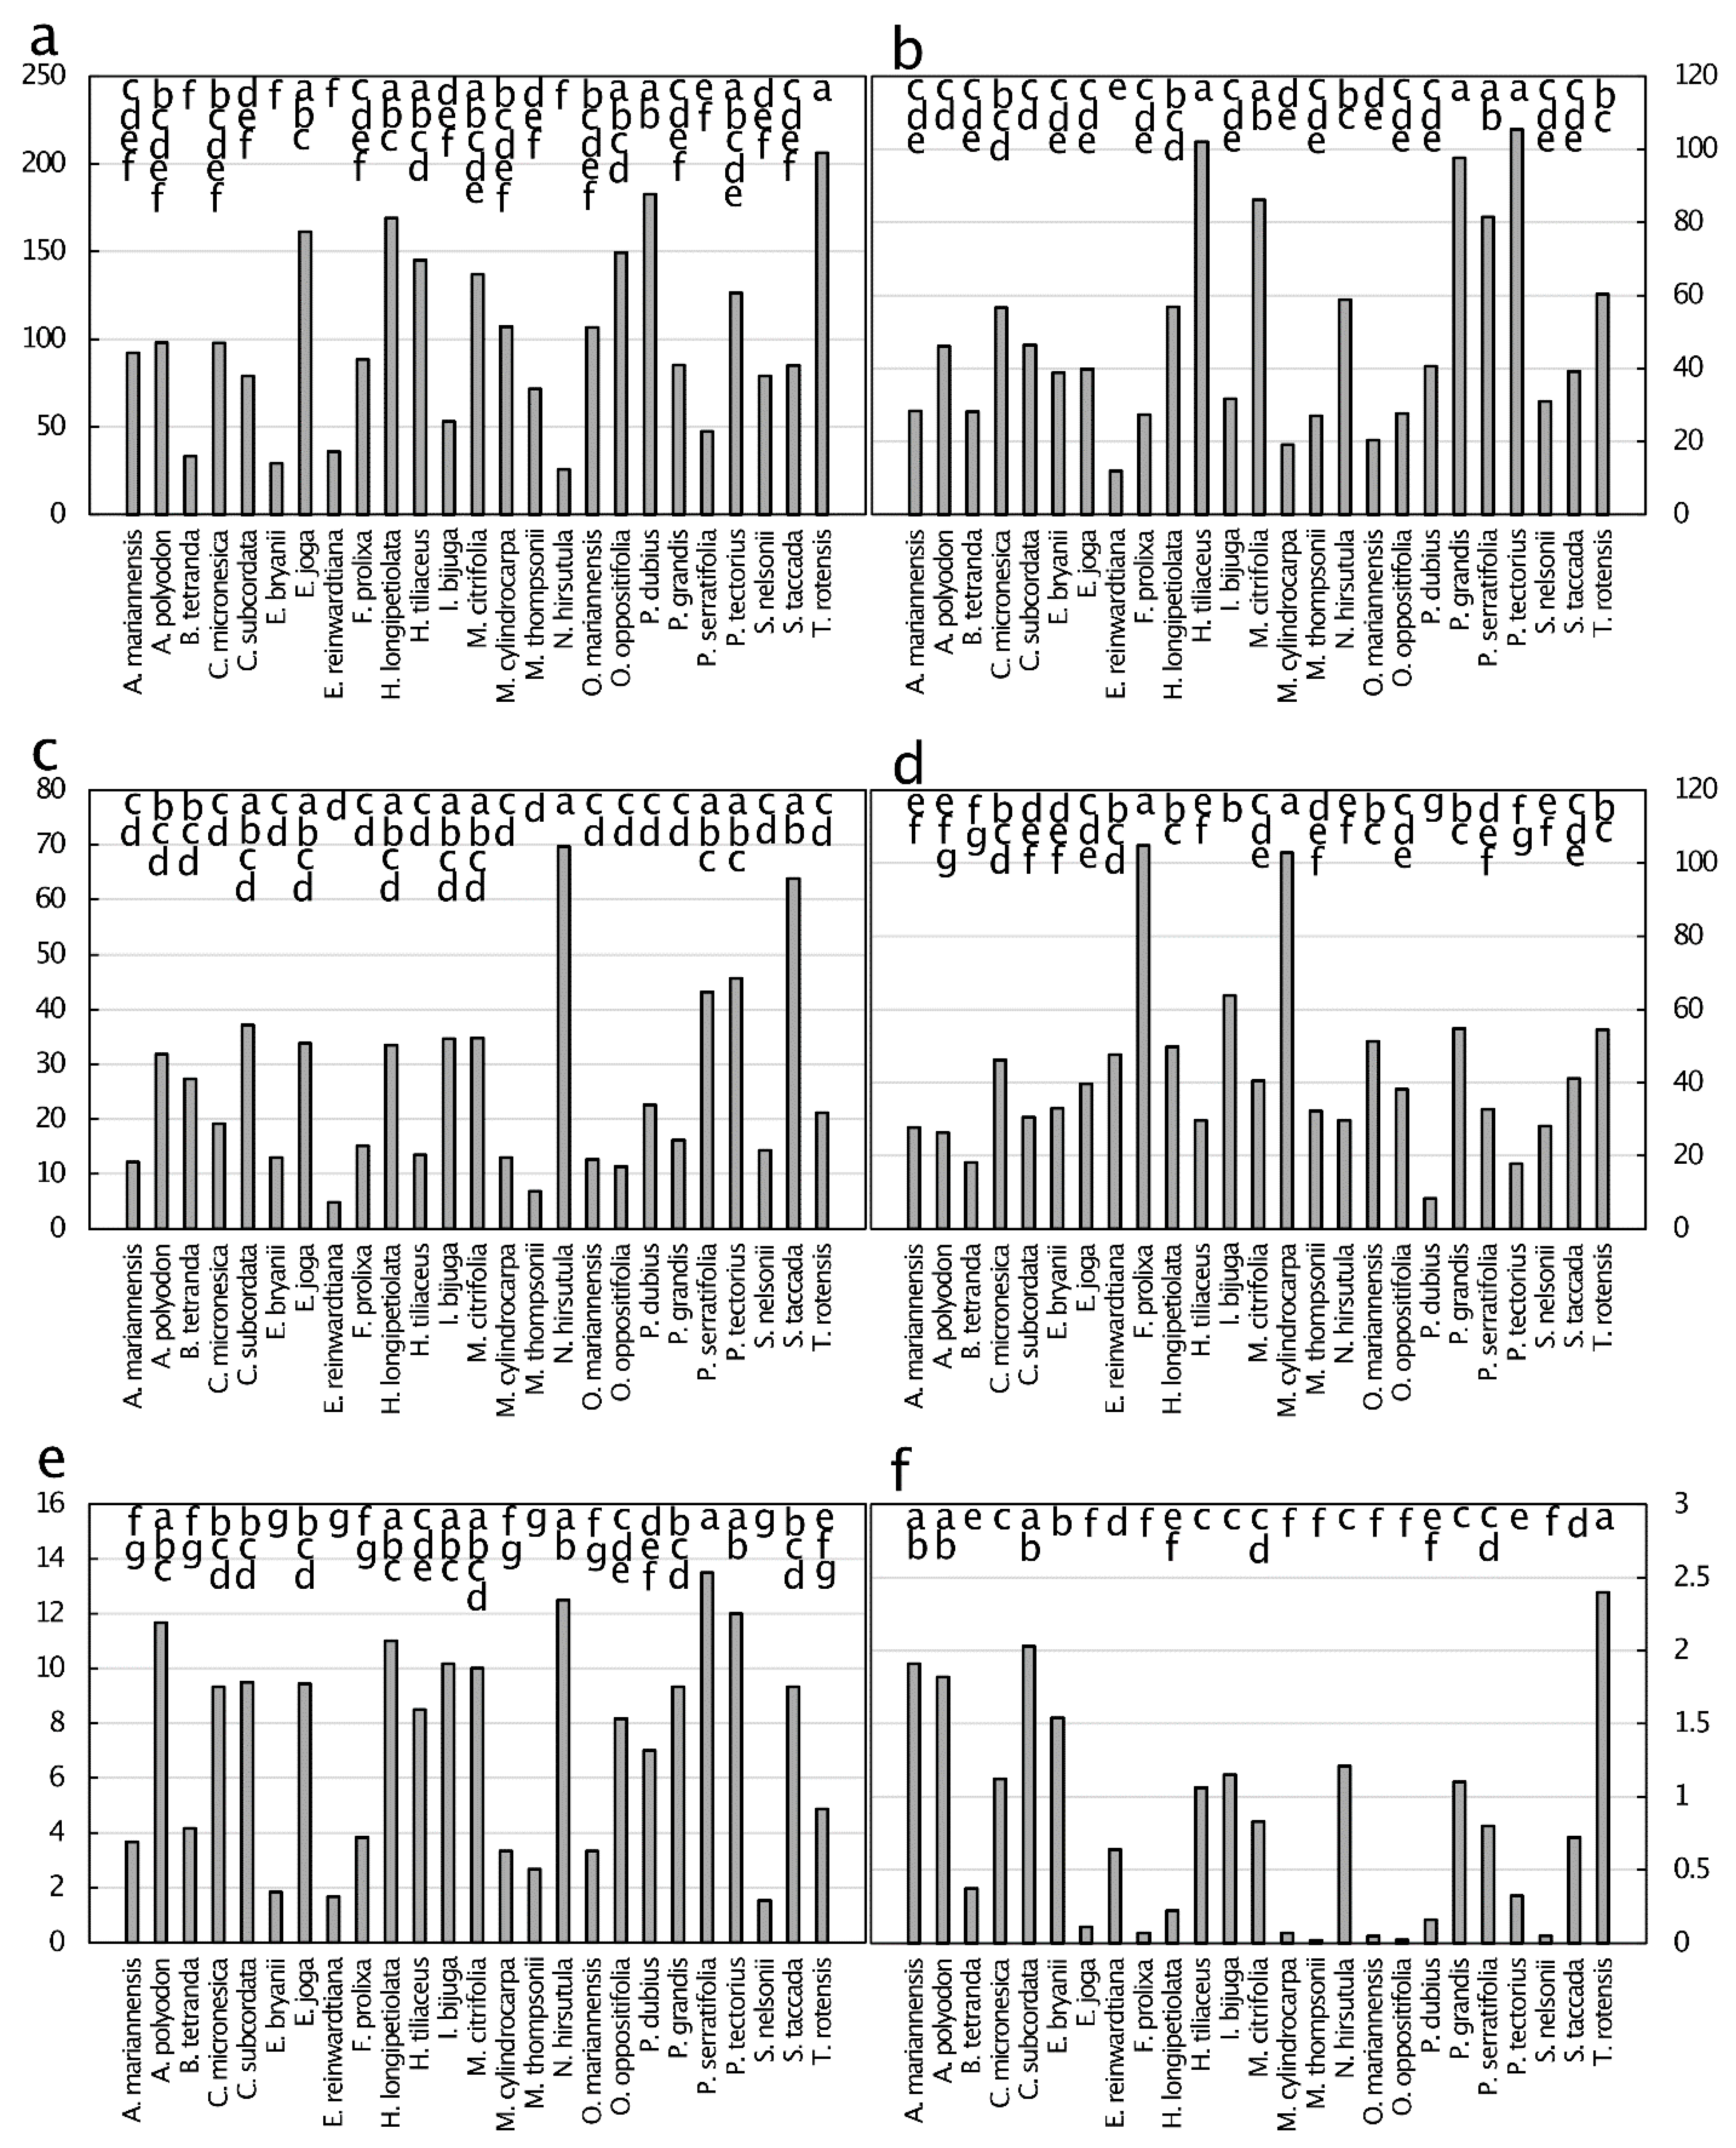
Figure 3.
Concentration of metals and metalloids (µg·g−1) of green leaf tissue from 25 plant species from Guam’s northern karst forests. (a) Selenium, p < 0.001; (b) lead, p < 0.001; (c) arsenic, p < 0.001; (d) cadmium, p < 0.001; (e) cobalt, p < 0.001; (f) chromium, p < 0.001. Means separation by the Tukey-Kramer post hoc test. Means with the same letters are not significantly different. n = 6.
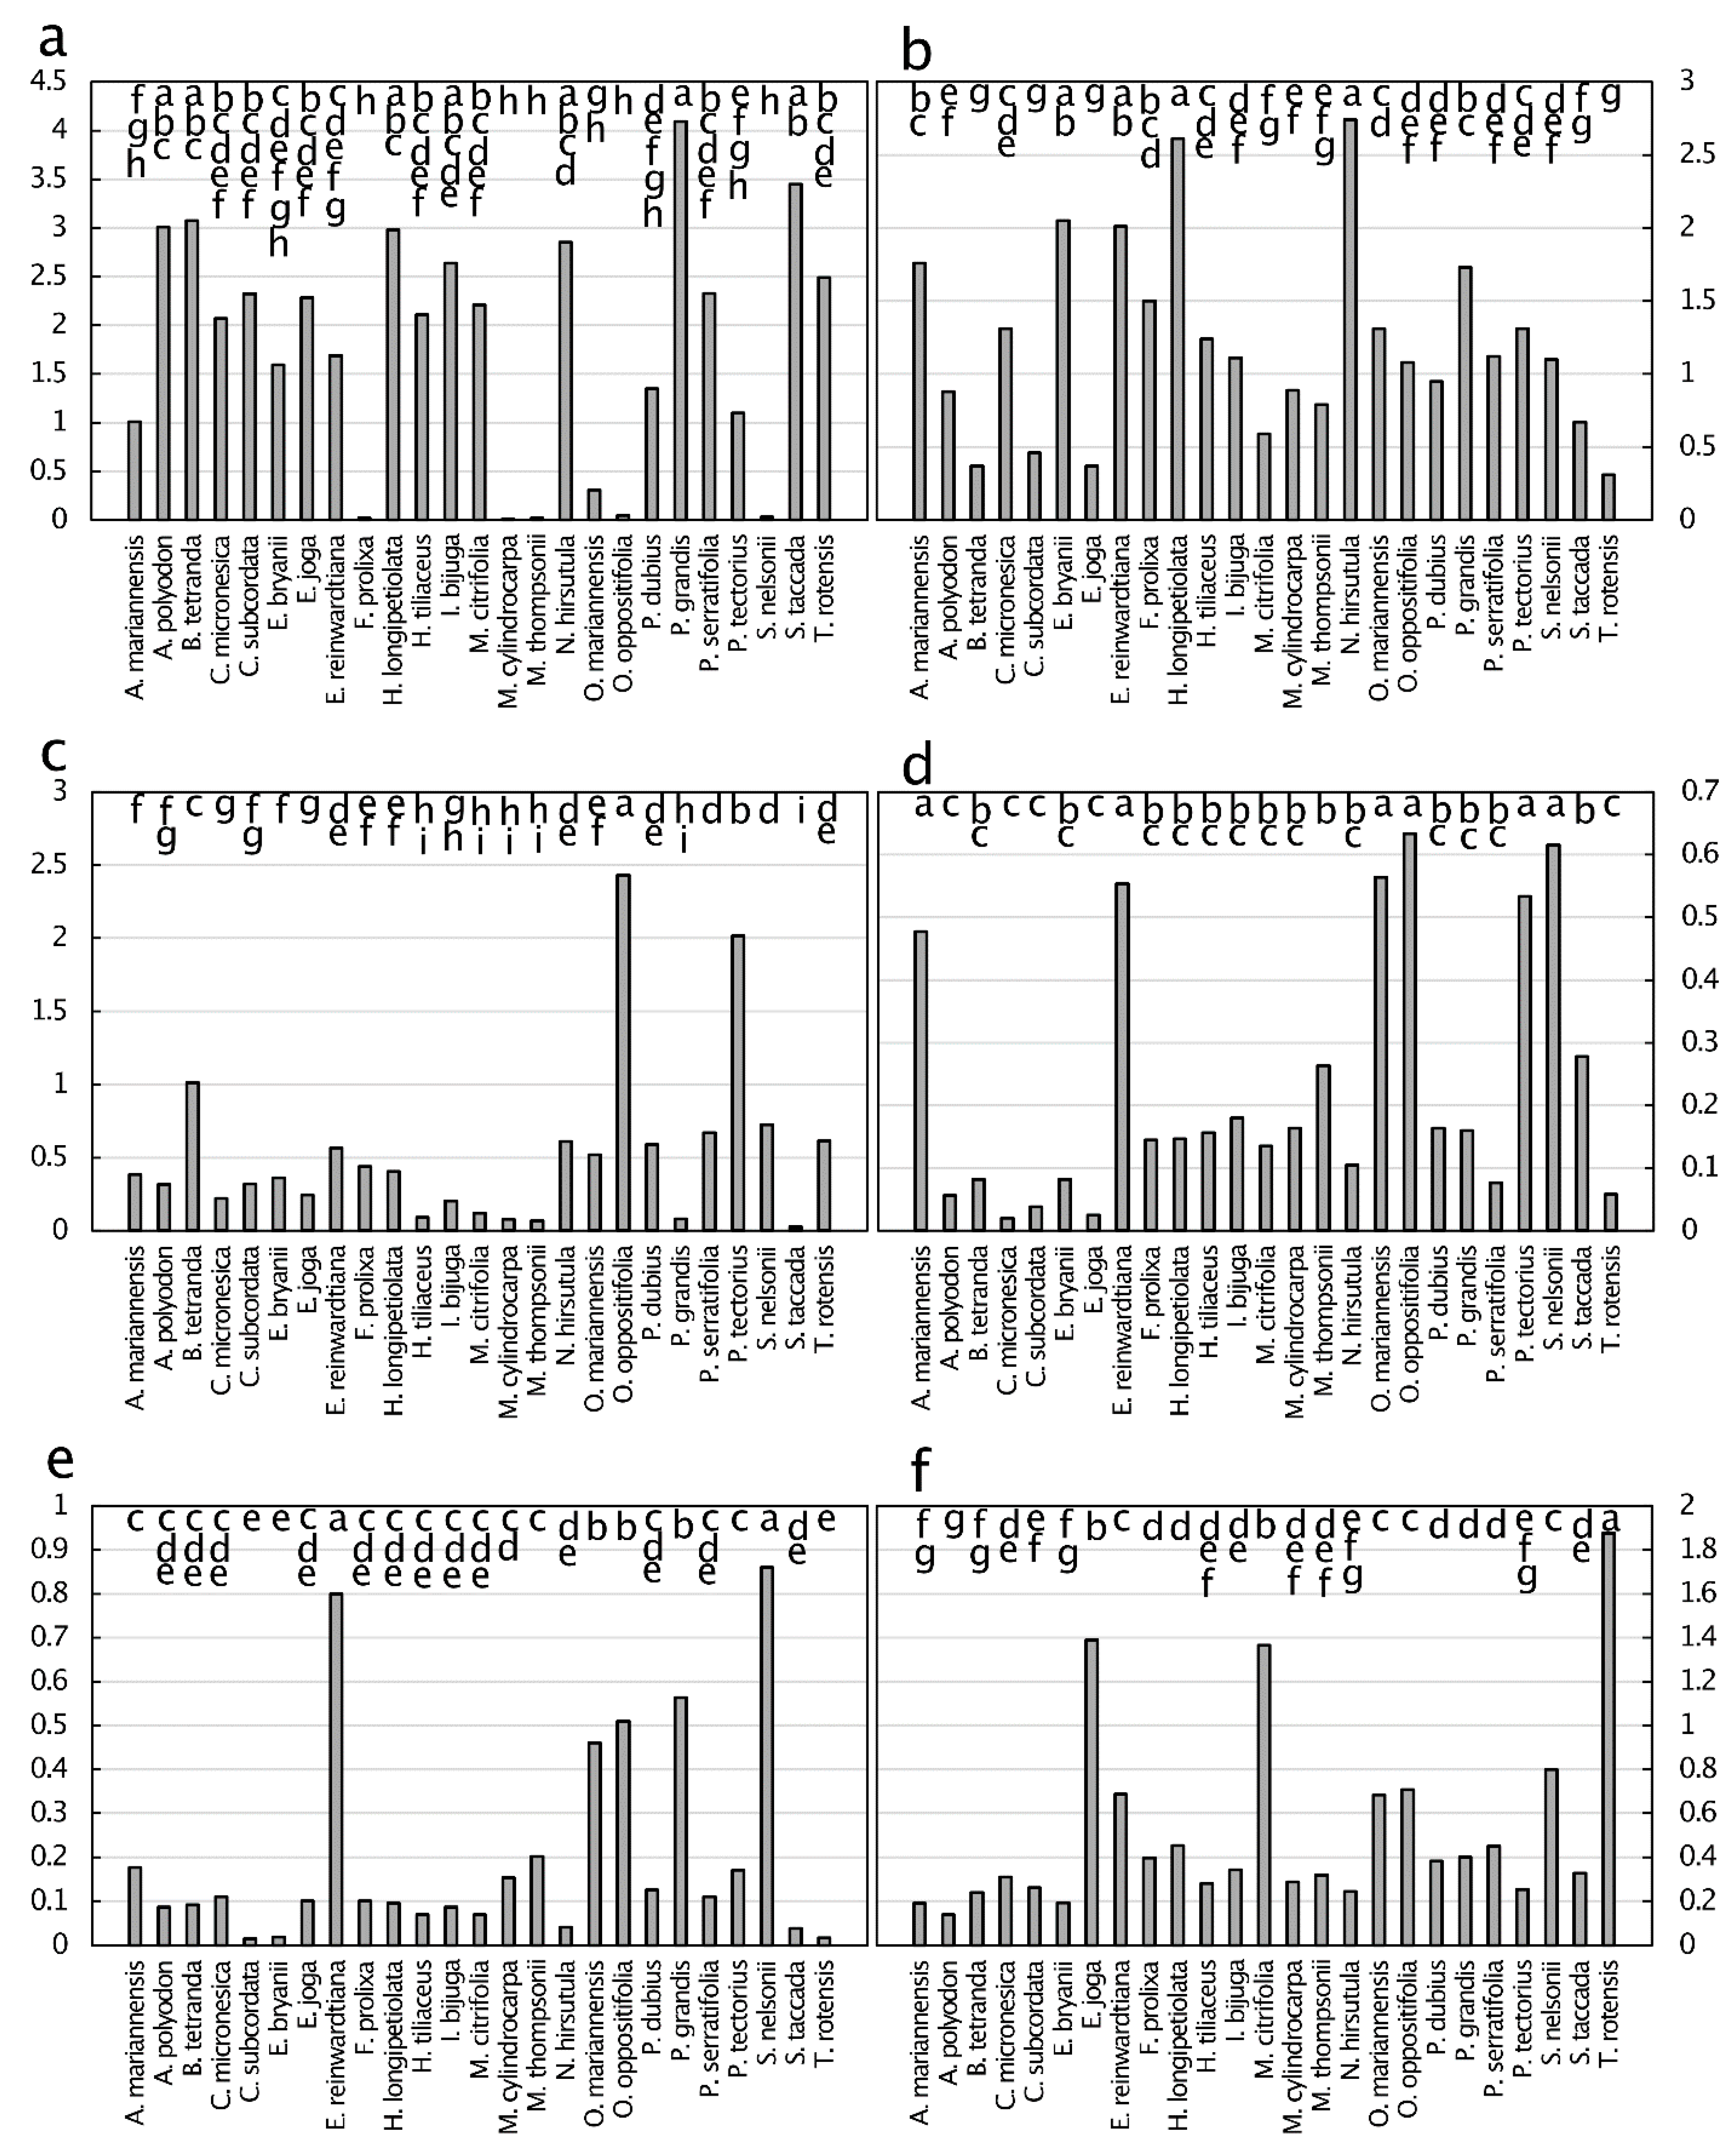
Figure 4.
Pairwise quotients of nitrogen, phosphorus, and potassium in green leaf tissue from 25 plant species from Guam’s northern karst forests. (a) nitrogen:phosporus, p < 0.001; (b) nitrogen:potassium, p < 0.001; (c) potassium:phosphorus, p < 0.001. Black horizontal line connecting all bars depicts the overall mean of the Guam data. Gray horizontal line is a demarcation of which nutrient limits plant growth based on global data. Means with the same letters are not significantly different. n = 6.

Figure 5.
Green leaf tissue traits from 25 plant species from Guam’s northern karst forests. (a) Lignin, mg·g−1, p < 0.001; (b) cellulose, mg·g−1, p < 0.001; (c) carbon:nitrogen, mg·g−1, p < 0.001; (d) lignin:nitrogen, mg·g−1, p < 0.001; (e) cellulose:nitrogen, mg·g−1, p < 0.001. Means separation by Tukey-Kramer post hoc test denoted by horizontal bars at top of each panel. Means with the same letters are not significantly different. n = 6.
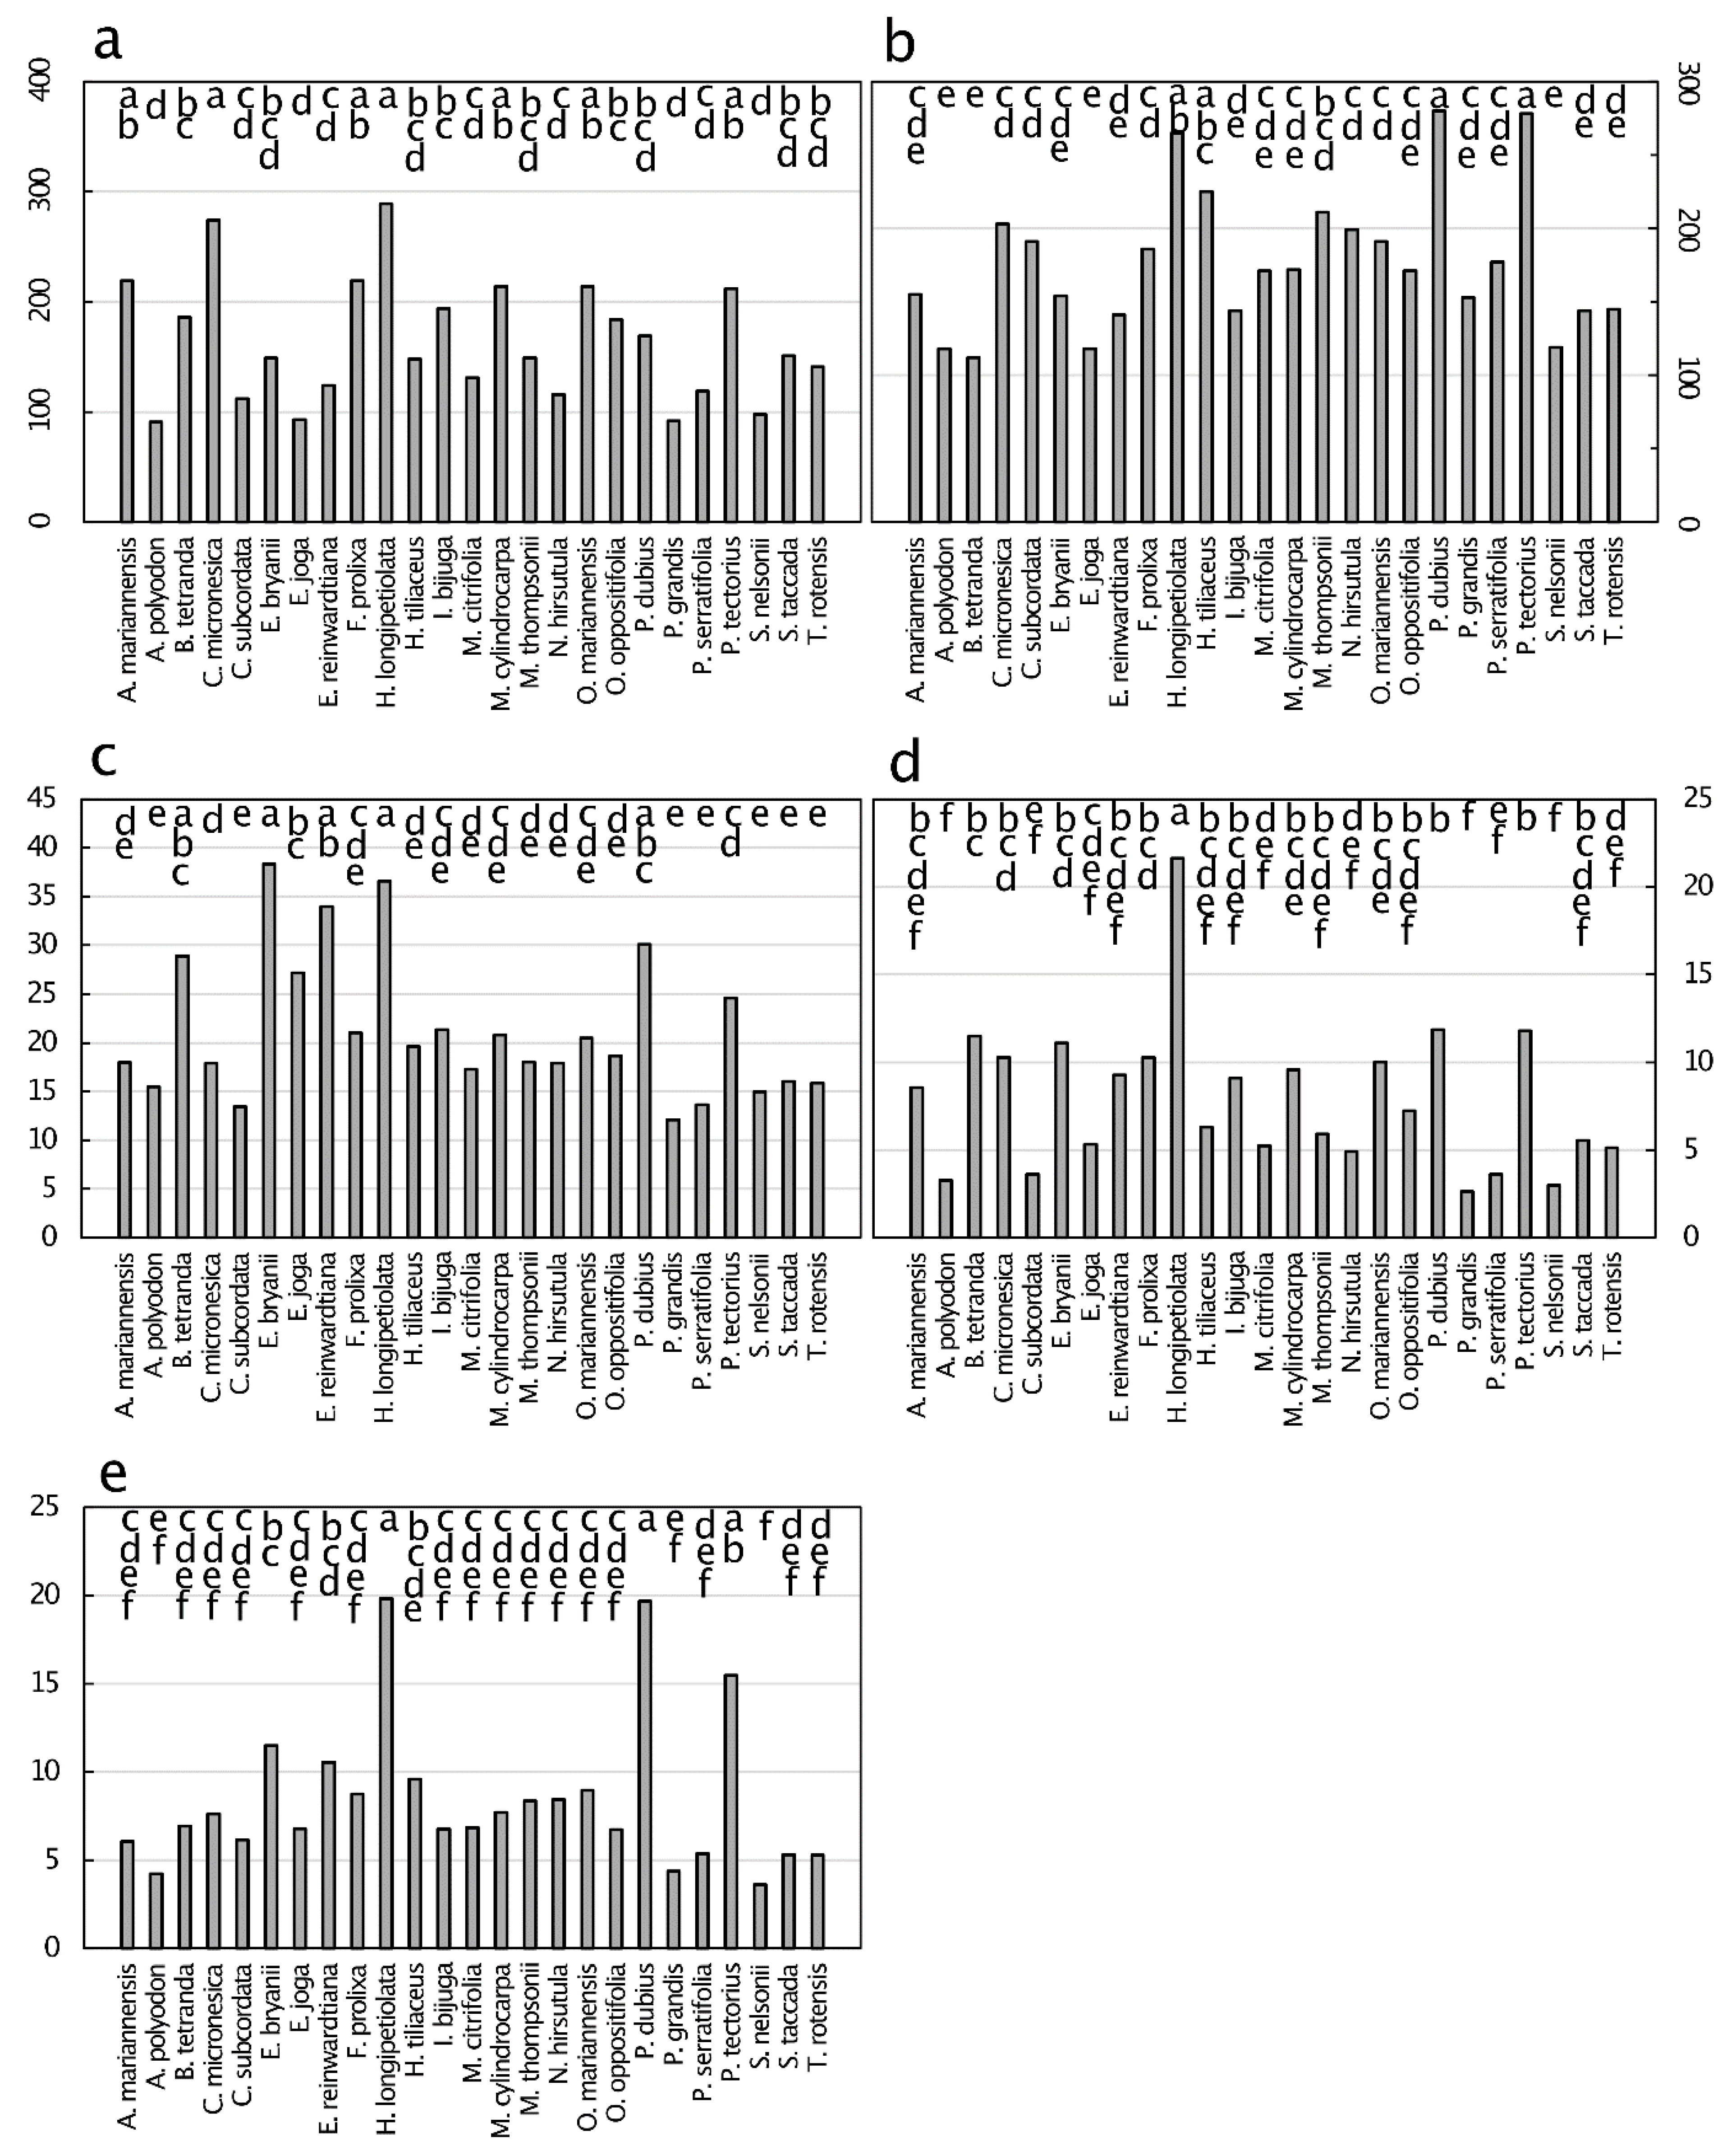
Figure 6.
Macronutrient concentration (mg·g−1) of senesced leaf tissue from 25 plant species from Guam’s northern karst forests. (a) Nitrogen, p < 0.001; (b) phosphorus, p < 0.001 p < 0.001; (c) potassium, p < 0.001; (d) calcium, p < 0.001; (e) magnesium, p < 0.001; (f) carbon, p = 0.643. Means separation by the Tukey-Kramer post hoc test. Means with the same letters are not significantly different. n = 6.
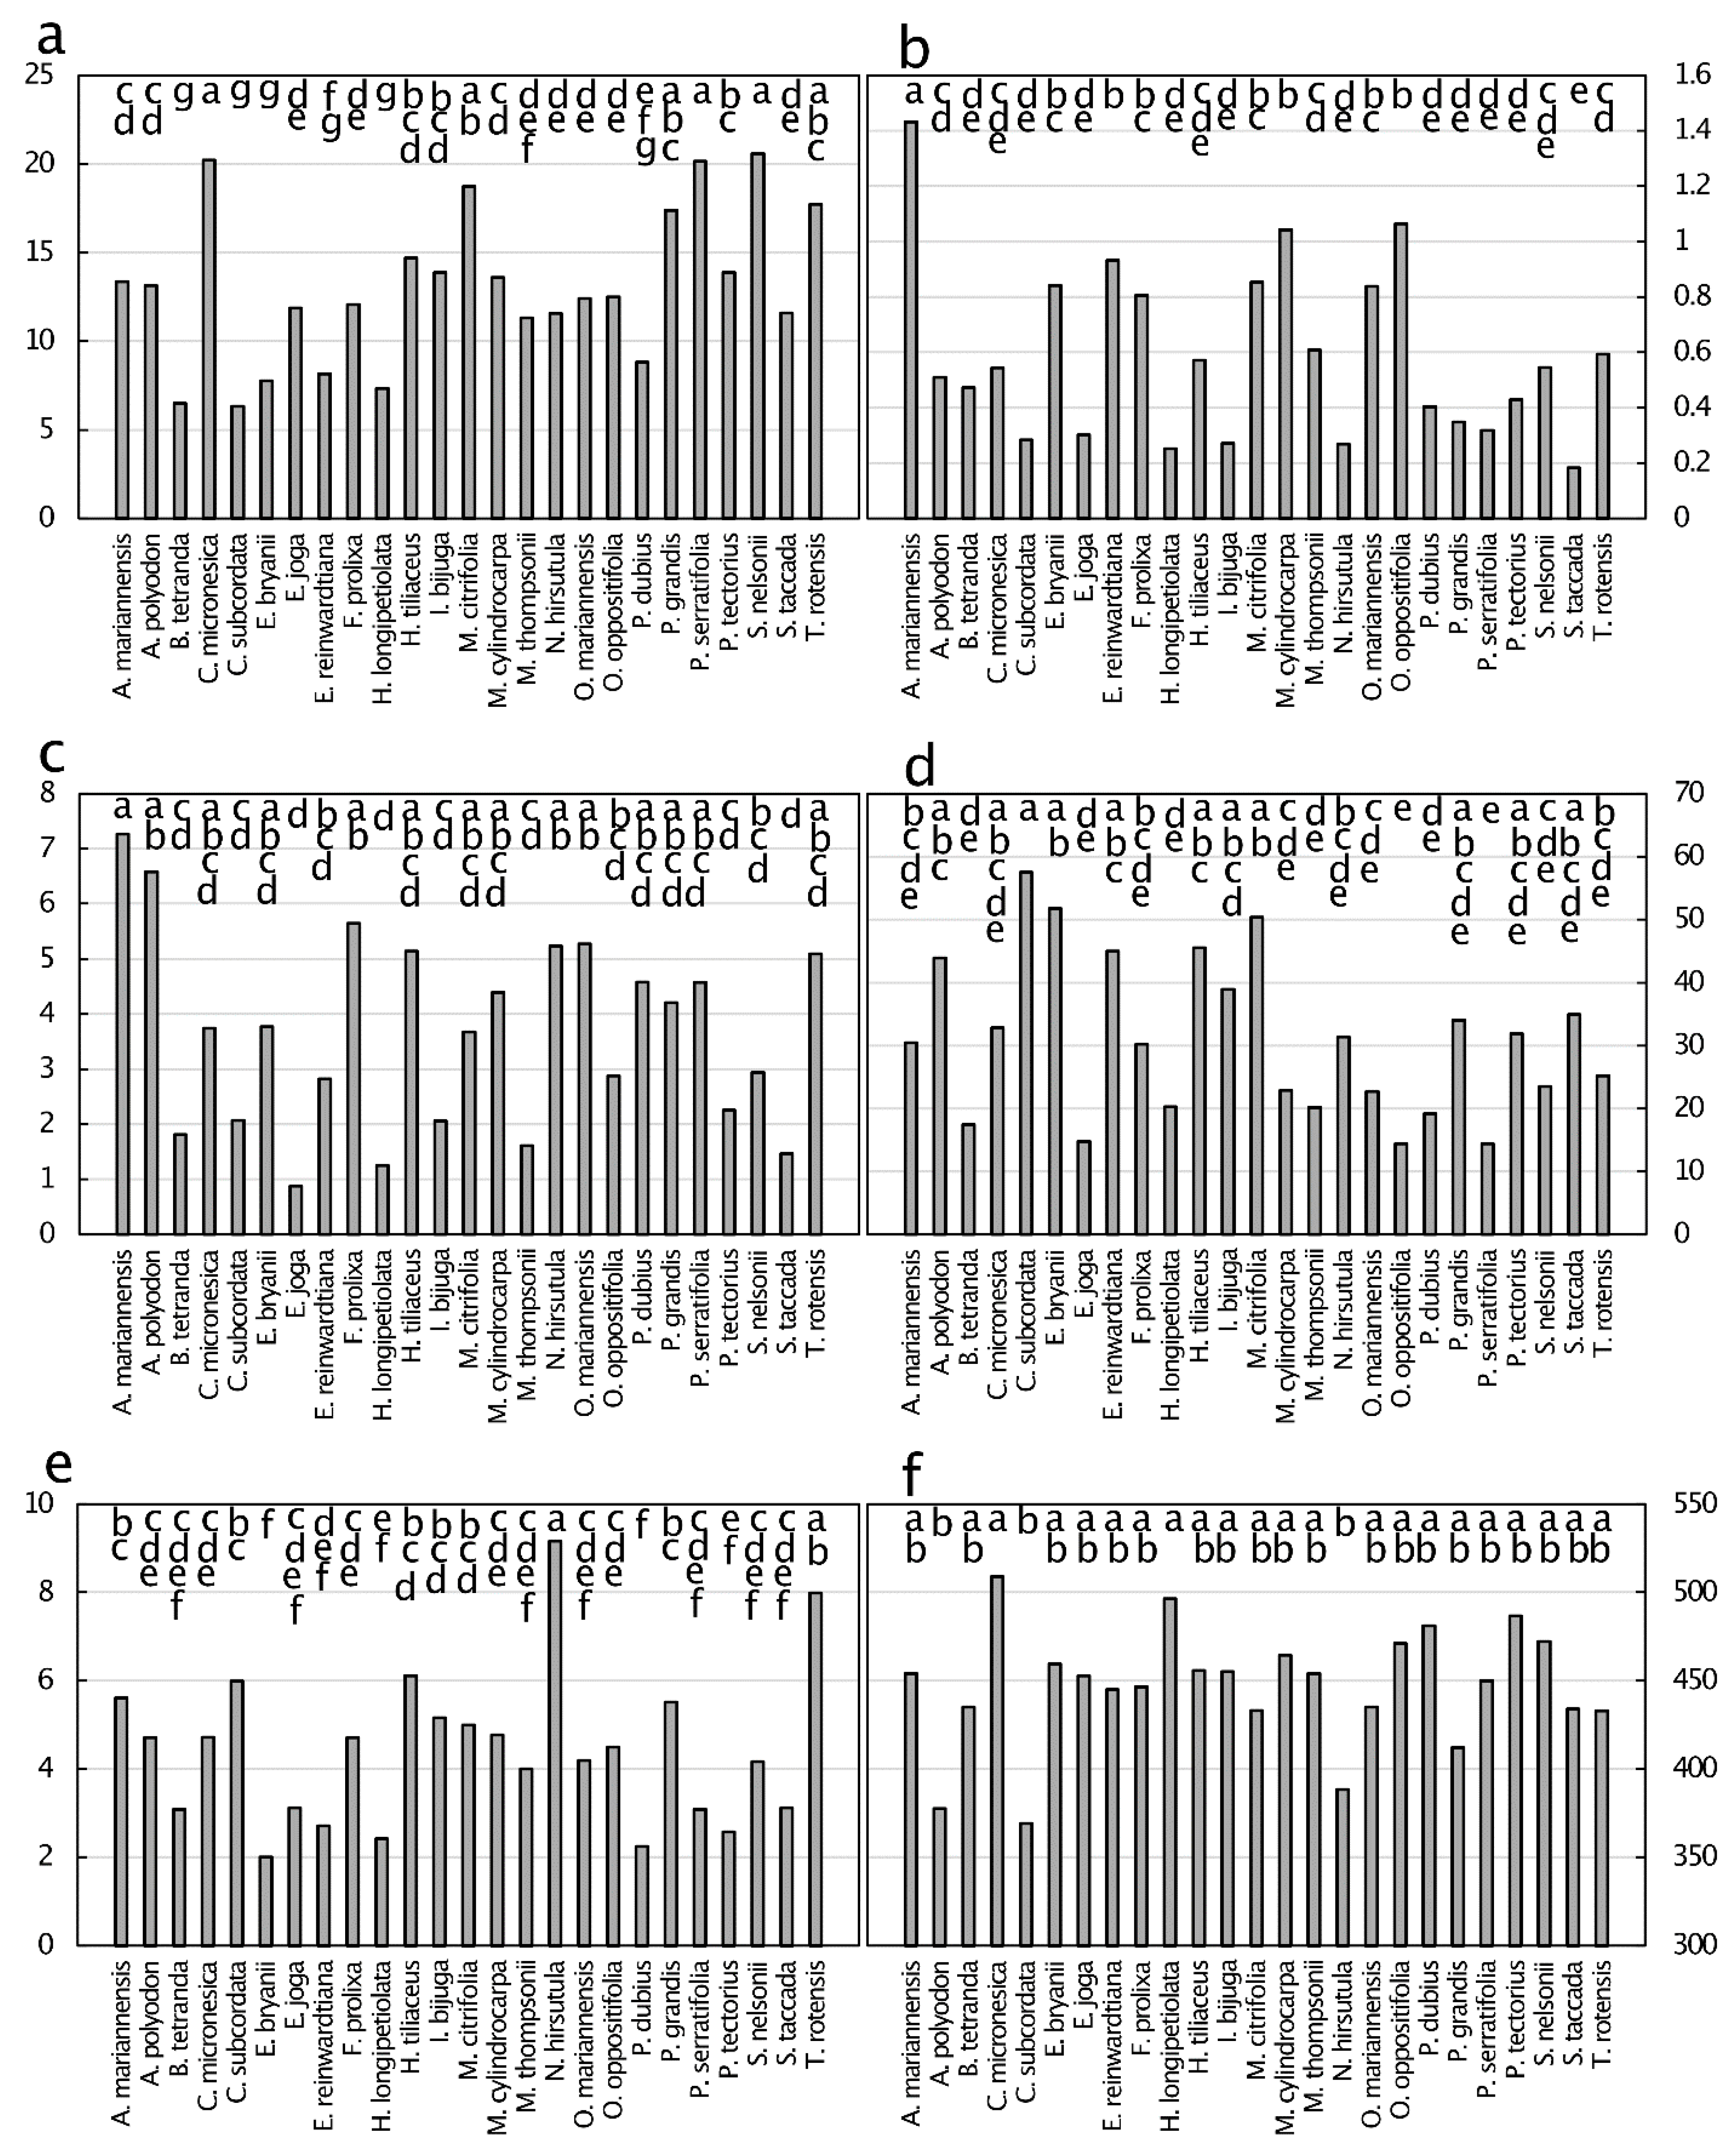
Figure 7.
Micronutrient concentration (µg·g−1) of senesced leaf tissue from 25 plant species from Guam’s northern karst forests. (a) Manganese, p < 0.001; (b) iron, p < 0.001; (c) zinc, p < 0.001; (d) boron, p < 0.001; (e) copper, p < 0.001; (f) nickel, p < 0.001. Means separation by the Tukey-Kramer post hoc test. Means with the same letters are not significantly different. n = 6.
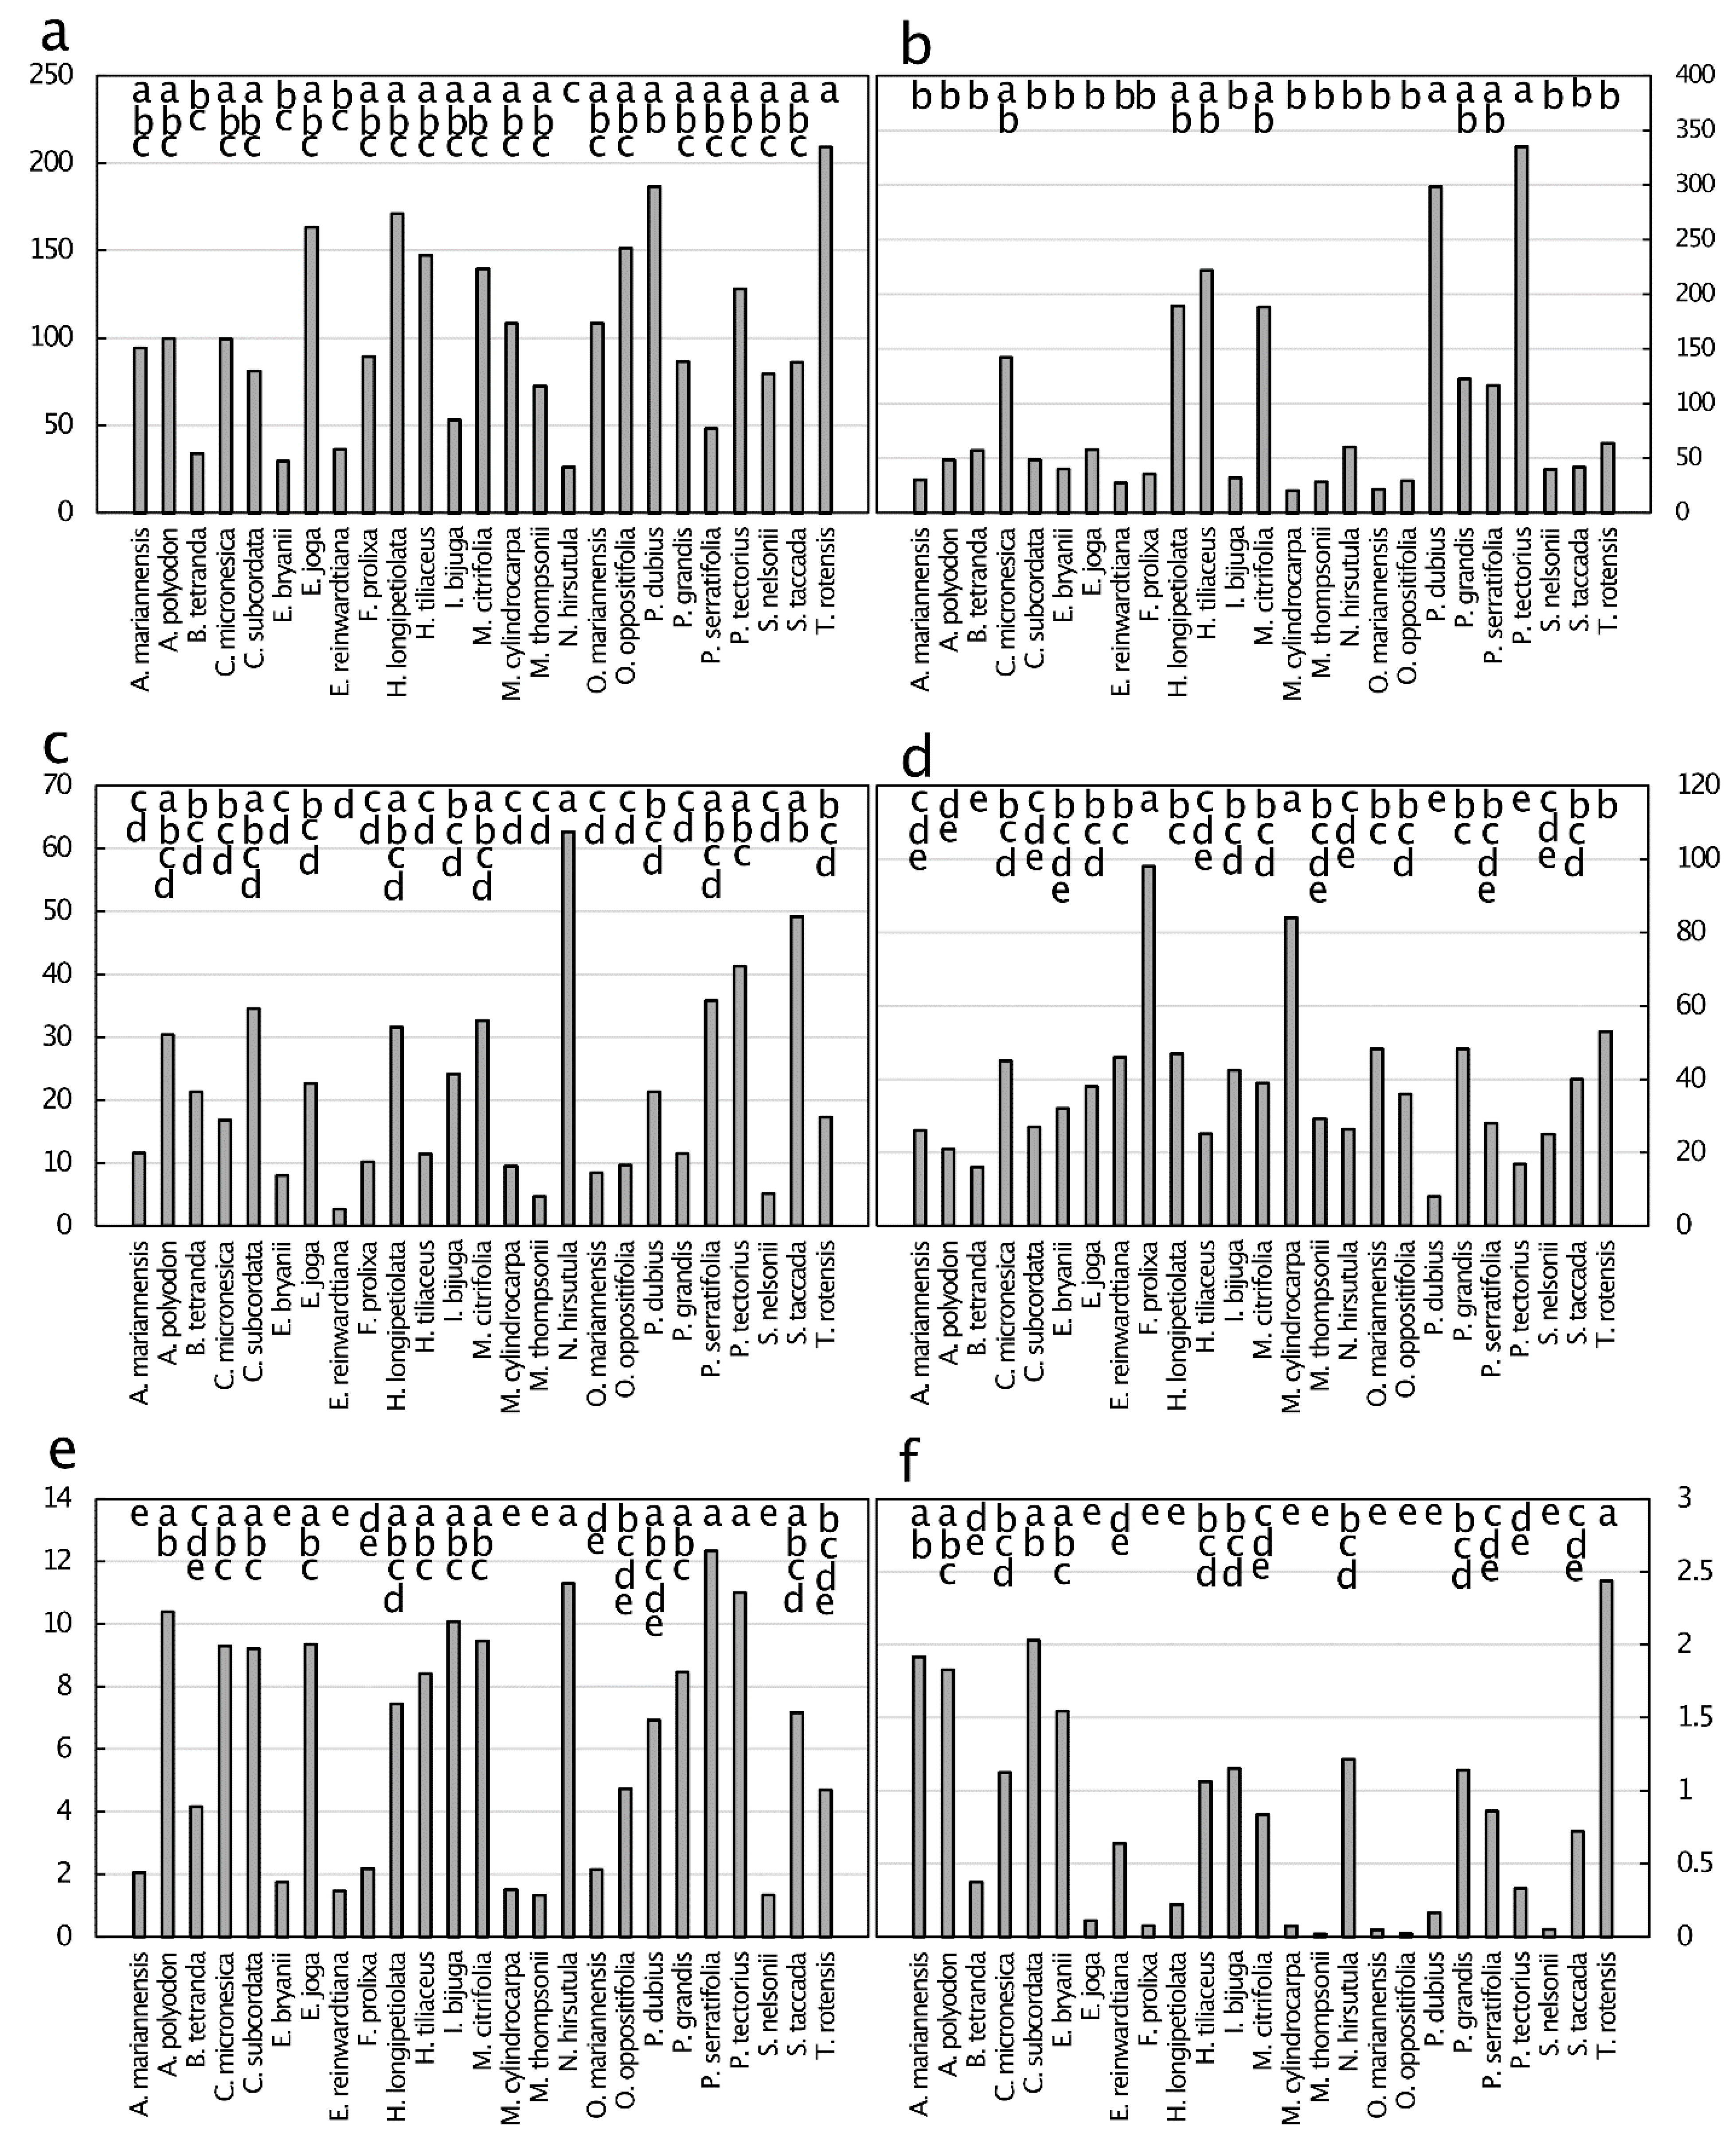
Figure 8.
Concentration of metals and metalloids (µg·g−1) of senesced leaf tissue from 25 plant species from Guam’s northern karst forests. (a) Selenium, p < 0.001; (b) lead, p < 0.001; (c) arsenic, p < 0.001; (d) cadmium, p < 0.001; (e) cobalt, p < 0.001; (f) chromium, p < 0.001. Means separation by the Tukey-Kramer post hoc test. Means with the same letters are not significantly different. n = 6.

Figure 9.
Senesced leaf tissue traits from 25 plant species from Guam’s northern karst forests. (a) Lignin, mg·g−1, p < 0.001; (b) cellulose, mg·g−1, p < 0.001; (c) carbon:nitrogen, mg·g−1, p < 0.001; (d) lignin:nitrogen, mg·g−1, p < 0.001; (e) cellulose:nitrogen, mg·g−1, p < 0.001. Means separation by the Tukey-Kramer post hoc test denoted by horizontal bars at the top of each panel. Means with the same letters are not significantly different. n = 6.
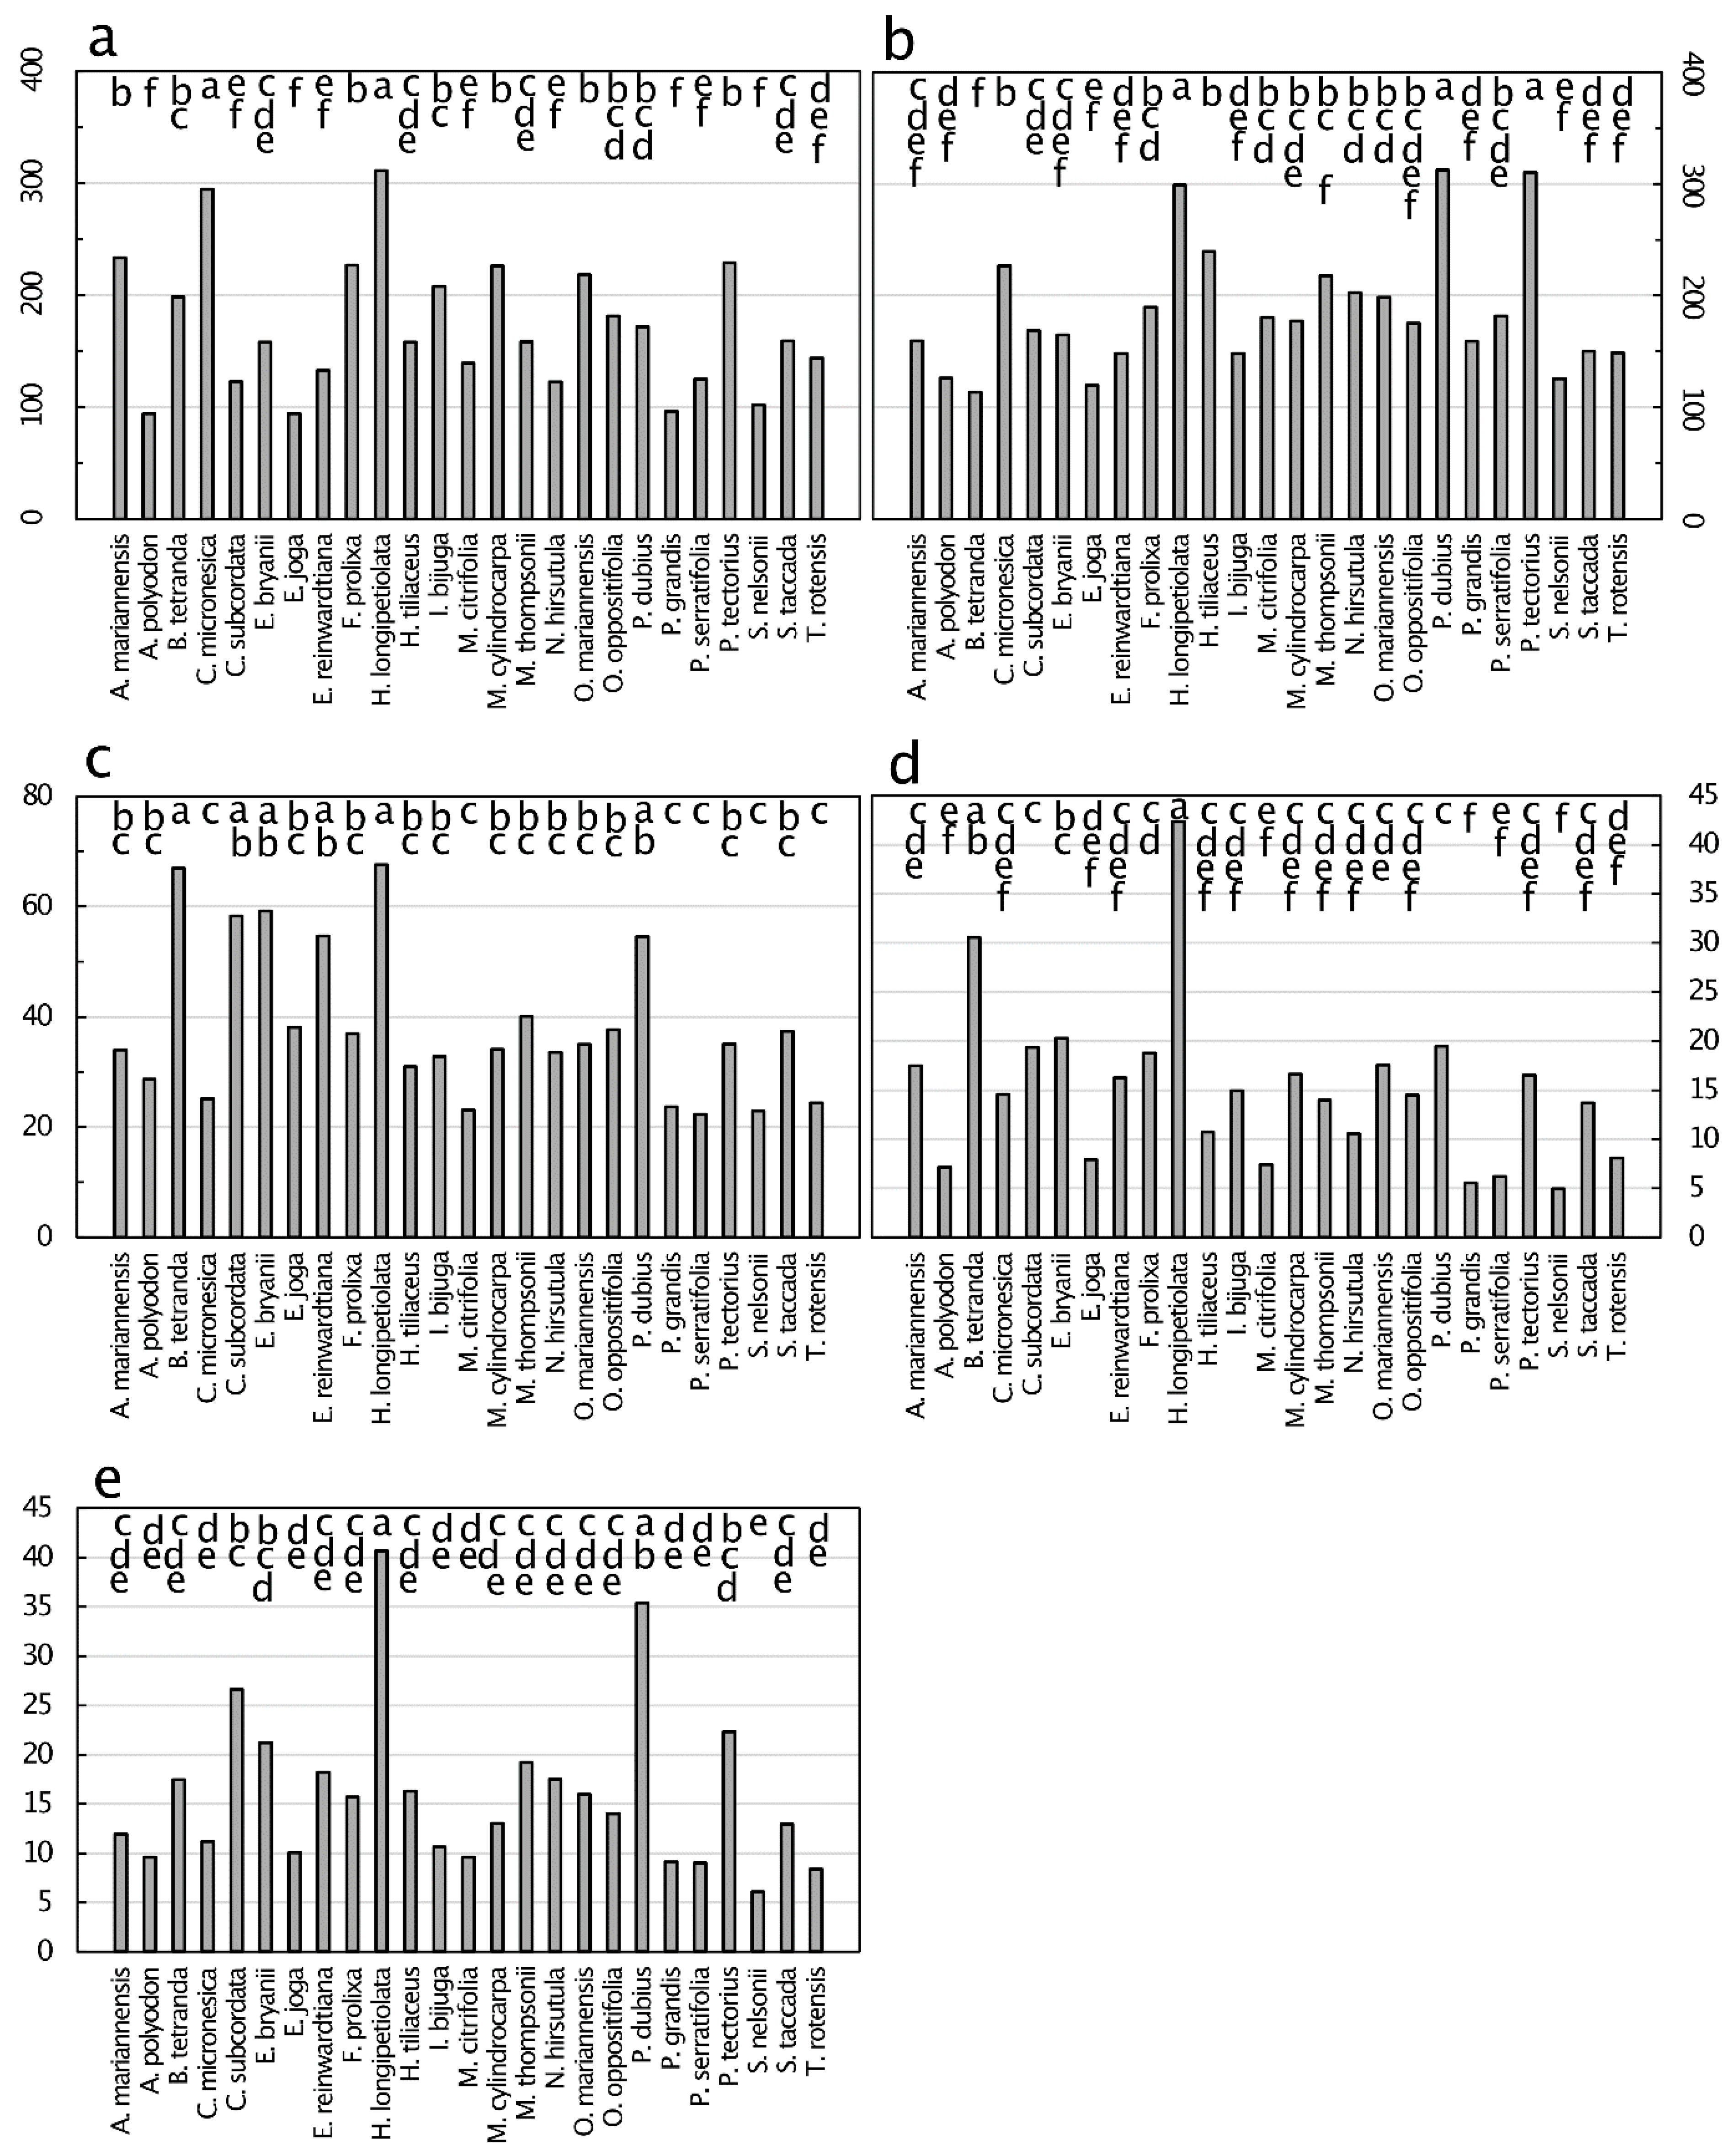
Figure 10.
The resorption efficiency (positive means) and accretion efficiency (negative means) of leaves from 25 plant species from Guam’s northern karst forests. Mean ± standard error, n = 6. The standard error is smaller than the marker size for markers with no bars. Vertical dashed lines separate macronutrients, micronutrients, and metals/metalloids.
Publisher’s Note: MDPI stays neutral with regard to jurisdictional claims in published maps and institutional affiliations. |
© 2021 by the author. Licensee MDPI, Basel, Switzerland. This article is an open access article distributed under the terms and conditions of the Creative Commons Attribution (CC BY) license (https://creativecommons.org/licenses/by/4.0/).
Share and Cite
MDPI and ACS Style
Marler, T.E. Leaf Elemental Concentrations, Stoichiometry, and Resorption in Guam’s Coastal Karst Forests. Diversity 2021, 13, 545. https://doi.org/10.3390/d13110545
AMA Style
Marler TE. Leaf Elemental Concentrations, Stoichiometry, and Resorption in Guam’s Coastal Karst Forests. Diversity. 2021; 13(11):545. https://doi.org/10.3390/d13110545
Chicago/Turabian StyleMarler, Thomas E. 2021. "Leaf Elemental Concentrations, Stoichiometry, and Resorption in Guam’s Coastal Karst Forests" Diversity 13, no. 11: 545. https://doi.org/10.3390/d13110545
Note that from the first issue of 2016, this journal uses article numbers instead of page numbers. See further details here.