Article

Bigger Is Better, Sometimes: The Interaction between Body Size and Carcass Size Determines Fitness, Reproductive Strategies, and Senescence in Two Species of Burying Beetles

1
Department of Biology, Brigham Young University, Provo, UT 84602, USA
2
Department of Biology, Grinnell College, Grinnell, IA 50112, USA
3
Department of Biological Sciences, Purdue University Northwest, Hammond, IN 46323, USA
*
Author to whom correspondence should be addressed.
Diversity 2021, 13(12), 662; https://doi.org/10.3390/d13120662
Submission received: 24 November 2021 / Revised: 8 December 2021 / Accepted: 10 December 2021 / Published: 11 December 2021
(This article belongs to the Special Issue 2021 Feature Papers by Diversity’s Editorial Board Members)

Abstract

:
The cost of reproduction hypothesis suggests that allocation to current reproduction constrains future reproduction. How organisms accrue reproductive costs and allocate energy across their lifetime may differ among species adapted to different resource types. We test this by comparing lifetime reproductive output, patterns of reproductive allocation, and senescence between two species of burying beetles, Nicrophorus marginatus and N. guttula, that differ in body size, across a range of carcass sizes. These two species of burying beetles maximized lifetime reproductive output on somewhat different–sized resources. The larger N. marginatus did better on large and medium carcasses while the smaller N. guttula did best on small and medium carcasses. For both species, reproduction is costly and reproduction on larger carcasses reduced lifespan more than reproduction on smaller carcasses. Carcass size also affected lifetime reproductive strategies. Each species’ parental investment patterns were consistent with terminal investment on carcasses on which they performed best (optimal carcass sizes). However, they exhibited reproductive restraint on carcass sizes on which they did not perform as well. Reproductive senescence occurred largely in response to carcass size. For both species, reproduction on larger carcasses resulted in more rapid senescence. These data suggest that whether organisms exhibit terminal investment or reproductive restraint may depend on type and amount of resources for reproduction.

1. Introduction

For iteroparous organisms, fitness is maximized through balancing current reproductive effort with future reproductive opportunities [1]. When an organism allocates resources to current reproduction, that energy is unavailable for somatic maintenance, growth, or future reproduction. Because of this tradeoff, organisms are expected to balance current and future reproduction to maximize total lifetime reproductive output [2,3,4,5]. As individuals age, this balance between current and future reproduction shifts, which potentially causes a change in how they allocate resources for reproduction. Two general patterns of reproductive resource allocation have been predicted. First, older individuals invest terminally in reproduction because future opportunities are unlikely (the terminal investment hypothesis [6]). Second, individuals decrease investment in reproduction as they age to increase the likelihood of additional breeding opportunities (reproductive restraint hypothesis [7]). However, it is not clear under what circumstances selection will favor one or the other of these allocation strategies.
Inherent in the tradeoff between current and future reproduction is the cost of reproduction and the onset of senescence [1]. As a consequence of patterns of reproductive allocation and aging, organisms experience variation in the rate of senescence [6,7]. Reproduction at an early age and high levels of allocation typically lead to earlier onset of senescence; whereas, later reproduction and decreased allocation to reproduction results in delayed senescence [8]. In addition to the timing and level of allocation to reproduction, availability and type of resources for consumption can influence onset and rates of senescence [9]. How resource type and availability interacts with patterns of reproductive allocation to modify onset and rates of senescence is less well studied.
Organisms are adapted to use specific types of resources for reproduction, and the type and quantity of resources available may determine how an organism allocates to reproduction over a lifetime and the resulting rate of senescence. Optimal resource type and availability should result in maximization of fitness measured as number of offspring over a lifetime. Availability of optimal resources may ameliorate the tradeoff inherent in the cost of reproduction hypothesis and allow allocation of energy to both current and future reproduction [9] while delaying senescence. Conversely, optimal resources for reproduction may require additional effort to acquire and process, as well as defend from competitors [10]. As such, optimal resources for reproduction may come with additional costs of acquisition that are not embodied in the traditional current versus future reproduction tradeoff. Thus, it is unclear how resource type and availability affect reproductive allocation and senescence, and strategies of allocation may depend on matching between species–specific adaptations and type and availability of resources.
Can adaptation to specific resource types and the availability of those types influence the way individuals allocate to reproduction and experience senescence across their lifetime? Patterns indicative of terminal investment [11,12,13,14,15,16,17,18,19,20,21,22] and reproductive restraint [11,12,14,20,21,22,23,24,25,26,27,28] have been documented in several taxa. Some taxa may exhibit both patterns as either a direct or indirect response to environmental conditions [8]. For instance, in the burying beetle, N. orbicollis, females exhibited terminal investment patterns on larger carcasses, but not on smaller carcasses [15], and the degree to which terminal investment occurs in this species was dependent on previous reproductive experience [12]. Male mealworm beetles (Tenebrio molitor) changed reproductive strategies depending on the availability of food; they exhibited terminal investment in the absence of food, and were more restrained in reproduction when food resources were readily available [19]. Different populations of alpine chamois (Rupicapra rupicapra) showed patterns consistent with both terminal investment and reproductive restraint; males in two populations had smaller reproductive effort late in life (suggesting restraint), while males in a third population had greater reproductive effort late in life (suggesting terminal investment [20]). Taken together, these studies suggest that the pattern of reproductive allocation over a lifetime may depend on the availability of optimal resources for reproduction. In conditions where optimal resources are rare or not available, organisms may exhibit reproductive restraint to maximize reproductive lifetime; whereas, under conditions where optimal resources are available, organisms will exhibit terminal investment [29,30]. Thus, type and availability of resources may account for some of the wide variation in observed patterns of reproductive allocation within and among species.
Burying beetles (genus Nicrophorus) are model organisms for studies of reproductive allocation over a lifetime and senescence because of their use of discrete, quantifiable resources in reproduction, and their ease of manipulation in the laboratory. Burying beetles reproduce exclusively on small vertebrate carcasses where they provision offspring through post–hatching parental care [31]. Reproductive allocation is unambiguous because both adults and offspring feed on the same carcass, and thus the number of offspring represents allocation to current reproduction and the change in mass of the resident parents represents allocation to future reproduction [15]. Burying beetles can use a range of carcass sizes from only a few grams to several hundred grams and brood size and offspring body size typically increase with carcass size. Thus, for burying beetles, carcass size represents a quantifiable measure of resource quality [10,32,33]. Typically, larger species are reproductively more successful on larger carcasses, while smaller species are reproductively more successful on smaller carcasses [10]. Because of their ability to breed on a range of carcass sizes, and the range of body sizes found among species of burying beetles, we can use them to experimentally determine optimal carcass sizes for each species and then evaluate effects of carcass size on lifetime patterns of reproductive allocation and senescence.
In this paper, we compare two species of burying beetles to address two fundamental questions about reproductive allocation and reproductive senescence and the relationship to carcass size. First, are species adapted to specific carcass sizes as measured by the lifetime number of offspring produced, or are bigger carcasses always better for maximizing the number of offspring over a lifetime? For burying beetles, we predict that optimal carcass size (i.e., the size that results in the greatest number of offspring over a lifetime) should scale with body size of the beetle; thus, optimal carcass size should be larger for larger–bodied species. Second, do burying beetles that are reproducing on optimal carcass sizes exhibit a different pattern of reproductive allocation over a lifetime compared with those reproducing on non–optimal carcass sizes? Specifically, we predict that beetles reproducing on optimal carcass sizes will engage in terminal investment strategies and experience earlier reproductive senescence, and beetles reproducing on non–preferred carcass sizes will engage in reproductive restraint and experience delayed reproductive senescence. We test these predictions by comparing reproductive allocation and patterns of reproductive output between two species of burying beetles, N. marginatus and N. guttula, across a range of carcass sizes. We chose these two species because they are phylogenetically similar (N. marginatus is the outgroup to the sister species N. guttula and N. obscurus [34]): they overlap in their distribution and co–occur in the same habitats [35,36]; however, they differ somewhat in body size in the wild (N. marginatus mean pronotum width: 6.75, SE = 0.06, n = 232; N. guttula mean pronotum width: 6.07, SE = 0.07, n = 116; A. N. Smith, unpublished data from populations in this study).

2. Materials and Methods

2.1. Burying Beetle Natural History

Burying beetles locate small vertebrate carcasses and use them as food resources for themselves and their offspring. Males and females compete with individuals of the same sex until a single pair, typically those with the largest body sizes, dominate the carcass [37,38]. Similar to within species competitive dynamics, larger species will displace smaller species when they co–occur on a carcass [10,31]. The winning pair of beetles buries the carcass under the soil, removes the feathers or hair, shapes the carcass into a ball, and coats it with oral and anal secretions that help prevent microbial growth. During carcass preparation, the female lays eggs in the soil, and larvae usually hatch on or after the fourth day. Parents adjust brood size through filial cannibalism, regurgitate food to newly hatched larvae, and provide defense of the carcass and larvae from conspecifics. Parental care continues until larvae disperse into the soil to pupate [31].

2.2. Experimental Design

We collected both N. marginatus and N. guttula at Goshen Ponds (39°57.476′ N, 111°51.426′ W) and Utah Lake Wetland Preserve (40°6.933′ N, 111°47.589′ W) in central Utah during June 2011 and July 2012 using pitfall traps baited with aged chicken. We transported beetles back to Brigham Young University and established laboratory populations for each species by breeding wild–caught pairs on a 30 g carcass. We kept newly eclosed offspring in small plastic containers (11.3 cm L × 7.6 cm W × 5.7 cm H), provided them ad libidum raw chicken liver, and maintained them on a 14L:10D cycle (a natural photoperiod for the summer breeding season at the source location). Beetles used in this experiment were F1, F2, and F3 individuals, and all crosses used different family lines to ensure no inbreeding occurred.
At 28 days (±1 day) from eclosion, we randomly assigned females from both species to one of six carcass size treatments and one nonreproductive treatment (12 replicates for each treatment for a total of 84 females of each species). In six of the treatments, we allowed females to reproduce throughout their lifetime on one of six carcass sizes (5 g, 10 g, 20 g, 30 g, 40 g, or 50 g, ±1.0 g lab mouse carcasses; this range in size covers the range of carcass sizes available in the natural environment). For each reproductive bout, we placed each female with a virgin male (at least 21 days old, to ensure sexual maturity) on a carcass of their assigned size in a plastic container (20.3 cm L × 15.2 cm W × 9.8 cm H) filled with approximately 4.5 cm (depth) of commercially purchased topsoil and allowed them to reproduce. After 48 h, we removed males from the carcass to isolate the reproductive investment patterns of females (males were present only during the beginning of the carcass preparation phase). At the end of each reproductive attempt (defined as the point when all larvae dispersed from the carcass into the soil), we removed the females, placed them each in a small, individual container, and provided them with a moistened paper towel for water and chicken liver ad libidum. After 48 h, we placed females on a new carcass (of the same size as their previous reproductive attempt) with a virgin male and allowed them to produce offspring. This cycle was repeated until the female died. To assess effects of reproduction on lifespan, our seventh treatment was a “non–reproducing” treatment where females were fed on chicken liver (0.5 g to 1 g twice per week), but were not allowed to breed throughout their life.
For each treatment, we weighed females and measured their pronotum width at 28 days of age (±1 day), and when the female died we recorded her lifespan. For the six reproducing treatments, we weighed females before and after each reproductive attempt. We monitored each female and her brood daily to determine brood size and timing of larval dispersal. If, after 7 days, no offspring had appeared on the carcass, we designated the brood as a failure, and removed the female, gave her food, and isolated her for 48 h, then allowed her to breed again on a fresh carcass with a new virgin male. We recorded the initial and final number of offspring and mass of offspring as they dispersed into the soil for each reproductive attempt.

2.3. Statistical Analyses

2.3.1. Analysis of Optimal Carcass Size

Our first goal in the experiment was to determine optimal carcass sizes for each species. We defined “optimal” as the carcass size that resulted in the greatest number of offspring produced over a lifetime. To determine optimal carcass size, we used a general linear model to examine the effects of carcass size and species on lifetime number of offspring (GLM procedure; SAS 9.3 SAS Institute, Cary, NC, USA). In the model, carcass size and species were main effects, and we included an interaction between carcass size and species, and standardized female body size (pronotum width) as a covariate. As noted above, body size varies between the two species. We were interested in effects of body size within each species, and we did not want to confound differences in body size between species with within species variation, so we standardized body size across species by creating a z–score centered on the mean of each species. The response variable, lifetime total number of offspring, was log transformed to meet assumptions for the parametric model. One N. guttula female from the 20 g carcass size never reproduced and was removed from all analyses.
Total mass of offspring over the lifetime (i.e., total number of offspring multiplied by mean offspring mass per brood) is sometimes used to represent evolutionary fitness. We analyzed patterns of total mass of offspring over a lifetime using the same model as that used for total number of offspring. Results were consistent with results obtained from total number of offspring, so we present only total number of offspring in this paper.

2.3.2. Analysis of Patterns of Reproductive Allocation

Our second goal was to determine if reproductive allocation and resulting senescence followed a pattern of terminal investment or reproductive restraint. We used four response variables to characterize contrasting patterns of reproductive allocation as follows: lifespan, lifetime number of reproductive bouts, mass change of females through time, and proportion of offspring culled through time. Terminal investment would be characterized by shorter lifespans, fewer reproductive bouts, negative or neutral mass gain, and fewer offspring culled at older ages. In contrast, reproductive restraint would be characterized by longer lifespans, more reproductive bouts, positive mass gain, and more offspring culled at older ages.
To test for differences in lifespan, we used a general linear model (GLM procedure; SAS 9.3 SAS Institute, Cary, NC, USA) and for differences in number of reproductive bouts we used a generalized linear model (GenMod procedure; SAS 9.3 SAS Institute, Cary, NC, USA). For each model, carcass size and species were main effects, and we included an interaction between carcass size and species, and standardized female body size (pronotum width) as a covariate. As noted above, body size varies between the two species. We were interested in effects of body size within each species and we did not want to confound differences in body size between species with within species variation, so we standardized body size across species by creating a z–score centered on the mean of each species. The non–reproducing treatment was only included in the model for lifespan. Data for lifespan met the assumptions of the parametric model and was not transformed. For the number of successful reproductive bouts, we assumed a Poisson distribution and used a log–link function.
To test for differences in mass change and proportion brood culled within lifetimes, we used a generalized linear mixed model (GLMM; GLIMMIX procedure; SAS 9.3 SAS Institute, Cary, NC, USA). Mass change was measured as mass of female at the end of the reproductive bout minus mass of the female at the beginning of the reproductive bout. Mass loss would be observed as a negative number and mass gain would be positive. Mass change is a continuous variable, and raw data met assumptions for a parametric model, so no transformations were used. Proportion brood culled was measured as number of offspring culled relative to initial brood size, so we assumed a binomial distribution with a logit–link function. We used a repeated measures design to analyze patterns of allocation through time. Species, carcass size, and age (indexed by reproductive bout) were predictor variables (i.e., main effects). We used standardized female body size as a covariate and included all two–way and three–way interactions among main effects. A single N. guttula female never reproduced and thus we removed her from all analyses. Because we had multiple measures of the same individual through time, individual ID was used as a random effect in the model.

2.3.3. Analysis of Patterns of Reproductive Senescence

To assess patterns of reproductive senescence, we used three response variables as follows: initial brood size, final brood size, and offspring body mass at dispersal. An increased rate of senescence would be characterized by a negative slope of initial offspring number and final offspring number with increasing age; whereas, a decreased rate of senescence or delayed senescence would be characterized by a zero slope of initial offspring number and final offspring number with increasing age. Because both the female and the offspring feed exclusively on the carcass during brood development, fewer offspring should result in larger offspring body size. Thus, senescence would result in fewer but larger offspring in older individuals; whereas, delayed senescence would result in about the same number and size of offspring with increasing age.
To test for differences in initial brood size, final brood size, and individual offspring mass within lifetimes we used generalized linear mixed models (GLMM; GLIMMIX procedure; SAS 9.3 SAS Institute, Cary, NC, USA). We ran separate models for each of the three response variables. Initial brood size was the number of larvae that first appeared on the carcass before culling had occurred. Final brood size was the number of larvae that dispersed into the soil and represents the brood size after culling has occurred. For each trait we used a repeated measures design to analyze patterns of senescence through time. Species, carcass size, and reproductive bout (age) were predictor variables (i.e., main effects). We used standardized female body size as a covariate and included all two–way and three–way interactions. For both initial and final brood sizes, we assumed a Poisson distribution and used a log–link function. Offspring mass was a continuous variable, so we used a log–link function. Because we had multiple measures of the same individual through time, individual ID was used as a random effect in the model. A single N. guttula female never reproduced and thus we removed her from all analyses. In addition, we removed two bouts from a single female from the analysis for mean offspring mass because in each bout, only two offspring were produced and they were abnormally small (1/5 the size of any other offspring).

3. Results

3.1. Optimal Carcass Size

Lifetime number of offspring differed by species, carcass size, and their interaction, but not by body size (Table 1). The number of offspring for N. marginatus increased with carcass size up to 20 g and then plateaued on larger carcass sizes. Lifetime number of offspring on carcasses 20 g or greater was about three times that on 5 g carcasses and nearly double that on 10 g carcasses (Figure 1). Number of offspring for N. guttula peaked on 10 g and 20 g carcasses and declined on carcasses larger than 20 g. Lifetime number of offspring on 10 g and 20 g carcasses was about double that on larger or smaller carcasses (Figure 1).

3.2. Patterns of Reproductive Allocation

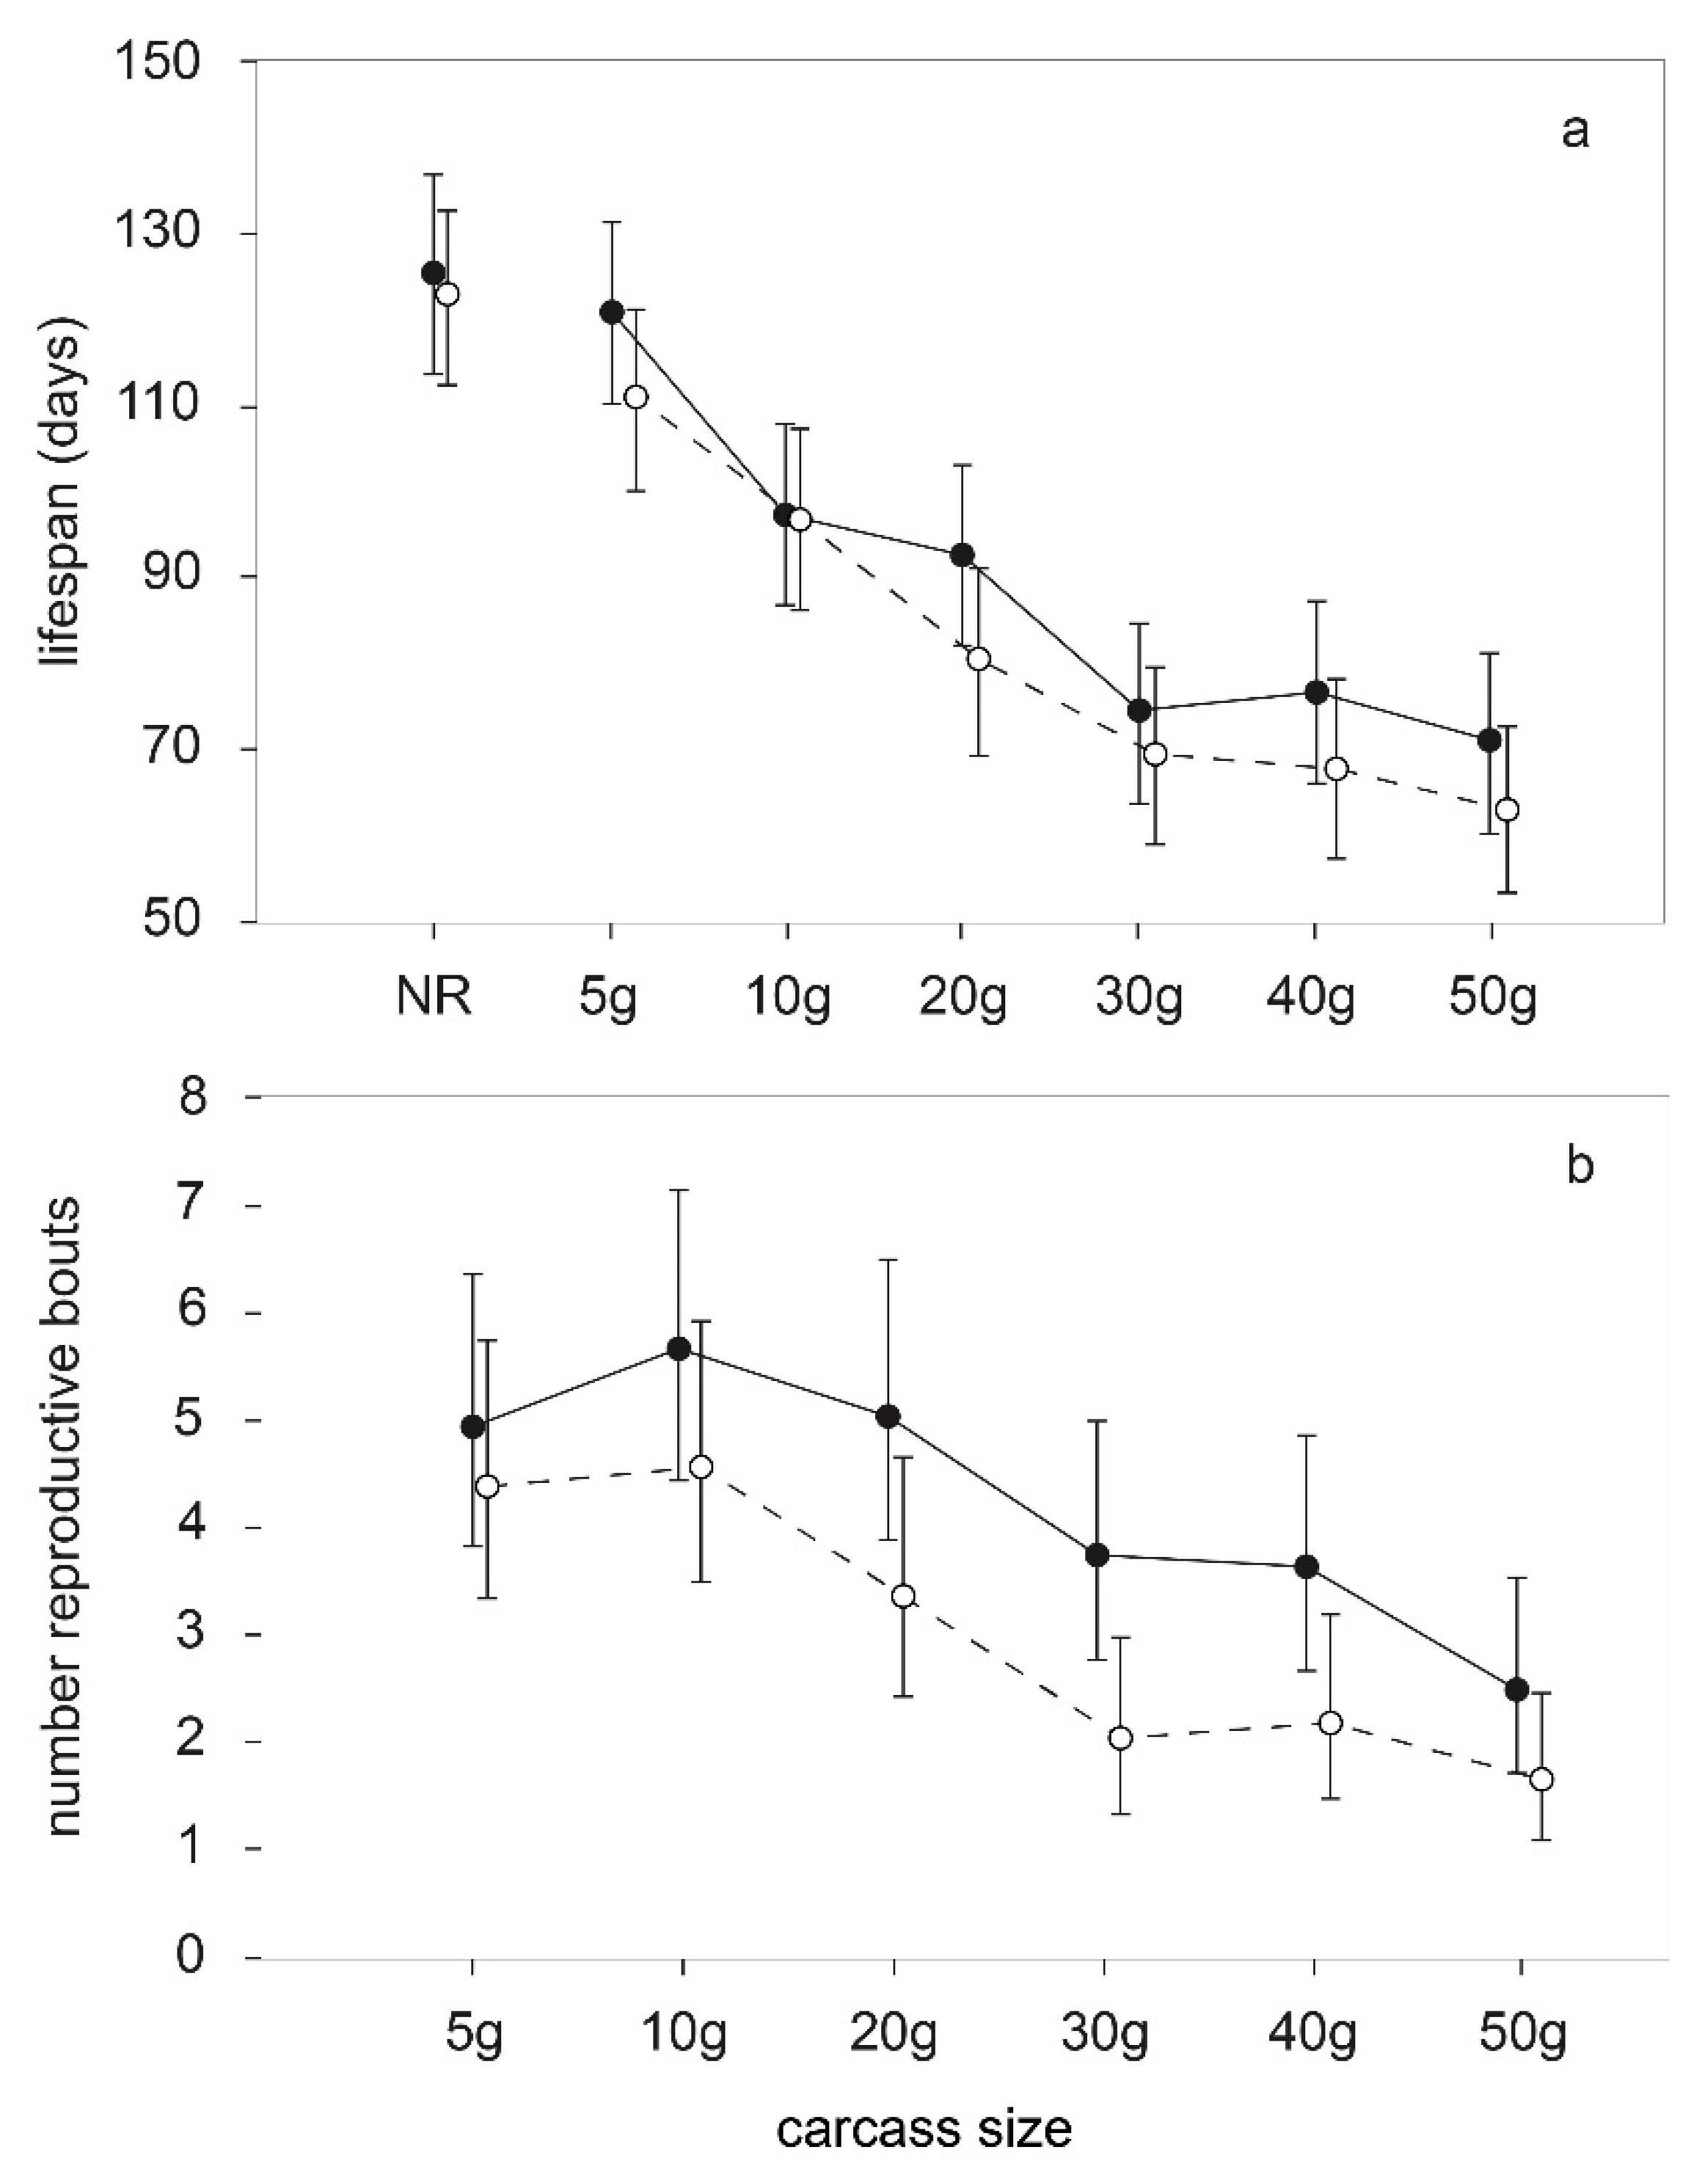
Lifespan differed significantly between species, among carcass size treatments, and by body size, but the interaction between species and carcass size was not significant (Table 2). On average, N. marginatus lived slightly longer than N. guttula, and the difference was most pronounced on carcass sizes ≥ 20 g. Across both species, beetles that reproduced on smaller carcasses lived longer than those on larger carcasses and non–reproducing individuals lived the longest at about 120 days. Lifespan declined with carcass size until carcass size equaled 30 g at which lifespan was about 70 days. However, there was no decline in lifespan on carcasses ≥ 30 g (Figure 2a). On average, the largest individuals lived about 30 days longer than the smallest individuals within both species and across all carcass size treatments.
The number of successful reproductive bouts differed by species and among carcass size treatments, but not by body size. The interaction between species and carcass size treatment was not significant (Table 3). For N. marginatus, the number of successful reproductive bouts was highest and about equal for 5 g to 20 g carcasses, dropped by about 1 for 30 g and 40 g carcasses, and dropped again for 50 g carcasses. For N. guttula, the number of successful reproductive bouts was highest and about equal for 5 g and 10 g carcasses, dropped by about 1 for 20 g carcasses, and dropped again and was about equal for 30 g to 50 g carcasses. On average, N. marginatus had about 1.5 more successful reproductive bouts than N. guttula across all carcass sizes (Figure 2b).
The change in mass of females was not significantly affected by main effects or interactions among main effects or the covariate, female body size (Table 4). Change in mass varied widely among individuals and no patterns were evident between species, among carcass sizes, or with age (Figure 3a,b).
The proportion of brood culled differed significantly by species, carcass size, and by age. Moreover, the interaction between species and carcass size was significant, and the three–way interaction was marginally significant (Table 4). For N. marginatus on small carcasses (5 g and 10 g) the proportion of the brood culled was higher and remained high with increasing age; however, on larger carcasses (20 g to 50 g) the proportion of the brood culled decreased with increasing age (Figure 3c). In N. guttula on 5 g and 10 g carcasses the proportion of brood culled was high to begin with but declined with age and on 20 g and 30 g carcasses the proportion of brood culled was intermediate to begin with but declined with age; however, on 40 g and 50 g carcasses the proportion of the brood culled was lower to begin with and remained constant or increased with age (Figure 3d).

3.3. Patterns of Reproductive Senescence

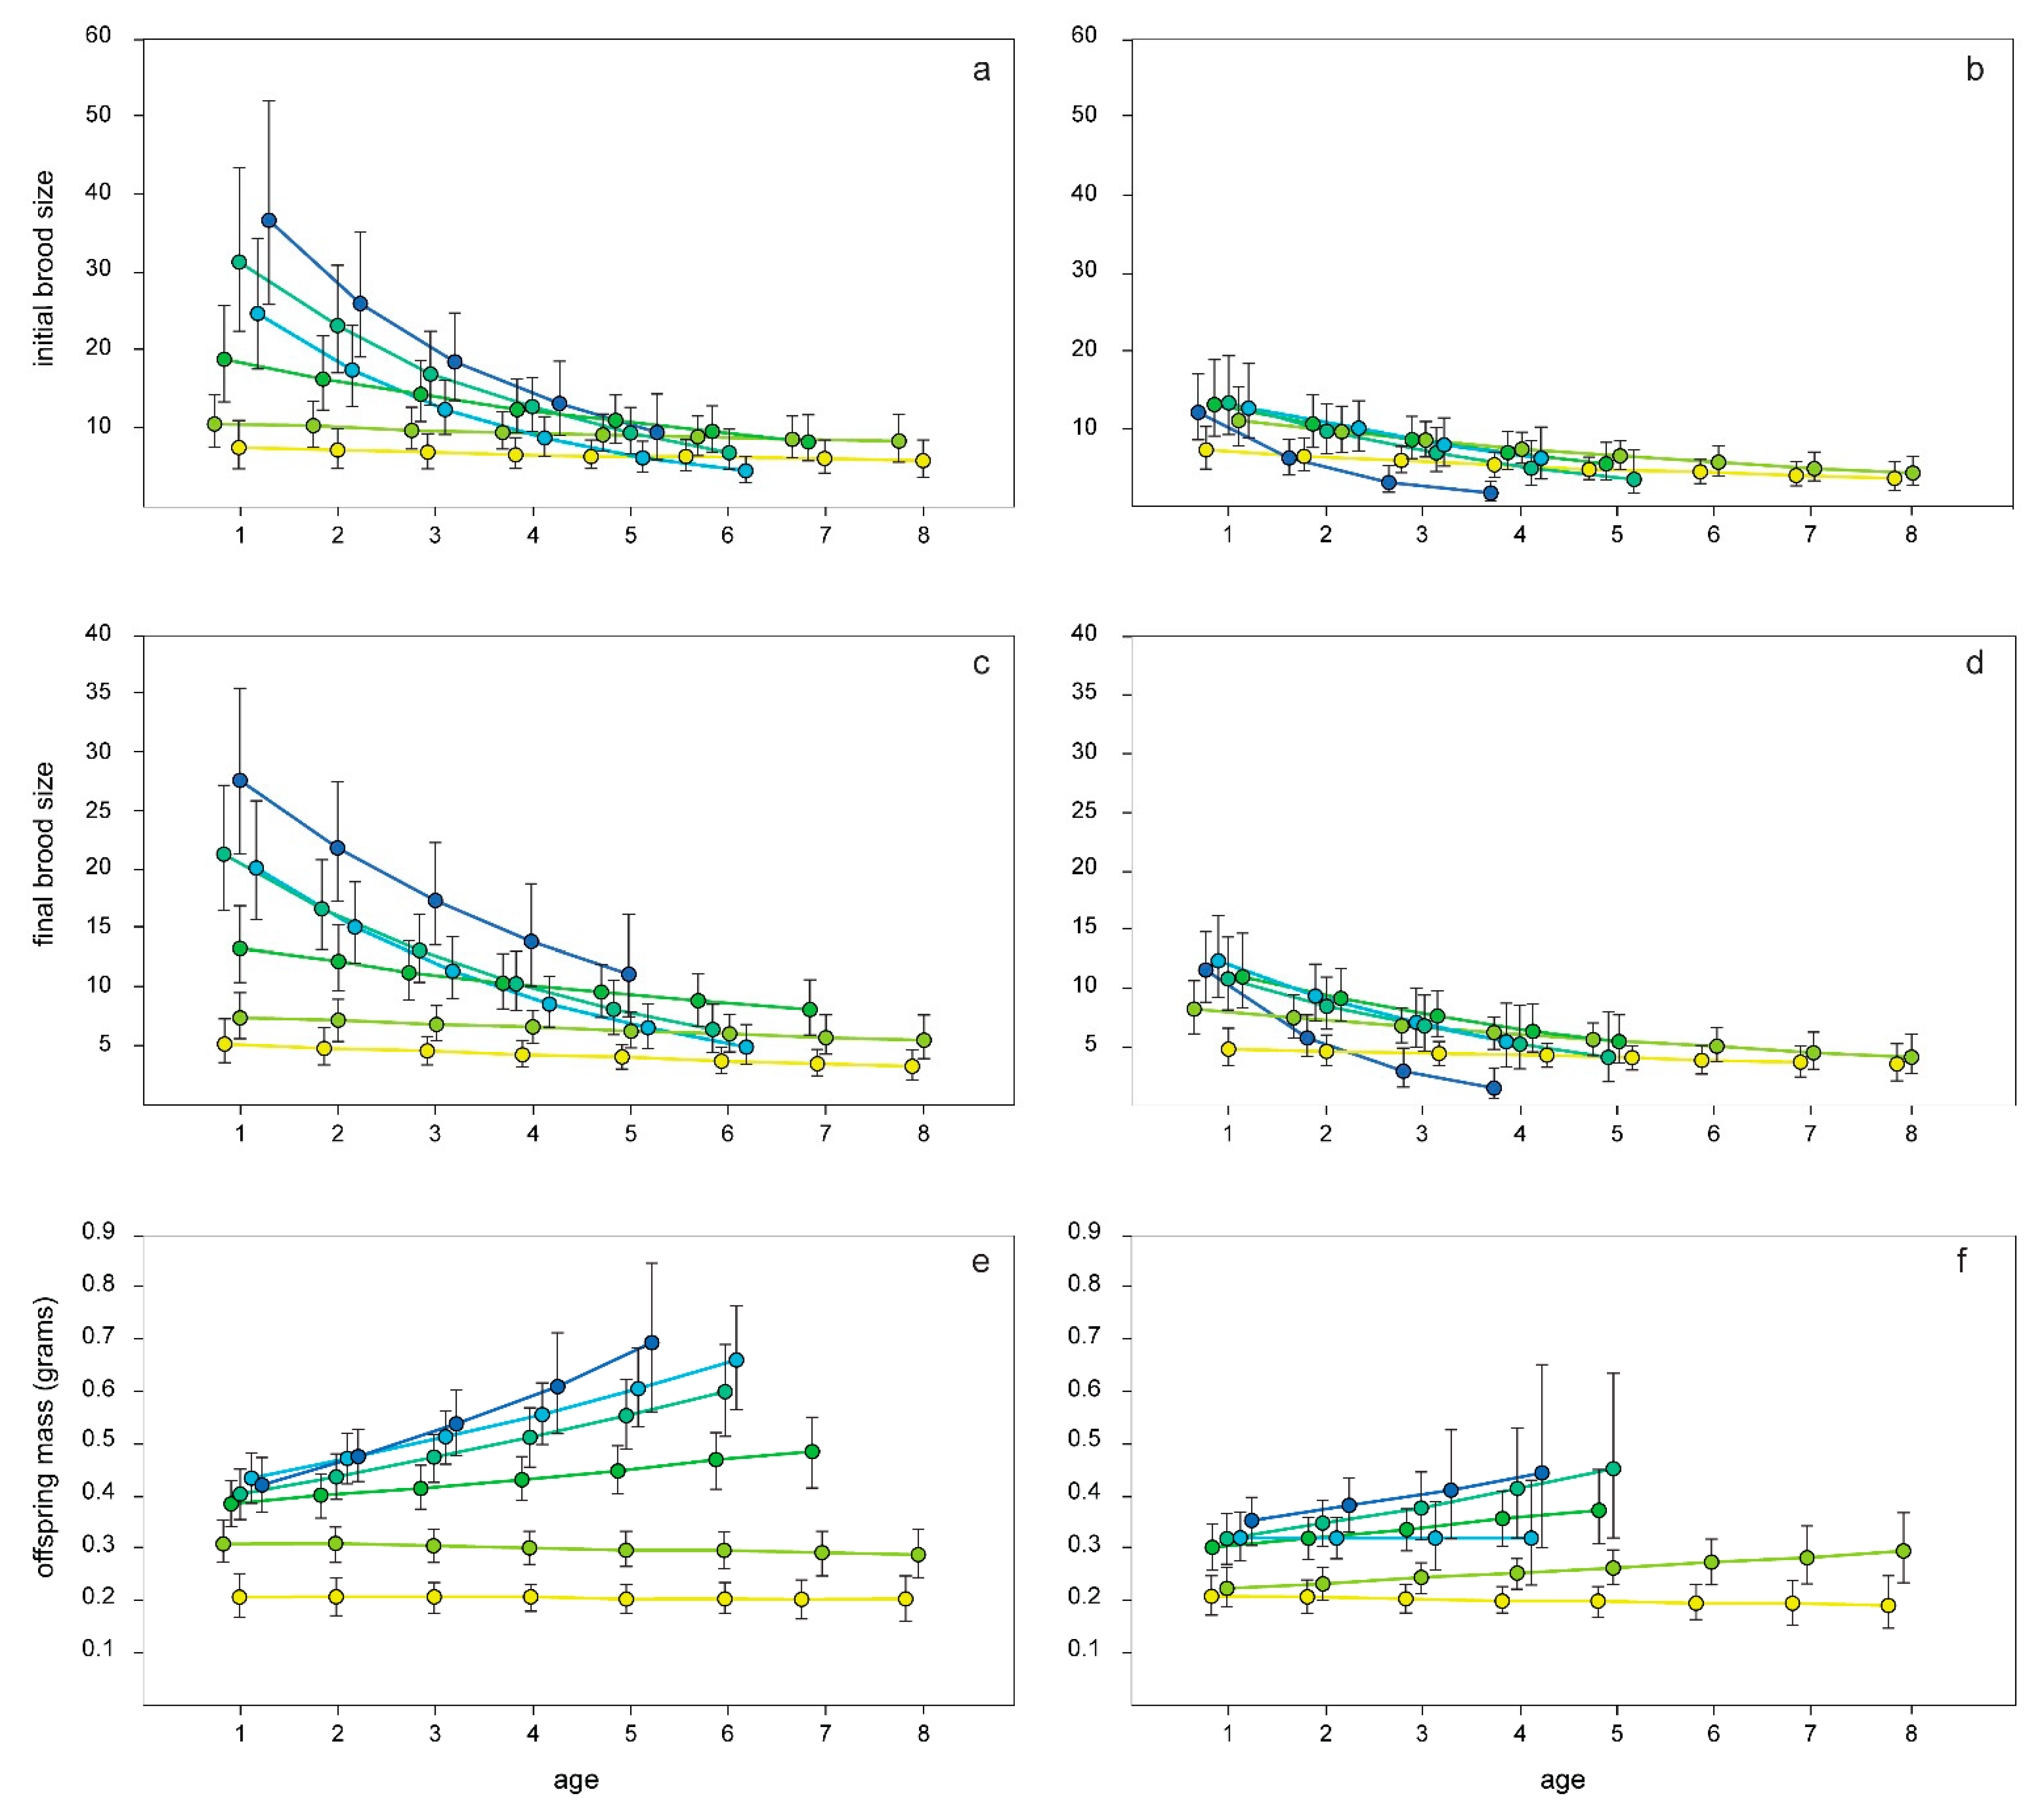
Initial brood size differed significantly by species, among carcass sizes, and with age. Moreover, the interaction between species and carcass size, the interaction between species and age, and the interaction between age and carcass size were all significant (Table 5). Females on larger carcasses tended to produce larger initial broods than females on smaller carcasses at early ages (Figure 4a,b). Initial brood size for N. marginatus stayed relatively constant with age at the lowest carcass sizes (5 g and 10 g) but dropped with increasing age for larger carcass size treatments (Figure 4a). For N. guttula, initial brood size decreased with age for every carcass size treatment and the rate of decrease was greater as carcass size increased (Figure 4b). Initial brood size was about equal between N. marginatus and N. guttula on the smallest two carcass sizes. However, initial brood size on larger carcasses at early ages was substantially larger in N. marginatus compared with N. guttula.
Mean offspring mass differed significantly between species, among carcass sizes, and by age. The interaction between age and carcass size was also significant (Table 5). For both species, mean offspring mass increased with age (except for 5 g and 10 g carcasses for N. marginatus and 5 g carcasses for N. guttula), and mean offspring mass increased with age at a greater rate for females breeding on larger carcasses (Figure 4e,f). Offspring mass was similar between N. marginatus and N. guttula on the smallest carcass size, but larger in N. marginatus at all larger carcass sizes.

4. Discussion

N. marginatus and N. guttula achieve the highest fitness on different–sized carcasses. The larger N. marginatus had higher lifetime reproductive success on medium and large carcasses (carcasses ≥ 20 g), and N. guttula had highest lifetime reproductive success on small and medium carcasses (10 g and 20 g carcasses). On larger carcasses, female N. marginatus survived longer and for more reproductive bouts than did N. guttula, although both species had similar lifespans and number of reproductive bouts on small carcasses. Similarly, N. marginatus was able to take advantage of carcasses ≥ 30 g by producing broods equal in size to those produced on 20 g carcasses; whereas, brood sizes produced by N. guttula declined on carcasses ≥ 30 g and varied less across the range of carcass sizes. Brood sizes on the smallest carcasses were similar between the species. Thus, optimal carcass size for the larger N. marginatus was large and medium carcasses (≥20 g), and optimal carcass size for the smaller N. guttula was small and medium carcasses (10 g and 20 g, but not the smallest, 5 g size). Interestingly, the 20 g carcass size was included in the optimal carcass sizes for both species, indicating partial overlap in optimal carcass sizes between species. Differences in optimal carcass sizes between the two species suggest they have markedly different reproductive and competitive strategies.
Female N. marginatus and N. guttula differed considerably in their reproductive allocation strategies (i.e., terminal investment versus reproductive restraint). On small and medium carcasses (5 g, 10 g, 20 g, and 30 g), N. guttula females culled a smaller proportion of their brood as they aged, suggesting that they were investing more into each reproductive bout (i.e., terminal investment) whereas N. marginatus females tended to cull a constant proportion of their broods as they aged on the two smallest carcasses (5 g and 10 g) indicating reproductive restraint. Conversely, on the largest two carcass sizes (40 g and 50 g), N. guttula culled a constant or increasing proportion of their broods with age (i.e., reproductive restraint), while N. marginatus decreased the proportion of the brood culled with age on 20 g, to 50 g carcasses (terminal investment). Thus, both species behaved much less conservatively (i.e., more likely to incur reproductive costs) on the carcass sizes with which they performed best and more conservatively on carcass sizes with which they normally performed worst. Consistent with our hypothesis that each species is adapted for different carcass sizes, their differing investment patterns are likely due to their species–specific adaptation to different carcass sizes. Work with N. orbicollis has demonstrated a similar pattern of resource–quality based reproductive investment. On smaller carcasses, N. orbicollis initially invests more in body maintenance and less in offspring, and on larger carcasses, it invests less in body maintenance and more in offspring [12,15]. The pattern shifts to increased investment in offspring as the female ages across carcass sizes [15], although the degree to which this shift occurs is dependent on previous experience [12]; N. orbicollis females invested more into reproduction when presented with a large carcass if they had first reproduced on a smaller carcass, but were more conservative in reproduction if they only reproduced on small carcasses or were given a small carcass after having reproduced on a large carcass [12]. Work with mealworm beetles similarly confirms the importance of resources in determining reproductive strategies. When immune challenged, starved male mealworm beetles suppressed their immune response and invested more heavily into pheromones to increase attractiveness to females, while males fed food ad libitum acted much more conservatively when immune challenged [19]. Our study and the others we have highlighted here suggest general consistency with the dynamic terminal investment threshold model [8]; however, in our study the external factor that determines whether individuals exhibit terminal investment or reproductive restraint is carcass size relative to optimal carcass sizes.
Mass change of the female during a reproductive bout has been shown in N. orbicollis to vary based on carcass size and the resulting reproductive strategy [15]. Female N. orbicollis on 30 g carcasses exhibited negative mass change with increasing age; whereas, females on 20 g carcasses exhibited positive or neutral mass change with increasing age 15]. We expected to see similar patterns in our study. We predicted that females exhibiting terminal investment on preferred carcass sizes would be characterized by negative or neutral mass change, and females exhibiting reproductive restraint on non–optimal carcass sizes would be characterized by positive mass change. However, mass change in the two species in our study varied widely among individuals in all treatments but did not vary significantly with any of the experimental predictors. Rather, the proportion of the brood culled appears to be the main mechanism whereby terminal investment or reproductive restraint is realized. In burying beetles, proportion of the brood culled has been suggested to vary based on the size of the carcass as a mechanism for matching brood size to carcass size to avoid errors of over or under allocation [10,15,31]. However, our study suggests that the rate of culling the brood is also an indication of reproductive strategy across a female’s lifetime.
Our results suggest that differences in allocation patterns observed across populations and species in a number of other taxa may be a result of differential adaptation to and use of varying resource qualities. For example, older female alpine chamois were less likely to reproduce in “poor” years (“poor” being indicated by adult mortality) even when weighing more than younger females, suggesting that such strategies may be tied to resource abundance or resource quality [27]. Male alpine chamois exhibited different patterns of late–life allocation based on population [20]. Competition between male chamois is intense, with males losing up to 28% of their body mass during the breeding season [20]. In two populations, males peak in reproductive effort (as measured by mass loss during the breeding season) and then decrease reproductive effort as they age, suggesting that older males are restraining reproduction [20]. Males in a third population exhibited the opposite pattern, with older males terminally investing by increasing reproductive effort [20]. While resource qualities were not explicitly tied to these patterns, Mason et al. [20] did observe that the third population’s environment is more calcareous, suggesting that the plant community may be a more nitrogen–rich resource than in the other two environments. Thus, males in the third population may be simply taking advantage of increased resource quality, or they may be better adapted to their environment. Neither of these experiments explicitly tested for the effect of resource quality on reproductive allocation. Thus, how resource quality leads to one or the other strategy is not necessarily clear. Our study is the first to demonstrate the effect that resource quality and species–specific adaptation to different resources has on lifetime patterns of reproductive allocation.
Reproduction is costly for both N. marginatus and N. guttula. Females that did not reproduce lived longer than those that reproduced, and lifespan and number of reproductive bouts decreased with increasing carcass size, suggesting that reproduction on larger carcasses may incur greater reproductive costs than on smaller carcasses. Resource quality also affected the rate of senescence. Both species had declining brood sizes on larger carcasses as they aged, although the rate at which brood sizes declined varied between species. Brood sizes of N. marginatus on larger carcasses declined more rapidly across bouts than N. guttula. However, N. marginatus initially produced significantly larger broods on larger carcasses. The pattern of declining brood size in later reproductive bouts observed in this study is consistent with previous work on N. orbicollis [12,15]. Interestingly, both species in our study reach a similar limit on the decline in lifespan on carcasses ≥ 30 g. Lifespans of these two species are remarkably similar to those observed in N. orbicollis [15]. Even though the two species in this study showed substantially different patterns of allocation and reproductive output on larger carcasses, the lower limit on lifespan of reproducing females is quite similar. Reproductive females may reach a limit where they are providing all they can to reproduction and further increases in time or energy are simply not possible. Handicap experiments that focus on changes in reproductive effort with reduced effort of the partner come to a similar conclusion [39]; females cannot increase reproductive effort to fully compensate for lack of male effort because they are already expending energy and time at a maximal level [39]. Interestingly, senescence does not follow the same pattern as fitness (lifetime number of offspring), especially in N. guttula. For both species, larger carcasses incur a progressively larger cost, but do not yield increased reproductive output.
With lower fecundity, how does N. guttula persist in this area with N. marginatus? Nicrophorus marginatus is larger than N. guttula and likely outcompetes N. guttula in competitive interactions on carcasses. Additionally, N. marginatus had more and larger offspring than N. guttula on all but the smallest carcass sizes (5 g and 10 g). Burying beetles segregate niches to avoid competitive interactions on a number of different axes (seasonal activity, habitat preference, resources; [40,41,42,43,44,45,46]). One such case is N. defodiens, a smaller burying beetle species, which is often displaced from larger carcasses by the larger N. orbicollis, but is successful on small carcasses, likely due to a higher finding and processing efficiency on smaller carcasses [41]. Because reproductive potential is much greater on larger carcasses, N. marginatus may simply ignore small carcass sizes in nature, and N. guttula may have uncontested access to these small carcasses. This is consistent with recent results seen intraspecifically in N. vespilloides, where large individuals tended to use large carcasses for reproduction but disproportionately rejected smaller carcasses [46]. Small mammal abundances may also favor sizes preferred by N. guttula. For example, deer mice (Peromyscus maniculatus) are within the size range used efficiently by N. guttula and were the most abundant small mammal in nearby Juab County, UT, in similar habitat to our study [47]. Increased numbers of these smaller carcasses may decrease competitive interactions between the two species and allow for N. guttula to persist despite lower reproductive output on these carcass sizes.
It is interesting to note that N. guttula appears to be incapable of producing large numbers of offspring, even on large carcasses. This may suggest that in the natural, selective environment, there is little opportunity for N. guttula to successfully find, compete for, and use large carcasses for reproduction. It also suggests that N. guttula may be a brood parasite on N. marginatus on larger carcasses. A previous study tested the potential for brood parasitism in N. guttula [48] and indicated that there is some probability, albeit low, that N. guttula could be successful as a brood parasite. In addition, the well–developed ability of N. marginatus to detect and differentially cull brood parasites suggests an evolutionary history of brood parasitism from N. guttula or other species of burying beetles [48].
The reduced fecundity of N. guttula relative to N. marginatus seems to be a species–specific effect unrelated to body size because even small–bodied N. marginatus that would be similar in size to medium–sized N. guttula produce far more offspring on larger carcasses. This comparison suggests that although body size may be an important differentiating trait between these two species, it does not account for most of the differences we observed. As further confirmation of this idea, we reran the three lifetime analyses (Figure 1 and Figure 2) using raw size values, rather than standardized values within species, as the covariate. Results for lifetime number of offspring and lifetime number of reproductive bouts were unchanged when using raw values of body size as the covariate; species was a significant predictor, but body size was not. In the case of lifespan as the response variable, the initial analysis, with standardized size as a covariate, showed both species and standardized size as significant predictors, and we reported that the largest individuals lived about 30 days longer than the smallest (standardized) individuals. When we used raw size scores for the covariate, species was no longer a significant effect, but body size was still a significant effect on lifespan. Similar to the effect of standardized body size, the largest individuals lived about 30 days longer than the smallest (raw size values) individuals. This suggests that all of the variation in lifespan between species can be accounted for by body size, but that most of that variation is observed within species rather than between species.
It is important to remember that these experiments were conducted in isolated lab conditions such that many of the pressures found in natural environments (i.e., competitors, parasites, predators, carcass availability; [31,32]) were missing. Competition, predation, parasitism, and carcass availability may influence realized fitness [32,41,46], and these potential selective effects have been part of the selective history of the source populations for this study. Presumably, the selective environment that created the patterns we observed in the lab included all influences embodied in the natural environment. Thus, although the specific value of our measure of fitness (i.e., lifetime number of offspring) is unlikely to be realized in the natural environment, the general pattern of differences between species and among carcasses should be robust. Our results should be viewed as evolved differences evaluated in an isolated environment.

5. Conclusions

In this study, we showed that two phylogenetically similar species of burying beetles that differ in body size are adapted to maximize reproductive output on different–sized resources. The larger species, N. marginatus, did better on larger carcasses while the smaller species, N. guttula, did best on smaller carcasses, although N. marginatus did as well, or better, overall. Carcass size affected lifetime reproductive strategies for both species. Each species’ parental investment patterns were consistent with terminal investment on carcasses on which they normally performed best, but they responded conservatively (reproductive restraint) on carcass sizes on which they performed poorly. These data provide strong support for a dynamic threshold for terminal investment [8] based on size of carcass used for reproduction. The differences in how the two species use carcasses and incur reproductive costs may facilitate their co–occurrence in nature.

Author Contributions

Conceptualization, M.C.B., P.J.M. and J.C.C.; methodology, P.J.M. and J.C.C.; formal analysis, M.C.B. and P.J.M.; investigation, P.J.M.; resources, M.C.B.; data curation, M.C.B.; writing—original draft preparation, P.J.M. and M.C.B.; writing—review and editing, M.C.B., P.J.M. and J.C.C.; visualization, M.C.B. and P.J.M.; supervision, M.C.B. and J.C.C.; funding acquisition, M.C.B. All authors have read and agreed to the published version of the manuscript.

Funding

This research received no external funding.

Institutional Review Board Statement

Ethical review and approval were waived for this study because all live animals used in the study were invertebrates.

Informed Consent Statement

Not applicable.

Data Availability Statement

Data are deposited in Dryad data repository with the following identifier, https://doi.org/10.5061/dryad.rv15dv48t.

Acknowledgments

We thank Bruce Schaalje for help with statistical analyses and Eric Billman and Clint Laidlaw for helping to design and execute this experiment. Jerry Johnson provided important comments that helped shape the manuscript. We also thank a myriad of undergraduate researchers for their help in collecting data, especially Mason Segura. We thank the Department of Biology, Brigham Young University for support.

Conflicts of Interest

The authors declare no conflict of interest.

References

  1. Williams, G.C. Natural selection, the costs of reproduction, and a refinement of Lack’s principle. Am. Nat. 1966, 100, 687–690. [Google Scholar] [CrossRef] [Green Version]
  2. Carlisle, T.R. Brood success in variable environments: Implications for parental care allocation. Anim. Behav. 1982, 30, 824–836. [Google Scholar] [CrossRef]
  3. Heimpel, G.E.; Rosenheim, J.A. Dynamic host feeding by the parasitoid Aphytis melinus: The balance between current and future reproduction. J. Anim. Ecol. 1995, 64, 153–167. [Google Scholar] [CrossRef]
  4. Rosenheim, J.A. Characterizing the cost of oviposition in insects: A dynamic model. Evol. Ecol. 1999, 13, 141. [Google Scholar] [CrossRef]
  5. Pianka, E.R.; Parker, W.S. Age–Specific Reproductive Tactics. Am. Nat. 1975, 109, 453–464. [Google Scholar] [CrossRef]
  6. Clutton–Brock, T.H. Reproductive effort and terminal investment in iteroparous animals. Am. Nat. 1984, 123, 212–229. [Google Scholar] [CrossRef]
  7. McNamara, J.M.; Houston, A.I.; Barta, Z.; Scheuerlein, A.; Fromhage, L. Deterioration, death and the evolution of reproductive restraint in late life. Proc. Royal Soc. B Biol. Sci. 2009, 276, 4061–4066. [Google Scholar] [CrossRef] [Green Version]
  8. Duffield, K.R.; Bowers, E.K.; Sakaluk, S.K.; Sadd, B.M. A dynamic threshold model for terminal investment. Behav. Ecol. Sociobiol. 2017, 71, 185. [Google Scholar] [CrossRef] [PubMed]
  9. van Noordwijk, A.J.; de Jong, G. Acquisition and allocation of resources: Their influence on variation in life history tactics. Am. Nat. 1986, 128, 137–142. [Google Scholar] [CrossRef] [Green Version]
  10. Trumbo, S.T. Monogamy to communal breeding: Exploitation of a broad resource base by burying beetles (Nicrophorus). Ecol. Entomol. 1992, 17, 289–298. [Google Scholar] [CrossRef]
  11. Billman, E.J.; Belk, M.C. Effect of age–based and environment–based cues on reproductive investment in Gambusia affinis. Behav. Ecol. 2014, 4, 1611–1622. [Google Scholar] [CrossRef] [PubMed]
  12. Billman, E.J.; Creighton, J.C.; Belk, M.C. Prior experience affects allocation to current reproduction in a burying beetle. Behav. Ecol. 2014, 25, 813–818. [Google Scholar] [CrossRef] [Green Version]
  13. Brannelly, L.A.; Webb, R.; Skerratt, L.F.; Berger, L. Amphibians with infectious disease increase their reproductive effort: Evidence for the terminal investment hypothesis. Open Biol. 2016, 6, 150251. [Google Scholar] [CrossRef] [PubMed] [Green Version]
  14. Cotter, S.C.; Littlefair, J.E.; Grantham, P.J.; Kilner, R.M. A direct physiological trade–off between personal and social immunity. J. Anim. Ecol. 2013, 82 4, 846–853. [Google Scholar] [CrossRef] [Green Version]
  15. Creighton, J.C.; Heflin, N.D.; Belk, M.C. Cost of reproduction, resource quality, and terminal investment in a burying beetle. Am. Nat. 2009, 174, 673–684. [Google Scholar] [CrossRef] [PubMed]
  16. Duffield, K.R.; Hunt, J.; Rapkin, J.; Sadd, B.M.; Sakaluk, S.K. Terminal investment in the gustatory appeal of nuptial food gifts in crickets. J. Evol. Biol. 2015, 28, 1872–1881. [Google Scholar] [CrossRef] [PubMed]
  17. Farchmin, P.; Eggert, A.; Duffield, K.; Sakaluk, S. Dynamic terminal investment in male burying beetles. Anim. Behav. 2020, 163, 1–7. [Google Scholar] [CrossRef]
  18. Heinze, J.; Schrempf, A. Terminal investment: Individual reproduction of ant queens increases with age. PLoS ONE 2012, 7, e35201. [Google Scholar] [CrossRef] [Green Version]
  19. Krams, I.A.; Krama, T.; Moore, F.R.; Rantala, M.J.; Mänd, R.; Mierauskas, P.; Mänd, M. Resource availability as a proxy for terminal investment in a beetle. Oecologia 2015, 178, 339–345. [Google Scholar] [CrossRef] [PubMed]
  20. Mason, T.H.E.; Chirichella, R.; Richards, S.A.; Stephens, P.A.; Willis, S.G.; Apollonio, M. Contrasting life histories in neighbouring populations of a large mammal. PLoS ONE 2011, 6, e28002. [Google Scholar] [CrossRef] [PubMed] [Green Version]
  21. Reavey, C.E.; Silva, F.W.S.; Cotter, S.C. Bacterial infection increases reproductive investment in burying beetles. Insects 2015, 6, 926–942. [Google Scholar] [CrossRef] [PubMed] [Green Version]
  22. Velando, A.; Drummond, H.; Torres, R. Senescent birds redouble reproductive effort when ill: Confirmation of the terminal investment hypothesis. Proc. Biol. Sci. 2006, 273, 1443–1448. [Google Scholar] [CrossRef] [PubMed] [Green Version]
  23. Balbontín, J.; Møller, A.P.; Hermosell, I.G.; Marzal, A.; Reviriego, M.; de Lope, F. Geographical variation in reproductive ageing patterns and life–history strategy of a short–lived passerine bird. J. Evol. Biol. 2012, 25, 2298–2309. [Google Scholar] [CrossRef] [PubMed] [Green Version]
  24. Elliott, K.H.; O’Reilly, K.M.; Hatch, S.A.; Gaston, A.J.; Hare, J.F.; Anderson, W.G. The prudent parent meets old age: A high stress response in very old seabirds supports the terminal restraint hypothesis. Horm. Behav. 2014, 66, 828–837. [Google Scholar] [CrossRef] [PubMed]
  25. Lecomte, V.J.; Sorci, G.; Cornet, S.; Jaeger, A.; Faivre, B.; Arnoux, E.; Gaillard, M.; Trouvé, C.; Besson, D.; Chastel, O.; et al. Patterns of aging in the long–lived wandering albatross. Proc. Natl. Acad. Sci. USA 2010, 107, 6370–6375. [Google Scholar] [CrossRef] [PubMed] [Green Version]
  26. McCallum, M.L.; Trauth, S.E. Physiological trade–offs between immunity and reproduction in the northern cricket frog (Acris crepitans). Herpetologica 2007, 63, 269–274. [Google Scholar] [CrossRef]
  27. Morin, A.; Rughetti, M.; Rioux–Paquette, S.; Festa–Bianchet, M. Older conservatives: Reproduction in female Alpine chamois (Rupicapra rupicapra) is increasingly risk–averse with age. Canad. J. Zool. 2016, 94, 311–321. [Google Scholar] [CrossRef] [Green Version]
  28. Smith, A.N.; Belk, M.C.; Creighton, J.C. Residency time as an indicator of reproductive restraint in male burying beetles. PLoS ONE 2014, 9, e109165. [Google Scholar] [CrossRef] [Green Version]
  29. Davison, R.; Boggs, C.L.; Baudisch, A. Resource allocation as a driver of senescence: Life history tradeoffs produce age patterns of mortality. J. Theor. Biol. 2014, 360, 251–262. [Google Scholar] [CrossRef] [PubMed]
  30. Le Lann, C.; Visser, B.; Van Baaren, J.; Van Alphen, J.J.; Ellers, J. Comparing resource exploitation and allocation of two closely related aphid parasitoids sharing the same host. Evol. Ecol. 2012, 26, 79–94. [Google Scholar] [CrossRef]
  31. Scott, M.P. The ecology and behavior of burying beetles. Annu. Rev. Entomol. 1998, 43, 595–618. [Google Scholar] [CrossRef] [Green Version]
  32. Trumbo, S.T.; Fiore, A.J. Interspecific competition and the evolution of communal breeding in burying beetles. Am. Mid. Nat. 1994, 131, 169–174. [Google Scholar] [CrossRef]
  33. Smith, R.J.; Heese, B. Carcass selection in a high altitude population of the burying beetle, Nicrophorus investigator (Silphidae). Southwest. Nat. 1995, 40, 50–55. [Google Scholar]
  34. Sikes, D.S.; Venables, C. Molecular phylogeny of the burying beetles (Coleoptera: Silphidae: Nicrophorinae). Mol. Phylogenet. Evol. 2013, 69, 552–565. [Google Scholar] [CrossRef] [PubMed]
  35. Peck, S.B.; Kaulbars, M.M. A synopsis of the distribution and bionomics of the carrion beetles (Coleoptera, Silphidae) of the conterminous United States. Proc. Entomol. Soc. Ont. 1987, 118, 47–81. [Google Scholar]
  36. Ratcliffe, B.C. The Carrion Beetles (Coleoptera: Silphidae) of Nebraska. Bull. Univ. Neb. State Mus. 2011, 13, 100. [Google Scholar]
  37. Bartlett, J.; Ashworth, C.M. Brood size and fitness in Nicrophorus vespilloides (Coleoptera: Silphidae). Behav. Ecol. Sociobiol. 1988, 22, 429–434. [Google Scholar] [CrossRef]
  38. Müller, J.K.; Eggert, A.-K.; Dressel, J. Intraspecific brood parasitism in the burying beetle, Necrophorus vespilloides (Coleoptera: Silphidae). Anim. Behav. 1990, 40, 491–499. [Google Scholar] [CrossRef]
  39. Creighton, J.C.; Smith, A.N.; Komendat, A.; Belk, M.C. Dynamics of biparental care in a burying beetle: Experimental handicapping results in partner compensation. Behav. Ecol. Sociobiol. 2015, 69, 265–271. [Google Scholar] [CrossRef]
  40. Anderson, R.S. Resource partitioning in the carrion beetle (Coleoptera:Silphidae) fauna of southern Ontario: Ecological and evolutionary considerations. Canad. J. Zool. 1982, 60, 1314–1325. [Google Scholar] [CrossRef]
  41. Trumbo, S.T. Interference competition among burying beetles (Silphidae, Nicrophorus). Ecol. Entomol. 1990, 15, 347–355. [Google Scholar] [CrossRef]
  42. Lomolino, M.; Creighton, C.; Schnell, G.; Certain, D. Ecology and conservation of the endangered American burying beetle (Nicrophorus americanus). Conserv. Biol. 1995, 9, 605–614. [Google Scholar] [CrossRef]
  43. Hocking, M.; Darimont, C.; Christie, K.; Reimchen, T. Niche variation in burying beetles (Nicrophorus spp.) associated with marine and terrestrial carrion. Canad. J. Zool. 2007, 85, 437–442. [Google Scholar] [CrossRef] [Green Version]
  44. Smith, G.; Trumbo, S.T.; Sikes, D.S.; Scott, M.P.; Smith, R.L. Host shift by the burying beetle, Nicrophorus pustulatus, a parasitoid of snake eggs. J. Evol. Biol. 2007, 20, 2389–2399. [Google Scholar] [CrossRef] [PubMed]
  45. Keller, M.L.; Howard, D.R.; Hall, C.L. Spatiotemporal niche partitioning in a specious silphid community (Coleoptera: Silphidae Nicrophorus). Sci. Nat. 2019, 106, 57. [Google Scholar] [CrossRef]
  46. Hopwood, P.; Moore, A.; Tregenza, T.; Royle, N. Niche variation and the maintenance of variation in body size in a burying beetle. Ecol. Entomol. 2015, 41. [Google Scholar] [CrossRef] [Green Version]
  47. Smith, C.B.; Urness, P.J. Small mammal abundance on native and improved foothill ranges, Utah. J. Range Manag. 1984, 37, 353–357. [Google Scholar] [CrossRef]
  48. Smith, A.N.; Belk, M.C. Evidence for interspecific brood parasite detection and removal in burying beetles. Psyche 2018. [Google Scholar] [CrossRef] [PubMed] [Green Version]
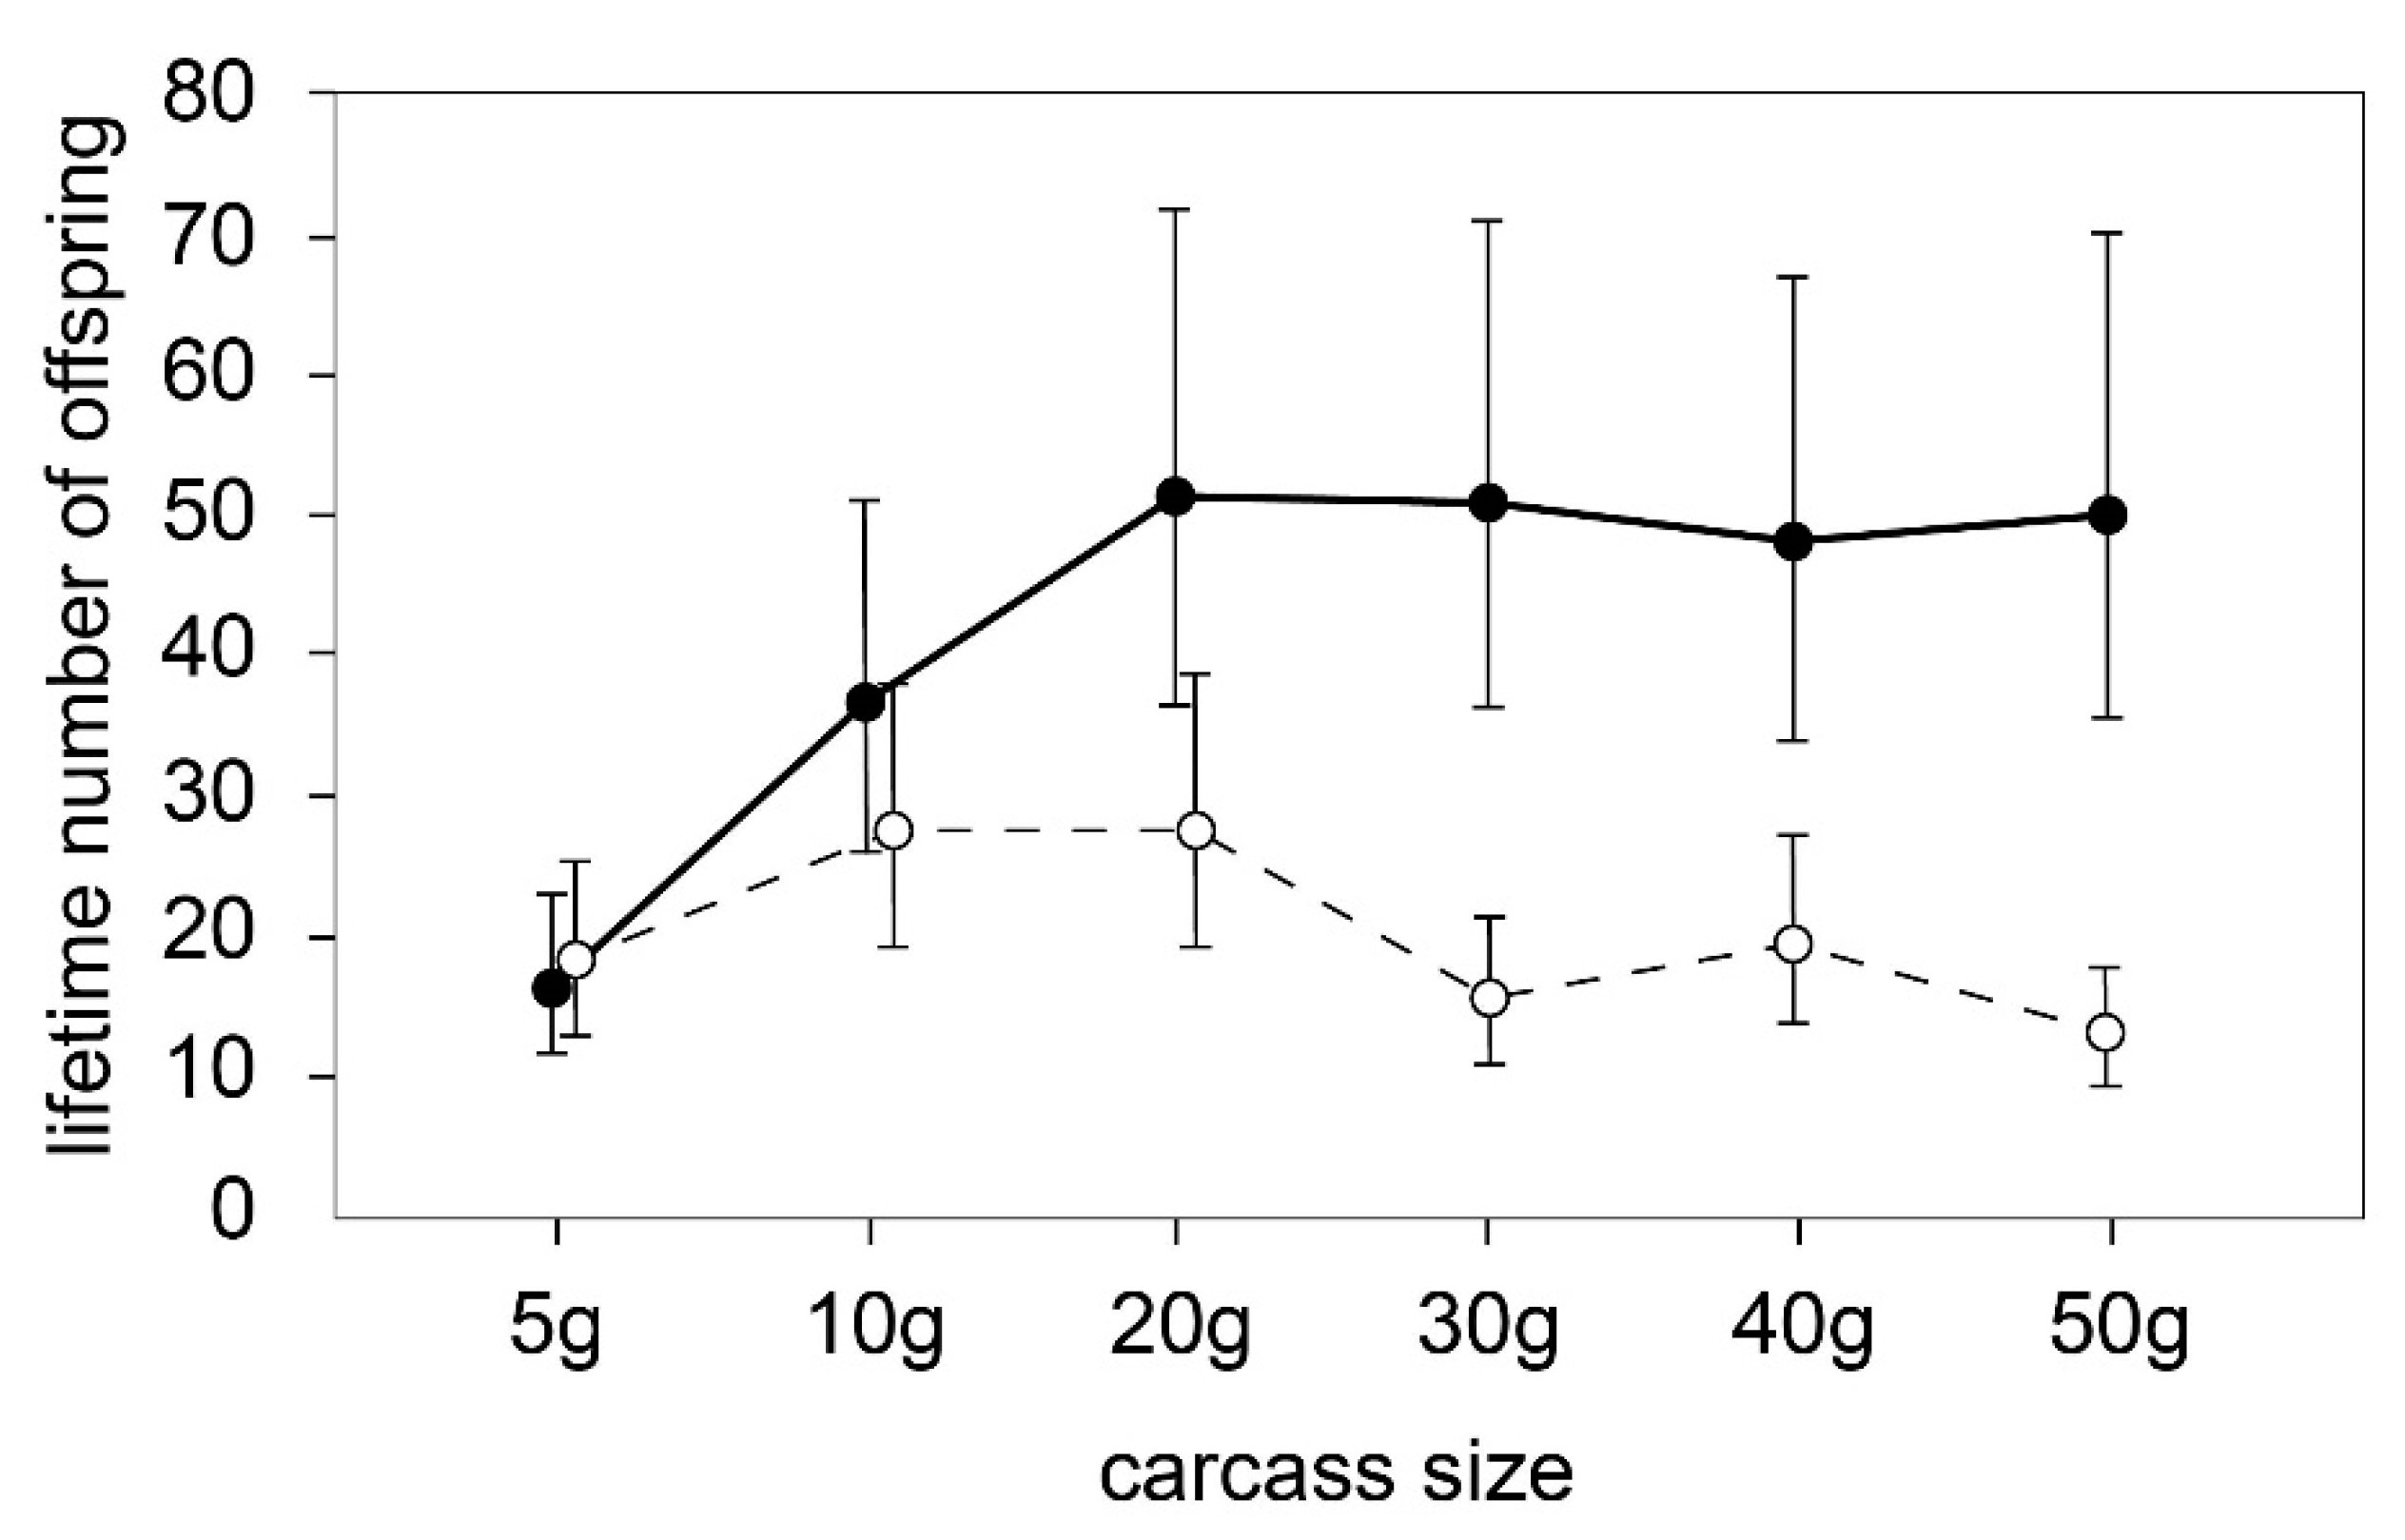
Figure 1. Mean lifetime number of offspring (error bars are 95% confidence interval) produced by N. marginatus (solid circle and line) and N. guttula (open circles and dashed line) across six carcass sizes.
Diversity 13 00662 g001
Figure 2. (a) Mean lifespan (in days; error bars are 95% confidence interval) of N. marginatus (solid circle and line) and N. guttula (open circles and dashed line) across six carcass sizes. NR indicates nonreproductive treatment. (b) Mean number of reproductive bouts (error bars are 95% confidence interval) for N. marginatus (solid circle and line) and N. guttula (open circles and dashed line) across six carcass sizes.
Diversity 13 00662 g002
Figure 3. (a) Mean mass change (in grams, error bars are 95% confidence intervals, same on all panels) of female N. marginatus during reproduction on six carcass sizes (5 g = yellow, 10 g = yellow/green, 20 g = green, 30 g = blue/green, 40 g = light blue, 50 g = dark blue; same on all panels) by reproductive bout as age. (b) Mean mass change of female N. guttula during reproduction on six carcass sizes by reproductive bout as age. (c) Mean proportion of the brood culled by female N. marginatus on six carcass sizes by reproductive bout as age. (d) Mean proportion of the brood culled by female N. guttula on six carcass sizes by reproductive bout as age.
Diversity 13 00662 g003
Figure 4. (a) Mean initial brood size (error bars are 95% confidence intervals on all panels) of N. marginatus across six carcass sizes (yellow circles represent the smallest carcass sizes grading to blue for the largest carcass sizes; same across all panels) by reproductive bout as age. (b) Mean initial brood size of N. guttula across six carcass sizes by reproductive bout as age. (c) Mean final brood size of N. marginatus across six carcass sizes by reproductive bout as age. (d) Mean final brood size of N. guttula across six carcass sizes by reproductive bout as age. (e) Mean offspring mass of N. marginatus across six carcass sizes by reproductive bout as age. (f) Mean offspring mass of N. guttula across six carcass sizes by reproductive bout as age.
Diversity 13 00662 g004
Table 1. Results of ANCOVA for lifetime number of offspring. Significant effects are bolded.
Effect.DF (num/den)Fp
species1/13254.07<0.0001
carcass5/1324.780.0005
carcass × species5/1325.360.0002
standardized size1/1320.160.6891
Table 2. Results of ANCOVA for lifespan. Significant effects are bolded.
EffectDF (num/den)Fp
species1/1535.600.0192
carcass6/15335.78<0.0001
carcass × species6/1530.320.9244
standardized size1/15316.75<0.0001
Table 3. Results of ANCOVA for number of reproductive bouts. Significant effects are bolded.
EffectDFχ2p
species116.79<0.0001
carcass551.88<0.0001
carcass × species53.800.5784
standardized size11.500.2202
Table 4. Results of repeated measures ANCOVA for mass change, and proportion brood culled. Significant effects are bolded.
EffectDF (num/den)Fp
Mass Change
species1/4620.040.8387
carcass5/4620.790.5565
age1/4620.050.824
standardized size1/4620.730.3923
species × carcass5/4620.730.602
age × species1/4621.120.2915
age × carcass5/4620.860.5065
age × species × carcass5/4620.580.719
Proportion Brood Culled
species1/212.85.650.0184
carcass5/167.22.880.0072
age1/2028.710.0035
standardized size1/135.88.450.0043
species × carcass5/186.42.580.0275
age × species1/265.60.290.5892
age × carcass5/117.10.750.6305
age × species × carcass5/129.22.030.0788
Table 5. Results of repeated measures ANCOVA for initial brood size, final brood size, and mean offspring mass. Significant effects are bolded.
Effect DF (num/den)Fp
Initial Brood Size
species1/118.79.870.0021
carcass5/117.412.54<0.0001
age1/337135.6<0.0001
standardized size1/100.60.030.8525
species × carcass5/117.51.970.0885
age × species1/341.64.350.0378
age × carcass5/236.510.07<0.0001
age × species × carcass5/236.91.250.2845
Final Brood Size
species1/1396.860.0098
carcass5/131.822.28<0.0001
age1/489116.9<0.0001
standardized size1/94.60.150.6982
species × carcass5/1321.640.153
age × species1/4896.810.0093
age × carcass5/395.39.35<0.0001
age × species × carcass5/396.12.010.0764
Mean Offspring Mass
species1/21212.430.0005
carcass5/191.67.53<0.0001
age1/447.218.84<0.0001
standardized size1/100.50.610.4382
species × carcass5/191.90.750.5834
age × species1/449.60.270.6038
age × carcass5/414.92.80.0169
age × species × carcass5/415.11.020.4041
Publisher’s Note: MDPI stays neutral with regard to jurisdictional claims in published maps and institutional affiliations.