Abstract
Recent studies on genetic variability have revealed different patterns of genetic structure among populations of marine decapod species with wide geographical distribution. The hermit crab Clibanarius antillensis has a broad distribution along the western Atlantic Ocean, from south Florida (United States) to Santa Catarina (Brazil). This factor, in addition to differences in larval morphology and in adult coloration, makes this species a good model for studies on intraspecific variations. Therefore, we evaluated the molecular and morphological variability of C. antillensis along its distribution in order to check the levels of population structure. The results were based on the morphological analyses of 187 individuals and 38 partial sequences of the mitochondrial gene 16S rRNA and 46 of cytochrome c oxidase subunit I (COI) from specimens whose locations covered the whole species distribution. The molecular analyses did not show any apparent population structure of C. antillensis. This result was corroborated by the morphological analyses since the characters analyzed did not show any pattern of variation. Our results may be explained by a set of factors, such as the dispersive potential of the species and the absence of barriers that could prevent gene flow. In addition, high genetic diversity was observed, mainly for COI, which may be explained by the historical processes of the species, which seem to be in almost constant expansion in the last 700,000 years and experienced no genetic bottleneck. Apparently, this species was little affected by the climate fluctuations of Pleistocene. Additionally, our morphological analyses allowed us to present herein a redescription of the studied species since we noted differences from the characters in the diagnosis.
1. Introduction
Species and their populations are constantly changing. Their history, as well as details from their current stage of genetic structure, are a combination of different past events [1], which may be understood by investigating their genetic processes [2]. Gene flow, for example, is essential to maintain genetic homogeneity or heterogeneity among populations of a species [3,4].
For most marine invertebrate species, planktonic larvae and their life span influence their dispersion process which allows them to interconnect populations by reaching long distances [5,6]. Therefore, long larval stages are usually related to high dispersal capacity and levels of gene flow and reduced population genetic structure [7,8,9]. However, some studies revealed that high levels of connectivity and genetic homogeneity were not necessarily related to the duration of planktonic stages [10,11,12]. In addition, gene flow may also be influenced by marine currents circulation, local oceanic conditions, physical barriers, food availability, ecological interactions, as well as past geological events and recent history [8,10,13,14,15,16,17,18,19,20,21,22].
Therefore, each marine species has its own patterns of gene flow and genetic differences along its distribution [14,23]. This occurs because each individual has a unique way to respond to different factors at specific moments [14]. Gene flow patterns may be revealed by studies on genetic variability of populations [24], which might show different levels of geographic structure and genetic diversity [25].
Many studies have revealed geographic structure on marine decapod crustaceans with wide distribution. As examples, the hermit crabs Calcinus tibicen Herbst, 1791 [26] and Clibanarius vittatus Bosc, 1802 [27] exhibited different patterns of population structure along their distribution in the western Atlantic Ocean.
The hermit crab Clibanarius antillensis Stimpson, 1859 (Figure 1) occurs in Bermuda, Florida (US), Gulf of Mexico, Belize, Costa Rica, Panama, Antilles, north of South America and Brazil (in Atol das Rocas and from the state of Piauí to Santa Catarina) (Figure 2) [28,29,30,31,32]. It is found in intertidal zones, shallow waters, over rocks, coral reefs, and banks of Halodule [30,33]. The species has a larval development of five to six stages that require at least 43 days to complete [34,35].
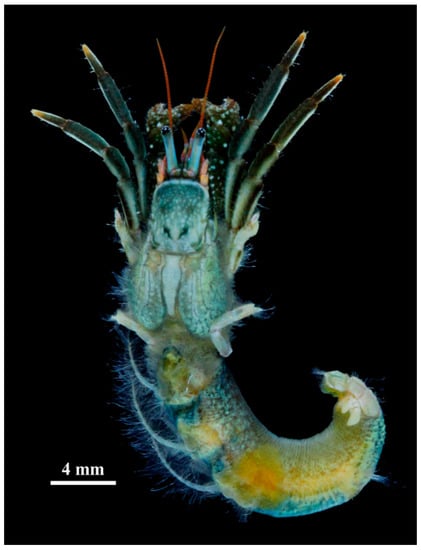
Figure 1.
Clibanarius antillensis Stimpson, 1859. Preserved female specimen, CCDB 5061. Photo by Buranelli, R.C.
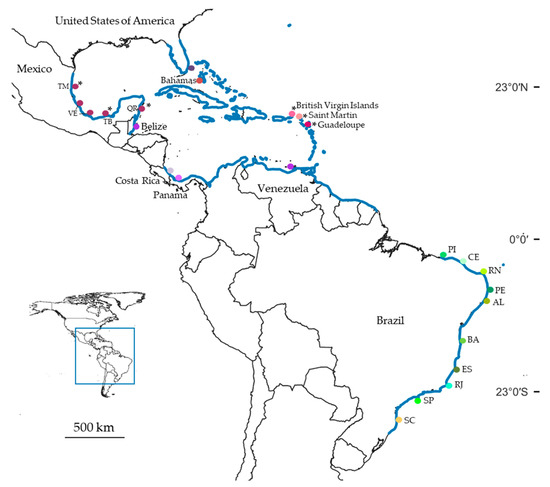
Figure 2.
Distribution of Clibanarius antillensis Stimpson, 1859 (blue line). Colored dots indicate collecting sites where we sampled specimens whose partial sequences of 16S rRNA and cytochrome c oxidase subunit I (COI) were obtained. * indicates only sequences of 16S rRNA obtained. Abbreviations: TM: Tamaulipas; VE: Veracruz; TB: Tabasco; QR: Quintana Roo; PI: Piauí; CE: Ceará; RN: Rio Grande do Norte; PE: Pernambuco; AL: Alagoas; BA: Bahia; ES: Espírito Santo; RJ: Rio de Janeiro; SP: São Paulo; SC: Santa Catarina.
Some morphological differences were found between larvae from Brazil and Panama and Mexico populations, such as the number of antennular aesthetascs, the number of denticles of crista dentate of the third maxilliped, the development of the external lobe of the maxillule and endopod of the maxilla [34,35,36]. Additionally, distinct coloration patterns were found among adults from different localities [37].
Additional investigations on genetic variability may contribute to a better comprehension of biogeographic processes, population differentiation and biodiversity along groups/families of hermit crabs in the western Atlantic. Additionally, it may allow checking if there is an evolutive signal among them. Based on the reported scenario, the wide distribution of C. antillensis, its larval stage duration and the context previously described, this hermit crab is a suitable species for investigations on genetic variability and morphological analyses. Therefore, the aim of this study was to: (1) check the levels of population structure along C. antillensis distribution; (2) analyze morphological and molecular variations, and (3) analyze, preliminarily, demographic factors related to its current diversification pattern.
2. Materials and Methods
2.1. Sample Collection
Most individuals were obtained from the Crustacean Collection of the Department of Biology, University of São Paulo, Brazil (CCDB). In order to cover most part of the species distribution (Figure 2), we also analyzed specimens obtained by means of loans or donations from the following collections: University of Louisiana at Lafayette Zoological Collection, LA, USA (ULLZ—recently transferred to the National Museum of Natural History, Smithsonian Institution, Washington, DC, USA. USNM; both catalog numbers are used, as specimens are now permanently cross-referenced under both numbers at the USNM); Florida Museum of Natural History, University of Florida, FL, USA (UF); United States National Museum, Smithsonian National Museum of Natural History, Washington, DC, USA (USNM); American Museum of Natural History, NY, USA (AMNH); Natural History Museum of Los Angeles County, CA, USA (NHMLA); Colección Nacional de Crustáceos, Universidad Autónoma de Mexico, Mexico (CNCR). Before the analyses, the identification of specimens was confirmed based on previous morphological characters established in the literature [28,30,31,38,39].
2.2. DNA Extraction, Amplification and Sequencing
For DNA extraction, we used muscle tissue from pereiopods or abdomen and followed saline protocols described by Schubart et al. [40], with modifications from Mantelatto et al. [41], and Chelex® resin [42]. Some adaptations were made to suit our material.
The fragments were amplified by polymerase chain reaction (PCR) [43] in a Veriti 96-Well Thermal Cycler® (Applied Biosystems, Foster City, CA, USA). The molecular markers 16S rRNA and cytochrome c oxidase subunit I (COI) were chosen, since these mitochondrial genes have been widely used and effective on studies that contribute to our comprehension of Decapod diversity [40,41,44,45]. Of all primers used in this study (Table 1), we designed one pair of each marker in Primer-Blast (National Center for Biotechnology Information, Bethesda, MD, USA) [46]: 16SLClib and 16SHClib; COILClib and COIHClib, due to amplification difficulties. For this purpose, we based the design on the alignment of two 16S rRNA GenBank sequences (KF182529 and DQ369941) and new sequences of 16S rRNA and COI.

Table 1.
Sequences of primers used for amplification of 16S rRNA and cytochrome c oxidase subunit I (COI) by means of PCR.
Each PCR was performed with 25 μL total volume, containing ultrapure water, betaine (5 M), DNTPs (10 mM), PCR Buffer (10×), MgCl2 (25 mM), bovine serum albumin (BSA) 1% solution, primers (10 μM each), Thermus aquaticus (Taq) DNA polimerase (5 U/μL) and previously calculated extracted DNA. The thermal cycle consisted of: 16S rRNA—initial denaturing for 4 min at 95 °C; annealing for 40 cycles of 45 s at 95 °C, 45 s at 54 °C and 1 min at 72 °C; final extension for 6 min at 72 °C; COI—initial denaturing for 5 min at 95 °C; annealing for 40 cycles of 1 min at 95 °C, 1 min at 38–48 °C and 75 s at 72 °C; final extension for 6 min at 72 °C. PCR products were electrophoresed on 1.5% agarose gel for confirmation, purified using the SureClean Plus® kit (Bioline, Tauton, MA, USA), following the manufacturer’s instructions, and sequenced with the ABI BigDye Terminator Mix (Applied Biosystems, Foster City, CA, USA) in an ABI 3730 XL DNA Analyzer (Applied Biosystems automated sequencer, Foster City, CA, USA), following the manufacturers’ protocol.
The forward and reverse obtained sequences were edited and used to construct a consensus sequence in BioEdit 7.2.5 (Ibis Therapeutics, Carlsbad, CA, USA) [49]. The identity of the consensus was confirmed with BLAST (Basic Local Alignment Search Tool) [50] by comparisons to accessioned sequences of GenBank database. COI consensus were checked for the occurrence of pseudogenes at the online Translate tool on SIB ExPASy [51]. Multiple sequences were aligned for each gene using MUSCLE (Multiple Sequence Comparison by Log-Expectation, European Molecular Biology Laboratory–The European Bioinformatics Institute, Hinxton, UK) [52].
Besides the sequences we obtained, which were all submitted to GenBank (National Center for Biotechnology Information, Bethesda, MD, USA), we also included two 16S rRNA sequences of C. antillensis retrieved from GenBank (Table 2). For genetic distance and phylogenetic analyses, we added five 16S rRNA and 13 COI sequences of other species of the genus Clibanarius (Table 3); the following outgroup sequences, based on Bracken-Grissom et al. [53]: Calcinus laevimanus Randall, 1840 (GenBank: 16S rRNA–FJ620175; COI–FJ620271), C. osbcurus Stimpson, 1859 (GenBank: 16S rRNA–FJ620216; COI–FJ620314), C. tibicen (GenBank: 16S rRNA–FJ620220; COI–FJ620318), Isocheles pilosus Holmes, 1900 (GenBank: 16S rRNA–AF436057), I. sawayai Forest and Saint Laurent, 1968 (GenBank: 16S rRNA–DQ369938), and I. wurdemanni Stimpson, 1859 (GenBank: 16S rRNA–KF182530).
Table 2.
Specimens of Clibanarius antillensis Stimpson, 1859 used in molecular analyses, sampling localities, museum catalog number, and GenBank accession numbers. New sequences are in bold. AMNH: American Museum of Natural History. CCDB: Crustacean Collection of the Department of Biology—Faculty of Philosophy, Sciences and Letters at Ribeirão Preto, University of São Paulo. CNCR: Colección Nacional de Crustáceos, Universidad Autónoma de Mexico. UF: Florida Museum of Natural History, University of Florida. ULLZ: University of Louisiana at Lafayette Zoological Collection. USNM: United States National Museum, Smithsonian National Museum of Natural History. (-): missing sequences.
Table 3.
Specimens of Clibanarius spp. used in molecular analyses, sampling locality, museum catalog number, and GenBank accession numbers. New sequence is in bold. CBM-ZC: Natural History Museum and Institute, Zoology Crustacea. CCDB: Crustacean Collection of the Department of Biology—Faculty of Philosophy, Sciences and Letters at Ribeirão Preto, University of São Paulo. ULLZ: University of Louisiana at Lafayette Zoological Collection. USNM: United States National Museum, Smithsonian National Museum of Natural History. (−): missing data.
2.3. Genetic Distance Analyses
Genetic distances were calculated to determine intra and interspecific variation rates with the software MEGA 6.06 [54], using the Kimura 2-parameters substitution model [55]. Two genetic distances histograms were constructed in Microsoft Excel 2010, with interval ranges of 0.2%.
2.4. Phylogenetic Analyses
Maximum likelihood (ML) analyses [56] were conducted in RAxML—HPC Black Box 8.2.4 (Randomized Axelerated Maximum Likelihood, Heidelberg Institute for Theoretical Studies, Heidelberg, Germany) [57], implemented at the online platform Cyber Infrastructure for Phylogenetic Research (CIPRES). We used the default parameters for RAxML and the evolution model GTR + Γ + I [General Time Reversible [58] + Gama + Invariables sites] and the consistency of the topologies was measured by bootstrap method (1000 replicates). The topologies were visualized and edited using FigTree 1.4.2 (University of Edinburgh, Edinburgh, UK) [59]; only values >50% were reported.
2.5. Genetic Variability Analyses
The genetic variability analyses were conducted for both 16S rRNA and COI. The genetic diversity indexes, such as number of haplotypes (H), haplotype diversity (Hd), nucleotide diversity (π) and average number of nucleotide differences (K), were calculated in DnaSP 5.10.1 [60]. Haplotype networks were constructed using statistical parsimony method with TCS 1.21 [61]. In case of ambiguous connections, the criteria proposed by Excoffier and Langaney [62] were considered. Analyses of Molecular Variance (AMOVA) were conducted using the software Arlequin 3.5.2.2 (University of Bern, Bern, Switzerland) [63] to calculate the variance within and between previously established groups and the fixation index values (FST).
2.6. Demographic Analyses
Demographic analyses were conducted for both 16S rRNA and COI. Demographic history was inferred by the neutrality tests Tajimas’ D [64] and Fu’s Fs [65] using Arlequin 3.5.2.2 (University of Bern, Bern, Switzerland) [63]. In addition, pairwise mismatch distribution were analyzed to test population expansion [66]. The graphic was created in DnaSp 5.10.1 [60] and the sum of squared deviations (SSD) [67] and Harpending raggedness index (HRI) [68] were calculated using Arlequin 3.5.2.2 [63].
The Bayesian skyline plot (BSP) [69] analyses was conduct only for COI and it was used to infer the demographic history of the species under coalescent model. First, the substitution model HKY + I + G [Hasegawa-Kishino-Yano [70] + Invariable sites + Gama] was selected using jModelTest 2.1.10 (Free Software Foundation, Inc., Boston, MA, USA) [71] with Bayesian information criterion (BIC). Afterwards, some parameters were selected in BEAUti (Bayesian Evolutionary Analysis Utility, University of Auckland, Auckland, New Zealand) to create the input file in BEAST 1.8.4 (Bayesian Evolutionary Analysis Sampling Trees, University of Auckland, Auckland, New Zealand). The divergence rate was 1.4% per million years [72], the number of Markov chain Monte Carlo interactions was 10 million, at every 1000 chains, with a 10% burn-in. Then, the output was analyzed using Tracer [69], and a graphic was created.
2.7. Morphological Assessment
Morphological data was accessed to compare specimens of C. antillensis from different localities. We adopted all diagnostic characters found in the taxonomic literature [28,30,31,38,39]. Therefore, we measured length of shield (sl), rostrum, lateral projections, left ocular peduncle, right chelae, dactyl, propodus, carpus, merus and ischium of the left second pereiopod; width of front and right chelae. We also analyzed shape and disposition of tufts of setae of shield; shape of rostrum, front and telson lobes; shape and number of spines of ocular acicle; number and disposition of spines of antennal acicle; number and disposition of spines and tufts of setae of right cheliped; coloration and number and disposition of spines of second and third pair of pereiopods. A redescription of the species was made, since we noted differences between some characters observed in this study in comparison to literature descriptions.
3. Results
3.1. Genetic Distance Analyses
The automated sequencing protocols to obtain two fragments of mitochondrial genes resulted in ~1170 base pairs (bp). The alignment of 16S rRNA with 530 bp included 38 sequences of C. antillensis and 12 sequences from other species of Diogenidae. The intraspecific divergence for C. antillensis varied from 0–0.99%, whereas interspecific values ranged from 1.48–24.98%, with the first value corresponding to the divergence between sequences of C. vittatus and C. symmetricus (Figure 3a). An interspecific gap was not evident for this marker. The alignment of COI with 640 bp included 46 sequences of C. antillensis and 16 sequences from other species of Diogenidae. In this case, the interspecific gap was evident, since the intraspecific divergence for C. antillensis varied from 0–2.90% and the interspecific values ranged from 5.80–22.80% (Figure 3b).
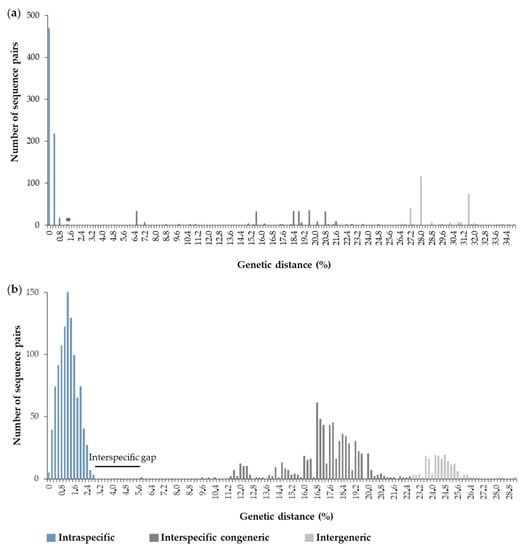
Figure 3.
Histograms of Kimura 2-parameters genetic distances calculated for each pair of sequences of Clibanarius antillensis Stimpson, 1959 and other species of Diogenidae for 16S rRNA (a) and cytochrome c oxidase subunit I (COI) (b). * indicates the divergence between sequences of Clibanarius vittatus and Clibanarius symmetricus.
3.2. Phylogenetic Analyses
Both phylogenetic trees, generated by ML analyses, indicated the monophyly of C. antillensis in clades with bootstrap values of 87% for 16S rRNA (Figure 4) and 79% for COI (Figure 5). There were no pattern dividing groups that could reveal genetic structure. Additionally, in both trees, C. tricolor was closer to C. antillensis than other congeneric species.
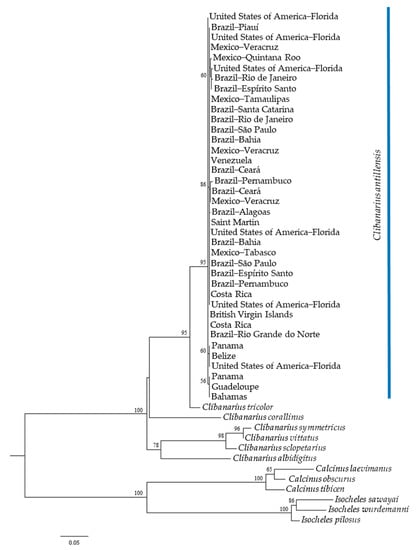
Figure 4.
Maximum likelihood phylogram obtained for 16S rRNA sequences of Clibanarius antillensis Stimpson, 1859 specimens (blue bar) and other species of Diogenidae. Numbers represent bootstrap values (1002 replicates) and only bootstrap values >50% were shown.
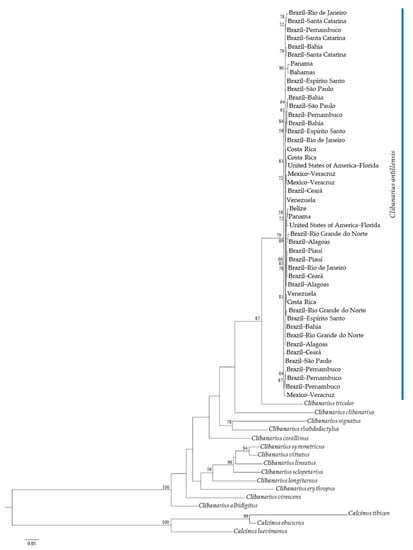
Figure 5.
Maximum likelihood phylogram obtained for cytochrome c oxidase subunit I (COI) sequences of Clibanarius antillensis Stimpson, 1859 specimens (blue bar) and other species of Diogenidae. Numbers represent bootstrap values (1002 replicates) and only bootstrap values > 50% were shown.
3.3. Genetic Variability Analyses
The population alignment of 16S rRNA consisted of 396 bp with 38 specimens from 20 localities. Seven haplotypes were detected, haplotype diversity was 0.417, total nucleotide diversity was 0.00241, the average number of nucleotide differences was 0.506, and the number of polymorphic sites was five.
The COI alignment had 524 bp with 46 specimens from 17 localities. Forty-two haplotypes were detected, haplotype diversity was 0.995, total nucleotide diversity was 0.01253, the average number of nucleotide differences was 6.564, and the number of polymorphic sites was 63. Genetic diversity index for each locality are in Table 4.
Table 4.
Values of number of specimens (N), polymorphic sites (S), number of haplotypes (H), haplotype diversity (Hd), nucleotide diversity (π), and average number of nucleotide differences (K) for each sampled locality of Clibanarius antillensis Stimpson, 1859 distribution for 16S rRNA and cytochrome c oxidase subunit I (COI) mitochondrial genes.
For 16S rRNA, a central haplotype (H1) was shared by 29 individuals from 18 localities, two haplotypes were shared by two (H2) and three (H3) individuals from different localities, and four were singletons. This network did not show any genetic structure (Figure 6a). For COI, two of 41 detected haplotypes were shared by two individuals from different localities of Brazil (H2 and H3); one (H1) by two specimens from Venezuela and one from Costa Rica; the others were singletons. The network did not show any genetic structure; however, there was high genetic diversity for this gene (Figure 6b).
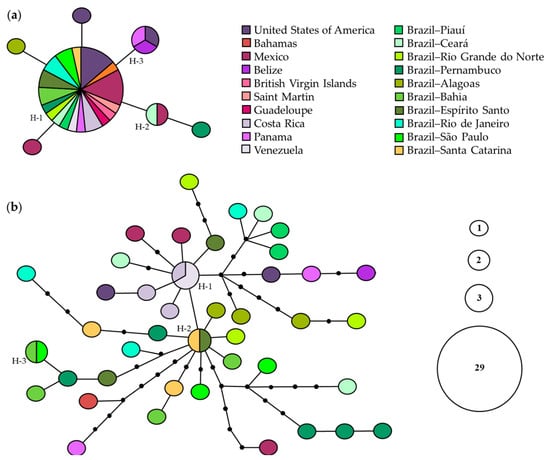
Figure 6.
Statistical parsimony haplotype networks of Clibanarius antillensis Stimpson, 1859 for 16S rRNA (a) and cytochrome c oxidase subunit I (COI) (b). Only shared haplotypes are numbered (H). Size of each circle is proportional to haplotype frequency, according to the caption. Black dots indicate median vectors. Each line indicates one mutation step.
For 16S rRNA, AMOVA revealed that the variance component within localities (102.02%) exceeded the variance component among localities (−2.02%), with negative and no significant FST-value (FST = −0.0202; p > 0.05), which suggested low or absence of genetic differentiation between localities. For COI, even though FST-value was positive, moderate (0.05 < FST < 0.15) [73] and significant (FST = 0.1231; p < 0.05), which suggested genetic differentiation among localities, variance component within localities (87.69%) was higher than that found among localities (12.31%).
3.4. Demographic Analyses
Tajima’s D and and Fu’s Fs values were significant and negative for both 16S rRNA (D = −1.64246, p < 0.05; Fs = −4.64238, p < 0.02) and COI (D = −1.91472, p < 0.05; Fs = −25.14949, p < 0.02) genes, which indicated the rejection of the null hypothesis of population neutrality. Mismatch distribution graphics revealed a unimodal distribution pattern for both genes, which were compatible with the sudden population expansion model (p values for SSD and HRI statistics > 0.05) (Figure 7). Therefore, the null hypothesis of population expansion may not be rejected. The BSP for COI gene showed an increase in effective population size, suggesting that the species had expanded over the past 700,000 years, with a period of stabilization between 450,000 and 250,000 years ago, yet there was no evidence of genetic bottleneck (Figure 8).
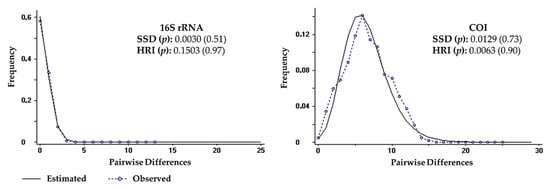
Figure 7.
Mismatch distribution for 16S rRNA and cytochrome c oxidase subunit I (COI) sequences of Clibanarius antillensis Stimpson, 1859. Statistics for sum of squared deviations (SSD) and Harpending raggedness index (HRI) with p values are indicated.
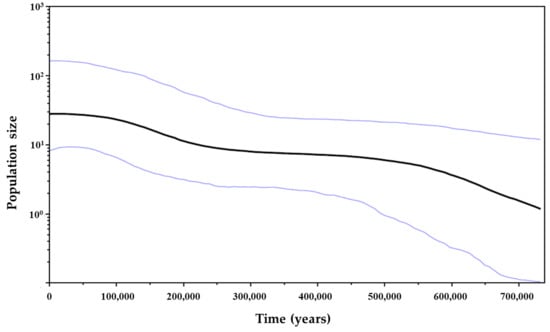
Figure 8.
Bayesian skyline plot for cytochrome c oxidase subunit I gene showing demographic history of Clibanarius antillensis Stimpson, 1859. Black line represents the variation of average effective population size over time (years ago). Blue lines represent highest posterior density (95%). The population size (y-axis) is the product of the effective population size and the generation time.
3.5. Morphological Assessment
We analyzed 187 specimens of C. antillensis (121 males, 33 females and 33 ovigerous females) from 17 localities (covering the entire distribution) and with sl ranging from 1.40 to 5.65 mm. We found some variations on the number of spines of ocular acicles, antennal acicles and dorsaldistal surface of carpus of second pereiopod (Table 5). These variations did not show any pattern of morphological distinction between geographic groups; however, they differed from literature descriptions. Therefore, we made a redescription of the species, as follows.
Table 5.
Comparison of analyzed characters of Clibanarius antillensis Stimpson, 1859 that differed from literature descriptions [30,31,39,74].
Taxonomy
Family Diogenidae Ortmann, 1892
Genus Clibanarius Dana, 1852
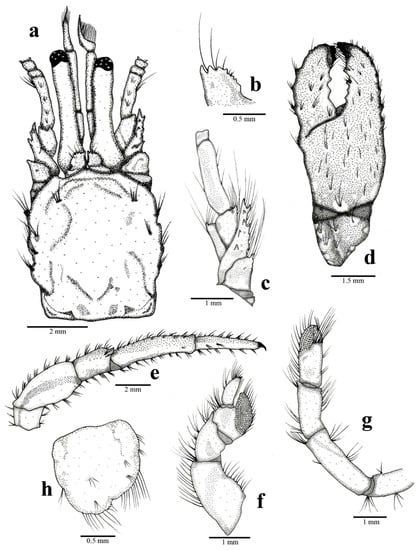
Figure 9.
Clibanarius antillensis Stimpson, 1859: male, sl 4.97 mm. CCDB 5655, Praia das Tartarugas, Búzios, Rio de Janeiro, Brazil. (a): cephalothoracic shield and cephalic region, dorsal view; (b): right ocular acicle, dorsal view; (c): right antennal peduncle, dorso-mesial view; (d): right chela, dorsal view; (e): right third pereiopod, lateral view; (f): right fourth pereiopod, lateral view; (g): right fifth pereiopod, lateral view; (h): telson, dorsal view. Some setae were removed for a better observation of structures.
Clibanarius brasiliensis Dana, 1852: 467 [75].
Clibanarius antillensis Stimpson, 1858: 235 [nomen nudum] [76]; 1859: 85 [38].
Clibanarius antillensis.—Smith, 1869: 18, 39 [77].—Nobili, 1897: 4 [78].—Rathbun, 1900: 144 [79].—Benedict, 1901: 142 [74].—Moreira, 1901: 29, 87 [80].—Schmitt, 1924: 79 [81]; 1935: 199 [82]; 1936: 375 [83].—Provenzano, 1959: 368 [39]; 1960: 119 [84]; 1961: 152 [85].—Forest and Saint Laurent, 1967: 99 [28].—Coelho and Ramos-Porto, 1972: 169 [86]; 1987: 51 [29].—Rieger, 1998 [87]: 421.—Melo, 1999: 48 [31].—McLaughlin et al., 2010: 19 [88].—Nucci and Melo, 2015: 331 [31].
Type locality—Barbados.
Material Examined
UNITED STATES OF AMERICA: Florida—Miami, Biscayne Bay, CCDB 6267, 15 June 2017, coll. H. Bracken-Grissom, 1 ovigerous female (sl 3.55 mm). BAHAMAS: Andros Island—Blanked Sound, Forfar Field Station, AMNH 18726, 29 August 2000, coll. P.M. Mikkelsen, G. Hendler and C.B. Boyko, 1 male (sl 3.20 mm). MEXICO: Veracruz—Actopan, CNCR 24702, 20 April 2006, coll. Y. de los Santos, 2 males (sl 1.56 mm; 2.15 mm)—San Andrés Tuxtla, CNCR 22223, 15 July 2002, coll. A. Argüelles and M. Maldonado, 5 males (sl 1.70–3.37 mm), 1 ovigerous female (sl 1.90 mm). Tabasco—Tacotalpa, CNCR 18624, 14 May 1996, coll. F. Alvarez and R. Robles, 3 males (sl 2.61–2.70 mm). Quintana Roo—Felipe Carrillo Puerto, CNCR 3729, 16 January 1985, coll. J.C. Nates, J.L. Villalobos and A. Cantu, 5 males (sl 2.10–3.03 mm), 1 ovigerous female (sl 2.20 mm). SAINT MARTIN: Le Galion, UF 32041, 15 April 2012, coll. J. Slapcinsky, M. Bernis and A. Anger, 1 male (sl 2.80 mm). COSTA RICA: Talamanca—Cahuita, NHMLA 555-3, 15 July 1977, coll. K. Nelson and D. Hedgecock, 2 males (sl 3.17 mm; 3.19 mm)—Puerto Vargas, CCDB 4131, 14 February 2009, coll. F.L. Mantelatto and I. Wehrtmann, 1 male (sl 1.72 mm), 2 females (sl 1.58 mm; 2.56 mm), 1 ovigerous female (sl 2.27 mm)—Puerto Vargas, CCDB 4160, 23 May 2010, coll. F.L. Mantelatto, M. Terossi, D.F. Peiró and I. Wehrtmann, 2 males (sl 2.24 mm; 3.03 mm), 1 female (sl 2.48 mm)—Puerto Viejo, Playa Puerto Viejo, CCDB 550, 05 April 2007, coll. F.L. Mantelatto et al., 4 males (sl 2.30–3.39 mm), 1 female (sl 2.95 mm). PANAMA: Bocas del Toro—Bocas del Toro, CCDB 3578, 03 August 2011, coll. F.L. Mantelatto, 3 males (sl 2.67–2.96 mm), 2 females (sl 2.35 mm; 3.25 mm), 1 ovigerous female (sl 2.85 mm)—Bocas del Toro, Playa Paunch, CCDB 3575, 05 August 2011, coll. F.L. Mantelatto, M.P. Negri, N. Rossi and T. Magalhães, 4 males (sl 2.07 –2.81 mm), 2 ovigerous females (sl 2.29 mm; 2.52 mm)—Bocas del Toro, Playa Bluff, CCDB 4164, 17 February 2009, coll. F.L. Mantelatto, M. Terossi, I. Miranda and A. Baeza, 1 male (sl 3.23 mm). VENEZUELA: Nueva Esparta—Porlamar, Isla Margarita, Playa Valdez, CCDB 1810, 27 August 2006, coll. F.L. Mantelatto and L.G. Pileggi, 3 males (sl 3.56–4.77 mm), 1 female (sl 2.96 mm), 3 ovigerous females (sl 2.88–3.20 mm). BRAZIL: Piauí—Luís Correia, Praia do Coqueiro, CCDB 4158, 01 July 2006, coll. J.M. Góes, 2 males (sl 3.87 mm; 4.40 mm), 1 ovigerous female (sl 3.55 mm). Ceará—Trairi, Praia Flecheiras, CCDB 2651, 20 May 2008, coll. M. Terossi and I. Miranda, 8 males (sl 1.94–5.65 mm)—Trairi, Praia Flecheiras, CCDB 4273, 20 May 2008, coll. M. Terossi, 2 males (sl 1.44 mm; 2.01 mm), 1 female (sl 2.53 mm)—Paracuru, Praia da Pedra Rachada, CCDB 5923, 14 November 2015, coll. F.L. Mantelatto, L. Bezerra and A. Almeida, 6 males (sl 3.10–4.51 mm)— Caucaia, Praia do Pacheco, CCDB 4503, 12 February 2013, coll. F.L. Mantelatto, L. Bezerra and F. Bezerra, 4 males (sl 2.35–4.41 mm), 1 female (sl 2.73 mm)—Fortaleza, Praia Meireles, CCDB 4274, 22 May 2008, coll. M. Terossi and I. Miranda, 3 males (sl 2.47–3.51 mm), 2 females (sl 2.60 mm; 2.84 mm). Rio Grande do Norte—Touros, Praia de Perobas, CCDB 3366, 10 June 2011, coll. L.G. Pileggi and R. Robles, 1 male (sl 2.92 mm)—Touros, Praia de Perobas, CCDB 3367, 10 June 2011, coll. L.G. Pileggi and R. Robles, 1 male (sl 4.64 mm)—Touros, Praia de Perobas, CCDB 3373, 10 June 2011, coll. L.G. Pileggi and R. Robles, 1 female (sl 2.40 mm). Pernambuco—Ipojuca, Praia de Serrambi, CCDB 1727, 25 July 2012, coll. F.L. Mantelatto and F.B. Mantelatto, 5 males (sl 2.53–5.12 mm), 2 females (sl 2.23 mm; 2.98 mm), 4 ovigerous females (sl 2.11–2.04 mm)—Ipojuca, Praia de Serrambi, CCDB 5762, 21 July 2015, coll. F.L. Mantelatto, F.B. Mantelatto and R.B. Mantelatto, 4 males (sl 2.84–3.13 mm), 2 females (sl 1.91 mm; 2.53 mm). Alagoas—Maragogi, CCDB 4920, 5 October 2013, coll. F.L. Mantelatto and F.B. Mantelatto, 9 males (sl 2.80–3.71 mm), 1 ovigerous female (sl 3.30 mm)—Maragogi, Praia do Bitingui, CCDB 5586, 10 January 2015, coll. F.L. Mantelatto, F.B. Mantelatto, R.B. Mantelatto and H. Mantelatto, 4 males (sl 2.20–3.60 mm), 1 female (sl 2.30 mm), 3 ovigerous females (sl 2.46 mm–2.51 mm). Bahia—Lauro de Freitas, Praia do Ipitanga, 22 July 2011, coll. F.L. Carvalho and E.A. Souza-Carvalho, 1 male (sl 3.30 mm), 1 female (sl 2.70 mm)—Salvador, Ilha dos Frades, CCDB 4139, 17 July 2003, coll. M. Terossi, 1 male (sl 2.91 mm)—Salvador, Praia do Forte, CCDB 4133, 18 December 2003, coll. M. Terossi, 1 male (sl 2.21 mm)—Salvador, Praia do Forte, CCDB 4137, 18 December 2003, coll. M. Terossi, 1 male (sl 2.62 mm)—Salvador, Praia do Forte, CCDB 4138, 18 December 2003, coll. M. Terossi, 1 male (sl 1.94 mm)—Salvador, Praia de Ondina, CCDB 4135, 14 December 2003, coll. M. Terossi, 2 males (sl 3.63 mm; 4.10 mm), 1 female (sl 3.02 mm), 2 ovigerous females (sl 2.22 mm; 2.93 mm)—Ilhéus, Olivença, Praia Back Door, CCDB 2610, 18 July 2003, coll. A.O. Almeida and J.T.A. Santos, 2 males (sl 4.26 mm; 4.29 mm)—Ilhéus, Praia da Maramata, CCDB 2597, 31 March 2009, coll. F.L. Mantelatto and A.O. Almeida, 2 males (sl 3.05 mm; 4.44 mm), 1 ovigerous female (sl 2.96 mm)—Porto Seguro, Arraial D’Ajuda, CCDB 4193, 08 January 2012, coll. F.L. Carvalho and E.A. Souza-Carvalho,1 female (sl 2.50 mm)—Porto Seguro, Praia da Pitinga, CCDB 585, 29 January 2001, coll. F.L. Mantelatto and R. Garcia, 5 males (sl 2.90–3.67 mm), 2 ovigerous females (sl 3.40 mm; 3.67 mm). Espírito Santo—Vitória, Ilha do Frade, CCDB 4118, 21 June 2012, coll. F.L. Carvalho, R. Robles and D.F. Peiró, 1 male (sl 3.91 mm), 3 females (sl 3.40–3.74 mm), 2 ovigerous females (sl 3.01 mm; 3.32 mm)—Guarapari, Canal de Guarapari, CCDB 2243, 04 November 2006, coll. F.L. Mantelatto, D.F. Peiró, and E.C. Mossolin, 2 males (sl 3.30 mm; 3.91 mm), 3 ovigerous females (sl 3.28 mm–3.63 mm)—Anchieta, Praia de Iriri, CCDB 4012, 19 June 2012, coll. F.L. Carvalho, R. Robles and D.F. Peiró, 1 male (sl 3.74 mm), 1 female (sl 3.32 mm)—Piúma, Praia de Piúma, CCDB 4072, 15 June 2012, coll. F.L. Carvalho, R. Robles and D.F. Peiró, 1 male (sl 1.82 mm), 1 female (sl 3.90 mm), 1 ovigerous female (sl 3.33 mm). Rio de Janeiro—Búzios, Praia da Tartaruga, CCDB 5655, 20 May 2015, coll. N. Rossi, 1 male (sl 4.97 mm)—Búzios, Porto da Barra, CCDB 5902, 24 April 2006, coll. R. Bispo, R. Johnsson, W. Santana and F. Faria, 3 males (sl 2.95–5.34 mm), 2 females (sl 2.74 mm; 3.11 mm). São Paulo—Ubatuba, Praia do Perequê Mirim, CCDB 2906, 19 November 2002, coll. F.L. Mantelatto, 3 males (sl 4.16–4.90 mm), 1 female (sl 3.92 mm)—Ubatuba, Saco do Codó, CCDB 2813, 01 May 2002, coll. F.L. Mantelatto, 1 male (sl 2.68 mm)—São Sebastião, Mangue do Araçá, CCDB 1462, 18 July 2004, coll. F.L. Mantelatto, 1 male (sl 3.60 mm)—São Sebastião, Mangue do Araçá, CCDB 5061, 10 September 2013, coll. F.L. Mantelatto et al., 1 male (sl 4.24 mm)—São Sebastião, Mangue do Araçá, CCDB 5062, 10 September 2013, coll., F.L. Mantelatto et al., 2 males (sl 3.29 mm; 3.76 mm), 5 females (sl 2.76–3.76 mm), 2 ovigerous females (sl 2.81 mm; 3.53 mm). Santa Catarina—Itajaí, Praia Cabeçudas, CCDB 1876, 19 June 2007, coll. F.L. Mantelatto, L.G. Pileggi, L.S. Torati and E.C. Mossolin, 2 males (sl 4.89 mm; 4.90 mm), 1 ovigerous female (sl 4.40 mm).
Diagnosis
Shield subrectangular. Second and third pair of pereiopods with dactyl shorter than propodus, lateral surface of merus with a dark stripe on light background and lateral surfaces of carpus, propodus and dactyl with a light stripe on dark background; dactyl with orange distal region.
Description
Shield (Figure 1 and Figure 9a) subrectangular, longer than broad, with cervical suture and linea transversalis well developed; anterior margin between rostrum and lateral projections straight; lateral margins slightly sloping; dorsal surface plain, lateral region with 2–5 tufts of long setae and anterior region with few scattered setae. Rostrum triangular, twice as long as lateral projections.
Ocular peduncles (Figure 1 and Figure 9a) as long as frontal width, cylindrical, slightly broader at the base, left slightly longer than right; dorsal surface with scattered tufts of short setae. Corneas slightly dilated. Ocular acicles (Figure 9a,b) subrectangular, long, closely set; dorsodistal margin with 39 spines, spines shorter in middle region; dorsal surface plain and slightly concave; dorsodistal margin with few setae.
Antennular peduncles (Figure 9a) long, occasionally exceeding distal margin of left cornea when extended. Last segment with short, scattered dorsal setae. Penultimate segment with long, scattered dorsal setae.
Antennal peduncles (Figure 1 and Figure 9a,c) barely reaching distal margin of cornea. Fifth segment dorsal surface with tufts of short setae, lateral margin with tufts of long setae. Fourth segment dorsolateral region of distal margin with one spine and setae. Third segment ventrodistal margin with one spine and setae. Second segment dorsodistal and laterodistal margins with tufts of setae; laterodistal margin with one spine; lateral margins occasionally with projections. First segment unarmed. Flagella long, slender, reaching to dactyl of first pair of pereiopods, with short setae. Antennal acicle lateral and dorsal surfaces with long, scattered setae; lateral and dorsal surfaces with 59 spines.
Chelipeds subequal, right slightly larger than left. Chela (Figure 1 and Figure 9d) twice as long as broad; dorsal surface with short spines; ventral surface with tubercles and tufts of setae; palm and fixed finger with scattered setae; fixed finger lateral surface with tufts of short setae; fixed finger and dactyl ending in spoon-shaped corneous tip. Carpus short, lateral and mesial surfaces with scattered tubercles and long setae, similar to chela; dorsal surface mesial angle with row of spines and long setae; few dorsodistal spines; ventral surface unarmed. Merus long, dorsal surface with small tubercles, long setae and some dorsodistal spines; ventromesial margin with row of short spines; ventral surface with few tufts of setae and few lines. Ischium unarmed.
Second and third pereiopods (Figure 1 and Figure 9e) similar, long and slender. Dactyl about 0.8 length of propodus, ending in a sharp, curved corneous claw; dorsal and ventral surfaces with tufts of setae; ventral surface with row of spines; left third pereiopod flattened, with dorsolateral ridge. Propodus about 1.5 as long as carpus; surfaces with tufts of scattered setae; laterodistal and ventrodistal margins with short spines; left third pereiopod flattened, with dorsolateral ridge. Carpus about 0.7 length of merus; second pair of pereiopods with dorsal row of tufts of short setae; third pair of pereiopods with row of tufts of long setae; lateral and mesial surfaces with few tufts of setae; second pair of pereiopod with 1–4 dorsodistal spines, third pair with one dorsodistal spine. Merus ventral and dorsal surfaces, and dorsodistal and dorsoventral margins with row of tufts of setae, with distoventral short spines and one distolateral spine. Ischium with tufts of setae.
Fourth pereiopod (Figure 1 and Figure 9f) semichelate; dorsal and ventral surfaces with long setae. Dactyl ending in corneous claw, ventrolateral row of small spines. Propodal rasp well developed. Carpus with dorsodistal spine.
Fifth pereiopod (Figure 1 and Figure 9g) chelate, with scattered tufts of long setae. Propodal rasp well developed, covering about one third of propodus lateral surface.
Uropods asymmetrical, left larger than right. Endopodal and exopodal rasps well developed, dorsolateral margins with setae.
Telson (Figure 9h) asymmetrical, left lobe larger than right. Distal margin of posterior lobes rounded, with row of short spines and long setae; lobes separated by distinct median cleft; lateral margins with long setae and indentations distinct.
Color (Fresh Specimen)
Shield with small white spots and darker anterior region. Ocular peduncles greenish-blue with a brown area on dorsal surface. Antennular peduncles orange with a bluish color on distal region of the segment; antennular flagella orange. Antennal peduncles orange with a yellowish color on first two segments; Antennal flagella orange. Chelipeds olive to rusty brown with white spines and white tubercles; chela with a lighter color. Second and third pair of pereiopods with a dark stripe on light background on lateral surface of merus; a light stripe on dark background on lateral surfaces of carpus, propodus and dactyl; dactyl with orange distal region. Figure 1 shows a preserved specimen with the original color pattern and supplements the above description.
Distribution
Western Atlantic: Bermuda, Florida, Gulf of Mexico, Belize, Costa Rica, Panama, Antilles, north of South America, and Brazil (Atol das Rocas, Piauí, Ceará, Rio Grande do Norte, Paraíba, Pernambuco, Alagoas, Bahia, Espirito Santo, Rio de Janeiro, São Paulo, and Santa Catarina). Usually intertidal and found in shallow waters, over rocks, coral reefs and banks of Halodule [28,29,30,31,32].
Remarks
The similarity between C. brasiliensis and C. antillensis was first noted by Stimpson [38]; however, Forest and Saint Laurent [28] later stated that the description of C. brasiliensis and the original figure of Dana [75] corresponded to C. antillensis. Although the name C. brasiliensis had priority, Forest and Saint Laurent [28] did not reestablish it, because it was not mentioned since Moreira [80]; therefore, the valid name is C. antillensis. The holotype of C. antillensis was collected by Theo Gill and it should be at the National Museum of Natural History, Smithsonian Institution, at United States of America; however, it seems to be lost, according to Provenzano [39]; according to the database of WoRMS edited by Lemaitre and McLaughlin [89], the syntype is deposited in the Naturhistorisches Museum, Switzerland (catalogue NHM 61.44), but not checked by us.
Clibanarius tricolor and C. antillensis are very close morphologically and it is hard to distinguish them when they are preserved and lost their original color. C. antillensis is found from the USA (Florida) to the south of Brazil (Santa Catarina) and C. tricolor is found from the USA (Florida) to the southeast of Brazil (Espírito Santo) [29,30,32]. Both are the only species of the genus Clibanarius from the Western Atlantic that have dactyls of second and third pair of pereiopods shorter than propodi. They are easily distinguishable by their second and third pair of pereiopods original color pattern, once C. tricolor has transverse orange bands on proximal margins of segments, which, except for white or yellow background dactyl, is otherwise blue with dark punctae; C. antillensis has broad longitudinal stripes on dark background, as described above. When preserved in alcohol, the blue on pereiopods of C. tricolor fades, remaining only orange bands and punctae; on C. antillensis, they become orange with lighter stripes [39].
4. Discussion
4.1. Genetic Structure
Based on our analyses for 16S rRNA and COI genes, we found no genetic structure for C. antillensis along its distribution. The intraspecific divergence was lower than the interspecific variability for both genes, without an evident interspecific gap for 16S rRNA (Figure 3). This occurred due to the proximity between the intraspecific divergence of C. antillensis (0.99%) and the interspecific divergence between Clibanarius vitattus and C. symmetricus (1.48%), two species that possibly went through recent divergence processes [44]. Besides that, there was no gap within intraspecific variability of C. antillensis, which indicated the absence of population structure. Additionally, the phylogenetic trees, as well as the haplotype networks, did not show any grouping pattern that may indicate genetic structure (Figure 4, Figure 5 and Figure 6). This was also evidenced by AMOVA, as within localities variance components were higher than among localities.
Many marine species have populations widely distributed with low genetic differentiation and habitats interconnected by gene flow [8]. Some examples among decapods distributed along the western Atlantic can be mentioned: the slipper lobsters Scyllarides brasiliensis Rathbun, 1906 [90], the mangrove crab Ucides cordatus Linnaeus, 1763 [24,91], the swimming crab Callinectes danae Smith, 1869 [22] and the congeneric species Clibanarius sclopetarius [27]. The absence of genetic structure within these species, as well as among specimens of C. antillensis from different localities, may be explained by the lack of physical barriers restricting gene flow and by their larval dispersive capacity [92].
In general, many marine species have planktonic larval stages, and their wide dispersal may happen during their first development weeks. In this period, a large number of larvae are released and passively transported by marine currents system, through which individuals might reach long distances and promote genetic and demographic connectivity among populations [18,93,94,95]. Along the western Atlantic, there is the South Equatorial Current, which reaches the Brazilian coast (9–15° S) and bifurcates into north (Northern Brazilian Current) and south (Brazil Current) [96]. This bifurcation has different effects on the genetic structure of many marine species, acting as a barrier to gene flow [97,98] or not [45,90,91]. These currents may not prevent gene flow of C. antillensis, in fact, they may facilitate the dispersion of its larvae. Current systems are associated with long-distance connectivity and long duration of larval stages [3,99]. C. antillensis larvae go through five to six stages of development, which altogether take at least 43 days [34,35].
Salinity is another feature limiting the dispersal of species. It is relevant especially in estuarine areas and other coastal environments, since it presents high and constant variations, which affect the physiology and ecology of organisms [19]. It may influence biochemical composition, growth, survival and development of larvae [100,101], feeding activity [19], carbon accumulation rates [102], as well as osmoregulatory activities [103]. In fact, salinity has been described as a barrier for dispersion and gene flow of some decapod’s species [22,26,104,105]. In those studies, the absence of gene flow between populations resulted from the incapacity of their larvae to traverse the Amazon River plume at the Atlantic Ocean, where the volume of water discharged changes the local salinity.
On the other hand, the outflow of the Amazon River has not been a barrier for the dispersal of other decapods [22,91] since the larvae may be more tolerant to low salinity. This might be the case of C. antillensis larvae, which can develop at salinity levels of 29–35 ppt [34,35]. However, adults probably are not able to establish on conditions where the salinity is reduced, since there is a gap along their distribution [28,30,31], which corresponds to the north region of Brazil, where the Amazon river ends and promote salinity influence.
Genetic connectivity may also be influenced by behavioral site fidelity and local retention of larvae [11,20]. Hence, even if the larvae present high dispersal potential, if they are retained next to their natal populations for many generations, populations might undergo through enough differentiation, resulting on genetic structure [11]. In addition, there are many other features interfering on genetic structure, such as the biology and life cycle, habitat, local oceanic conditions, local adaptation, ecological and geographic limitations, past geological events, and recent history. Together, they may influence gene flow at specific directions or moments [8,10,14,106,107,108]. Therefore, even if different species have similar dispersal capacity, it is not easy to establish genetic structure patterns, since they are influenced by different factors at the same time [8,23,109].
4.2. Genetic Diversity
In addition to the lack of genetic structure in C. antillensis, a high genetic diversity was found, especially for the COI gene, which presented a total nucleotide diversity of 0.01253 and haplotype diversity of 0.995. The former value is considered high when π > 0.005 [110] and the closeness of the latter to 1 indicates high number of singletons, which corresponds to an individual sequence of certain gene [111]—as observed in the haplotype network for COI (Figure 6b). The high number of low-frequency haplotypes, as well as high values of nucleotide and haplotype diversities might be related to large and stable populations with long evolutionary history and high mutation rates or with secondary contact between different lineages [110,112]. High diversity indexes using the same gene were also found on studies of Opecarcinus hypostegus (Hd = 0.9994, π = 0.02558) [113], U. cordatus (Hd = 0.9820, π = 0.005862) [91] and Callinectes ornatus (Hd = 0.9570, π = 0.01360) [22], which may indicate that their populations have been stable through time or undergone through a slightly recent expansion [22,91]. For C. antillensis, the BSP recovered a long demographic history from 700,000 years ago, with periods of stabilization and small population expansion (Figure 8). Demographic expansion was also evidenced by significant and negative values of neutrality tests for both genes [114] and by mismatch distribution, with a unimodal distribution pattern and non-significant SSD and HRI values [66] (Figure 7).
These results may reflect historical processes, such as past geological events and the demographic history, which could influence current geographical distribution and genetic variation of marine individuals. The high genetic diversity is common to many marine species [115,116,117]. It might be preserved by long-distance dispersal during expansion [116], or many migrations among close areas, generating a higher number of new haplotypes than others that are lost [118,119].
The demographic history and distribution of many marine species were influenced by climatic fluctuations that occurred during Pleistocene (~2.6 million–10,000 years ago) [120,121]. During glacial periods, many populations of marine species used to refuge on low latitude regions, possibly resulting in genetic drift. When the climate became warmer, they would recolonize other areas and reestablish populations that had disappeared during the previous glacial event [122,123,124,125]. Consequently, genetic diversity would be considerably higher in areas where colonizers came from different refuges compared to those originated from a single population source [126,127]. Some haplotypes were exclusive because they may have not participated in recolonization [124].
Nonetheless, each species had a unique response to climatic oscillations during glaciation [17]. There are many marine species that were not strongly affected by glacial periods, consequently, their populations probably continued to expand during these periods, resulting in lack of genetic structure [89,125,128,129]. This might be the case of C. antillensis. The almost continuous expansion with periods of stabilization indicated by the BSP analyses for the last 700,000 years, associated with high values of haplotype and nucleotide diversities, do not indicate that this species went through any genetic bottleneck followed by expansion. Therefore, if the species had refuged during Pleistocene, there would not have been sufficient isolation to cause a reduction on genetic diversity or its populations would have isolated themselves in many refuges, maintaining the diversity on periods when population growth was more stable.
4.3. Morphological Variations
Morphological analyzes have also corroborated the absence of genetic structure. Although some features presented variability, they have not shown any pattern related to geographic groups, and in some cases, specimens from the same locality presented differences in characters. Intraspecific morphological variations without any pattern have been reported for other decapods with wide distribution [130,131,132]. These differences, as well as the distinct coloration patterns found among adults [37], may be related to environmental conditions (habitat, wave action, food supply, and salinity), local selection pressures and intra or interspecific interactions that may affect each organism differently [133,134,135].
Among the characters analyzed, the number of spines of the ocular acicles, antennal acicles and second pereiopod carpus presented the largest variation. They also differed from the literature descriptions (Table 5).
In the present study, ocular acicles had three to nine spines on dorsodistal margin, in which seven to nine spines were found on 30 specimens, mainly on male, followed by ovigerous females and females from different localities. According to the literature, the number of spines was: three or four [30,74], six [39], and up to six [31].
In the present study, antennal acicles had five to nine spines on lateral and dorsal surfaces, in which eight or nine spines were found on 34 specimens, mainly on male, followed by female and ovigerous females from different localities. According to the literature, the number of spines was up to seven [31].
In the present study, the carpus of the second pereiopod had one to four spines, in which three or four spines were found only on five males and one ovigerous female from Mexico and four Brazilian states. According to the literature, the number of spines was one or two [39].
The importance of including detailed variations on a redescription of the species is to assure that some traits are not neglected and to facilitate the differentiation of closely related taxon [130]. Hermit crabs are usually hard to be distinguished by a unique character, especially if they have lost their original color [130]. C. vittatus and C. symmetricus, for example, only differ by the color pattern of their pereiopods [44], as well as C. antillensis and C. tricolor. Therefore, if preserved specimens have lost their color, the availability of a set of characters is required to facilitate their distinction.
It is important to define the genetic diversity of marine species once it allows us to understand how historical processes and contemporary environmental conditions have influenced their populations along their distribution. In addition, they may reveal aspects of gene flow, evolution, genetic differentiation, and spatial population boundaries [136]. Such studies, consequently, provide information about biodiversity and conservation strategies of species [137,138]. The present study enables the understanding of marine phylogeographic patterns along the western Atlantic Ocean. Overall, our mitochondrial data for both 16S rRNA and COI genes and morphological comparisons did not reveal structure patterns, related or not to geographical patterns, among populations of C. antillensis. These results may be explained by a set of factors including planktonic larval duration of the species and the absence of effective barriers to gene flow. Besides, there were high genetic diversity for COI gene and signs of population expansion in neutrality tests, mismatch distribution and Bayesian skyline plot. This last analysis revealed small population effective size expansion in the last 700,000 years, with some periods of stabilization, and no evidence of bottleneck effect. Therefore, the species might not have been strongly influenced by Pleistocene climatic oscillations.
Author Contributions
Conceptualization, F.L.M.; methodology, K.S.N., M.N. and F.L.M.; formal analysis, K.S.N. and M.N.; investigation, K.S.N. and M.N.; resources, F.L.M.; writing—original draft preparation, K.S.N., M.N. and F.L.M.; writing—review and editing, K.S.N., M.N. and F.L.M.; visualization, K.S.N., M.N. and F.L.M.; supervision, M.N. and F.L.M.; project administration, F.L.M.; funding acquisition, F.L.M. All authors have read and agreed to the published version of the manuscript.
Funding
The present study is part of a long-term project to evaluate the taxonomy and genetic variability of decapods in the Western Atlantic, and was supported by scientific grants provided to FLM. This research is part of a Bachelor’s thesis by KSN, supported by scientific fellowships from Coordenação de Aperfeiçoamento de Pessoal de Nível Superior (CAPES—Ciências do Mar II) and Fundação de Amparo à Pesquisa do Estado de São Paulo (FAPESP—Proc. 2016/22448-1). MN received support from a post-doctoral fellowship from Conselho Nacional de Desenvolvimento Científico e Tecnológico (CNPq—PROTAX Proc. 152377/2016-6). Major financial support for this project was provided by FAPESP (Temáticos Biota 2010/50188-8 and INTERCRUSTA 2018/13685-5; Coleções Científicas 2009/54931-0; PROTAX 2016/50376-5), CNPq (301359/2007-5; 473050/2007-2; 302748/2010-5; 471011/2011-8; PQ 304968/2014-5 and 302253/2019-0) and CAPES—Código de financiamento 001 (Ciências do Mar II Proc. 2005/2014—23038.004308/2014-14) to FLM.
Institutional Review Board Statement
Not applicable.
Informed Consent Statement
Not applicable.
Data Availability Statement
Sequences of this study are available from GenBank (accession numbers MG264431–MG264512, MT740091).
Acknowledgments
We are grateful to Darryl Felder and Catherine Craig (ULLZ), Fernando Álvarez and José Luis Villalobos (CNCR), Gustav Paulay and John Slapcinskyl (UF), Rafael Lemaitre and Karen Reed (USNM), Estefania Rodriguez and Lily Berniker (AMNH), Kathy Omura, Regina Wetzer, Dean Pentcheff and Adam Wall (NHMLA), and Heather Bracken-Grisson (FIU) for loans and donations of material; Natália Rossi, Rafael Robles, Raquel Buranelli and Tatiana Magalhães (LBSC) for their help with materials from collections; all members of LBSC for their contributions during the development of this research, and the anonymous reviewers for their important corrections during review process. The collections of species conducted in this study complied with current applicable state and federal laws of Brazil (permanent license to FLM for collection of Zoological Material No. 11777-1 MMA/IBAMA/SISBIO).
Conflicts of Interest
The authors declare no conflict of interest.
References
- Futuyma, D.J. Evolutionary Biology, 2nd ed.; Sinauer Associates: Sunderland, MA, USA, 1986; ISBN 978-0-87893-188-0. [Google Scholar]
- Heywood, V.H.; Watson, R.T. Global Biodiversity Assessment: Summary for Policy-Makers; Watson, R.T., Heywood, V.H., Baste, I., Dias, B., Gámez, R., Reid, W., Ruark, G., Eds.; Cambridge University Press: Cambridge, UK, 1995; ISBN 978-0-521-56481-6. [Google Scholar]
- Slatkin, M. Gene flow and the geographic structure of natural populations. Science 1987, 236, 787–792. [Google Scholar] [CrossRef] [PubMed]
- Slatkin, M.; Barton, N.H. A comparison of three methods for estimating average levels of gene flow. Evolution 1989, 43, 1349–1368. [Google Scholar] [CrossRef] [PubMed]
- Palumbi, S.R. Macrospatial genetic structure and speciation in marine taxa with high dispersal abilities. In Molecular Zoology: Advances, Strategies, and Protocols; Ferraris, J.D., Palumbi, S.R., Eds.; Wiley-Liss: New York, NY, USA, 1996; pp. 101–113. ISBN 978-0-471-14449-6. [Google Scholar]
- Collin, R. The effects of mode of development on phylogeography and population structure of north Atlantic Crepidula (Gastropoda: Calyptraeidae). Mol. Ecol. 2001, 10, 2249–2262. [Google Scholar] [CrossRef] [PubMed]
- Avise, J.C. Molecular Markers, Natural History and Evolution; Springer: New York, NY, USA, 1994; ISBN 978-1-4615-2381-9. [Google Scholar]
- Palumbi, S.R. Genetic divergence, reproductive isolation, and marine speciation. Annu. Rev. Ecol. Syst. 1994, 25, 547–572. [Google Scholar] [CrossRef]
- Silva, I.C.; Mesquita, N.; Paula, J. Lack of population structure in the fiddler crab Uca annulipes along an East African latitudinal gradient: Genetic and morphometric evidence. Mar. Biol. 2010, 157, 1113–1126. [Google Scholar] [CrossRef]
- Hedgecock, D. Is gene flow from pelagic larval dispersal important in the adaptation and evolution of marine invertebrates? Bull. Mar. Sci. 1986, 39, 550–564. [Google Scholar]
- Taylor, M.S.; Hellberg, M.E. Genetic evidence for local retention of pelagic larvae in a Caribbean reef fish. Science 2003, 299, 107–109. [Google Scholar] [CrossRef]
- Baums, I.B.; Paris, C.B.; Chérubin, L.M. A bio-oceanographic filter to larval dispersal in a reef-building coral. Limnol. Oceanogr. 2006, 51, 1969–1981. [Google Scholar] [CrossRef]
- Burton, R.S. Protein polymorphisms and genetic differentiation of marine invertebrate populations. Mar. Biol. Lett. 1983, 4, 193–206. [Google Scholar]
- Scheltema, R.S. On dispersal and planktonic larvae of benthic invertebrates: An eclectic overview and summary of problems. Bull. Mar. Sci. 1986, 39, 290–322. [Google Scholar]
- Morgan, S.G. Predation by planktonic and benthic invertebrates on larvae of estuarine crabs. J. Exp. Mar. Biol. Ecol. 1992, 163, 91–110. [Google Scholar] [CrossRef]
- Morgan, S.G. Life and death in the plankton: Larval mortality and adaptation. In Ecology of Marine Invertebrate Larvae; McEdward, L., Ed.; CRC Press: Boca Raton, FL, USA, 1995; pp. 279–321. ISBN 978-0-13-875895-0. [Google Scholar]
- Hewitt, G. Some genetic consequences of ice ages, and their role in divergence and speciation. Biol. J. Linn. Soc. Lond. 1996, 58, 247–276. [Google Scholar] [CrossRef]
- Gaylord, B.; Gaines, S.D. Temperature or transport? Range limits in marine species mediated solely by flow. Am. Nat. 2000, 155, 769–789. [Google Scholar] [CrossRef] [PubMed]
- Anger, K. The Biology of Decapod Crustacean Larvae; A.A. Balkema Publishers: Lisse, The Netherlands, 2001; ISBN 978-90-265-1828-7. [Google Scholar]
- Avise, J.C. Phylogeography: Retrospect and prospect. J. Biogeogr. 2009, 36, 3–15. [Google Scholar] [CrossRef]
- Boehm, J.T.; Woodall, L.; Teske, P.R.; Lourie, S.A.; Baldwin, C.; Waldman, J.; Hickerson, M. Marine dispersal and barriers drive atlantic seahorse diversification. J. Biogeogr. 2013, 40, 1839–1849. [Google Scholar] [CrossRef]
- Peres, P.A.; Mantelatto, F.L. Salinity tolerance explains the contrasting phylogeographic patterns of two swimming crabs species along the tropical western Atlantic. Evol. Ecol. 2020, 34, 589–609. [Google Scholar] [CrossRef]
- Gopurenko, D.; Hughes, J.M. Regional patterns of genetic structure among Australian populations of the mud crab, Scylla serrata (Crustacea: Decapoda): Evidence from mitochondrial DNA. Mar. Freshw. Res. 2002, 53, 849–857. [Google Scholar] [CrossRef]
- Oliveira-Neto, J.F.; Pie, M.R.; Boeger, W.A.; Ostrensky, A.; Baggio, R.A. Population genetics and evolutionary demography of Ucides cordatus (Decapoda: Ocypodidae). Mar. Ecol. 2007, 28, 460–469. [Google Scholar] [CrossRef]
- Mayr, E. Populações, Espécies e Evolução; Cia Ed Nacional: São Paulo, Brasil, 1977. [Google Scholar]
- Mandai, S.S.; Buranelli, R.C.; Schubart, C.D.; Mantelatto, F.L. Phylogenetic and phylogeographic inferences based on two DNA markers reveal geographic structure of the orange claw hermit crab Calcinus tibicen (Anomura: Diogenidae) in the western Atlantic. Mar. Biol. Res. 2018, 14, 565–580. [Google Scholar] [CrossRef]
- Negri, M.; Pileggi, L.G.; Mantelatto, F.L. Molecular barcode and morphological analyses reveal the taxonomic and biogeographical status of the striped-legged hermit crab species Clibanarius sclopetarius (Herbst, 1796) and Clibanarius vittatus (Bosc, 1802) (Decapoda: Diogenidae). Invert. Syst. 2012, 26, 561–571. [Google Scholar] [CrossRef]
- Forest, J.; Saint Laurent, M. Compagne de la calypso au large des côtes Atlantiques de l’Amérique Du Sud (1961–1962). 6. Crustacés Décapodes: Pagurides. Ann. Inst. Oceanogr. 1968, 45, 47–169. [Google Scholar]
- Coelho, P.A.; Ramos-Porto, M. Sinopse dos crustáceos decápodos Brasileiros (Família Callianassidae, Callianideidae, Upogebiidae, Parapaguridae, Paguridae, Diogenidae). Trop. Ocean. 1987, 19, 27–53. [Google Scholar] [CrossRef][Green Version]
- De Melo, G.A.S. Manual de identificação dos Crustacea Decapoda do Litoral Brasileiro: Anomura, Thalassinidea, Palinuridea, Astacidea; Editora Plêiade: São Paulo, Brasil, 1999; ISBN 978-85-85795-08-5. [Google Scholar]
- Nucci, P.R.; De Melo, G.A.S. Hermit crabs from Brazil: Family Diogenidae (Crustacea: Decapoda: Paguroidea), except Paguristes. Zootaxa 2015, 3947, 327–346. [Google Scholar] [CrossRef] [PubMed]
- Mantelatto, F.L.; Miranda, I.; Vera-Silva, A.L.; Negri, M.; Buranelli, R.C.; Terossi, M.; Magalhães, T.; Costa, R.C.; Zara, F.J.; Castilho, A.L. Checklist of decapod crustaceans from the coast of the São Paulo State (Brazil) supported by integrative molecular and morphological data: IV. Infraorder Anomura: Superfamilies Chirostyloidea, Galatheoidea, Hippoidea and Paguroidea. Zootaxa 2021, in press. [Google Scholar]
- Hazlett, B.A. The behavioral ecology of hermit crabs. Annu. Rev. Ecol. Syst. 1981, 12, 1–22. [Google Scholar] [CrossRef]
- Brossi-Garcia, A.L.; Hebling, N.J. Desenvolvimento pós-embrionário de Clibanarius antillensis Stimpson, 1859 (Crustacea, Diogenidae), em laboratório. Bol. Zool. 1983, 6, 89–111. [Google Scholar] [CrossRef][Green Version]
- Siddiqui, F.A.; McLaughlin, P.A.; Crain, J.A. Larval development of Clibanarius antillensis Stimpson, 1859 (Crustacea: Anomura: Diogenidae) reared under laboratory conditions: A comparison between Panamanian and Brazilian populations. J. Nat. Hist. 1991, 25, 917–932. [Google Scholar] [CrossRef]
- Cházaro-Olvera, S.; Robles, R.; Montoya-Mendoza, J.; Herrera-López, J.A. Intraspecific variation in Megalopae of Clibanarius antillensis (Anomura, Diogenidae) among western Atlantic populations. Nauplius 2018, 26, e2018031. [Google Scholar] [CrossRef]
- Mantelatto, F.L.; (University of São Paulo Ribeirão Preto, São Paulo, Brazil). Personal Communication, 2014.
- Stimpson, W. XI.-Notes on North American Crustacea, No. 1. Ann. Lyceum Nat. Hist. N. Y. 1859, 7, 49–93. [Google Scholar] [CrossRef]
- Provenzano, A.J. The shallow-water hermit crabs of Florida. Bull. Mar. Sci. 1959, 9, 349–420. [Google Scholar]
- Schubart, C.; Neigel, J.; Felder, D. The use of the mitochondrial 16S rRNA gene for phylogenetic and biogeographic studies of crustacea. Crustac. Issues 2000, 12, 817–830. [Google Scholar]
- Mantelatto, F.L.; Robles, R.; Felder, D.L. Molecular phylogeny of the western Atlantic species of the Genus Portunus (Crustacea, Brachyura, Portunidae). Zool. J. Linn. Soc. 2007, 150, 211–220. [Google Scholar] [CrossRef]
- Estoup, A.; Largiader, C.; Perrot, E.; Chourrout, D. Rapid one-tube DNA extraction for reliable PCR detection of fish polymorphic markers and transgenes. Mol. Mar. Biol. Biotechnol. 1996, 5, 295–298. [Google Scholar]
- Sambrook, J.; Fritsch, E.F.; Maniatis, T. In vitro amplification of DNA by the polymerase chain reaction. In Molecular Cloning: A Laboratory Manual; Sambrook, J., Fritsch, E.F., Maniatis, T., Eds.; Cold Spring Harbor Laboratory Press: New York, NY, USA, 1989; Volume 2, pp. 2–35. [Google Scholar]
- Negri, M.; Lemaitre, R.; Mantelatto, F.L. Molecular and morphological resurrection of Clibanarius symmetricus (Randall, 1840), a cryptic species hiding under the name for the “Thinstripe” hermit crab C. vittatus (Bosc, 1802) (Decapoda: Anomura: Diogenidae). J. Crust. Biol. 2014, 34, 848–861. [Google Scholar] [CrossRef]
- Buranelli, R.C.; Mantelatto, F.L. Broad-ranging low genetic diversity among populations of the yellow finger marsh crab Sesarma rectum Randall, 1840 (Sesarmidae) Revealed by DNA Barcode. Crustaceana 2017, 90, 845–864. [Google Scholar] [CrossRef]
- Ye, J.; Coulouris, G.; Zaretskaya, I.; Cutcutache, I.; Rozen, S.; Madden, T.L. Primer-BLAST: A tool to design target-specific primers for polymerase chain reaction. BMC Bioinform. 2012, 13, 134. [Google Scholar] [CrossRef] [PubMed]
- Schubart, C.D.; Huber, M.G.J. Genetic comparisons of German populations of the stone crayfish, Austropotamobius torrentium (Crustacea: Astacidae). Bull. Fr. Pêche Piscic. 2006, 318, 1019–1028. [Google Scholar] [CrossRef]
- Mantelatto, F.L.; Carvalho, F.L.; Simões, S.M.; Negri, M.; Souza-Carvalho, E.A.; Terossi, M. New primers for amplification of cytochrome c oxidase subunit I barcode region designed for species of Decapoda (Crustacea). Nauplius 2016, 24, e2016030. [Google Scholar] [CrossRef]
- Hall, T.A. BioEdit: A user-friendly biological sequence alignment editor and analysis program for windows 95/98/NT. Nucl. Acids. Symp. Ser. 1999, 41, 95–98. [Google Scholar]
- Altschul, S.F.; Gish, W.; Miller, W.; Myers, E.W.; Lipman, D.J. Basic local alignment search tool. J. Mol. Biol. 1990, 215, 403–410. [Google Scholar] [CrossRef]
- Artimo, P.; Jonnalagedda, M.; Arnold, K.; Baratin, D.; Csardi, G.; de Castro, E.; Duvaud, S.; Flegel, V.; Fortier, A.; Gasteiger, E.; et al. ExPASy: SIB Bioinformatics Resource Portal. Nucleic Acids Res. 2012, 40, W597–W603. [Google Scholar] [CrossRef] [PubMed]
- Edgar, R.C. MUSCLE: Multiple sequence alignment with high accuracy and high throughput. Nucleic Acids Res. 2004, 32, 1792–1797. [Google Scholar] [CrossRef] [PubMed]
- Bracken-Grissom, H.D.; Cannon, M.E.; Cabezas, P.; Feldmann, R.M.; Schweitzer, C.E.; Ahyong, S.T.; Felder, D.L.; Lemaitre, R.; Crandall, K.A. A Comprehensive and Integrative reconstruction of evolutionary history for Anomura (Crustacea: Decapoda). BMC Evol. Biol. 2013, 13, 128. [Google Scholar] [CrossRef] [PubMed]
- Tamura, K.; Stecher, G.; Peterson, D.; Filipski, A.; Kumar, S. MEGA6: Molecular evolutionary genetics analysis version 6.0. Mol. Biol. Evol. 2013, 30, 2725–2729. [Google Scholar] [CrossRef] [PubMed]
- Kimura, M. A simple method for estimating evolutionary rates of base substitutions through comparative studies of nucleotide sequences. J. Mol. Evol. 1980, 16, 111–120. [Google Scholar] [CrossRef] [PubMed]
- Felsenstein, J. Evolutionary trees from DNA sequences: A maximum likelihood approach. J. Mol. Evol. 1981, 17, 368–376. [Google Scholar] [CrossRef]
- Stamatakis, A. RAxML-VI-HPC: Maximum likelihood-based phylogenetic analyses with thousands of taxa and mixed models. Bioinformatics 2006, 22, 2688–2690. [Google Scholar] [CrossRef]
- Tavaré, S. Some probabilistic and statistical problems in the analysis of DNA sequences. In Lectures on Mathematics in the Life Sciences; Miura, R.M., Ed.; American Mathematical Society: Providence, RI, USA, 1986; Volume 17, pp. 57–86. [Google Scholar]
- Rambaut, A.S.M.; Suchard, M.A.; Xie, D.; Drummond, A.J. Tracer 1.6. Available online: http://beast.bio.ed.ac.uk/Tracer (accessed on 15 November 2019).
- Rozas, J.; Rozas, R. DnaSP Version 3: An integrated program for molecular population genetics and molecular evolution analysis. Bioinformatics 1999, 15, 174–175. [Google Scholar] [CrossRef]
- Clement, M.; Posada, D.; Crandall, K.A. TCS: A computer program to estimate gene genealogies. Mol. Ecol. 2000, 9, 1657–1659. [Google Scholar] [CrossRef]
- Excoffier, L.; Langaney, A. Origin and differentiation of human mitochondrial DNA. Am. J. Hum. Genet. 1989, 44, 73–85. [Google Scholar]
- Excoffier, L.; Lischer, H.E.L. Arlequin suite version 3.5: A new series of programs to perform population genetics analyses under Linux and Windows. Mol. Ecol. Resour. 2010, 10, 564–567. [Google Scholar] [CrossRef] [PubMed]
- Tajima, F. Statistical method for testing the neutral mutation hypothesis by DNA polymorphism. Genetics 1989, 123, 585–595. [Google Scholar] [CrossRef] [PubMed]
- Fu, Y.X. Statistical tests of neutrality of mutations against population growth, hitchhiking and background selection. Genetics 1997, 147, 915–925. [Google Scholar] [CrossRef] [PubMed]
- Rogers, A.R.; Harpending, H. Population growth makes waves in the distribution of pairwise genetic differences. Mol. Biol. Evol. 1992, 9, 552–569. [Google Scholar] [CrossRef] [PubMed]
- Schneider, S.; Excoffier, L. Estimation of past demographic parameters from the distribution of pairwise differences when the mutation rates vary among sites: Application to human mitochondrial DNA. Genetics 1999, 152, 1079–1089. [Google Scholar]
- Harpending, H.C. Signature of ancient population growth in a low-resolution mitochondrial DNA mismatch distribution. Hum. Biol. 1994, 66, 591–600. [Google Scholar]
- Drummond, A.J.; Rambaut, A.; Shapiro, B.; Pybus, O.G. Bayesian coalescent inference of past population dynamics from molecular sequences. Mol. Biol. Evol. 2005, 22, 1185–1192. [Google Scholar] [CrossRef]
- Hasegawa, M.; Kishino, H.; Yano, T. Dating of the human-ape splitting by a molecular clock of mitochondrial DNA. J. Mol. Evol. 1985, 22, 160–174. [Google Scholar] [CrossRef]
- Darriba, D.; Taboada, G.L.; Doallo, R.; Posada, D. JModelTest 2: More models, new heuristics and parallel computing. Nat. Methods 2012, 9, 772. [Google Scholar] [CrossRef]
- Knowlton, N.; Weigt, L.A. New dates and new rates for divergence across the Isthmus of Panama. Proc. R. Soc. Lond. B 1998, 265, 2257–2263. [Google Scholar] [CrossRef]
- Wright, S. Evolution and the Genetics of Populations: A Treatise; University of Chicago Press: Chicago, IL, USA, 1978; ISBN 978-0-226-91049-9. [Google Scholar]
- Benedict, J.E. Four new symmetrical hermit crabs (Pagurids) from the West India Region. Proc. USA Natl. Mus. 1901, 23, 771–778. [Google Scholar] [CrossRef][Green Version]
- Dana, J.D. Crustacea. Part I. In United States Exploring Expedition during the Year 1838, 1839, 1840, 1841, 1842. under the Command of Charles Wilkes, U.S.N.; C. Sherman: Philadelphia, PA, USA, 1852; Volume 13, p. 685. [Google Scholar]
- Stimpson, W. Prodomus descriptionis animalium evertebratorum, quae in expeditione ad oceanum Pacificum Septentrionalem, a Republica Federate Missa, Cadevaladero Ringgold et Johanne Rodgers ducibus, observavit et descripsit. VII. Crustacea Anomura. Proc. Acad. Nat. Sci. Phila. 1858, 10, 225–252. [Google Scholar]
- Smith, S.I. Notice of the Crustacea collected by prof. C.F. Hart on the coast of Brazil in 1867. Trans. Conn. Acad. Arts Sci. 1869, 2, 1–41. [Google Scholar]
- Nobili, G. Decapodi i stomatopodi raccolti dal dr. Enrico Festa Nel Darien, Curaçao, La Guayra, Porto Cabello, Colon, Panama. Boll. Musei Zool. Anat. Comp. R Univ. Torino 1897, 12, 1–8. [Google Scholar]
- Rathbun, M.J. Results of the Branner-Agassiz expedition to Brazil. I. The Decapod and Stomatopod Crustacea. Proc. Wash. Acad. Sci. USA 1900, 2, 133–156. [Google Scholar]
- Moreira, C. Contribuições para o conhecimento da fauna Brasileira. Crustáceos do Brasil. Arch. Mus. Nac. 1901, 11, 1–151. [Google Scholar]
- Schmitt, W.L. Report on the Macrura, Anomura and Stomatopoda collected by the Barbados-Antigua expedition from the university of Iowa in 1918. Univ. Iowa Stud. Nat. Hist. 1924, 10, 65–99. [Google Scholar]
- Schmitt, W.L. Crustacea Macrura and Anomura of Porto Rico and the Virgin Islands. Scientific survey of Porto Rico and the Virgin Islands. N. Y. Acad. Sci. 1935, 15, 125–227. [Google Scholar]
- Schmitt, W.L. Zoologische ergebnisse einer reise nach bonaire, Curaçao und Aruba im jahre 1930. No. 16. Macruran and Anomuran Crustacea from Bonaire, Curaçao und Aruba. Zool. Jahrb. Abt. Syst. Geog. Biol. Tiere 1936, 67, 363–378. [Google Scholar]
- Provenzano, A.J. Notes on Bermuda hermit crabs (Crustacea: Anomura). Bull. Mar. Sci. 1960, 10, 117–124. [Google Scholar]
- Provenzano, A.J. Pagurid Crabs (Decapoda Anomura) from St. John, Virgin Islands, with descriptions of three new species. Crustaceana 1961, 3, 151–166. [Google Scholar] [CrossRef]
- Coelho, P.A.; Ramos, M.D.A. A constituição e a distribuição da fauna de decápodos do litoral leste da América do sul entre as latitudes de 5° N e 39° S. Trop. Ocean. 1972, 13, 133–236. [Google Scholar] [CrossRef]
- Rieger, P.J. Malacostraca—Eucarida. Paguroidea. In Catalogue of Crustacea of Brazil; Young, P.S., Ed.; Museu Nacional: Rio de Janeiro, Brazil, 1998; pp. 413–429. ISBN 978-85-7427-001-2. [Google Scholar]
- McLaughlin, P.A.; Komai, T.; Lemaitre, R.; Rahayu, D.L. annotated checklist of Anomuran Decapod Crustaceans of the world (exclusive of the Kiwaoidea and families Chirostylidae and Galatheidae of the Galatheoidea). Part 1, Lithodoidea, Lomisoidea and Paguroidea. Raffles Bull. Zool. 2010, 23, 5–107. [Google Scholar]
- Lemaitre, R.; McLaughlin, P. World Paguroidea & Lomisoidea database. Clibanarius antillensis Stimpson, 1859. Available online: http://marinespecies.org/aphia.php?p=taxdetails&id=367492 (accessed on 18 January 2021).
- Rodríguez-Rey, G.T.; Solé-Cava, A.M.; Lazoski, C. Genetic homogeneity and historical expansions of the slipper lobster, Scyllarides brasiliensis, in the South-West Atlantic. Mar. Freshw. Res. 2014, 65, 59–69. [Google Scholar] [CrossRef]
- Buranelli, R.C.; Felder, D.L.; Mantelatto, F.L. Genetic diversity among populations of the western Atlantic mangrove crab Ucides cordatus (Linnaeus, 1763) (Decapoda: Brachyura: Ocypodidae): Evidence for Panmixia and useful data for future management and conservation. J. Crust. Biol. 2019, 39, 386–395. [Google Scholar] [CrossRef]
- Liu, Y.; Liu, R.; Ye, L.; Liang, J.; Xuan, F.; Xu, Q. Genetic differentiation between populations of swimming crab Portunus trituberculatus along the coastal waters of the East China Sea. Hydrobiology 2009, 618, 125–137. [Google Scholar] [CrossRef]
- Scheltema, R.S. larval dispersal as a means of genetic exchange between geographically separated populations of shoal-water benthic marine gastropods. Biol. Bull. 1971, 140, 284–322. [Google Scholar] [CrossRef]
- Crisp, D.J. Genetic consequences of different reproductive strategies in marine invertebrates. In Marine Organisms: Genetics, Ecology, and Evolution; Battaglia, B., Beardmore, J.A., Eds.; Nato Conference Series, IV: Marine Sciences; Plenum Press: New York, NY, USA, 1978; pp. 257–273. ISBN 978-0-306-40020-9. [Google Scholar]
- Palumbi, S.R.; Wilson, A.C. Mitochondrial DNA diversity in the sea urchins Strongylocentrotus purpuratus and S. droebachiensis. Evolution 1990, 44, 403–415. [Google Scholar] [CrossRef]
- Cirano, M.; Mata, M.M.; Campos, E.J.D.; Deiró, N.F.R. A Circulação oceânica de larga-escala na região oeste do Atlântico sul com base no modelo de circulação global OCCAM. Rev. Bras. Geof. 2006, 24, 209–230. [Google Scholar] [CrossRef]
- Puchnick-Legat, A.; Levy, J.A. Genetic structure of Brazilian populations of white mouth croaker Micropogonias furnieri (Perciformes: Sciaenidae). Braz. Arch. Biol. Technol. 2006, 49, 429–439. [Google Scholar] [CrossRef]
- Affonso, P.; Galetti, P.M., Jr. Genetic diversity of three ornamental reef fishes (Families Pomacanthidae and Chaetodontidae) from the Brazilian Coast. Braz. J. Biol. 2007, 67, 925–933. [Google Scholar] [CrossRef] [PubMed][Green Version]
- Day, R.; McEdward, L. Aspects of the physiology and ecology of pelagic larvae of marine benthic invertebrates. In Marine Plankton Life Cycle Strategies; Steidinger, K.A., Walker, L.M., Eds.; CRC Press: Boca Raton, FL, USA, 1984; pp. 93–120. ISBN 978-0-8493-5222-5. [Google Scholar]
- Lárez, M.B.; Palazón-Fernández, J.L.; Bolaños, C.J. The effect of salinity and temperature on the larval development of Mithrax caribbaeus Rathbun, 1920 (Brachyura: Majidae) reared in the laboratory. J. Plankton Res. 2000, 22, 1855–1869. [Google Scholar] [CrossRef]
- Torres, G.; Giménez, L.; Anger, K. Effects of reduced salinity on the biochemical composition (lipid, protein) of Zoea 1 decapod crustacean larvae. J. Exp. Mar. Biol. Ecol. 2002, 277, 43–60. [Google Scholar] [CrossRef]
- Anger, K.; Spivak, E.; Luppi, T. Effects of reduced salinities on development and bioenergetics of early larval shore crab, Carcinus maenas. J. Exp. Mar. Biol. Ecol. 1998, 220, 287–304. [Google Scholar] [CrossRef]
- Gonçalves, R.R.; Masui, D.C.; McNamara, J.C.; Mantelatto, F.L.M.; Garçon, D.P.; Furriel, R.P.M.; Leone, F.A. A kinetic study of the gill (Na+, K+)-ATPase, and its role in ammonia excretion in the intertidal hermit crab, Clibanarius vittatus. Comp. Biochem. Physiol. Part A Mol. Integr. Physiol. 2006, 145, 346–356. [Google Scholar] [CrossRef]
- Terossi, M.; Mantelatto, F.L. Morphological and genetic variability in Hippolyte obliquimanus Dana, 1852 (Decapoda, Caridea, Hippolytidae) from Brazil and the Caribbean Sea. Crustaceana 2012, 85, 685–712. [Google Scholar] [CrossRef]
- Tourinho, J.L.; Solé-Cava, A.M.; Lazoski, C. Cryptic species within the commercially most important lobster in the tropical Atlantic, the spiny lobster Panulirus argus. Mar. Biol. 2012, 159, 1897–1906. [Google Scholar] [CrossRef]
- Duffy, J.E. Resource-associated population subdivision in a symbiotic coral-reef shrimp. Evolution 1996, 50, 360–373. [Google Scholar] [CrossRef]
- Palumbi, S.R.; Grabowsky, G.; Duda, T.; Geyer, L.; Tachino, N. Speciation and population genetic structure in tropical pacific sea urchins. Evolution 1997, 51, 1506–1517. [Google Scholar] [CrossRef]
- Benzie, J.A.H. Major genetic differences between crown-ofthorns starfish (Acanthaster planci) populations in the Indian and Pacific Oceans. Evolution 1999, 53, 1782–1795. [Google Scholar] [CrossRef]
- Wieman, A.C.; Berendzen, P.B.; Hampton, K.R.; Jang, J.; Hopkins, M.J.; Jurgenson, J.; McNamara, J.C.; Thurman, C.L. A panmictic fiddler crab from the coast of Brazil? Impact of divergent ocean currents and larval dispersal potential on genetic and morphological variation in Uca maracoani. Mar. Biol. 2014, 161, 173–185. [Google Scholar] [CrossRef]
- Grant, W.; Bowen, B.W. Shallow population histories in deep evolutionary lineages of marine fishes: Insights from sardines and anchovies and lessons for conservation. J. Hered. 1998, 89, 415–426. [Google Scholar] [CrossRef]
- Freeland, J. Molecular Ecology; John Wiley & Sons: Chichester, UK; Hoboken, NJ, USA, 2005; ISBN 978-0-470-09061-9. [Google Scholar]
- Cassone, B.J.; Boulding, E.G. Genetic structure and phylogeography of the lined shore crab, Pachygrapsus crassipes, along the northeastern and western Pacific coasts. Mar. Biol. 2006, 149, 213–226. [Google Scholar] [CrossRef]
- Van Tienderen, K.M.; van der Meij, S.E.T. Extreme mitochondrial variation in the Atlantic gall crab Opecarcinus hypostegus (Decapoda: Cryptochiridae) reveals adaptive genetic divergence over Agaricia coral hosts. Sci. Rep. 2017, 7, 39461. [Google Scholar] [CrossRef] [PubMed]
- Aris-Brosou, S.; Excoffier, L. The impact of population expansion and mutation rate heterogeneity on DNA sequence polymorphism. Mol. Biol. Evol. 1996, 13, 494–504. [Google Scholar] [CrossRef]
- Bucklin, A.; Wiebe, P.H. Low mitochondrial diversity and small effective population sizes of the copepods Calanus finmarchicus and Nannocalanus minor: Possible impact of climatic variation during recent glaciation. J. Hered. 1998, 89, 383–392. [Google Scholar] [CrossRef] [PubMed]
- Duran, S.; Palacín, C.; Becerro, M.A.; Turon, X.; Giribet, G. Genetic diversity and population structure of the commercially harvested sea urchin Paracentrotus lividus (Echinodermata, Echinoidea). Mol. Ecol. 2004, 13, 3317–3328. [Google Scholar] [CrossRef]
- Stamatis, C.; Triantafyllidis, A.; Moutou, K.A.; Mamuris, Z. Mitochondrial DNA variation in northeast Atlantic and Mediterranean populations of Norway lobster, Nephrops norvegicus. Mol. Ecol. 2004, 13, 1377–1390. [Google Scholar] [CrossRef]
- Ray, N.; Currat, M.; Excoffier, L. Intra-deme molecular diversity in spatially expanding populations. Mol. Biol. Evol. 2003, 20, 76–86. [Google Scholar] [CrossRef]
- Excoffier, L. Patterns of DNA sequence diversity and genetic structure after a range expansion: Lessons from the infinite-island model. Mol. Ecol. 2004, 13, 853–864. [Google Scholar] [CrossRef]
- Imbrie, J.; Boyle, E.A.; Clemens, S.C.; Duffy, A.; Howard, W.R.; Kukla, G.; Kutzbach, J.; Martinson, D.G.; McIntyre, A.; Mix, A.C.; et al. On the structure and origin of major glaciation cycles 1. Linear responses to Milankovitch forcing. Paleoceanography 1992, 7, 701–738. [Google Scholar] [CrossRef]
- Hellberg, M.E. Genetic approaches to understanding marine metapopulation dynamics. In Marine Metapopulations; Kritzer, J.P., Sale, P.F., Eds.; Elsevier: Amsterdam, The Netherlands, 2006; pp. 431–455. ISBN 978-0-12-088781-1. [Google Scholar]
- Roy, K.; Valentine, J.W.; Jablonski, D.; Kidwell, S.M. Scales of climatic variability and time averaging in pleistocene biotas: Implications for ecology and evolution. Trends Ecol. Evol. 1996, 11, 458–463. [Google Scholar] [CrossRef]
- Hewitt, G.M. Post-glacial re-colonization of European Biota. Biol. J. Linn. Soc. Lond. 1999, 68, 87–112. [Google Scholar] [CrossRef]
- Provan, J.; Bennett, K. Phylogeographic insights into cryptic glacial refugia. Trends Ecol. Evol. 2008, 23, 564–571. [Google Scholar] [CrossRef]
- Marko, P.B.; Hoffman, J.M.; Emme, S.A.; Mcgovern, T.M.; Keever, C.C.; Nicole Cox, L. The ‘Expansion-Contraction’ model of Pleistocene biogeography: Rocky shores suffer a sea change? Mol. Ecol. 2010, 19, 146–169. [Google Scholar] [CrossRef]
- Austerlitz, F.; Jung-Muller, B.; Godelle, B.; Gouyon, P.-H. Evolution of coalescence times, genetic diversity and structure during colonization. Popul. Biol. 1997, 51, 148–164. [Google Scholar] [CrossRef]
- Petit, R.J.; Aguinagalde, I.; de Beaulieu, J.-L.; Bittkau, C.; Brewer, S.; Cheddadi, R.; Ennos, R.; Fineschi, S.; Grivet, D.; Lascoux, M.; et al. Glacial Refugia: Hotspots but not melting pots of genetic diversity. Science 2003, 300, 1563–1565. [Google Scholar] [CrossRef]
- Cárdenas, L.; Castilla, J.C.; Viard, F. A phylogeographical analysis across three biogeographical provinces of the south-eastern Pacific: The case of the marine gastropod Concholepas concholepas. J. Biogeogr. 2009, 36, 969–981. [Google Scholar] [CrossRef]
- Ibáñez, C.M.; Argüelles, J.; Yamashiro, C.; Adasme, L.; Céspedes, R.; Poulin, E. Spatial genetic structure and demographic inference of the Patagonian squid Doryteuthis gahi in the south-eastern Pacific Ocean. J. Mar. Biol. Ass. 2012, 92, 197–203. [Google Scholar] [CrossRef]
- Mclaughlin, P.A. Paguristes puniceus Henderson, 1896 (Decapoda: Anomura: Paguroidea: Diogenidae): A study in intraspecific variability. Zootaxa 2004, 742, 1. [Google Scholar] [CrossRef]
- Hermoso-Salazar, M.; Solís-Weiss, V. Distribution and morphological variation of Synalpheus superus Abele and Kim, 1989 and notes on the distribution of S. fritzmuelleri Coutière, 1909 (Decapoda: Caridea: Alpheidae). Zootaxa 2010, 2505, 65. [Google Scholar] [CrossRef]
- Negri, M.; Schubart, C.D.; Mantelatto, F.L. Tracing the introduction history of the invasive swimming crab Charybdis hellerii (A. Milne-Edwards, 1867) in the western Atlantic: Evidences of high genetic diversity and multiple introductions. Biol. Invasions 2018, 20, 1771–1798. [Google Scholar] [CrossRef]
- Schluter, D.; Price, T. Conflicting selection pressures and life history trade-offs. Proc. R. Soc. Lond. B 1991, 246, 11–17. [Google Scholar] [CrossRef]
- Debuse, V.J.; Addison, J.T.; Reynolds, J.D. Morphometric variability in UK populations of the European lobster. J. Mar. Biol. Assoc. 2001, 81, 469–474. [Google Scholar] [CrossRef]
- Brian, J.V.; Fernandes, T.; Ladle, R.J.; Todd, P.A. Patterns of morphological and genetic variability in UK Populations of the shore crab, Carcinus maenas Linnaeus, 1758 (Crustacea: Decapoda: Brachyura). J. Exp. Mar. Biol. Ecol. 2006, 329, 47–54. [Google Scholar] [CrossRef]
- Rousset, F. Genetic approaches to the estimation of dispersal rates. In Dispersal; Clobert, J., Danchin, E., Dhondt, A.A., Nichols, J.D., Eds.; Oxford University Press: Oxford, UK, 2001; ISBN 978-0-19-850660-7. [Google Scholar]
- Avise, J.C. Molecular population structure and the biogeographic history of a regional fauna: A case history with lessons for conservation biology. Oikos 1992, 63, 62. [Google Scholar] [CrossRef]
- Bickford, D.; Lohman, D.J.; Sodhi, N.S.; Ng, P.K.L.; Meier, R.; Winker, K.; Ingram, K.K.; Das, I. Cryptic species as a window on diversity and conservation. Trends Ecol. Evol. 2007, 22, 148–155. [Google Scholar] [CrossRef]


Publisher’s Note: MDPI stays neutral with regard to jurisdictional claims in published maps and institutional affiliations. |
© 2021 by the authors. Licensee MDPI, Basel, Switzerland. This article is an open access article distributed under the terms and conditions of the Creative Commons Attribution (CC BY) license (http://creativecommons.org/licenses/by/4.0/).