
Bacterial Community Composition and Chromophoric Dissolved Organic Matter Differs with Culture Time of Skeletonema dohrnii


1
Institute of Marine Science and Technology, Shandong University, Qingdao 266237, China
2
College of Marine Science and Technology, China University of Geosciences (Wuhan), Wuhan 430074, China
3
Stroud Water Research Center, 970 Spencer Road, Avondale, PA 19311, USA
4
School of Life Science, Shanxi University, Taiyuan 030006, China
*
Author to whom correspondence should be addressed.
Diversity 2021, 13(4), 150; https://doi.org/10.3390/d13040150
Submission received: 27 February 2021
/
Revised: 24 March 2021
/
Accepted: 26 March 2021
/
Published: 30 March 2021
(This article belongs to the Section Marine Diversity)
Abstract
:Skeletonema dohrnii is a common red tide microalgae occurring in the coastal waters and throughout the world. The associated heterotrophic or autotrophic bacteria play vital roles in regulating algal growth, production, and physiology. In this study, we investigated the detailed bacterial community structure associated with the growth of S. dohrnii’s using high-throughput sequencing-based on 16S rDNA. Our results demonstrated that Bacteroidetes (48.04%) and Proteobacteria (40.66%) in all samples accounted for the majority of bacterial populations. There was a significant linear regression relationship between the abundance of bacterial phyla and culture time. Notable shifts in bacterial community composition were observed during algal growth: Flavobacteriales accounted for the vast majority of sequences at the order level. Furthermore, the relative abundance of Rhodobacterales was gradually reduced during the whole growth process of S. dohrnii (0–12 days). However, beyond that, the relative abundance of Marinobacter was slowly increasing. It is noteworthy that five fluorophores (Peaks T1, T2, I, M, and A) were detected during the growth stage of S. dohrnii. The characteristic indexes (fluorescence index, humification index, and biological index) of chromophoric dissolved organic matter (CDOM) also varied with the culture time. In addition, the taxa of bacteria had certain effects on CDOM and they were inextricably linked to each other.
1. Introduction
Diatoms are ubiquitous autotrophic eukaryotes in aquatic ecosystems, and they contribute about 20% of the total photosynthesis of the earth [1]. Skeletonema is a genus of diatoms belonging to the family Skeletonemaceae (Bacillariophyta, Centricae, Discinales, Discoideae). Skeletonema spp. are commonly found in marine and coastal waters throughout the world and known as a causative species of red tide [2,3,4,5]. Among diatoms, Skeletonema dohrnii is a cosmopolitan species widely distributed in the temperate regions of the northern and southern hemispheres [4]. In the coastal waters of China, S. dohrnii is a common red tide algae that forms long chains with a shell surface diameter up to 4–12 microns [5]. It is a cold-water species that mainly occurs in winter and spring. In summer and fall, S. dohrnii disappears and accumulates in bottom water and shallow sediments [3,6,7]. Their occurrence and distribution may be influenced by environmental gradients such as temperature and interactions with other living organisms [2,3,5,8].
Microalgae and bacteria have coexisted in aquatic habitats for more than 200 million years [9], which means that the interactions between diatoms and bacteria have undergone a long evolutionary time scale. Bacterial communities constitute sophisticated interactions with microalgae [10], including mutualism, commensalism, antagonism, competition, and parasitism. Microalgae can provide organic matter to promote bacterial growth, or antimicrobial substances to inhibit bacterial reproduction [11,12,13]. Bacteria can also produce vitamins, nutrients, and other substances that promote microalgal growth [14,15], and produce substances that inhibit the growth of microalgae [16,17]. Around algal cells, there usually exists a special micro-environment called ‘phycosphere’, which is inhabited by the specific microbial communities. The phycosphere is the main place for the interactions between algae and bacteria [18]. Some phycosphere bacteria are common to certain microalgae, while unique to other microalgae, and have the interspecies specificity between microalgae and bacteria. For example, bacteria in the phycosphere of Skeletonema costatum mainly include Alphaproteobacteria, Gammaproteobacteria, and Bacteroidetes [19,20]. Studies have shown that bacterial community composition in phycosphere differs from the attached bacteria in the water. Furthermore, bacterial density and community structure will also change with different periods of microalgal growth stage and changes in the phytoplankton community [20]. Basically, regardless of the interactions between microalgae and bacteria, changes in bacterial community are related to the physiological state of algae in different periods [20,21] and the relationship between microalgae and bacteria plays an important role in the biogeochemical cycles and algal bloom processes [22]. Therefore, bacterial communities are important for an in-depth understanding of biogeochemical cycles [22].
Currently, most of the research has mainly focused on the population distribution, morphology, and biodiversity of Skeletonema [23,24,25,26,27]. Meanwhile, the phycosphere bacteria of some Skeletonema have been studied as well [28,29]. However, the bacterial community composition and chromophoric dissolved organic matter of S. dohrnii has not been reported. Therefore, we established a batch culture system to explore the relationship between eukaryotic diatoms and bacteria using the 16S rDNA amplicon sequencing-based on next-generation sequencing platforms. Primarily, we chose a symbiotic system to obtain a linear relationship between the microalgae and bacteria in this study.
2. Materials and Methods
2.1. Microalgae Collection, Pre-Culture Conditions and Experimental Set-Up
Skeletonema dohrnii was isolated from the central Yellow Sea in China, where it is the predominant species occurring in spring blooms and generally found all year round [5]. During the experiments, S. dohrnii was cultured in the artificial seawater (ASW) medium [30] in transparent conical flasks at 18 °C. The light intensity and photoperiod were 55.50 μmol photons m−2 s−1 and 14 h:10 h (light: dark) cycles under cool white fluorescent light, respectively. Microalgal cultures were shaken manually at 12 am every day to prevent sedimentation.
S. dohrnii was harvested during the logarithmic growth phase. The microalgae cells were collected by centrifugation at 2000× g for 5 min. The harvested microalgal cells were washed with sterilized deionized water and centrifuged at 2000× g for 5 min again. Then S. dohrnii’s cells were inoculated to 2000 mL transparent conical flasks containing 1800 mL of artificial seawater, and the initial microalgal biomass concentration was about 4.25 × 10⁸ cells L−1.
In this study, S. dohrnii in artificial seawater was represented by Z1-Z30. The samples were taken daily until the 6th day. Also, the other three samples were collected on days 8, 10, and 12 (G8, G9, and G10). All the materials and media were sterilized before experiments. All experiments were performed in triplicates.
2.2. Determination of Microalgal Growth and Collection of Bacteria
When shaking the culture solution every day, 100 μL of microalgae solution was collected into the blood cell counting chamber and microalgal cells were immediately counted using an inverted microscope (Olympus BX51, Olympus, Tokyo, Japan). Bacterial counts were determined via plate count [31].
At the beginning of the experiment, 150 mL of microalgal solution was taken daily from the samples. The microalgal culture solutions were filtered through a 3.0 μm sterile mixed cellulose ester membrane (47 mm, Millipore, MA, USA) to collect the attached bacteria. The filtered samples (the membranes with S. dohrnii and attached bacteria) were then stored in the cryogenic vial (2 mL, Corning Incorporated, New York, USA) and kept at −80 °C in the freezer until DNA extraction.
2.3. DNA Extraction, PCR Amplification, and Sequencing
Total genomic DNA was extracted using the DNeasy PowerWater (Qiagen, Hilden, Germany) according to the manufacturer’s instructions. DNA quantity and quality were analyzed by a Nanodrop spectrophotometer ND-2000. The extracted genomic DNA was stored at −80 °C for further analyses. Bacterial community structure was characterized by amplifying V3 and V4 regions of 16S rRNA genes using the prokaryotic-specific forward primer 343F 5′-TACGGRAGGCAGCAG-3′ and reverse primer 798R5′-AGGGTATCTAATCCT-3′. We used a 50 μL system for polymerase chain reactions (PCR): 343F (10 uM) and 798R (10 uM) each 1.5 μL, dNTPs 1.5 μL, 10 × PCR buffer 5 μL, KOD FX Neo polymerase 0.2 μL, DNA template 10–100 ng and ddH2O to 50 μL. The thermal cycle steps of PCR were as follows: pre-denaturation at 95 °C for 5 min, denaturation at 95 °C for 0.5 min, annealing at 50 °C for 0.5 min, 25 cycles of extension 72 °C for 0.5 min, and final extension 72 °C for 10 min. All PCR products were purified using the Universal DNA Purification Reagent Kit (Qiagen, Hilden, Germany). The recovered product was sequenced on the Illumina Hiseq 2500 platform by Shanghai Oebiotech Technology Co., Ltd., Shanghai, China.
2.4. Sequence Processing and Analysis
The original double-ended sequences were de-interleaved using Trimmomatic (v. 0.33) (http://usadellab.org/cms/?page=trimmomatic (accessed on 7 January 2021)) [32], and the de-duplexed double-ended sequences were spliced using FLASH software (v. 1.2.7) (http://ccb.jhu.edu/software/FLASH/ (accessed on 7 January 2021)) [33]. The splicing parameters were: the minimum overlap was 10 bp, the maximum overlap was 200 bp, and the maximum mismatch rate was 20%. During the denoising and chimera detection stage, removing low quality sequences (quality scores < 25, sequences lengths < 200 bp), ambiguous reads (ambiguous base > 0) and chimeras (vsearch uchime-denovo function default parameters) were all removed using QIIME 2 software (https://qiime2.org (accessed on 7 January 2021)) [34]. Specifically, the chimera sequences were detected and removed using the vsearch uchime-denovo function with default parameters. Clean reads were subjected to the primer sequences removal and clustering to generate operational taxonomic units (OTUs) using VSEARCH software (https://github.com/torognes/vsearch (accessed on 7 January 2021)) [35] with a similarity cutoff value of 97%. The ribosomal database project (RDP) was applied to carry out taxonomic assignments by setting a confidence threshold of 80%. The rarefaction analyses were executed by Mothur software (v. 1.38). LEfSe (LDA Effect Size) software (v. 1.0) was used to test statistical differences among the samples (LEfSe, logarithmic LDA score > 2 and p < 0.05 for Kruskal–Wallis test) [36]. Moreover, 16S rDNA data were analyzed with R (v. 3.5.1), STAMP, and Origin 8.5 software, respectively [37].
2.5. Fluorescence Measurements
The artificial seawater samples for CDOM were analyzed from 10 mL samples filtered through a 0.7 µm combusted GF/F filter onto pre-combusted (450 °C for 5 h) glass vials. Then, the fluorescence spectra of CDOM were measured with an F-7100 fluorescence spectrophotometer (Tokyo, Japan). The voltage of the photomultiplier tube (PMT) was set to 700 V. Fluorescence spectra detected subsequent scanning of excitation (Ex) from 200 to 400 nm and emission (Em) from 250 to 500 nm. Ex and Em slits were maintained at 5 nm and the scanning speed was set at 12,000 nm/min. The software Origin 8.5 (Origin Corp., Hampton, MA, USA) was employed for handling fluorescence data. In addition, fluorescence index (FI) [38], biological index (BIX) [39], and humification index (HIX) [40] indices were calculated from fluorescence data.
2.6. Statistical Analysis
Statistical analysis of all the data was performed with one-way ANOVA analysis and unpaired t-test analysis using SPSS software (version 19.0). Results were expressed as the mean of measurements ± standard deviation (SD). A 95% confidence level was chosen to determine the significance between groups, with p < 0.05 indicating a significant difference.
3. Results
3.1. The Growth of Skeletonema dohrnii and Bacteria
The initial inoculation density of algal cells was about 4.25 × 10⁸ cells L−1 (Figure 1). There was no obvious lag in the growth of microalgae. The algal cell density reached the maximum value (9.88 × 10⁸ cells L−1) on the 4th day. From the 5th day, the density of algal cells rapidly decreased until the 6th day of the experiment. Subsequently, starting from the 6th day, the cell density slowly declined, and ultimately reached 5.47 × 10⁸ cells L−1 on the 12th day. The initial density of bacteria was 0.08 × 10⁴ cfu mL−1. After 12 days of cultivation, the bacterial density significantly increased to 2.65 × 10⁴ cfu mL−1.
3.2. Analysis of Bacterial Diversity and Community Structure
Based on the analysis of species annotation in the Ribosomal Database Project (RDP) database, 7 phyla, 10 classes, 21 orders, 29 families, and 36 genera were identified in this study. The unidentified species of the 16S rDNA sequence were labeled as ‘others’ in our study. The proportions of Bacteroidetes and Proteobacteria were higher in the initial stage, accounting for 46.39% and 44.89% of all samples, respectively (Figure 2a,b). The proportion of Cyanobacteria, Firmicutes, and Planctomycetes contributed relatively low (6.03%, 2.20%, and 0.34%, respectively). Among the Proteobacteria, Alphaproteobacteria, and Gammaproteobacteria accounted for 43.68% and 1.01% of the total number of sequences, respectively. However, the Bacteroidetes were composed of only Flavobacteriia. At the genus level, Fluviicola accounted for 35.73% of the total abundance (Figure 2c). Aquibacter increased from 4.07% to 20.04% with the extension of microalgae culture duration (Figure 2c). During the whole process, the relative abundance of Marinobacter and Erythrobacter did not change much and remained in a relatively stable state. However, the relative abundance of unidentified genera gradually decreased (from 44.80% to 9.56%) with the experiment duration (Figure 2c and Figure 3d). Sphingomonadales at the order level maintained a steady increase (Figure 3a). Meanwhile, Rhodobacterales showed the opposite trend to Sphingomonadales (Figure 3b).
The histogram with linear discriminant analysis (LDA) scores and cladogram are shown in Figure 4. The abundance of G3 (Z7-Z9) (day 2), G4 (Z10-Z12) (day 3), and G6 (Z16-Z17) (day 5) were less than the specified values, so these groups were not shown. G1 (Z1-Z3) (day 0) mainly included Firmicutes, Planctomycetes, Proteobacteria, and Bacteroidetes. Fluviicola and Cryomorphaceae made up the vast majority of the bacterial population in the G1 (LDA > 5) (Figure 4a). On the 6th day (G7: Z19-Z21), Actinobacteria were detected (Figure 4b). G8 (Z22-Z24) and G9 (Z25-Z27) were mainly composed of Flavobacteriaceae and Aquibacter. Both the G1 and G10 bacterial communities contained Proteobacteria; however, the G10 contained the vast majority of Proteobacteria.
3.3. Fluorescence Characteristics
In this study, five fluorophores (peak T1, peak T2, peak I, peak M, and peak A) were detected during the culture time of S. dohrnii (Figure 5, Table 1). Peaks T1, T2, and I were detected every day. Apart from that, the maximum fluorescence intensity of T2 appeared on the 6th day. Meanwhile, Peak A appeared on the 6th and 8th day. Peak M appeared on days 8, 10, and 12.
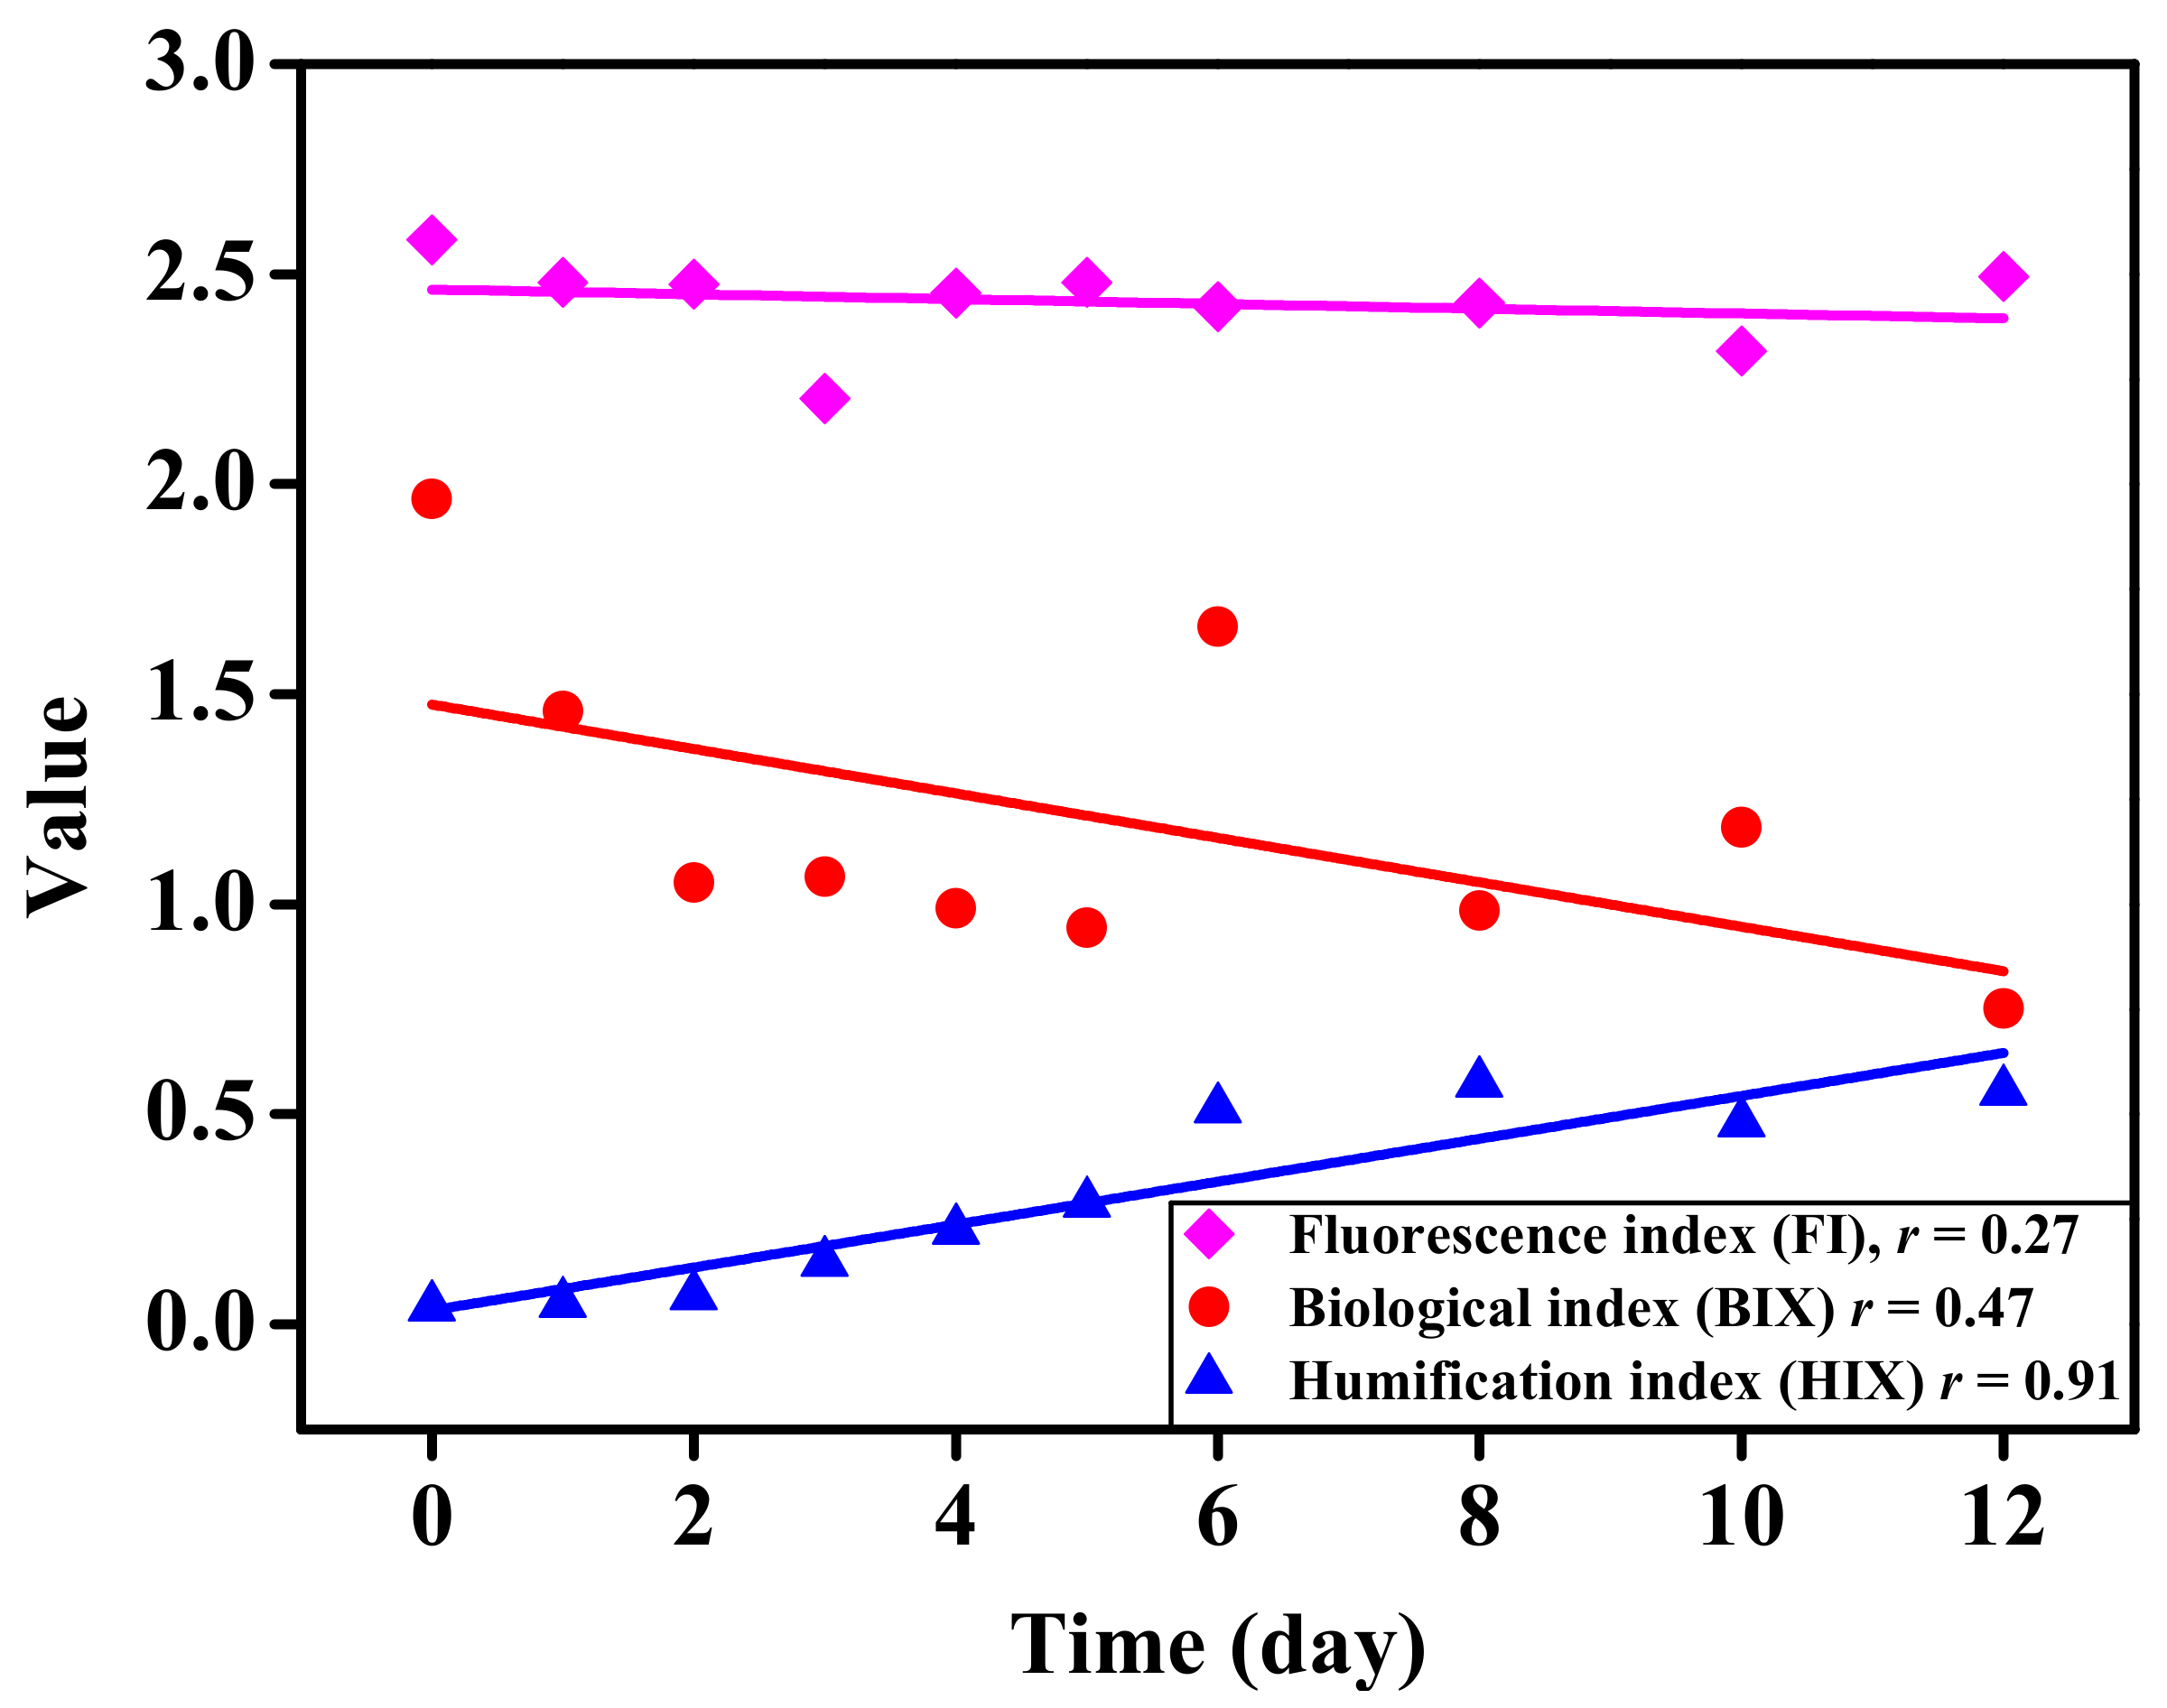
To further explore the characteristics of CDOM under the joint action of S. dohrnii and bacteria, the fluorescence index (FI), biological index (BIX), and humification index (HIX) were used to express changes in CDOM (Figure 6). During the whole cultivation time of microalgae, the change of FI (2.20–2.58) was insignificant, and BIX gradually decreased, but the trend was not obvious. The lowest value of BIX appeared on the 12th day, with a value of 0.75. Conversely, the value of HIX (0.04–0.57) gradually increased with the extension of culture time.
4. Discussions
As described by previous reports, the construction of algal microbial communities has species and genus specificity [46,47,48]. The bacterial communities associated with Thalassiosira rotula and Skeletonema costatum mainly included α-Proteobacteria, and γ-Proteobacteria [49]. In addition, Proteobacteria and Bacteroidetes were the most abundant in the phycosphere [50,51,52]. Moreover, some typical bacteria (e.g., Roseobacter, Alteromonas, and Flavobacterium) have maintained significant interactions with diatoms [53]. In this study, we found that Bacteroidetes, Proteobacteria, and Firmicutes were the most abundant phyla throughout the culture time of Skeletonema dohrnii (Figure 2a). Moreover, Rhodobacterales had a relatively high abundance in all samples (Figure 3b), and they frequently appeared in different environments, especially in the phycosphere of diatoms [54,55]. Furthermore, many studies have referred to members of the Roseobacter group, which can degrade aromatic compounds released by microalgae [54,56]. The bacterial community structure changed significantly in the co-culture system of microalgae and bacteria (Figure 2), which may be due to the changes in microalgal abundance and organic matter. It was known that the ASW medium did not contain any organic matter. Several studies have shown that phytoplankton released large amounts of organic matter to provide bacteria with carbon, nitrogen, and other sources of energy [57,58]. The bacterial communities in different microalgae had their specific characteristics. Therefore, the changes in community composition could be related to the composition of organic matter released by phytoplankton at different growth phases.
This study found that Proteobacteria accounted for the vast majority during the entire culture process. Among them, Alphaproteobacteria, Betaproteobacteria, and Gammaproteobacteria mainly appeared in the initial (G1 and G2) and degradation (G8, G9, and G10) phases. Moreover, Cyanobacteria were present throughout the experiment. Miao et al. [59] showed that Cyanobacteria were detected in association with five microalgae (Fragilariopsis sp., Micromonas sp., Thalassiasira sp., Attheya septentrionalis, and Chlorella sp.). Cyanobacteria not only dominate in photoautotrophic microorganisms but also constitute the biomass of microbial ecosystems. However, the relatively high bacterial diversity of G1 and G10 may be due to the low density of algal cells during this period. It is reasonable to conclude that microalgae cells died and various organic molecules were released allowing for greater bacterial growth. However, the relative abundance of Flavobacteriales and Alteromonadales was higher than other orders. The microbial diversity of Alexandrium tamarense showed that the bacterial diversity at the exponential phase was much lower than that in the lag and stationary stage [60]. Moreover, it was evident that the organic matter released by microalgae changes during the transition from the initial to degradation stage [61], thereby changing the bacterial community structure of the phycosphere. Since the diatom genus Skeletonema was known as a red tide algae [5,27], when the number of microalgal cells was the highest (G5), it can be considered as the outbreak of red tide. During this period, Flavobacteriales and Bacteroidetes possessed the highest relative abundance among the bacterial community (Figure 4a). In addition, the Marinobacter is one of the most diverse genera of Gammaproteobacteria and is widely distributed in the world’s oceans [62,63]. In the present study, Marinobacter had the highest relative abundance on day 4 (Figure 2c), when the number of algae cells was also the highest.
The organic matter will be released during the growth of S. dohrnii. The released organic substances were mainly the active protein-like fluorescent components. The organic matter was further degraded and utilized by bacteria. At the same time, the fluorescence intensity of protein-like substances was weakened and gradually transformed into more stable humus-like substances.
As the microalgae decayed, there were some variations in the detection of fluorophores. Peaks A and M began to appear on days 6 and 8, respectively. Since our samples did not include terrestrial material, the humic-like fluorescence must be a direct product of autochthonous production and microbial transformation. Given biomass of S. dohrnii at this time was in a rapidly decreasing state (Figure 1), indicating the algal cells died and released large amounts of organic matter. Bacteria took the organic matter released by S. dohrnii and processed it into humus-like substances. Nevertheless, Proteobacteria and Bacteroidetes were still the main bacterial taxa. However, Acidimicrobiia and Flavobacteriaceae had relatively large LDA scores on days 6 and 8, respectively (Figure 4a). We speculated that the humus-like substances of Peaks A and M might have a certain relationship with both of them.
As described by previous reports, the fluorescence components of DOM were mainly produced by water bodies and microorganisms when the FI was > 1.9 [64]. In our study, S. dohrnii was cultured with ASW medium (without organic matter), meanwhile, FI ranged from 2.20 to 2.58, indicating the fluorophores were produced by algal-bacterial interactions. When HIX < 1.5, the organic matter was derived from biology or aquatic bacteria [65]. The HIX values in this study were all less than 1.5 and decreased gradually with the extension of culture time. Therefore, the humification of organic matter in the water environment was low, and all of which come from algal–bacterial interactions. BIX could be used as an indicator of DOM traceability [66]. The values of BIX in this study were 0.75–1.96, which indicated the higher degradation and lower levels of humification in the samples (Figure 5 and Figure 6).
5. Conclusions
This study explored the bacterial community associated with Skeletonema dohrnii and chromophoric dissolved organic matter under the 16S rDNA high-throughput sequencing and excitation–emission matrix. Based on the above results, we can draw the following conclusions: the diversity of bacteria changed during different growth phases of S. dohrnii. The activity of S. dohrnii also affected the bacterial community composition of bacteria. It was noteworthy that bacteria played an important role in the dissolved organic matter released by S. dohrnii at different culture times. In addition, different bacterial taxa also had a certain impact on the dissolved organic matter, which were inextricably linked.
Author Contributions
Conceptualization, J.S., J.K. and Y.L.; methodology, J.S.; resources, J.S.; writing—original draft preparation, Y.L.; writing—review and editing, Y.L., J.K., J.S., M.A.N. and J.Y.; visualization, Y.L.; supervision, J.S.; project administration, J.S.; funding acquisition, J.S. All authors have read and agreed to the published version of the manuscript.
Funding
This research was financially supported by the National Key Research and Development Project of China (2019YFC1407805), the National Natural Science Foundation of China (41876134) and the Changjiang Scholar Program of Chinese Ministry of Education (T2014253) to J.S.
Institutional Review Board Statement
Not applicable.
Informed Consent Statement
Not applicable.
Data Availability Statement
The data presented in this study are openly available in NCBI at PRJNA591078.
Conflicts of Interest
The authors declare that they have no conflict of interest.
References
- Falkowski, P.G.; Fenchel, T.; Delong, E.F. The microbial engines that drive Earth’s biogeochemical cycles. Science 2008, 320, 1034–1039. [Google Scholar] [CrossRef] [PubMed] [Green Version]
- Gallagher, J.C. Population genetics of Skeletonema costatum (Bacillariophyceae) in Narragansett Bay. J. Phycol. 1980, 16, 464–474. [Google Scholar] [CrossRef]
- Itakura, S.; Imai, I.; Itoh, K. “Seed bank” of coastal planktonic diatoms in bottom sediments of Hiroshima Bay, Seto Inland Sea, Japan. Mar. Biol. 1997, 128, 497–508. [Google Scholar] [CrossRef]
- Aubry, F.B.; Berton, A.; Bastianini, M.; Socal, G.; Acri, F. Phytoplankton succession in a coastal area of the NW Adriatic, over a 10-year sampling period (1990–1999). Cont. Shelf Res. 2004, 24, 97–115. [Google Scholar] [CrossRef]
- Gu, H.; Zhang, X.; Sun, J.; Luo, Z. Diversity and seasonal occurrence of Skeletonema (Bacillariophyta) species in Xiamen Harbour and surrounding seas, China. Cryptogam. Algol. 2012, 33, 245–263. [Google Scholar] [CrossRef]
- McQuoid, M.R.; Godhe, A. Recruitment of coastal planktonic diatoms from benthic versus pelagic cells: Variations in bloom development and species composition. Limnol. Oceanogr. 2004, 49, 1123–1133. [Google Scholar] [CrossRef]
- Patil, J.S.; Anil, A.C. Temporal variation of diatom benthic propagules in a monsoon-influenced tropical estuary. Cont. Shelf Res. 2008, 28, 2404–2416. [Google Scholar] [CrossRef]
- Hobson, L.A.; McQuoid, M.R. Temporal variations among planktonic diatom assemblages in a turbulent environment of the southern Strait of Georgia, British Columbia, Canada. Mar. Ecol. Prog. Ser. 1997, 150, 263–274. [Google Scholar] [CrossRef] [Green Version]
- Falkowski, P.G.; Katz, M.E.; Knoll, A.H.; Quigg, A.; Raven, J.A.; Schofield, O.; Taylor, F.J.R. The evolution of modern eukaryotic phytoplankton. Science 2004, 305, 354–360. [Google Scholar] [CrossRef] [Green Version]
- Cole, J.J. Interactions between bacteria and algae in aquatic ecosystems. Annu. Rev. Ecol. Syst. 1982, 13, 291–314. [Google Scholar] [CrossRef]
- Findlay, J.A.; Patil, A.D. Antibacterial constituents of the diatom Navicula delognei. J. Nat. Prod. 1984, 47, 815–818. [Google Scholar] [CrossRef]
- Paul, C.; Pohnert, G. Production and role of volatile halogenated compounds from marine algae. Nat. Prod. Rep. 2011, 28, 186–195. [Google Scholar] [CrossRef]
- Vidoudez, C.; Nejstgaard, J.C.; Jakobsen, H.H.; Pohnert, G. Dynamics of dissolved and particulate polyunsaturated aldehydes in mesocosms inoculated with different densities of the diatom Skeletonema marinoi. Mar. Drugs 2011, 9, 345–358. [Google Scholar] [CrossRef] [Green Version]
- De-Bashan, L.E.; Antoun, H.; Bashan, Y. Involvement of indole-3-acetic acid produced by the growth-promoting bacterium Azospirillum spp. in promoting growth of Chlorella vulgaris. J. Phycol. 2008, 44, 938–947. [Google Scholar] [CrossRef]
- Cruz-López, R.; Maske, H. The vitamin B1 and B12 required by the marine dinoflagellate Lingulodinium polyedrum can be provided by its associated bacterial community in culture. Front. Microbiol. 2016, 7, 560. [Google Scholar] [CrossRef] [PubMed] [Green Version]
- Osada, M.; Stewart, J.E. Gluconic acid/gluconolactone: Physiological influences on domoic acid production by bacteria associated with Pseudo-nitzschia multiseries. Aquat. Microb. Ecol. 1997, 12, 203–209. [Google Scholar] [CrossRef]
- Hold, G.L.; Smith, E.A.; Harry, B.T.; Gallacher, S. Comparison of paralytic shellfish toxin (PST) production by the dinoflagellates Alexandrium lusitanicum NEPCC 253 and Alexandrium tamarense NEPCC 407 in the presence and absence of bacteria. FEMS Microbiol. Ecol. 2001, 36, 223–234. [Google Scholar] [CrossRef] [PubMed]
- Bell, W.; Mitchell, R. Chemotactic and growth responses of marine bacteria to algal extracellular products. Biol. Bull. 1972, 143, 265–277. [Google Scholar] [CrossRef]
- Amin, S.A.; Green, D.H.; Hart, M.C.; Küpper, F.C.; Sunda, W.G.; Carrano, C.J. Photolysis of iron-siderophore chelates promotes bacterial-algal mutualism. Proc. Natl. Acad. Sci. USA 2009, 106, 17071–17076. [Google Scholar] [CrossRef] [PubMed] [Green Version]
- Sison-Mangus, M.P.; Jiang, S.; Kudela, R.M.; Mehic, S. Phytoplankton-associated bacterial community composition and succession during toxic diatom bloom and non-bloom events. Front. Microbiol. 2016, 7, 1433. [Google Scholar] [CrossRef]
- Furuki, M.; Kobayashi, M. Interaction between Chattonella and bacteria and prevention of this red tide. Mar. Pollut. Bull. 1991, 23, 189–193. [Google Scholar] [CrossRef]
- Seymour, J.R.; Amin, S.A.; Raina, J.B.; Stocker, R. Zooming in on the phycosphere: The ecological interface for phytoplankton-bacteria relationships. Nat. Microbiol. 2017, 2, 17065. [Google Scholar] [CrossRef]
- Sarno, D.; Kooistra, W.H.C.F.; Medlin, L.K.; Percopo, I.; Zingone, A. Diversity in the Genus Skeletonema (Bacillariophyceae). II. An Assessment of the Taxonomy of S. Costatum-like species with the Description of four new species1. J. Phycol. 2005, 41, 151–176. [Google Scholar] [CrossRef] [Green Version]
- Sarno, D.; Kooistra, W.H.C.F.; Balzano, S.; Hargraves, P.E.; Zingone, A. Diversity in the genus Skeletonema (Bacillariophyceae): III. Phylogenetic position and morphological variability of Skeletonema costatum and Skeletonema grevillei, with the description of Skeletonema ardens sp. NOV. 1. J. Phycol. 2007, 43, 156–170. [Google Scholar] [CrossRef]
- Zingone, A.; Percopo, I.; Sims, P.A.; Sarno, D. Diversity in the Genus Skeletonema (Bacillariophyceae). I. A Reexamination of the Type Material of S. Costatum with the Description of S. Grevillei Sp. NOV. 1. J. Phycol. 2005, 41, 140–150. [Google Scholar] [CrossRef]
- Kooistra, W.H.C.F.; Sarno, D.; Balzano, S.; Gu, H.; Andersen, R.A.; Zingone, A. Global diversity and biogeography of Skeletonema species (Bacillariophyta). Protist 2008, 159, 177–193. [Google Scholar] [CrossRef] [PubMed]
- Yamada, M.; Otsubo, M.; Tsutsumi, Y.; Mizota, C.; Iida, N.; Okamura, K.; Okamura, M.; Umehara, A. Species diversity of the marine diatom genus Skeletonema in Japanese brackish water areas. Fish. Sci. 2013, 79, 923–934. [Google Scholar] [CrossRef]
- Yang, Y.; Hu, X.; Zhang, J. Community level physiological study of algicidal bacteria in the phycospheres of Skeletonema costatum and Scrippsiella trochoidea. Harmful Algae 2013, 28, 88–96. [Google Scholar] [CrossRef]
- Johansson, O.N.; Pinder, M.I.M.; Ohlsson, F.; Egardt, J.; Töpel, M.; Clarke, A.K. Friends with benefits: Exploring the phycosphere of the marine diatom Skeletonema marinoi. Front. Microbiol. 2019, 10, 1828. [Google Scholar] [CrossRef] [PubMed] [Green Version]
- Kester, D.R.; Duedall, I.W.; Connors, D.N.; Pytkowicz, M.R. Preparation of artificial seawater 1. Limnol. Oceanogr. 1967, 12, 176–179. [Google Scholar] [CrossRef]
- Burtscher, M.M.; Zibuschka, F.; Mach, R.L.; Lindner, G.; Farnleitner, A.H. Heterotrophic plate count vs. in situ bacterial 16S rRNA gene amplicon profiles from drinking water reveal completely different communities with distinct spatial and temporal allocations in a distribution net. Water SA 2009, 35, 495–504. [Google Scholar] [CrossRef] [Green Version]
- Bolger, A.M.; Lohse, M.; Usadel, B. Trimmomatic: A flexible trimmer for Illumina sequence data. Bioinformatics 2014, 30, 2114–2120. [Google Scholar] [CrossRef] [Green Version]
- Magoč, T.; Salzberg, S.L. FLASH: Fast length adjustment of short reads to improve genome assemblies. Bioinformatics 2011, 27, 2957–2963. [Google Scholar] [CrossRef] [PubMed]
- Caporaso, J.G.; Kuczynski, J.; Stombaugh, J.; Bittinger, K.; Bushman, F.D.; Costello, E.K.; Fierer, N.; Peña, A.G.; Goodrich, G.K.; Gordon, J.I.; et al. QIIME allows analysis of high-throughput community sequencing data. Nat. Methods 2010, 7, 335–336. [Google Scholar] [CrossRef] [Green Version]
- Rognes, T.; Flouri, T.; Nichols, B.; Quince, C.; Mahé, F. VSEARCH: A versatile open source tool for metagenomics. PeerJ 2016, 4, e2584. [Google Scholar] [CrossRef]
- Segata, N.; Izard, J.; Waldron, L.; Gevers, D.; Miropolsky, L.; Garrett, W.S.; Huttenhower, C. Metagenomic biomarker discovery and explanation. Genome Biol. 2011, 12, R60. [Google Scholar] [CrossRef] [PubMed] [Green Version]
- Langille, M.G.; Zaneveld, J.; Caporaso, J.G.; McDonald, D.; Knights, D.; Reyes, J.A.; Clemente, J.C.; Burkepile, D.E.; Thurber, R.L.; Knight, R.; et al. Predictive functional profiling of microbial communities using 16S rRNA marker gene sequences. Nat. Biotechnol. 2013, 31, 814–821. [Google Scholar] [CrossRef]
- McKnight, D.M.; Boyer, E.W.; Westerhoff, P.K.; Doran, P.T.; Kulbe, T.; Andersen, D.T. Spectrofluorometric characterization of dissolved organic matter for indication of precursor organic material and aromaticity. Limnol. Oceanogr. 2001, 46, 38–48. [Google Scholar] [CrossRef]
- Parlanti, E.; Worz, K.; Geoffroy, L.; Lamotte, M. Dissolved organic matter fluorescence spectroscopy as a tool to estimate biological activity in a coastal zone submitted to anthropogenic inputs. Org. Geochem. 2000, 31, 1765–1781. [Google Scholar] [CrossRef]
- Ohno, T. Fluorescence inner-filtering correction for determining the humification index of dissolved organic matter. Environ. Sci. Tech. 2002, 36, 742–746. [Google Scholar] [CrossRef]
- Stedmon, C.A.; Markager, S.; Bro, R. Tracing dissolved organic matter in aquatic environments using a new approach to fluorescence spectroscopy. Mar. Chem. 2003, 82, 239–254. [Google Scholar] [CrossRef]
- Coble, P.G. Characterization of marine and terrestrial DOM in seawater using excitation-emission matrix spectroscopy. Mar. Chem. 1996, 51, 325–346. [Google Scholar] [CrossRef]
- Coble, P.G.; Del Castillo, C.E.; Avril, B. Distribution and optical properties of CDOM in the Arabian Sea during the 1995 Southwest Monsoon. Deep Sea Res. Part II 1998, 45, 2195–2223. [Google Scholar] [CrossRef]
- Stedmon, C.A.; Markager, S. Resolving the variability in dissolved organic matter fluorescence in a temperate estuary and its catchment using PARAFAC analysis. Limnol. Oceanogr. 2005, 50, 686–697. [Google Scholar] [CrossRef]
- Chen, W.; Westerhoff, P.; Leenheer, J.A.; Booksh, K. Fluorescence excitation—Emission matrix regional integration to quantify spectra for dissolved organic matter. Environ. Sci. Technol. 2003, 37, 5701–5710. [Google Scholar] [CrossRef]
- Kaczmarska., I.; Ehrman, J.M.; Bates, S.S.; Green, D.H.; Léger, C.; Harris, J. Diversity and distribution of epibiotic bacteria on Pseudo-nitzschia multiseries (Bacillariophyceae) in culture, and comparison with those on diatoms in native seawater. Harmful Algae 2005, 4, 725–741. [Google Scholar] [CrossRef]
- Sapp, M.; Wichels, A.; Wiltshire, K.H.; Gerdts, G. Bacterial community dynamics during the winter-spring transition in the North Sea. FEMS Microbiol. Ecol. 2007, 59, 622–637. [Google Scholar] [CrossRef] [Green Version]
- Li, Y.; Yang, C.; Zheng, T. Bacterial survival modes and community characteristics in natural environment. Chin. J. Appl. Environ. Biol. 2013, 19, 553–560. [Google Scholar] [CrossRef]
- Gossart, H.P.; Levold, F.; Allgaier, M.; Simon, M.; Brinkhoff, T. Marine diatom species harbour distinct bacterial communities. Environ. Microbiol. 2005, 7, 860–873. [Google Scholar] [CrossRef] [PubMed]
- González, J.M.; Kiene, R.P.; Moran, M.A. Transformation of Sulfur Compounds by an Abundant Lineage of Marine Bacteria in the α-Subclass of the Class Proteobacteria. Appl. Environ. Microbiol. 1999, 65, 3810–3819. [Google Scholar] [CrossRef] [PubMed] [Green Version]
- Miller, T.R.; Belas, R. Dimethylsulfoniopropionate metabolism by Pfiesteria-associated Roseobacter spp. Appl. Environ. Microbiol. 2004, 70, 3383–3391. [Google Scholar] [CrossRef] [Green Version]
- Green, D.H.; Hart, M.C.; Blackburn, S.I.; Bolch, C.J. Bacterial diversity of Gymnodinium catenatum and its relationship to dinoflagellate toxicity. Aquat. Microb. Ecol. 2010, 61, 73–87. [Google Scholar] [CrossRef]
- Guannel, M.L.; Horner-Devine, M.C.; Rocap, G. Bacterial community composition differs with species and toxigenicity of the diatom Pseudo-nitzschia. Aquat. Microb. Ecol. 2011, 64, 117–133. [Google Scholar] [CrossRef] [Green Version]
- Schäfer, H.; Abbas, B.; Witte, H.; Muyzer, G. Genetic diversity of ‘satellite’ bacteria present in cultures of marine diatoms. FEMS Microbiol. Ecol. 2002, 42, 25–35. [Google Scholar] [CrossRef]
- Amin, S.A.; Hmelo, L.R.; Van Tol, H.M.; Durham, B.P.; Carlson, L.T.; Heal, K.R.; Morales, R.L.; Berthiaume, C.T.; Parker, M.S.; Djunaedi, B.; et al. Interaction and signalling between a cosmopolitan phytoplankton and associated bacteria. Nature 2015, 522, 98–101. [Google Scholar] [CrossRef] [PubMed]
- Jasti, S.; Sieracki, M.E.; Poulton, N.J.; Giewat, M.W.; Rooney-Varga, J.N. Phylogenetic diversity and specificity of bacteria closely associated with Alexandrium spp. and other phytoplankton. Appl. Environ. Microbiol. 2005, 71, 3483–3494. [Google Scholar] [CrossRef] [Green Version]
- Hibbing, M.E.; Fuqua, C.; Parsek, M.R.; Peterson, S.B. Bacterial competition: Surviving and thriving in the microbial jungle. Nat. Rev. Microbiol. 2010, 8, 15–25. [Google Scholar] [CrossRef] [Green Version]
- Buchan, A.; LeCleir, G.R.; Gulvik, C.A.; González, J.M. Master recyclers: Features and functions of bacteria associated with phytoplankton blooms. Nat. Rev. Microbiol. 2014, 12, 686–698. [Google Scholar] [CrossRef]
- Miao, Z.; Du, Z.; Li, H.; Lou, Y.; Luo, W. Analysis of bacterial diversity in the phycosphere of five arctic microalgae. Acta Ecol. Sin. 2015, 35, 1587–1600. [Google Scholar] [CrossRef] [Green Version]
- Yang, X.; Su, J.; Zheng, X.; Zhou, Y.; Tian, Y.; Ning, X.; Zheng, T. 16s rDNA clone library analysis of microbial diversity associated with the PSP-producing dinoflagellate Alexandrium tamarense. Environ. Sci. 2009, 30, 271–279. [Google Scholar] [PubMed]
- Kinsey, J.D.; Corradino, G.; Ziervogel, K.; Schnetzer, A.; Osburn, C.L. Formation of chromophoric dissolved organic matter by bacterial degradation of phytoplankton-derived aggregates. Front. Mar. Sci. 2018, 4, 430. [Google Scholar] [CrossRef]
- Gauthier, M.J.; Lafay, B.; Christen, R.; Fernandez, L.; Acquaviva, M.; Bonin, P.; Bertrand, J.C. Marinobacter hydrocarbonoclasticus gen. nov, sp. nov, a new, extremely halotolerant, hydrocarbon-degrading marine bacterium. Int. J. Syst. Evol. Microbiol. 1992, 42, 568–576. [Google Scholar] [CrossRef] [PubMed] [Green Version]
- Behringer, G.; Ochsenkühn, M.A.; Fei, C.; Fanning, J.; Koester, J.A.; Amin, S.A. Bacterial communities of diatoms display strong conservation across strains and time. Front. Microbiol. 2018, 9, 659. [Google Scholar] [CrossRef] [PubMed] [Green Version]
- Nebbioso, A.; Piccolo, A. Molecular characterization of dissolved organic matter (DOM): A critical review. Anal. Bioanal. Chem. 2013, 405, 109–124. [Google Scholar] [CrossRef]
- Huget, A.; Vacher, L.; Relexans, S.; Saubusse, F.M.; Parlanti, E. Properties of fluorescent dissolved organic matter in the Gironde Estuary. Org. Geochem. 2009, 40, 706–719. [Google Scholar] [CrossRef]
- Zsolnay, A.; Baigar, E.; Jimenez, M.; Steinweg, B.; Saccomandi, F. Differentiating with Fluorescence Spectroscopy the Sources of Dissolved Organic Matter in Soils Subjected to Drying. Chemosphere 1999, 38, 45–50. [Google Scholar] [CrossRef]
Figure 1.
The growth curves of Skeletonema dohrnii and bacteria.
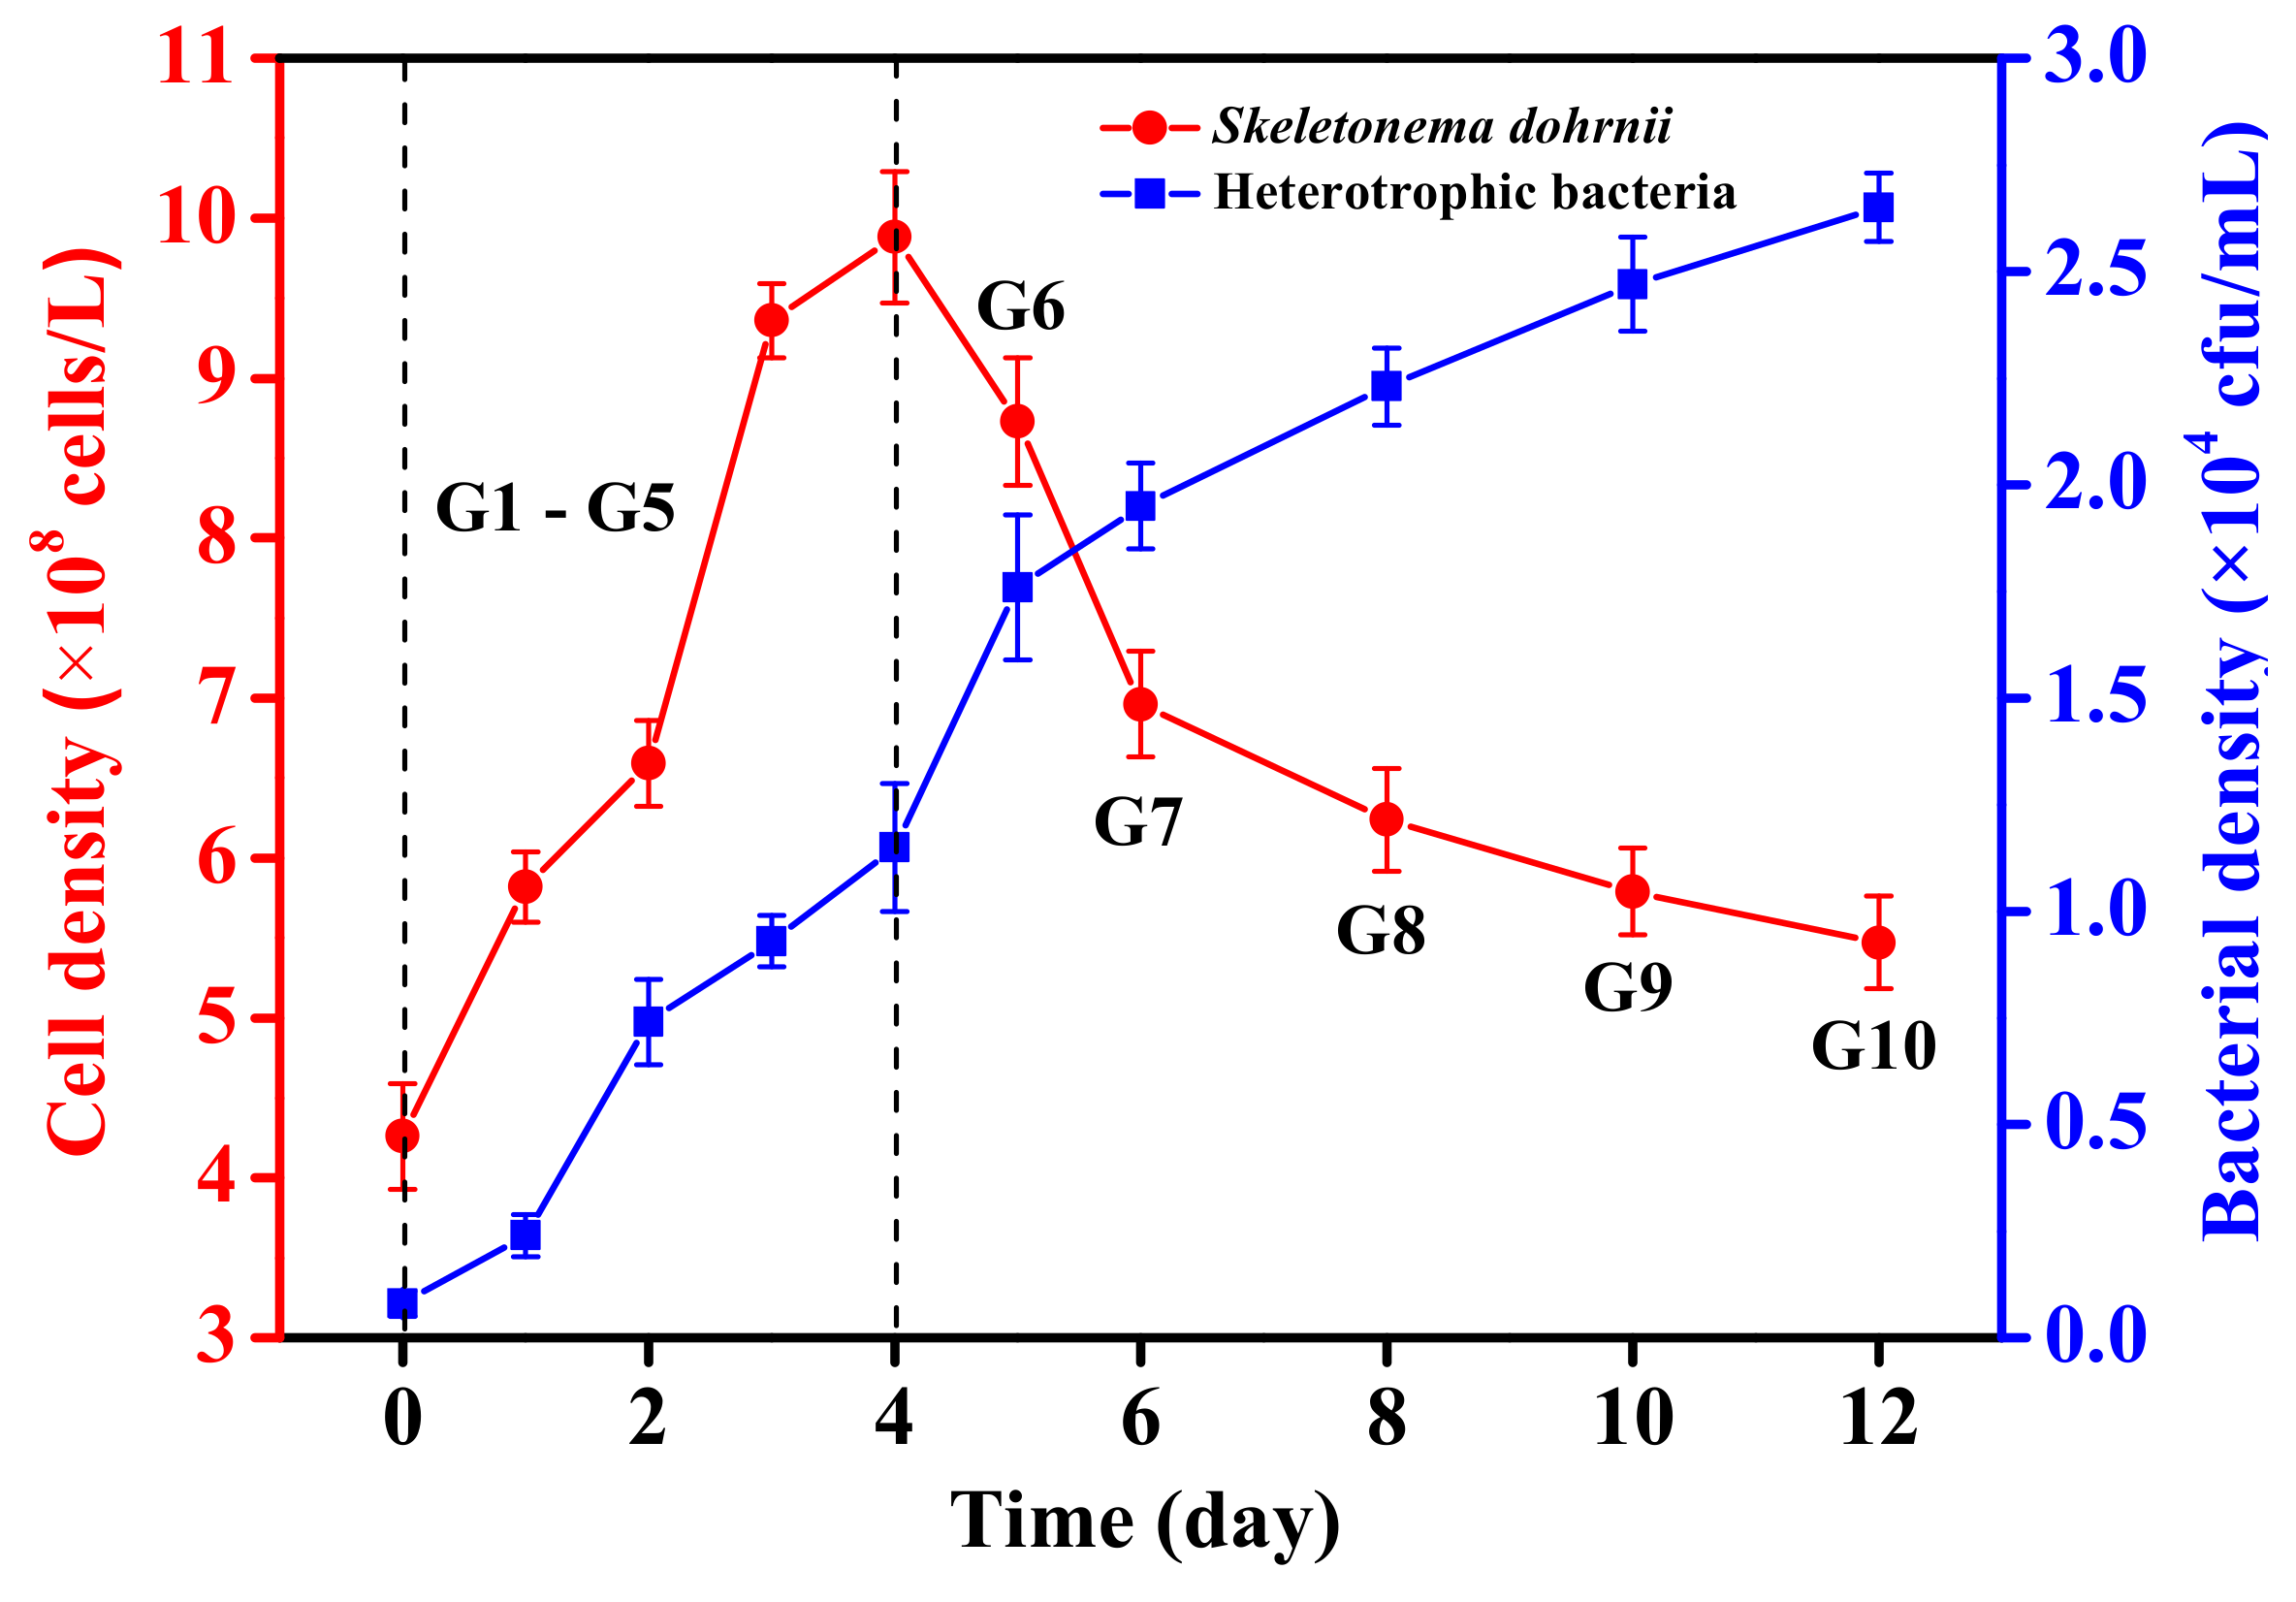
Figure 2.
The bacterial community composition at the phyla (a), class (b), and genus (c) level in all samples. G1-G7, G8, G9, and G10 were described as the results of the samples of S. dohrnii on days 0 to 6, and days 8, 10, and 12, respectively (a,b). (c), shows the top 15 categories of relative abundance.

Figure 3.
Changes in the relative abundance of individual major bacterial taxa in all samples. Order: (a,b); Genus: (c,d).
Figure 3.
Changes in the relative abundance of individual major bacterial taxa in all samples. Order: (a,b); Genus: (c,d).
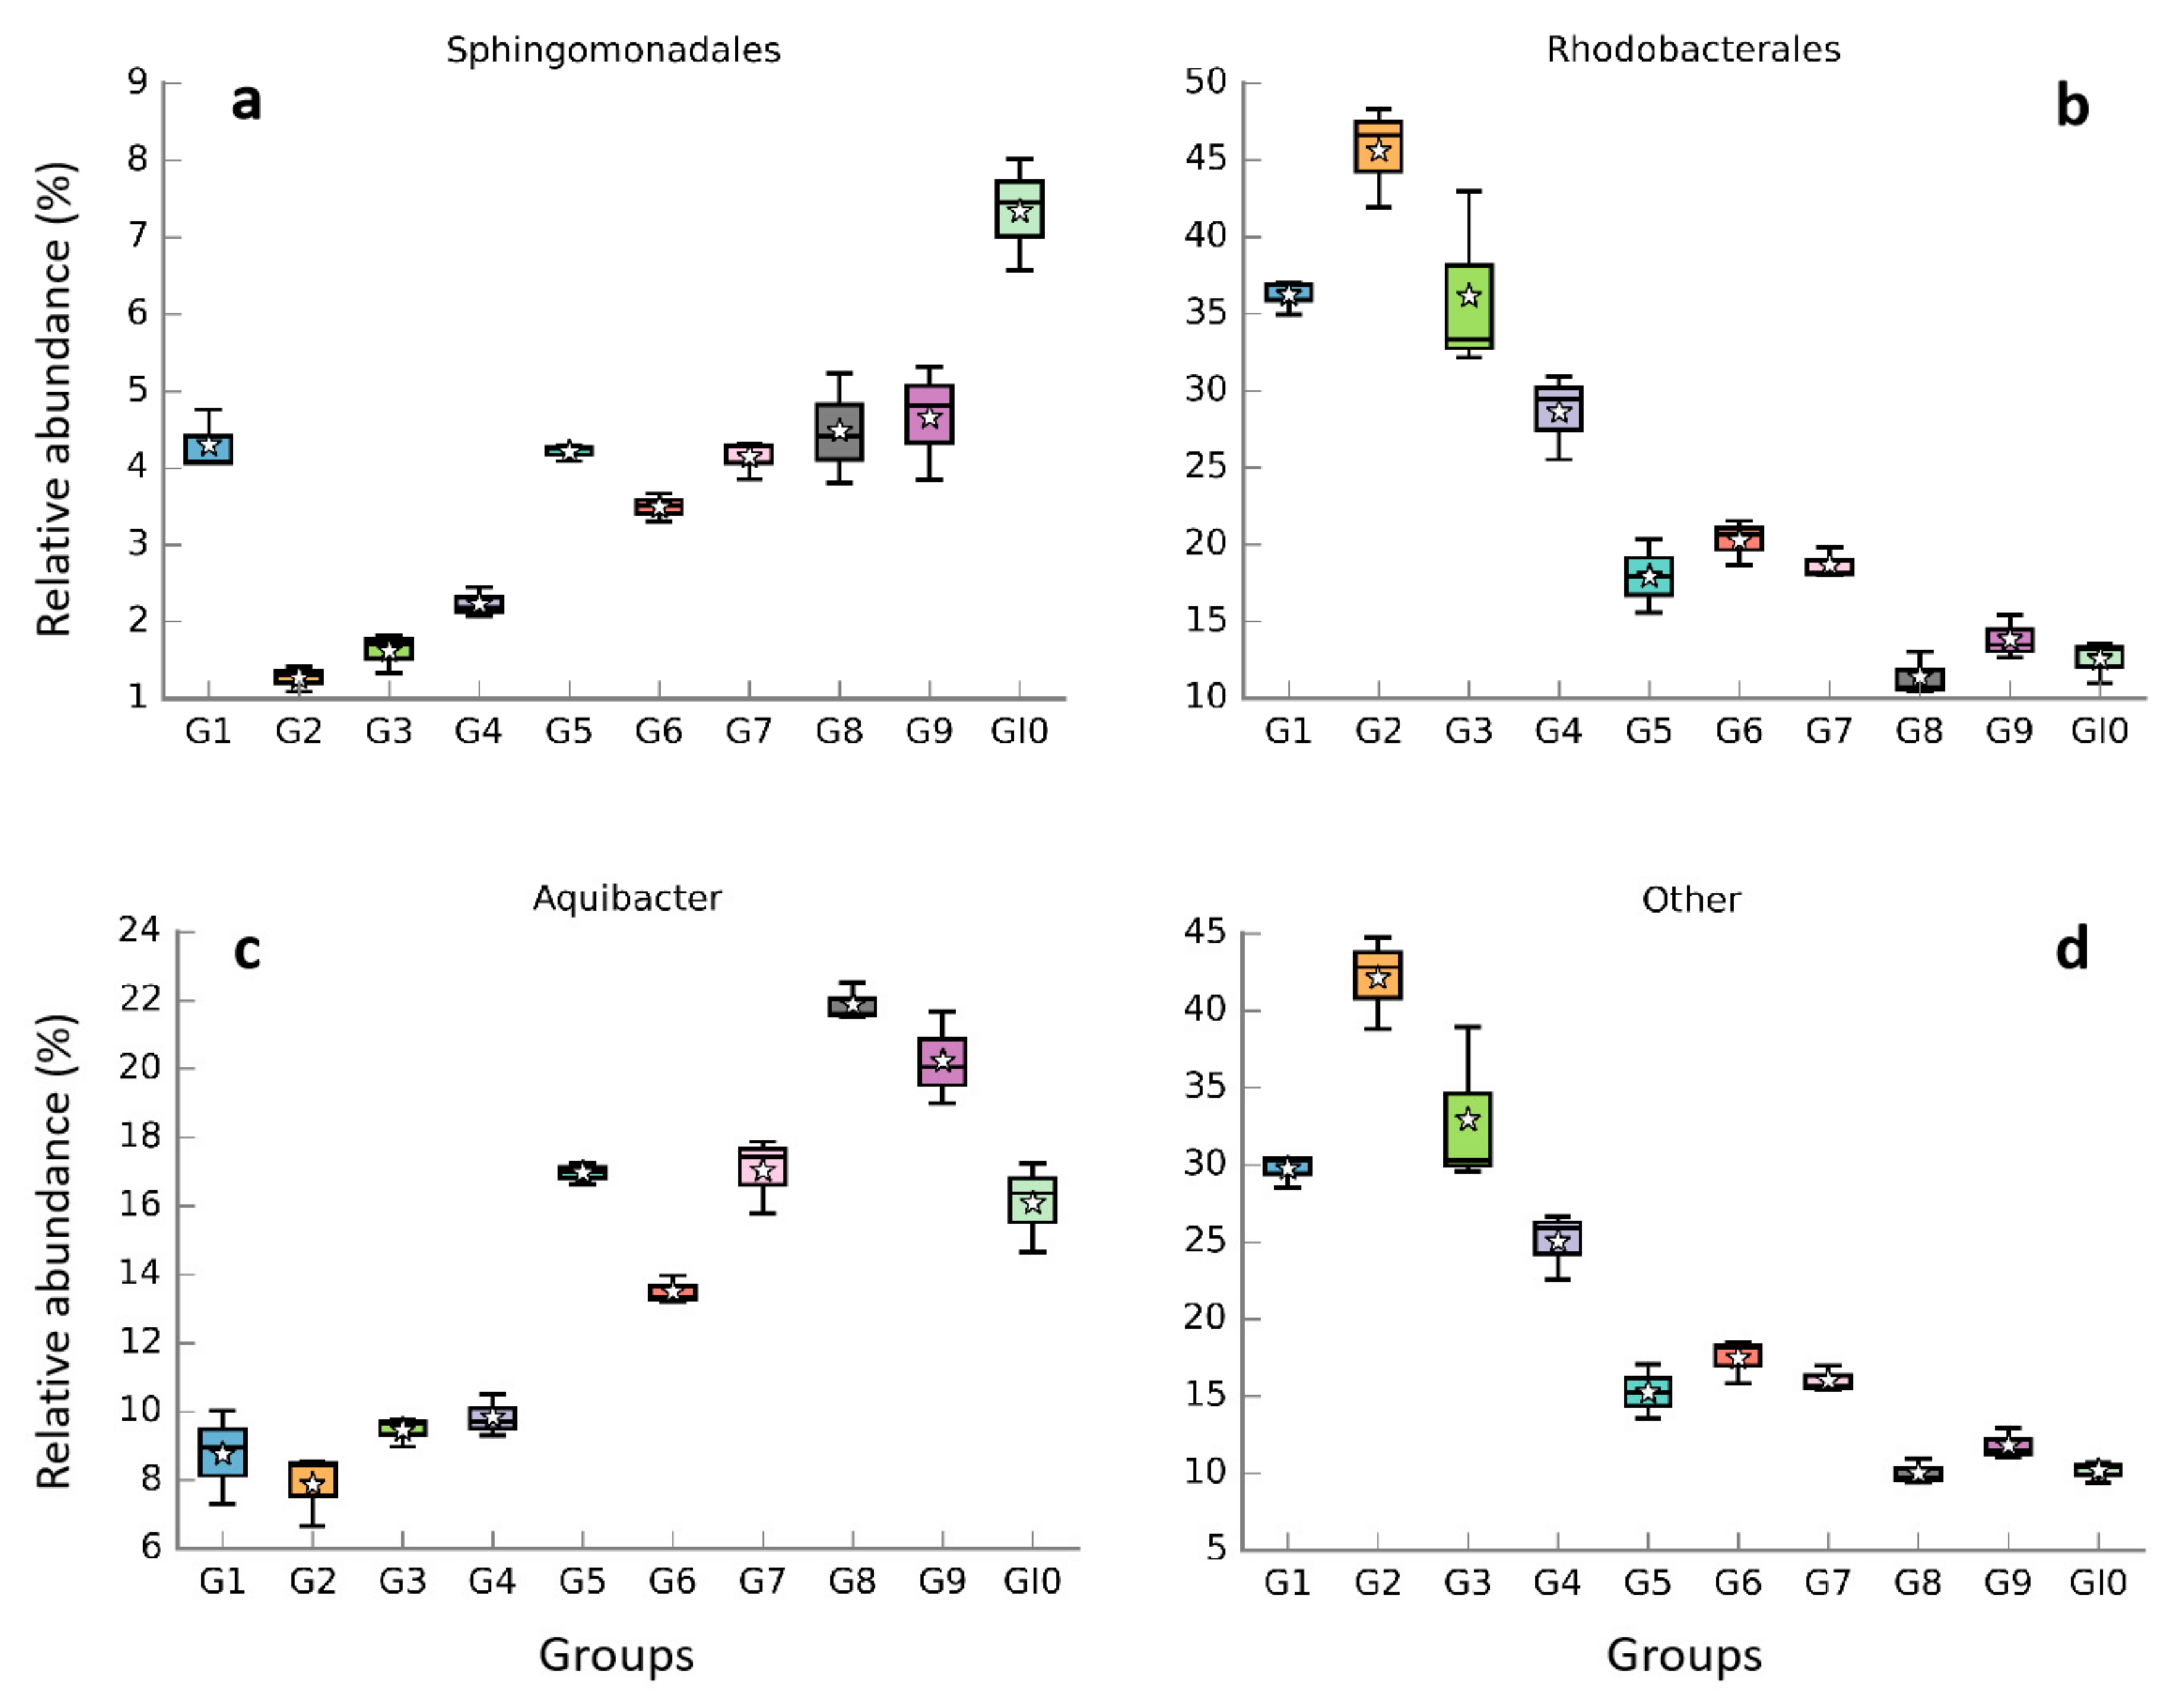
Figure 4.
Taxonomic cladogram obtained from LEfSe analysis. Histogram of the linear discriminant analysis (LDA) scores, where the LDA score indicates the effective size and ranking of each differentially abundant taxon (a). LEfSe cladograms showing taxa with different abundance values (b). The diameter of each circle is proportional to taxon abundance.
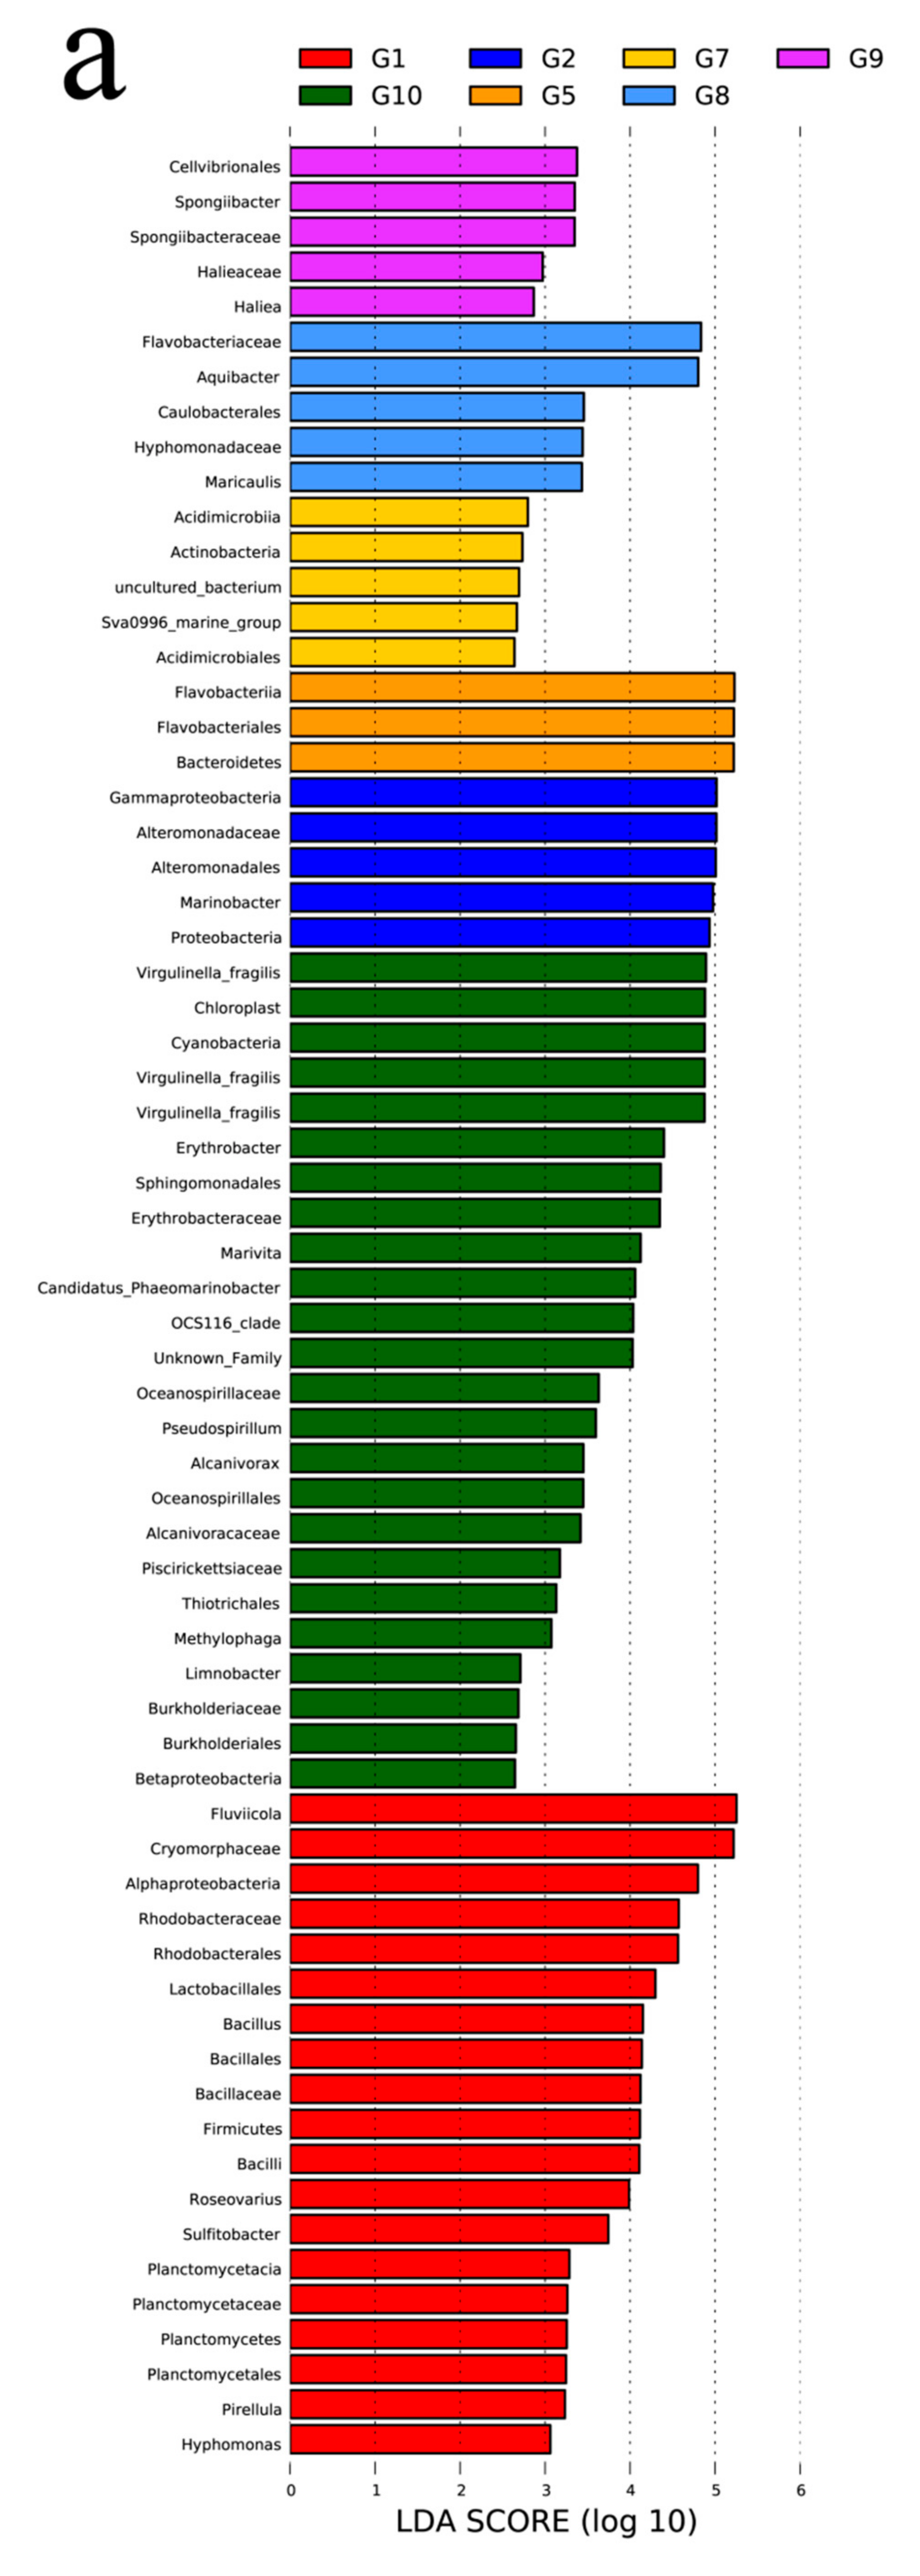
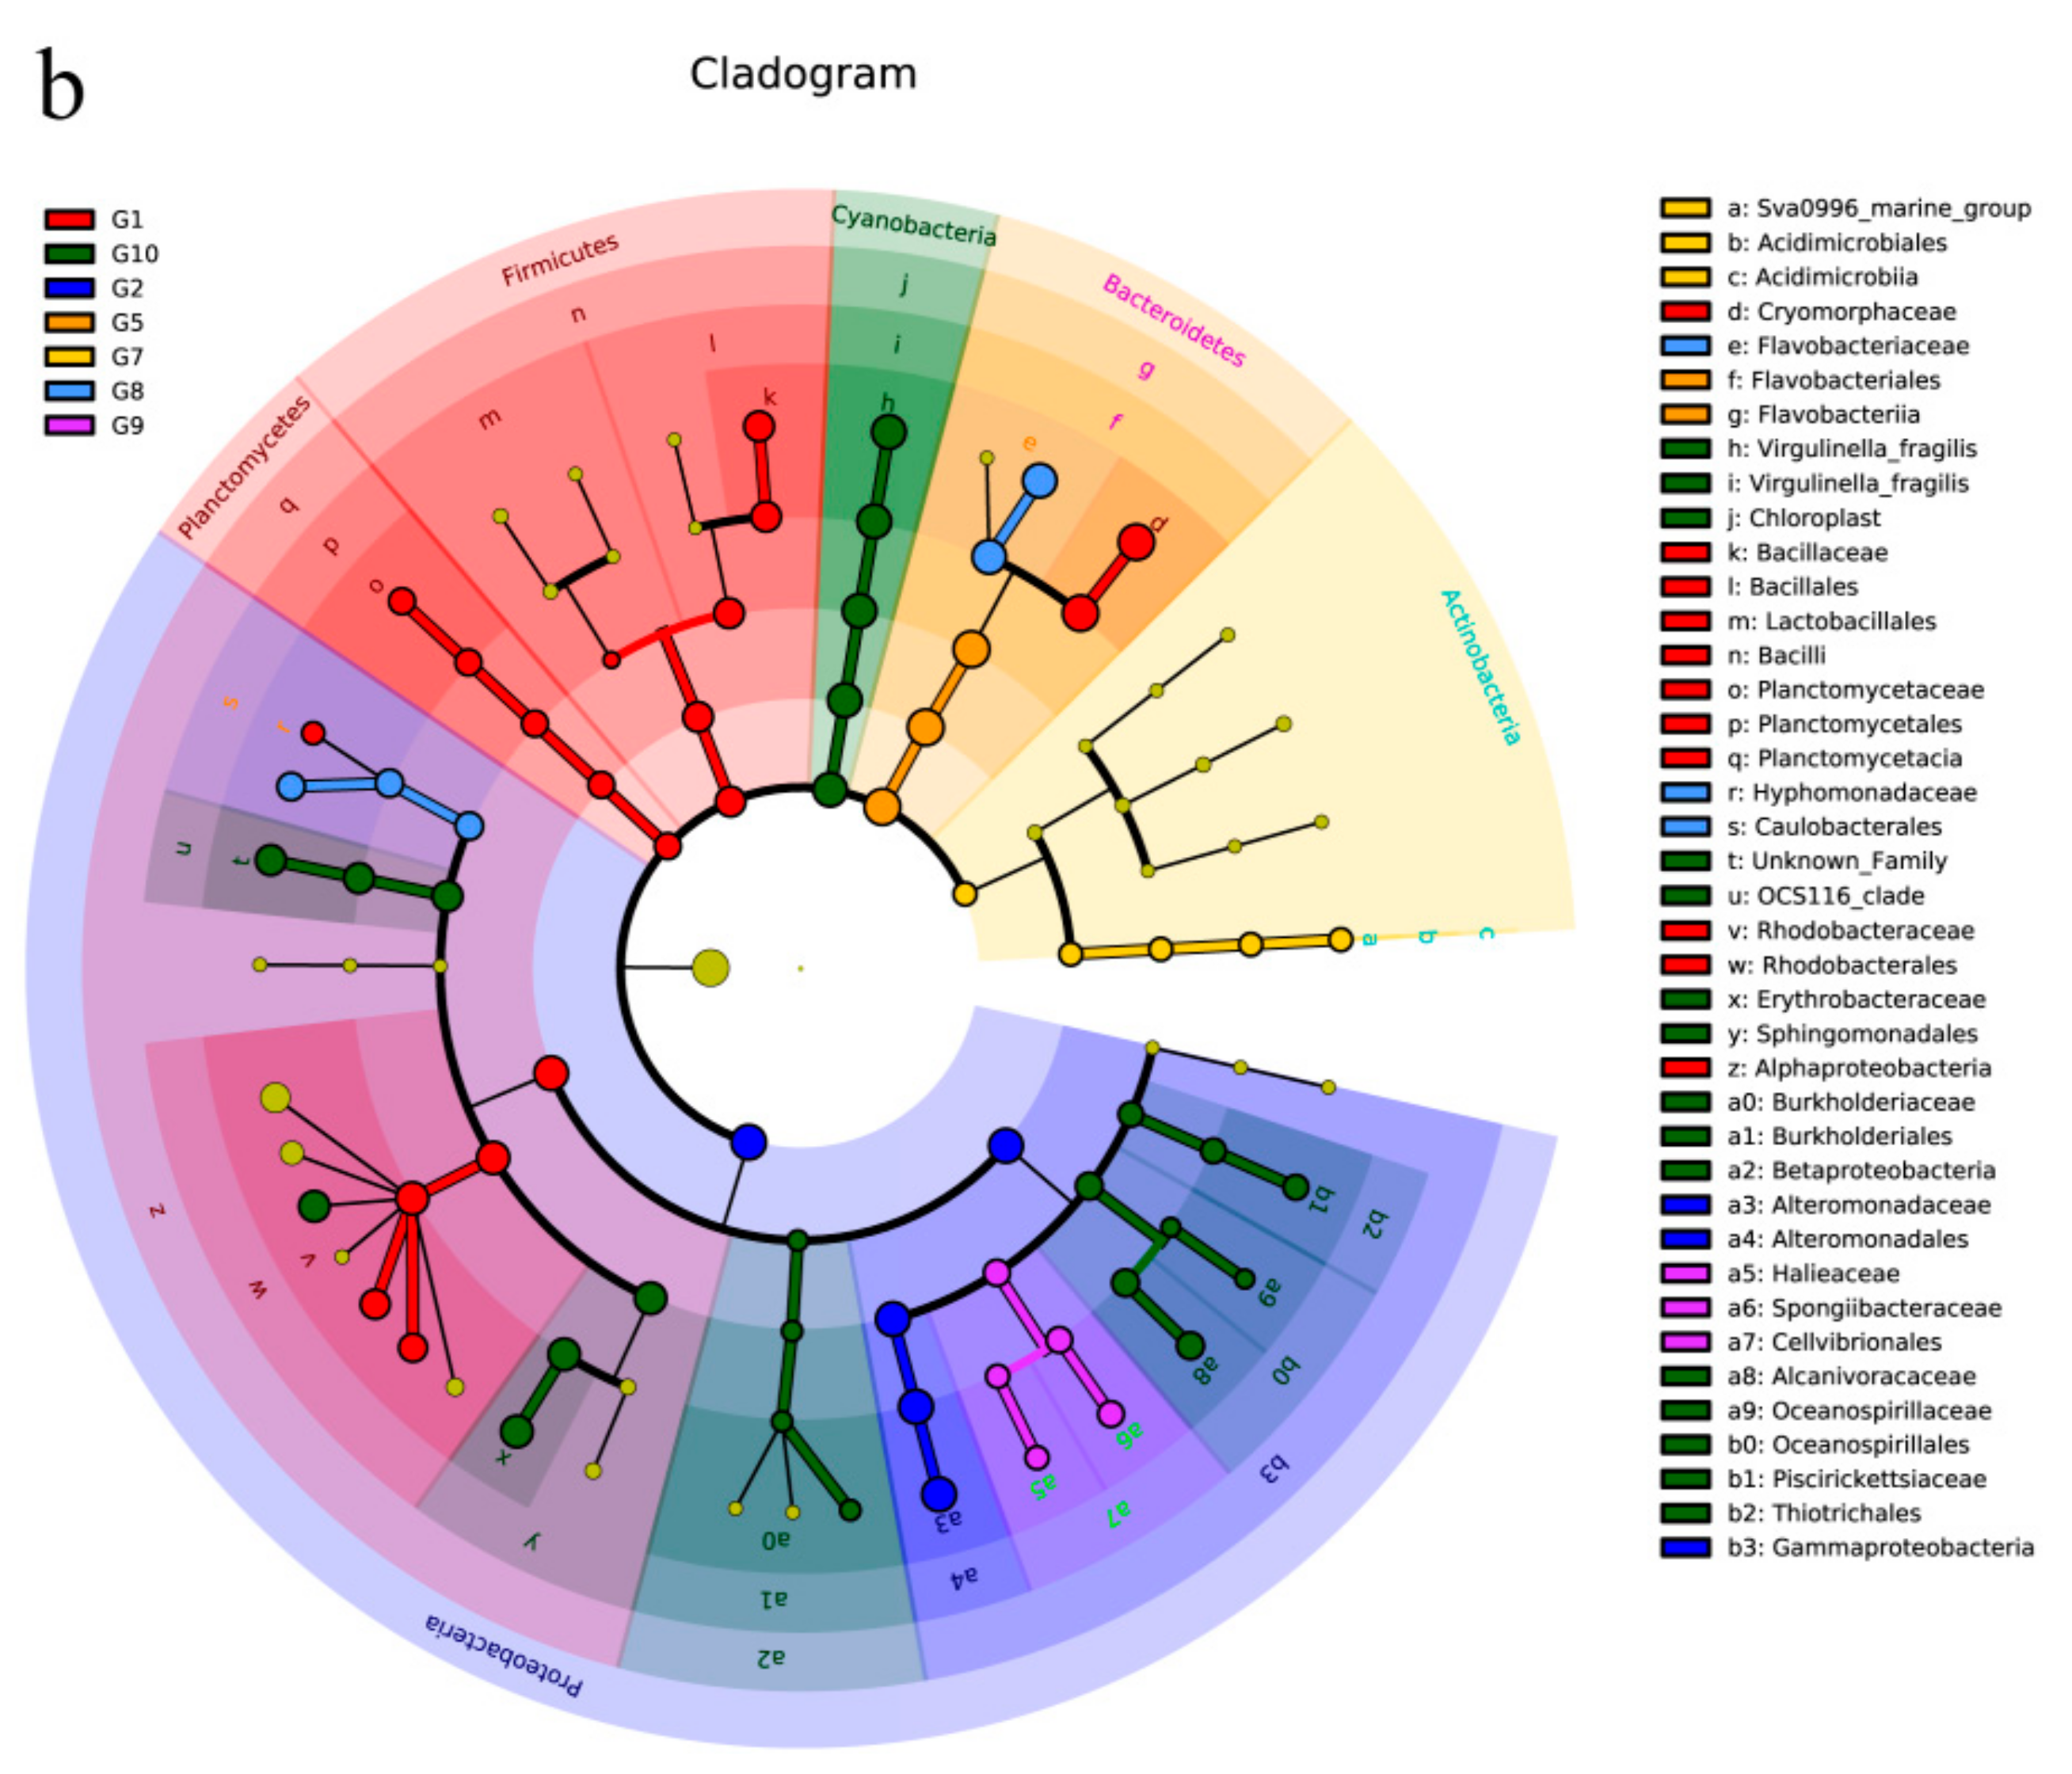
Figure 5.
The excitation–emission matrix spectroscopy of dissolved organic matter fluorescence for S. dohrnii during the culture time.
Figure 5.
The excitation–emission matrix spectroscopy of dissolved organic matter fluorescence for S. dohrnii during the culture time.

Figure 6.
The parameters of fluorescence index, biological index, and humification index under different culture time.
Figure 6.
The parameters of fluorescence index, biological index, and humification index under different culture time.

Table 1.
Central regions of fluorescence attributed to different sources of organic matter.
| Peaks | Excitation Wavelength (nm) | Emission Wavelength (nm) | Description | References |
|---|---|---|---|---|
| A | 260 | 380–460 | Humic-like substances (Terrestrial) | [41,42,43] |
| M | 290–310 | 370–420 | Humic-like substances (Marine) | [44] |
| T1 | 275 | 340–350 | Protein-like substances (amino acid tryptophan) | [41,42] |
| T2 | 225–230 | 340–350 | Protein-like substances (amino acid tryptophan) | [41,42] |
| I | 200–230 | 280–330 | Protein-like substances (tyrosine) | [45] |
Publisher’s Note: MDPI stays neutral with regard to jurisdictional claims in published maps and institutional affiliations. |
© 2021 by the authors. Licensee MDPI, Basel, Switzerland. This article is an open access article distributed under the terms and conditions of the Creative Commons Attribution (CC BY) license (https://creativecommons.org/licenses/by/4.0/).
Share and Cite
MDPI and ACS Style
Liu, Y.; Kan, J.; Yang, J.; Noman, M.A.; Sun, J. Bacterial Community Composition and Chromophoric Dissolved Organic Matter Differs with Culture Time of Skeletonema dohrnii. Diversity 2021, 13, 150. https://doi.org/10.3390/d13040150
AMA Style
Liu Y, Kan J, Yang J, Noman MA, Sun J. Bacterial Community Composition and Chromophoric Dissolved Organic Matter Differs with Culture Time of Skeletonema dohrnii. Diversity. 2021; 13(4):150. https://doi.org/10.3390/d13040150
Chicago/Turabian StyleLiu, Yang, Jinjun Kan, Jing Yang, Md Abu Noman, and Jun Sun. 2021. "Bacterial Community Composition and Chromophoric Dissolved Organic Matter Differs with Culture Time of Skeletonema dohrnii" Diversity 13, no. 4: 150. https://doi.org/10.3390/d13040150
Note that from the first issue of 2016, this journal uses article numbers instead of page numbers. See further details here.