Abstract
The Mediterranean basin constitutes one of the largest global biodiversity hotspots, hosting more than 11,000 endemic plants, and it is recognised as an area with a high proportion of threatened taxa. Nevertheless, only a tiny fraction of the threatened Mediterranean endemics have their genetic diversity assessed, and we are unaware if and how climate change might impact their conservation status. This is even more pronounced in Eastern Mediterranean countries with a rich endemic flora, such as Greece, which hosts a large portion of the plant taxa assessed at the European level under the IUCN criteria. Using inter simple sequence repeats (ISSR) markers and species distribution models, we analysed the genetic diversity and investigated the impacts of climate change on four critically endangered and extremely narrow and rare Greek island endemic plants, namely Aethionema retsina, Allium iatrouinum, Convolvulus argyrothamnos, and Saponaria jagelii. All four species are facing intense anthropogenic threats and display moderate genetic diversity (uHe: 0.254–0.322), while climate change is expected to have a profound impact on their range size during the coming decades. A combination of in- and ex-situ measures, such as population reinforcement and seed bank conservation, are urgently needed in order to preserve these highly threatened and rare Greek endemics.
1. Introduction
The Mediterranean basin with its ca. 10,000 islands and islets is the second largest global biodiversity hotspot in the world [1,2,3,4] due to geographically structured diversification rates, spatio-ecological isolation [5], and high topographical and environmental heterogeneity [6]. Its high species numbers are related to an ancient origin, followed by active speciation and explosive radiations [7]. The Mediterranean basin is characterised by immense biogeographical intricacy [4] and high endemism [6]. Most of these endemics have a very narrow geographical range (ca. 40%; [8]), often restricted to single islands, mountains, or coastal plains as a result of the region’s intricate geography and orography ([4] and references therein). The three Mediterranean peninsulas (the Iberian, the Italian, and the Balkan) have in general shaped the observed biogeographical patterns in the region [9,10] due to elaborate interactions between environmental and topographical factors [10,11,12,13,14,15] as well as due to the existence of several climatic refugia that allowed the persistence and the diversification of numerous plant lineages [16,17,18,19].
This elevated species richness seems to be in peril though, since the Mediterranean basin is also a global biodiversity hotspot of threatened taxa [20] and is considered as a high climate-change velocity area [21]. This may lead to increased extinction rates due to climate- and land-use change [22,23,24], a global phenomenon [25,26,27,28] characterising the Anthropocene era [29]. Besides, nearly 40% of plant taxa are facing increased extinction risk according to recent global estimates [30], as plant extinction rates have been rising for the past two centuries [31]. Under these circumstances, it is imperative to focus the conservation actions towards narrow endemic taxa, as their populations are usually highly fragmented and genetically depleted due to low size ([32] and references therein), meaning that their preservation is central in biological conservation [33].
Relatively few studies have been undertaken in the Mediterranean basin dealing with the conservation genetics of narrow endemic plant taxa (see [33] for a thorough review), and even fewer such studies have been conducted in the eastern Mediterranean [33,34]. The same applies in Greece, one of the most species-rich Mediterranean countries [35] that hosts 65 taxa (eight of which are facing imminent extinction) that are considered as threatened under the IUCN standards and assessed at the European level [36] (https://www.iucn.org/sites/dev/files/content/documents/greece_s_biodiversity_at_risk_fact_sheet_may_2013.pdf). Only two of these taxa, which are also characterised as critically endangered at the European level, i.e., Centaurea heldreichii and Minuartia dirphya, have been assessed under a conservation genetics framework, while all other studied taxa are either of lower extinction risk, not threatened at all, or not even Greek endemics [37,38,39,40,41,42,43,44,45]. Thus, the genetic diversity of the vast majority of the plant taxa occurring exclusively in Greece that have been assessed at the European level and are considered as critically endangered have not yet been assessed. Hence, the time seems ripe to investigate the genetic diversity of four of these taxa, which are characterised as critically endangered and constitute extremely narrow Greek endemics, namely Aethionema retsina, Allium iatrouinum, Convolvulus argyrothamnos, and Saponaria jagelii. Climate change is expected to severely reduce the range of Convolvulus argyrothamnos [46], while it remains unknown if and how climate change might affect Aethionema retsina, Allium iatrouinum, and Saponaria jagelii. Our primary objective was thus to conduct a preliminary study and provide a first estimate of the genetic diversity of the aforementioned taxa through inter simple sequence repeats (ISSR) markers and use species distribution models to assess the potential range change due to climate change for those taxa that we had adequate occurrences (i.e., Aethionema retsina and Allium iatrouinum [47]).
2. Materials and Methods
2.1. Study Species
All four of our study species (Aethionema retsina, Allium iatrouinum, Convolvulus argyrothamnos, and Saponaria jagelii) constitute rare Greek island endemics [35,48,49] and are characterized as critically endangered (CR) according to the IUCN Red List (www.iucnredlist.org, visit on 5 February 2021) and the Red Data Book of Greece [50,51]. Their populations comprise at most a few dozen individuals, occupy very restricted areas, occur in steep, precipitous cliffs (Aethionema retsina and Convolvulus argyrothamnos), in sandy beaches (Saponaria jagelii), or in rock crevices (Allium iatrouinum), and are included in the IUCN “Top-50” Mediterranean Island Plants Campaign [52] (apart from Allium iatrouinum). They are regarded as “extremely narrow endemics” [32], which are in need of effective conservation measures.
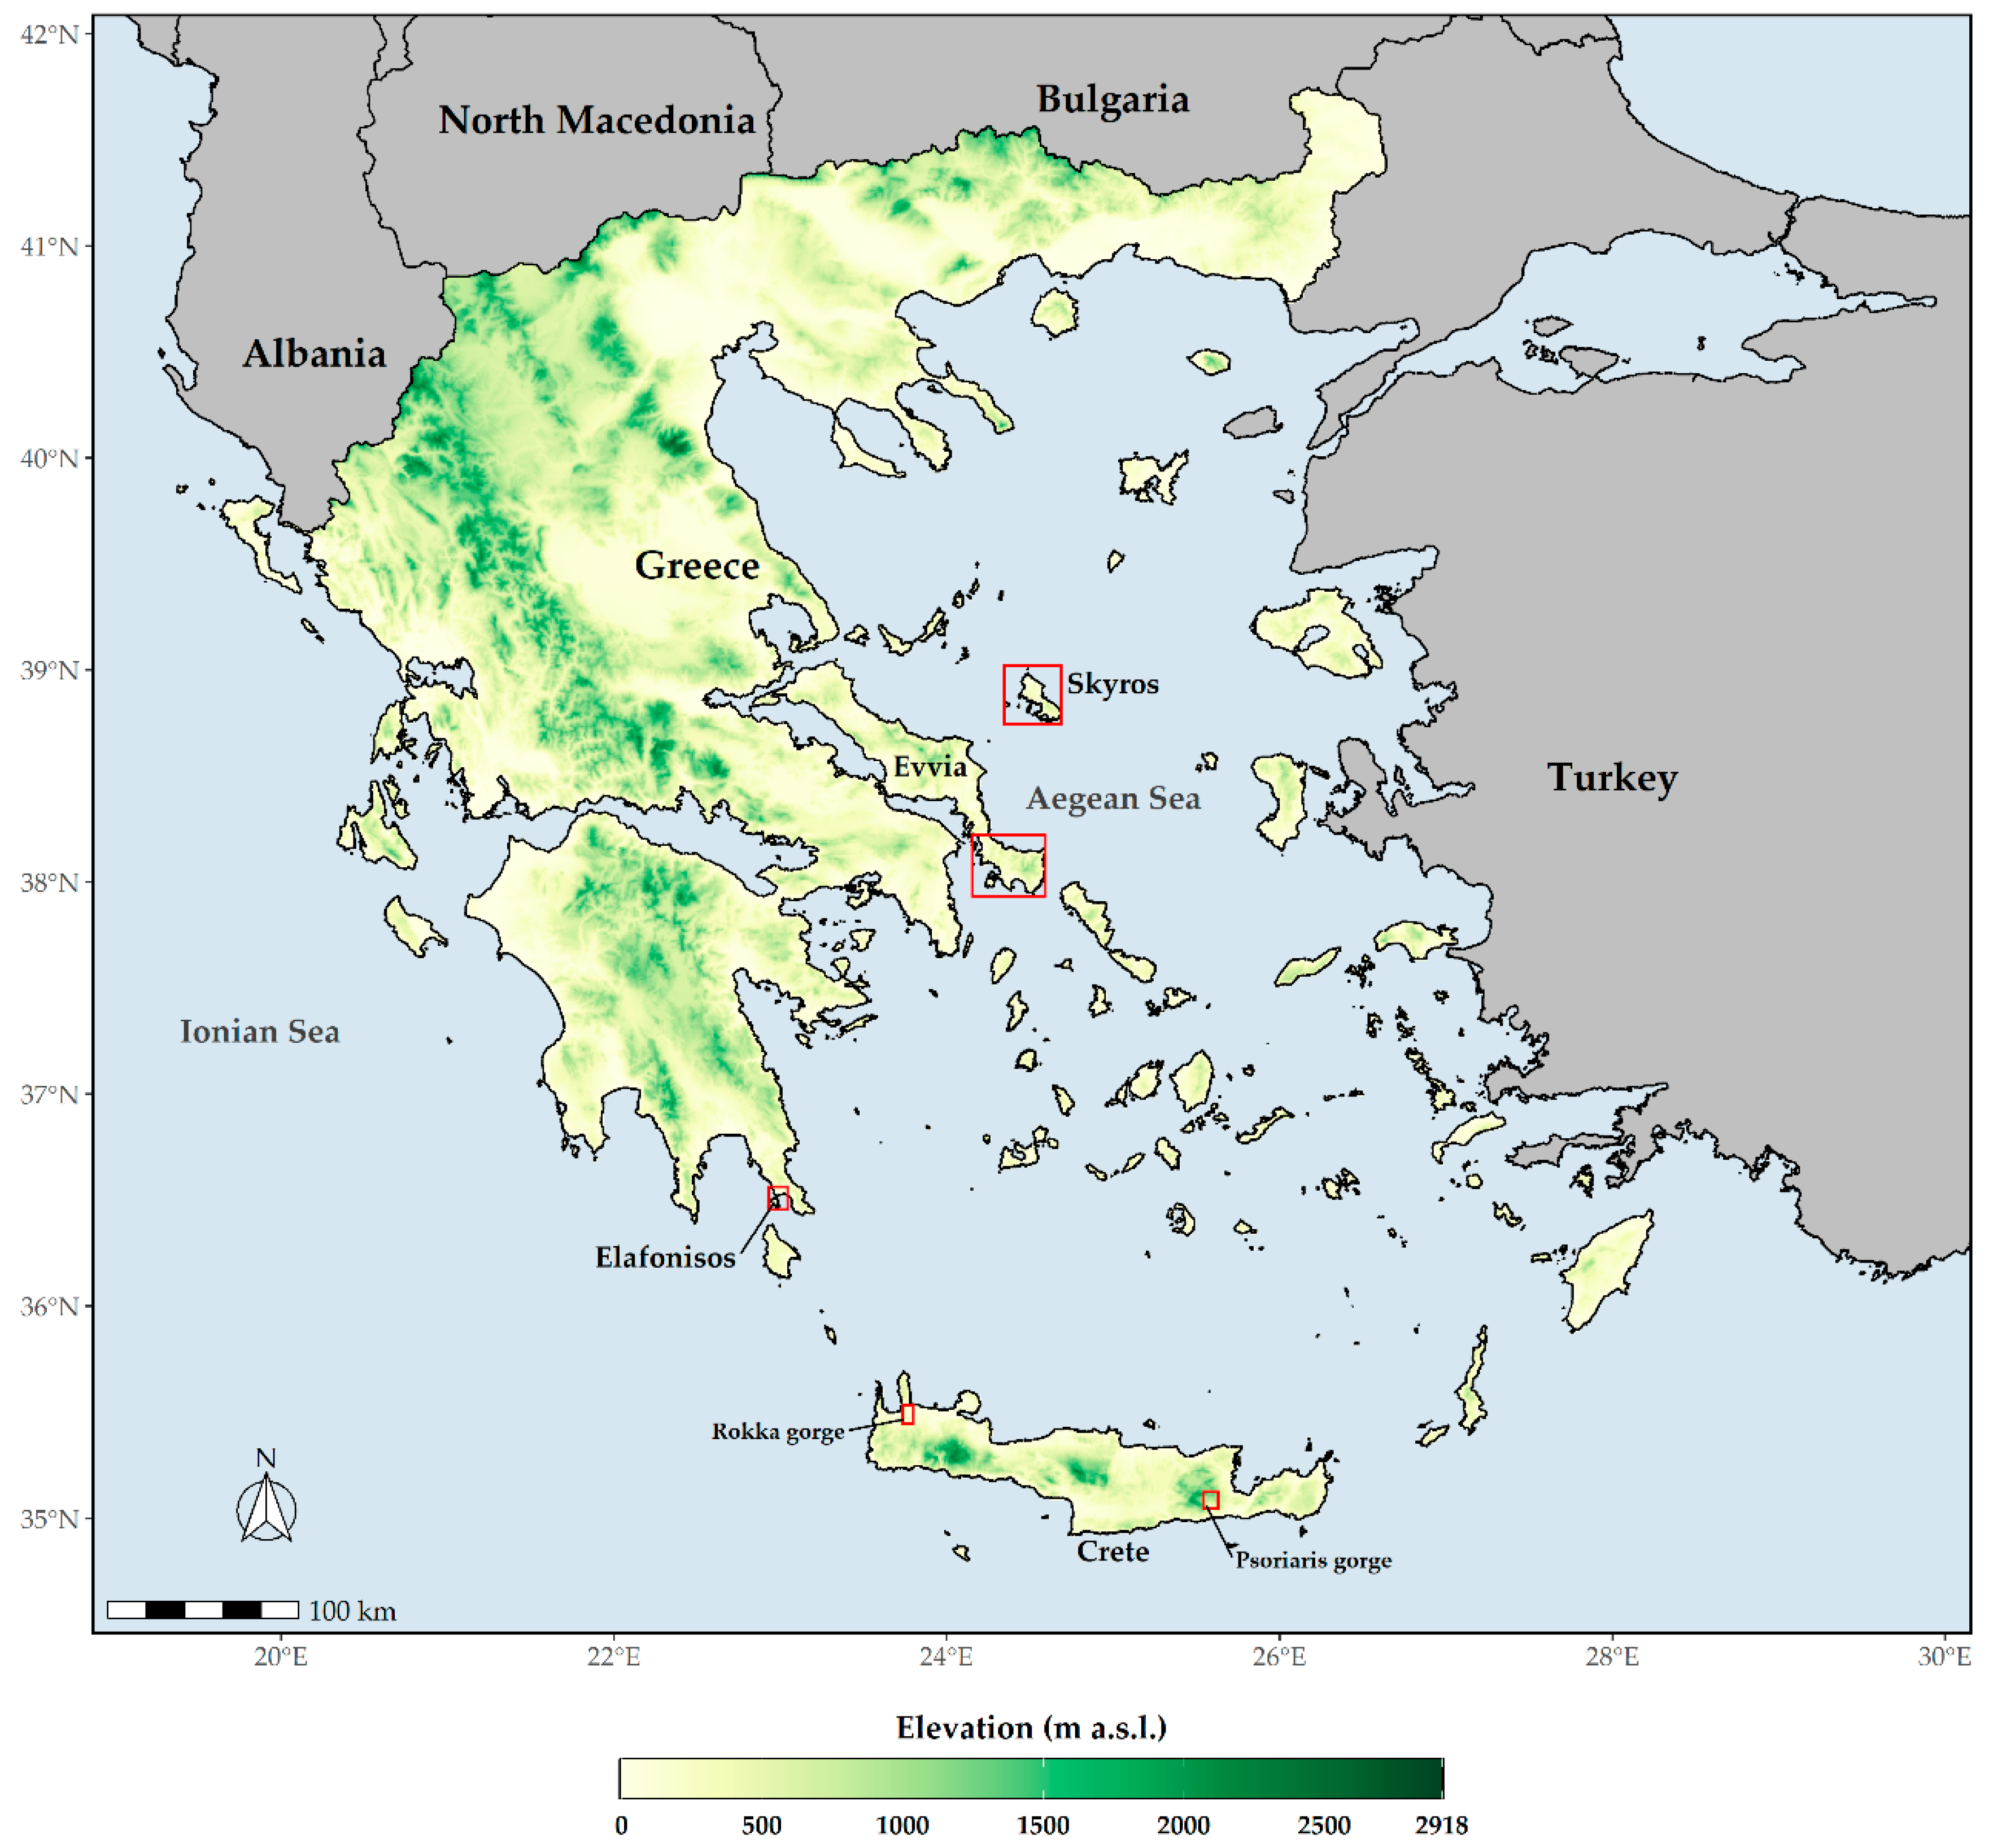
Aethionema retsina is a chasmophyte, up to 20 cm in height, with an up to 50-flowered racemose inflorescence that occurs at 10–450 m a.s.l. on northeast-facing crevices of Mt. Kochylas and Cape Korakia in Skyros and in calcareous cliffs on the northern coast of the nearby satellite island, Skyropoula, in the Northern Sporades island complex, which lies east of Evvia [53] (Figure 1). Its total population size does not exceed 51 mature individuals (a very small fraction of which is accessible—ca. 10%), scattered in three subpopulations in Skyros, while the Skyropoula subpopulation is virtually inaccessible and has not been recently assessed [53,54]. Overgrazing, limestone quarrying, and future road construction constitute the major threats this species is facing [53,54,55].
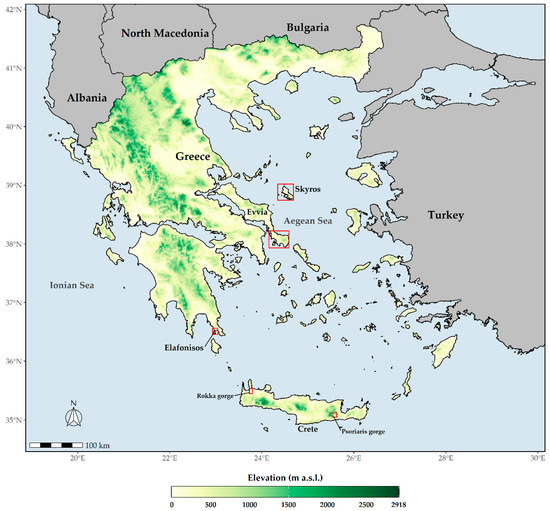
Figure 1.
Map of Greece depicting the wider distributional area (red polygons) of the studied species. Aethionema retsina occurs in Skyros and Skyropoula, Allium iatrouinum in southern Evvia, Convolvulus argyrothamnos is a Cretan single endemic, and Saponaria jagelii is found on Elafonisos.
Allium iatrouinum is a recently described species [56], endemic to the southern part of Evvia Island in the West Aegean (Figure 1). It is a summer-flowering bulbous perennial, growing in crevices of metamorphic rocks, from sea level to 1020 m a.s.l. About 200–400 individuals had been estimated to occur in the locus classicus, covering an area of ca. 0.7 ha [56]. The recent construction of a wind farm in this area, however, has totally destroyed the species’ habitat, and no individuals were found during a visit in June 2020; there is a high probability that the species has become extinct from its locus classicus. In the summer of 2018, Ioannis Kofinas-Kallergis, a tireless amateur botanist, discovered two new subpopulations of Allium iatrouinum in southern Evvia, one near Karystos at low altitude and another ca. 4 km above Nimporio. We visited both of these locations in 2019 and 2020. Despite our repeated visits, we could not locate any individuals at the site near Karystos. On the other hand, the site above Nimporio hosts 110 mature individuals, which now seems to constitute the largest subpopulation of Allium iatrouinum.
Convolvulus argyrothamnos is a very rare Cretan single island endemic (Figure 1) with very strict ecological requirements [36,50,57,58]. It is a summer-flowering, chasmophytic perennial shrub, up to 80 cm in height, growing on precipitous limestone cliffs in the Rokka (at 150 m a.s.l.) and the Psoriaris (at 450 m a.s.l.) gorges, in north-western and south-eastern Crete, respectively [36,50,57,58,59]. Its total population size does not exceed 74 mature individuals (14 in Psoriaris gorge and 60 in Rokka gorge). Low probability of genetic exchange, wildfires, overgrazing, and seed gathering (from the very few accessible individuals) represent the major threats for this species [36,50,57,58,59].
Saponaria jagelii is an annual, spring-flowering species, up to 10 cm tall, that is apically glandular-hairy and growing in two nearby sandy beaches in the western part of Elafonisos Island (Figure 1), located off the southern coast of the Peloponnese [60]. Its total distributional area is extremely small, not exceeding a few dozen square meters. The main threats this species is facing is habitat degradation due to human activities (urbanization, trampling by tourists, motor vehicle transit) that may lead the species to extinction [61].
2.2. Specimens, DNA Extraction, Amplification, and Scoring of the ISSRs Markers
Leaves from two to eight adult specimens (Table 1), depending on the natural population size, for each one of the four study species were collected in 2019–2020, dehydrated using silica gel, and stored at −20 °C until further processing. All study species comprise extremely small populations, and two of them (Aethionema retsina and Convolvulus argyrothamnos) occur in inaccessible sites that required expert climbing techniques and rappelling to collect samples. Specimens were assigned to species based on morphological features following [35,48,49,56].

Table 1.
Plant species, sampling sites, number of individuals per sampling site, and number of markers that were successfully and repeatedly amplified per species in this study are shown. Individuals sampled from each species under study are given in parentheses. N: number of samples finally used in the analysis. ISSR: inter simple sequence repeats.
Total genomic DNA was isolated from leaf tissue using either a commercially available kit (Machery-Nagel, NucleoSpin Plant II kit for DNA from plants) or the CTAB 2× (hexadecyl-trimethyl-ammonium bromide) protocol of [62], with the modifications described in [63]. The DNA quantity and the quality were evaluated using agarose gel electrophoresis (i.e., high molecular weight DNA) and the ratio A260/A280 (samples with values 1.7–2.0 were further processed) as measured in nanodrop.
For the genetic diversity analyses, we used 13 ISSR primers (University of British Columbia Nucleic Acid-Protein Service Unit, UBC Primer Set no. 9) per species (see Table 1). ISSRs are widely used as a simple, fast, highly reproducible, and efficient technique in detecting genetic diversity in plant species populations [64].
Each PCR was performed twice in a 20 µL volume, where 1 µL of template DNA (15 or 20 ng) was mixed with 0.3 mM dNTPs, 0.3 mM of primer, 1.5–2.5 mM of the MgCl2, and 1 unit of Taq polymerase. The cycle programs comprised an initial denaturation step at 94 °C for 4 min, followed by 37–39 cycles of 30 s at 94 °C, 1.0 min at 45–55 °C, and 2 min at 72 °C. The cycling was ended with a 7 min sequence extension at 72 °C. The annealing temperatures of the PCRs and the concentration of MgCl2 varied (45–55 °C and 1.5–2.5 mM) between the different markers amplified as well as between the different species tested. The ISSR primers that successfully and repeatedly amplified per species as well as the respective PCR conditions are presented in detail in Table 2. The PCR amplification products were separated by electrophoresis on 2.0% agarose gels using 1.0× TBE buffer at 100 V and visualized with ethidium bromide staining under UV light or RedGel under blue light. A 100–3000 bp DNA ladder H3 RTU (NIPPON Genetics Europe) was used as a size marker for every gel run.

Table 2.
ISSR primers that were successfully and repeatedly amplified per species, the sequence of each primer (ISSR sequence), the number of bands (NoB), and their size range (SR in base pairs), as well as the PCR conditions (annealing temperature (T), MgCl2 concentration, template, and number of cycles) used per marker and per species for the bands’ amplification.
2.3. Scoring of the ISSR Markers and Analyses of Genetic Diversity
The photographs of the agarose gels were used to score data for ISSR markers. Repeatedly amplified bands that were well-separated, clear, and intense were scored in binary code with one (presence) and zero (absence). Any faint, smeared, and not reproducible bands were excluded from the scoring process. Bands were scored manually based on the bands of the DNA ladder using ImageJ. The scoring was performed on the same photographs by three of the authors (Konstantinos Kougioumoutzis, Panayiota Kotsakiozi, and Efthalia Stathi) independently in an effort to eliminate any subjectivity to the scoring process.
Genetic diversity for each one of the four plant species was estimated using parameters such as the percentage of polymorphic bands (PPB), the number of alleles (Na), the number of effective alleles (Ne), the Shannon’s information index (I), the unbiased expected heterozygosity (uHe), and the expected heterozygosity (He) as determined using GenAlex version 6.5 [65]. We also estimated Nei’s gene diversity (h) and total genetic diversity (Ht) using PopGen [66].
2.4. Environmental Data
We obtained current and future climatic data from the WorldClim and the CHELSA [67,68] databases at a 30 s resolution. We constructed sixteen additional bioclimatic variables using functions from the “envirem” 2.2 [69] R package. We extracted soil variables from the SoilGrids database [70] at a 250 m resolution. We extracted altitudinal data from the CGIAR-CSI data-portal [71]. We used functions from the “raster” 2.6.7 [72] and the “spatialEco” 1.2-0 [73] R packages to estimate supplementary topographical variables (aspect, heat load index, slope, topographic position index, and terrain ruggedness index) based on the altitudinal data. All environmental variables were statistically downscaled using functions from the “raster” 2.6.7 [72] and the “automap” 1.0.14 [74] packages so as to match the resolution of soil variables.
Regarding future projections, we obtained data for 2070 for three global circulation models (GCMs) according to [75] and two different intergovernmental panel on climate change scenarios from the representative concentration pathways (RCP) family: RCP2.6 (mild scenario) and RCP8.5 (severe scenario). Climate database-related uncertainty needs to be addressed when running species distribution models (SDMs) [76], thus we checked the bioclimatic consistency and congruence of our model predictions for every GCM and RCP that were available in both WorldClim and CHELSA, following the framework of [77]. To do so, we ran the species distribution models (described thoroughly in the next subsection) for both climate databases separately and then compared their outcome following [77].
From this initial set of 56 predictors, only sixteen did not have a collinearity problem for each of the climate databases (Spearman rank correlation < 0.7 and VIF < 10 [78]) and were thus included in the analyses. We used the “vifcor” function from the “usdm” 1.1.18 [79] R package to assess multicollinearity.
2.5. Species Distribution Models
2.5.1. Model Parameterization and Evaluation
We modelled the realized climatic niche of Aethionema retsina and Allium iatrouinum in an ensemble modelling scheme under the ensemble of small models (ESM) framework [80,81,82], which is suitable for modelling rare species [80,81,82], using the random forest (RF) modelling algorithm (single-technique ESMs perform equally as good as double ensembles [66]), which is robust to overfitting [83]. We did not analyse the potential distribution of Saponaria jagelii, as it is known only from two localities. We generated pseudo-absences (PAs) following [84] at a minimum distance of 2.8 km from presence locations, which equals to the median autocorrelation distance among the non-collinear environmental variables, using functions from the “blockCV” 1.0.0 [85] R package. Since data regarding the exact distribution area of Allium iatrouinum in Greece are lacking, we estimated the species’ background area using the “EOO.computing” function from the “ConR” 1.1.1 package [86] for the alpha-hull method, since the convex hull method often overestimates species ranges ([87] and references therein). ESMs were then calibrated by fitting bivariate models, which were then averaged into an ensemble model using weights based on model performances. For all the models, prevalence was equal to 0.5. We evaluated our models’ predictive performance via the true skill statistic (TSS [88]) based on a repeated (10 times) split-sampling (calibration data: 80%; evaluation data: 20%) approach. We used null model significance testing [89] to evaluate the performance of all the models and estimated the probability that each model performed better than 100 null models. All the models were found to outperform the null expectation at p < 0.001. We checked if there was any difference in the predictive ability of our models between the different climate databases via a Kruskal–Wallis non-parametric test (KWA) on the true skill statistic. All analyses were run in R 4.0.3 using base R functions and functions from the “biomod2” 3.3.7 and “ecospat” 3.1 R packages [90,91].
2.5.2. Model Projections
We projected the potential suitable area of Aethionema retsina and Allium iatrouinum under current and future climate conditions (habitat suitability values range from 0 to 1) via an ensemble model framework [76] based on calibrated models with TSS ≥ 0.8 (to avoid poorly calibrated ones). The contribution of each model to the ensemble forecast was weighted according to its TSS score. While model evaluation was carried out using the above-mentioned data-splitting procedure, the final models used for spatial projections were calibrated using 100% of the data, thus allowing taking advantage of all available data. We binary transformed the resulting habitat suitability maps based on the metric that maximizes the sum of sensitivity and specificity [92,93,94] and then compared them to the binary maps obtained for each GCM and RCP. As a conservative approach, the suitability of any cells that had non-zero values in the clamping mask was set to zero [95]. Finally, we applied a mask corresponding to urban and suburban areas to avoid projections at unsuitable areas irrespective of the prevailing environmental conditions.
2.5.3. Area Range Change
We used functions from the “biomod2” 3.3.7 R package [90] to infer if Aethionema retsina and Allium iatrouinum will contract or expand their future range. Both taxa were not assumed to have unlimited dispersal capacity, since this would be overoptimistic.
3. Results
3.1. ISSR Polymorphism
The primers used for each one of the four species as well as the number of bands produced per primer and their size range are presented in Table 2. Smeared and faint bands were not considered for the analysis of any of the species.
For Allium iatrouinum, 6 primers produced 47 unambiguous bands (34 out of 47 were polymorphic). Number of bands per primer ranged from 6 (UBC 841) to 10 (UBC 810) with an average count of 7.8 bands per primer. The bands’ size ranged from 306 to 2344 bp.
For Saponaria jagelii, 8 primers produced 58 unambiguous bands (30 of them were polymorphic). Number of bands per primer ranged between 4 (UBC 807) and 11 (UBC 841) with an average count of 7.3 bands per primer and their size ranged from 200 to 2350 bp.
For Convolvulus argyrothamnos, we used 13 primers since, due to the small sample size, we increased the number of markers in order to have a better estimation of the species’ genetic diversity. Fifty-three bands were polymorphic out of a total of 91 bands produced. The bands per primer ranged from 2 to 15, with an average count of 8.3 bands per primer. The bands’ size ranged from 153 to 1618 bp.
For Aethionema retsina, 8 primers produced 31 bands (20 of them polymorphic). Number of bands per primer ranged between 3 (UBC 880 and 815) and 8 (UBC 841) with an average count of 4.4 bands per primer. The bands’ size ranged from 166 to 1835 bp.
3.2. Genetic Diversity
Allium iatrouinum showed higher levels (Table 3) of genetic diversity (mean heterozygosity levels of 0.3, average number of observed alleles 1.7, allelic diversity 1.5, and 72.3% polymorphic bands) compared to the remaining species. Convolvulus argyrothamnos and Aethionema retsina showed similar levels of genetic diversity (Table 3) with mean heterozygosity level at 0.24, average number of observed alleles at about 1.6, and 58–64% polymorphic bands. We stress that these results should be treated with caution due to the small sample size. Finally, the lowest levels of genetic diversity were recorded for Saponaria jagelii (Table 3) with mean heterozygosity level at 0.2, average number of observed alleles at about 1.5, and 51.7% polymorphic bands.

Table 3.
Genetic diversity averaged for all the ISSR markers used per species. NoB: number of bands. na: number of alleles. ne: effective number of alleles. h: Nei’s gene diversity. I: Shannon’s information index. PPB: percentage polymorphism bands. He: expected heterozygosity. uHe: unbiased expected heterozygosity.
3.3. Species Distribution Modelling
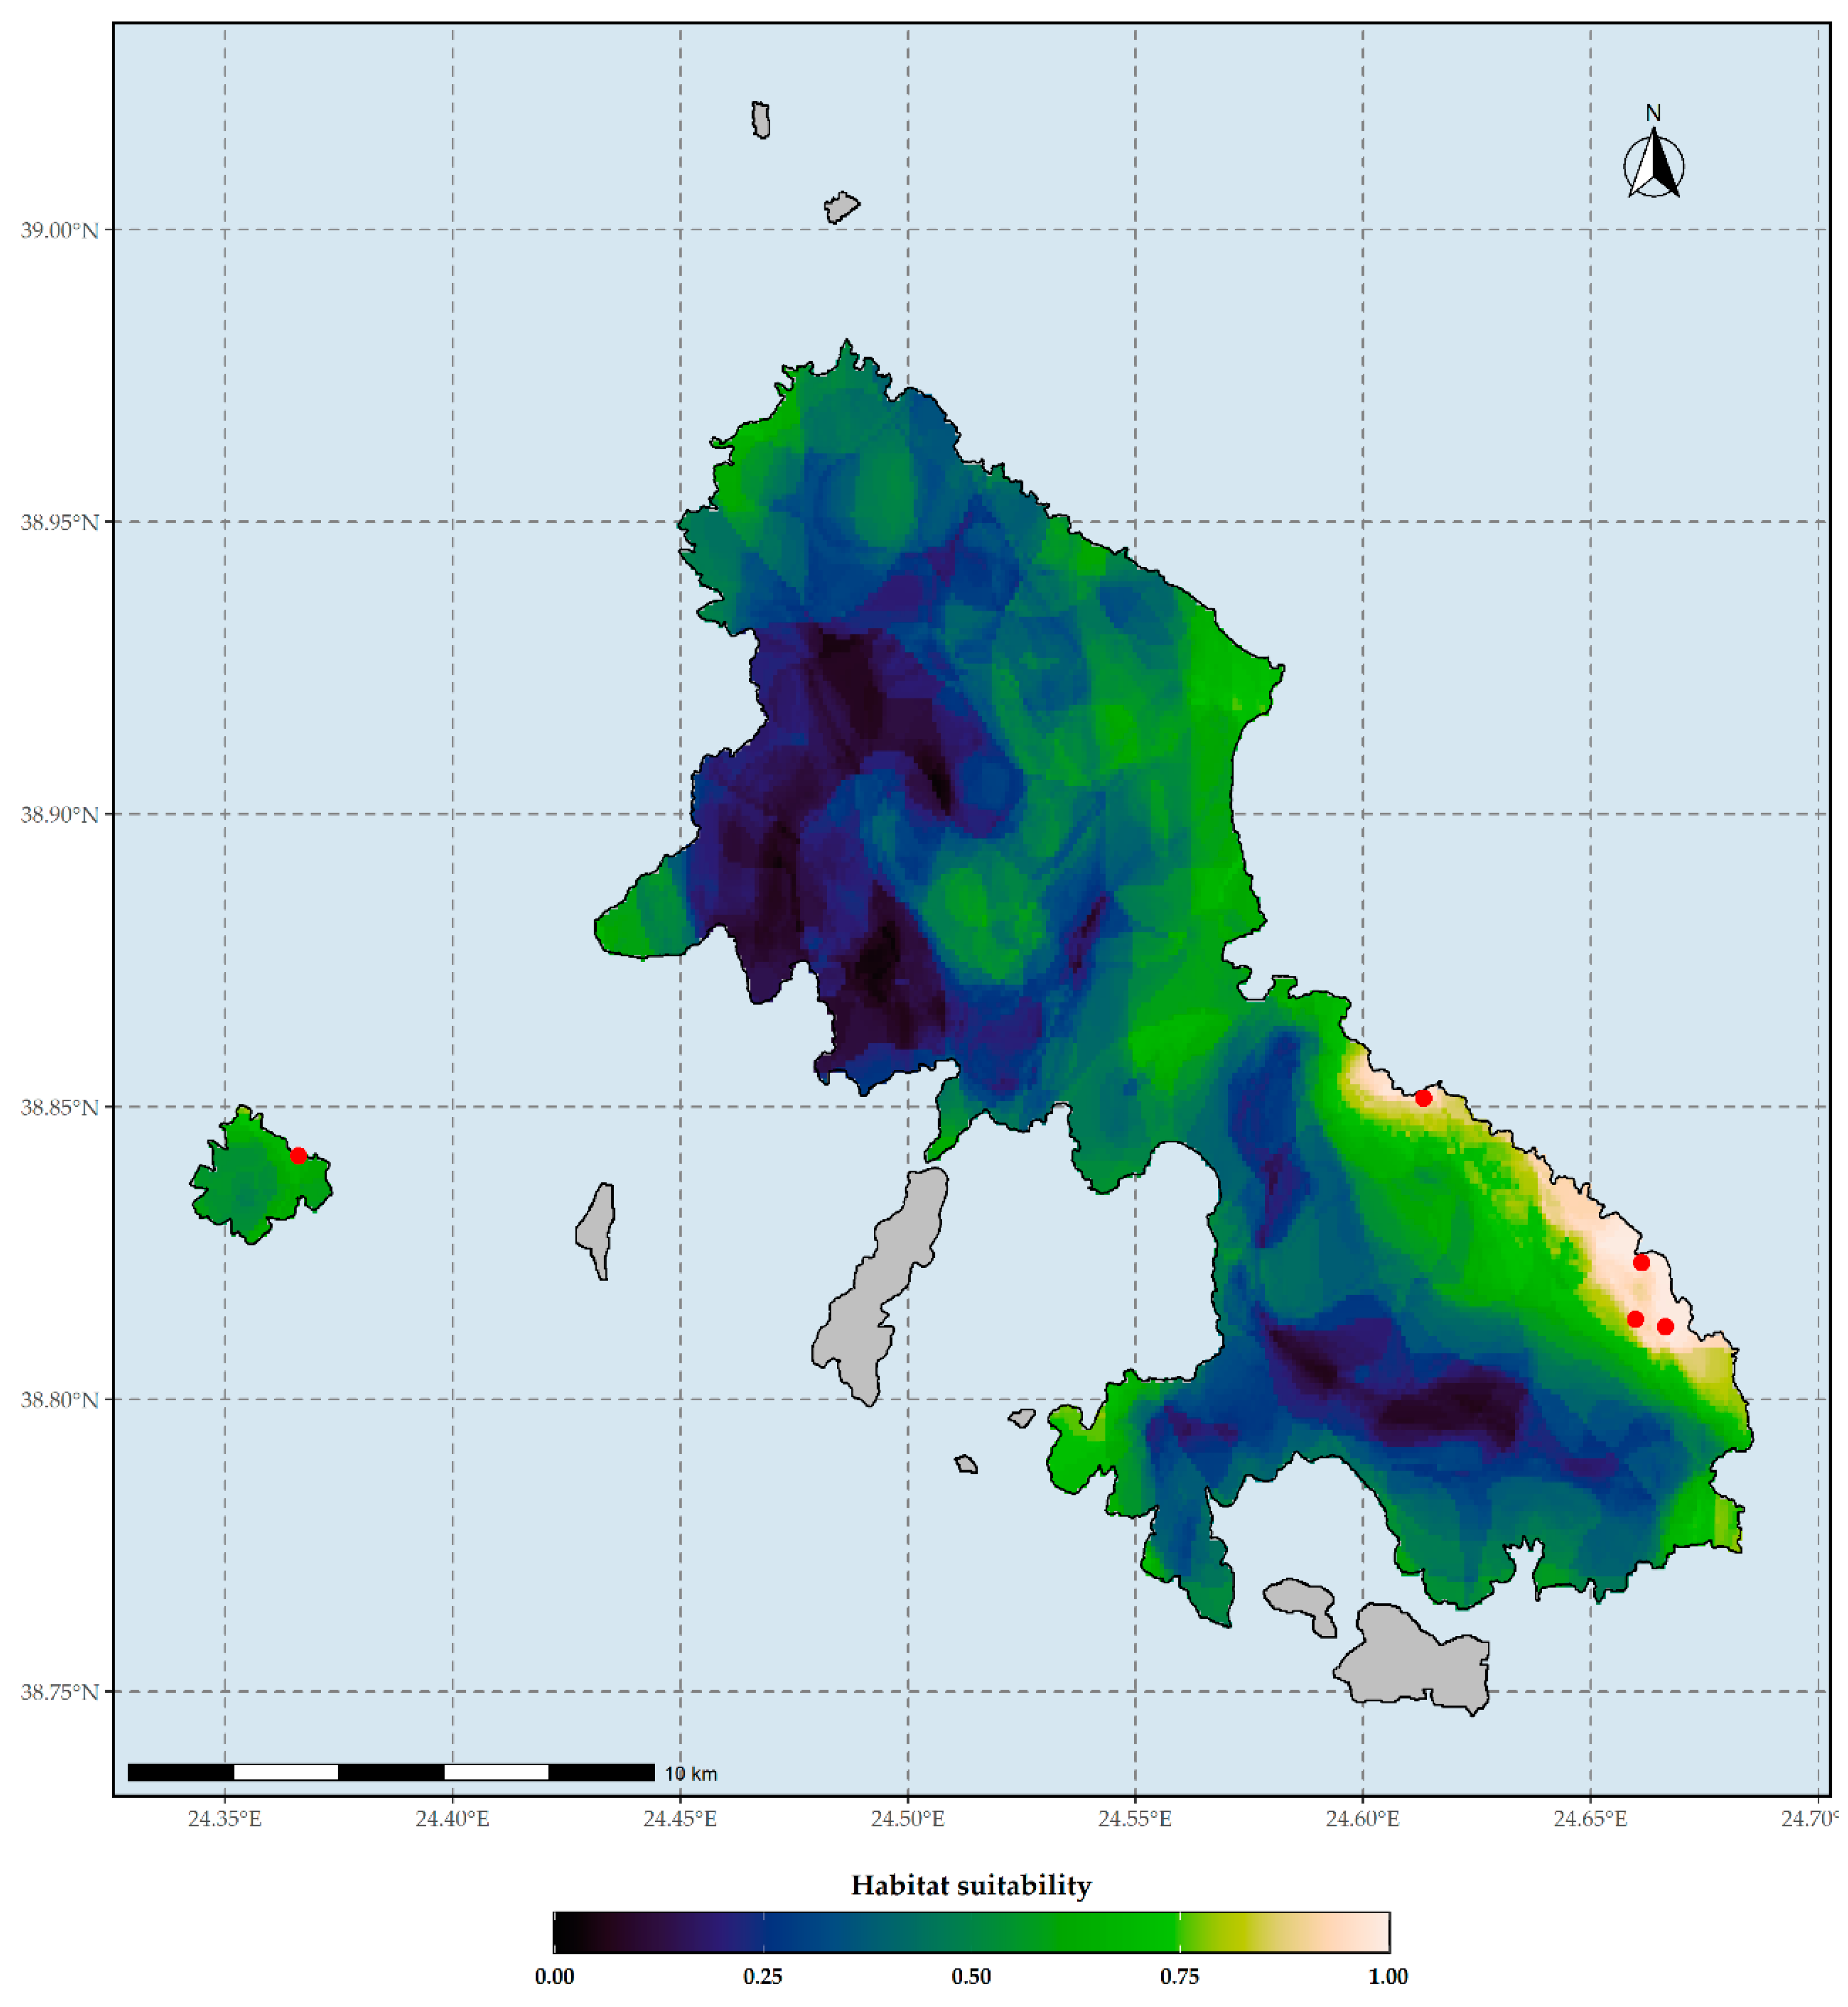
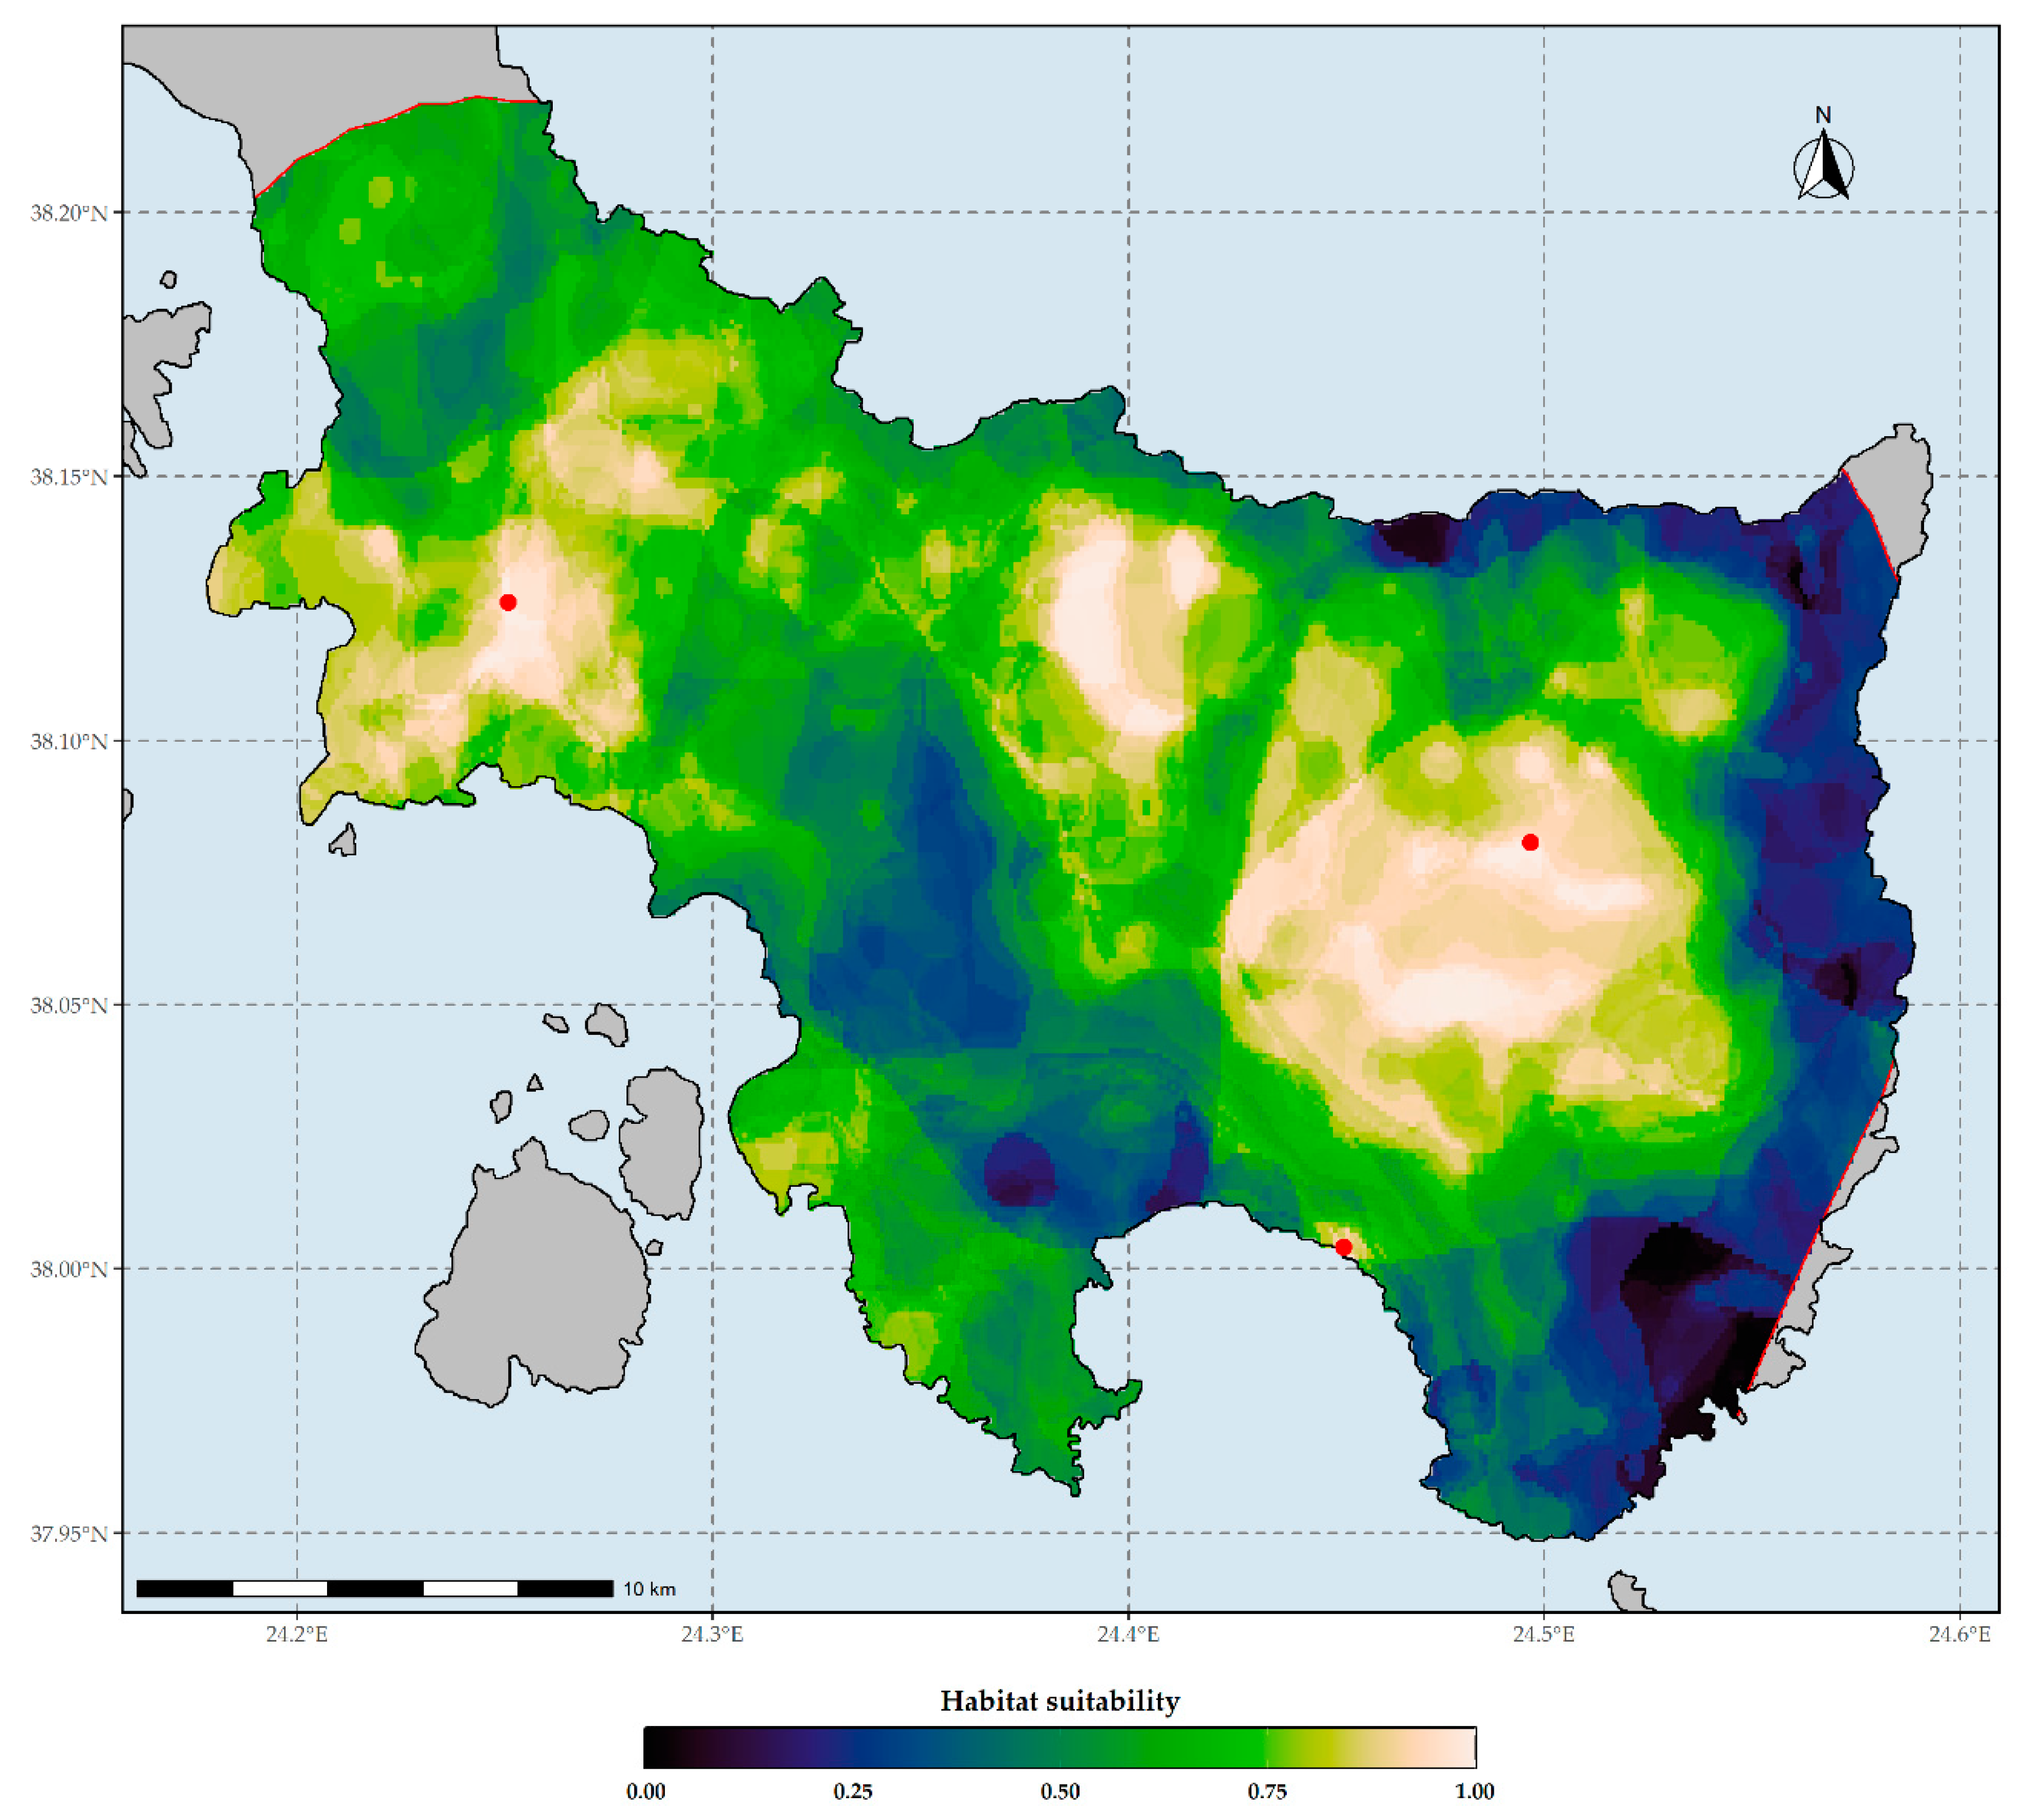
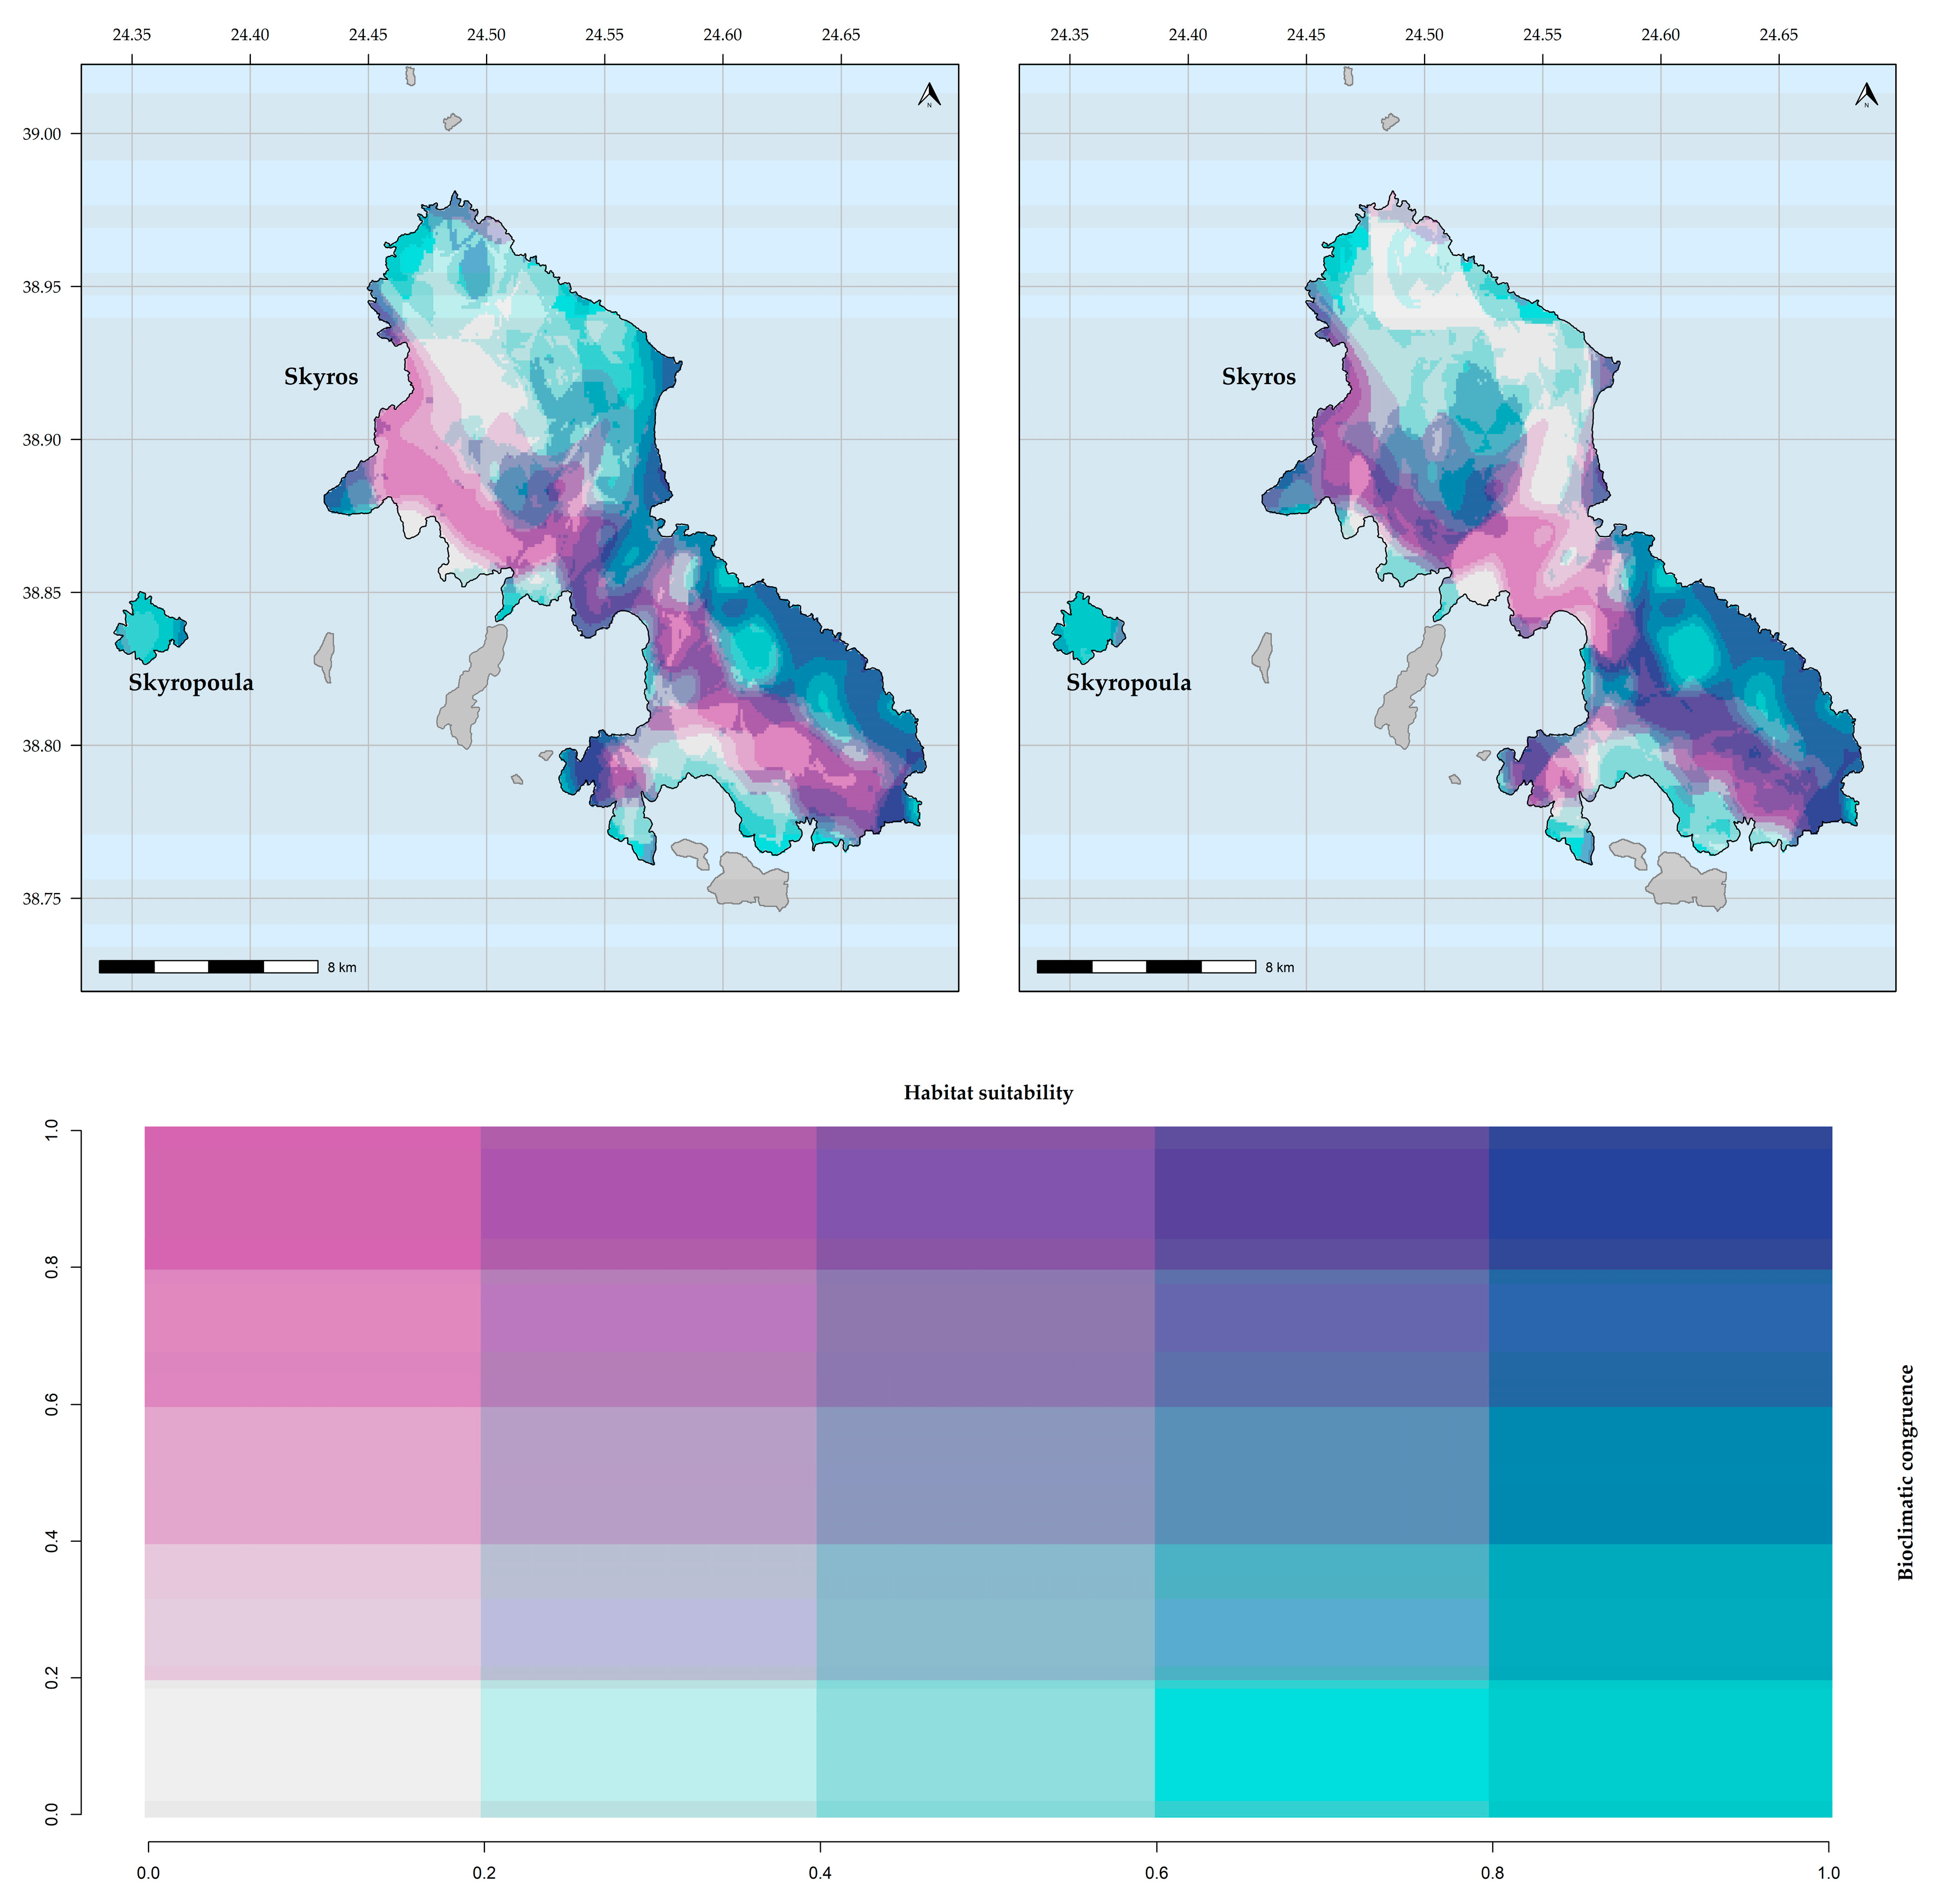
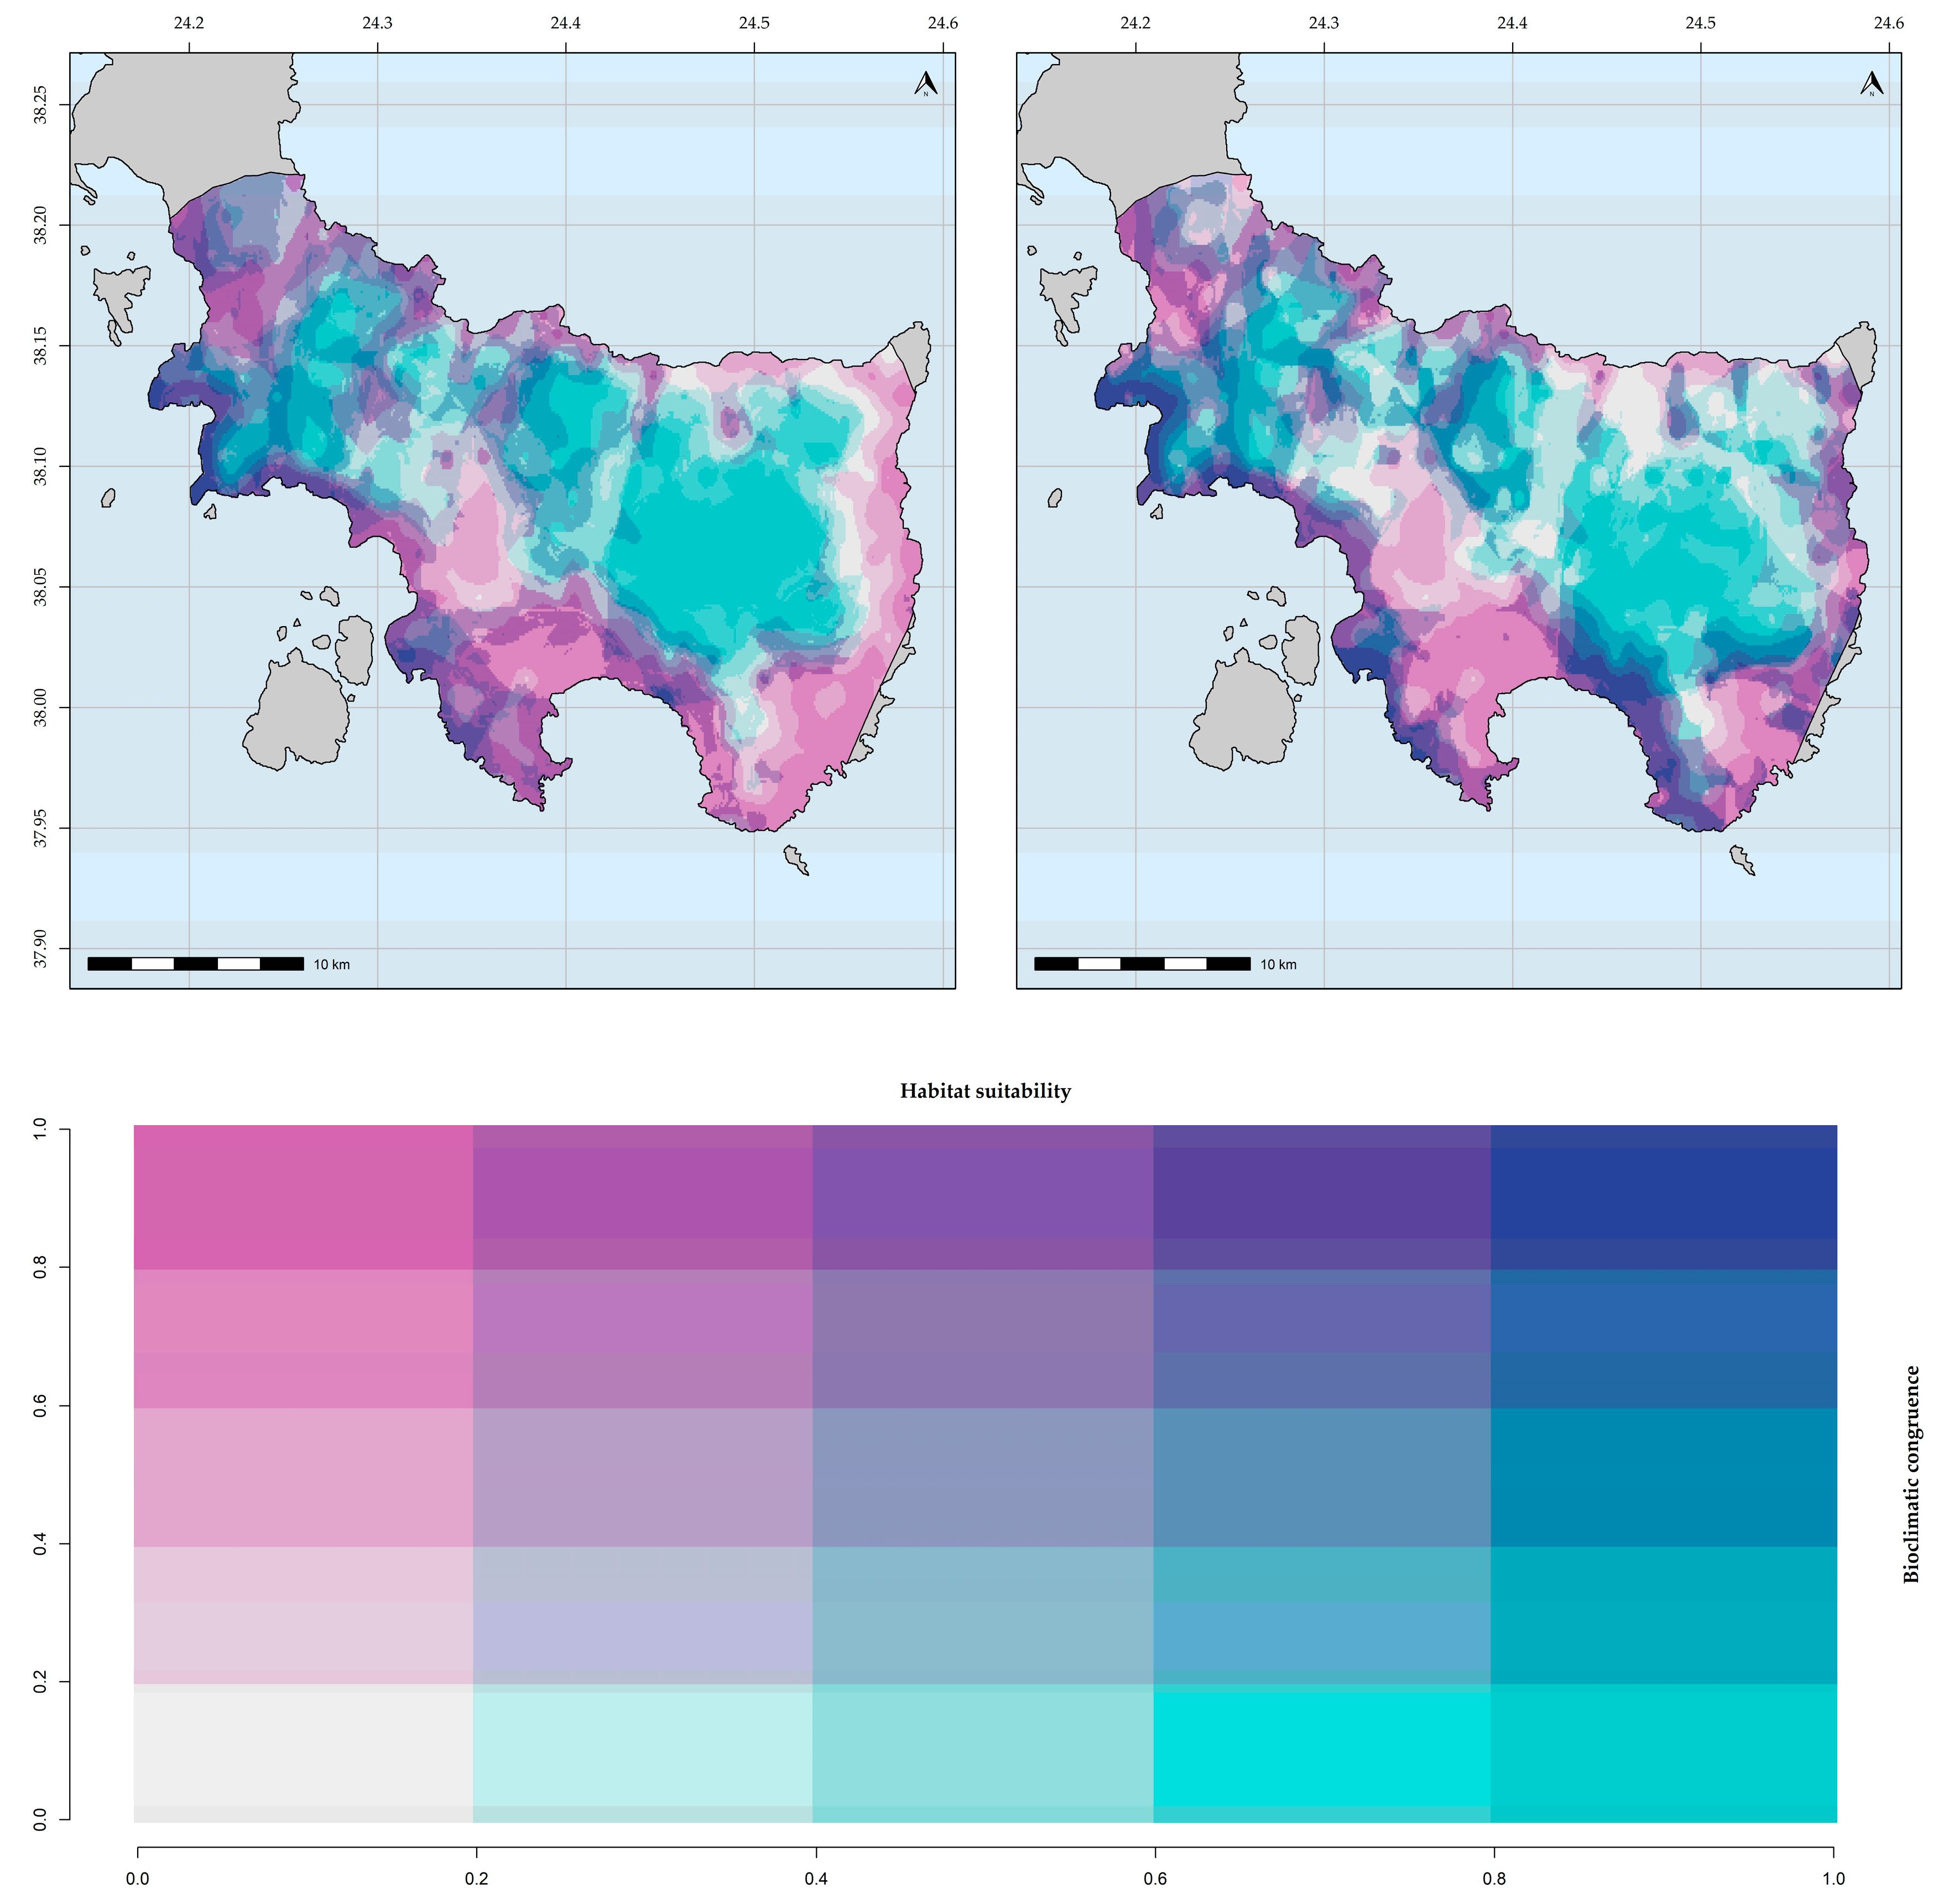
The ESM predictions had very good predictive power (TSS ≥ 0.99). Intra-climate database variation was not statistically significant for both taxa (KWA: H = 3.02, d.f. = 1, p = 1). Topographical variables had the highest contribution among the response variables for Aethionema retsina and Allium iatrouinum for both climate databases, followed by soil-related and bioclimatic variables for Aethionema retsina and Allium iatrouinum, respectively (Table 4). The resulting habitat suitability maps (Figure 2 and Figure 3 (WorldClim) and Figures S1 and S2 (CHELSA)) had high bioclimatic consistency (Figure 4 and Figure 5). They were converted into binary maps and subsequently compared to the binary maps obtained for each GCM, RCP scenario, and climate database. Since the trends for the future potential distribution of Aethionema retsina and Allium iatrouinum were identical across all sources of uncertainty, we present only the area range change for the WorldClim database and the CCSM4 GCM and the RCP 2.6 scenario for both taxa.

Table 4.
Variable importance for the top 10 variables of models based on WorldClim (WC) and CHELSA (CH) climate databases for Aethionema retsina and Allium iatrouinum. HLI: heat load index. TPI: topographical position index. CLP: proportion of clay particles. CRF: volumetric fraction of coarse fragments. CEC: cation exchange capacity of the soil. ORC: organic carbon density. SLT: proportion of silt particles. AIT: Thornthwaite’s aridity index. CNT: continentality. ISO: isothermality. MDR: mean diurnal range. PET: mean annual evapotranspiration. PETCOLD: mean evapotranspiration of the coldest quarter. PETDRY: mean evapotranspiration of the driest quarter. PS: precipitation seasonality. Temp: count of the number of months with mean temp greater than 10 ℃.
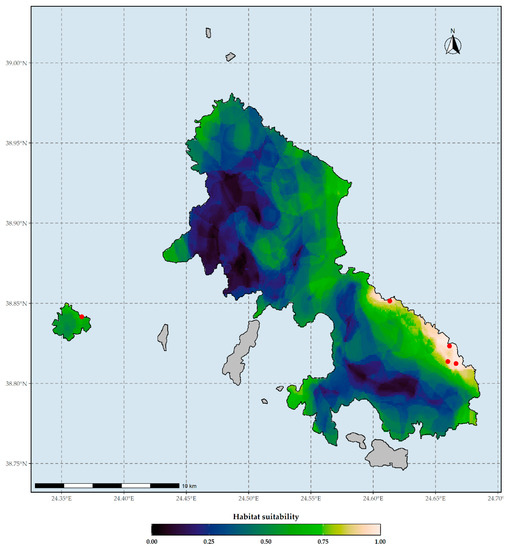
Figure 2.
Habitat suitability map of Aethionema retsina under current climate conditions based on the WorldClim climate database. Red dots indicate the occurrences of Aethionema retsina in Skyros and Skyropoula. Threshold for binarization: 0.998.
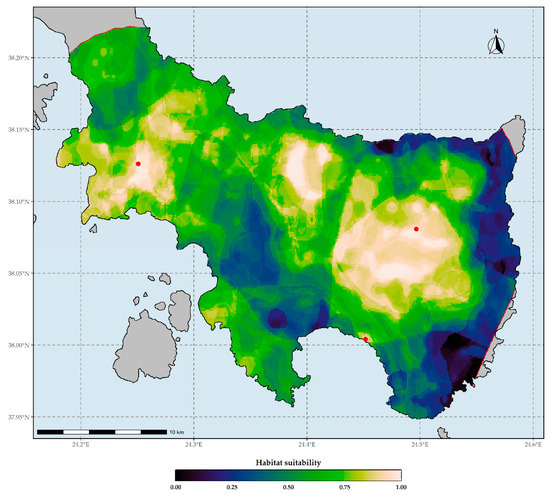
Figure 3.
Habitat suitability map of Allium iatrouinum under current climate conditions based on the WorldClim climate database. Red dots indicate the occurrences of Allium iatrouinum in southern Evvia. The red lines delineate the potential distribution are of Allium iatrouinum based on the alpha-hull method. Threshold for binarization: 0.999.
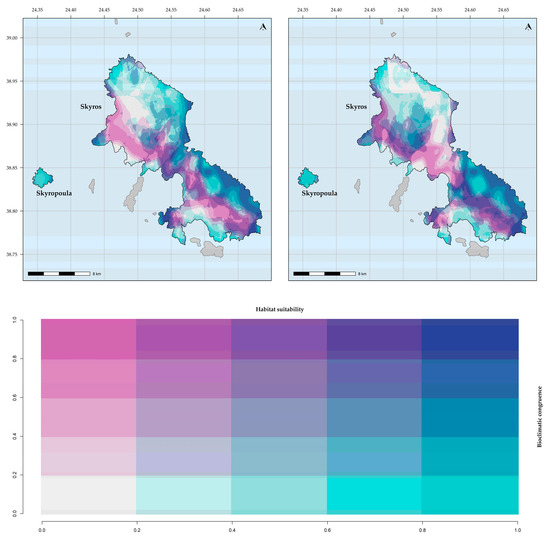
Figure 4.
Bioclimatic consistency maps for Aethionema retsina. From left to right: based on WorldClim; based on CHELSA.
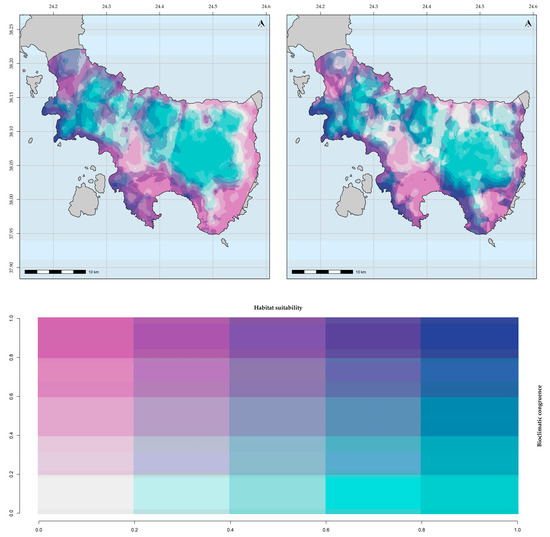
Figure 5.
Bioclimatic consistency maps for Allium iatrouinum. From left to right: based on WorldClim; based on CHELSA.
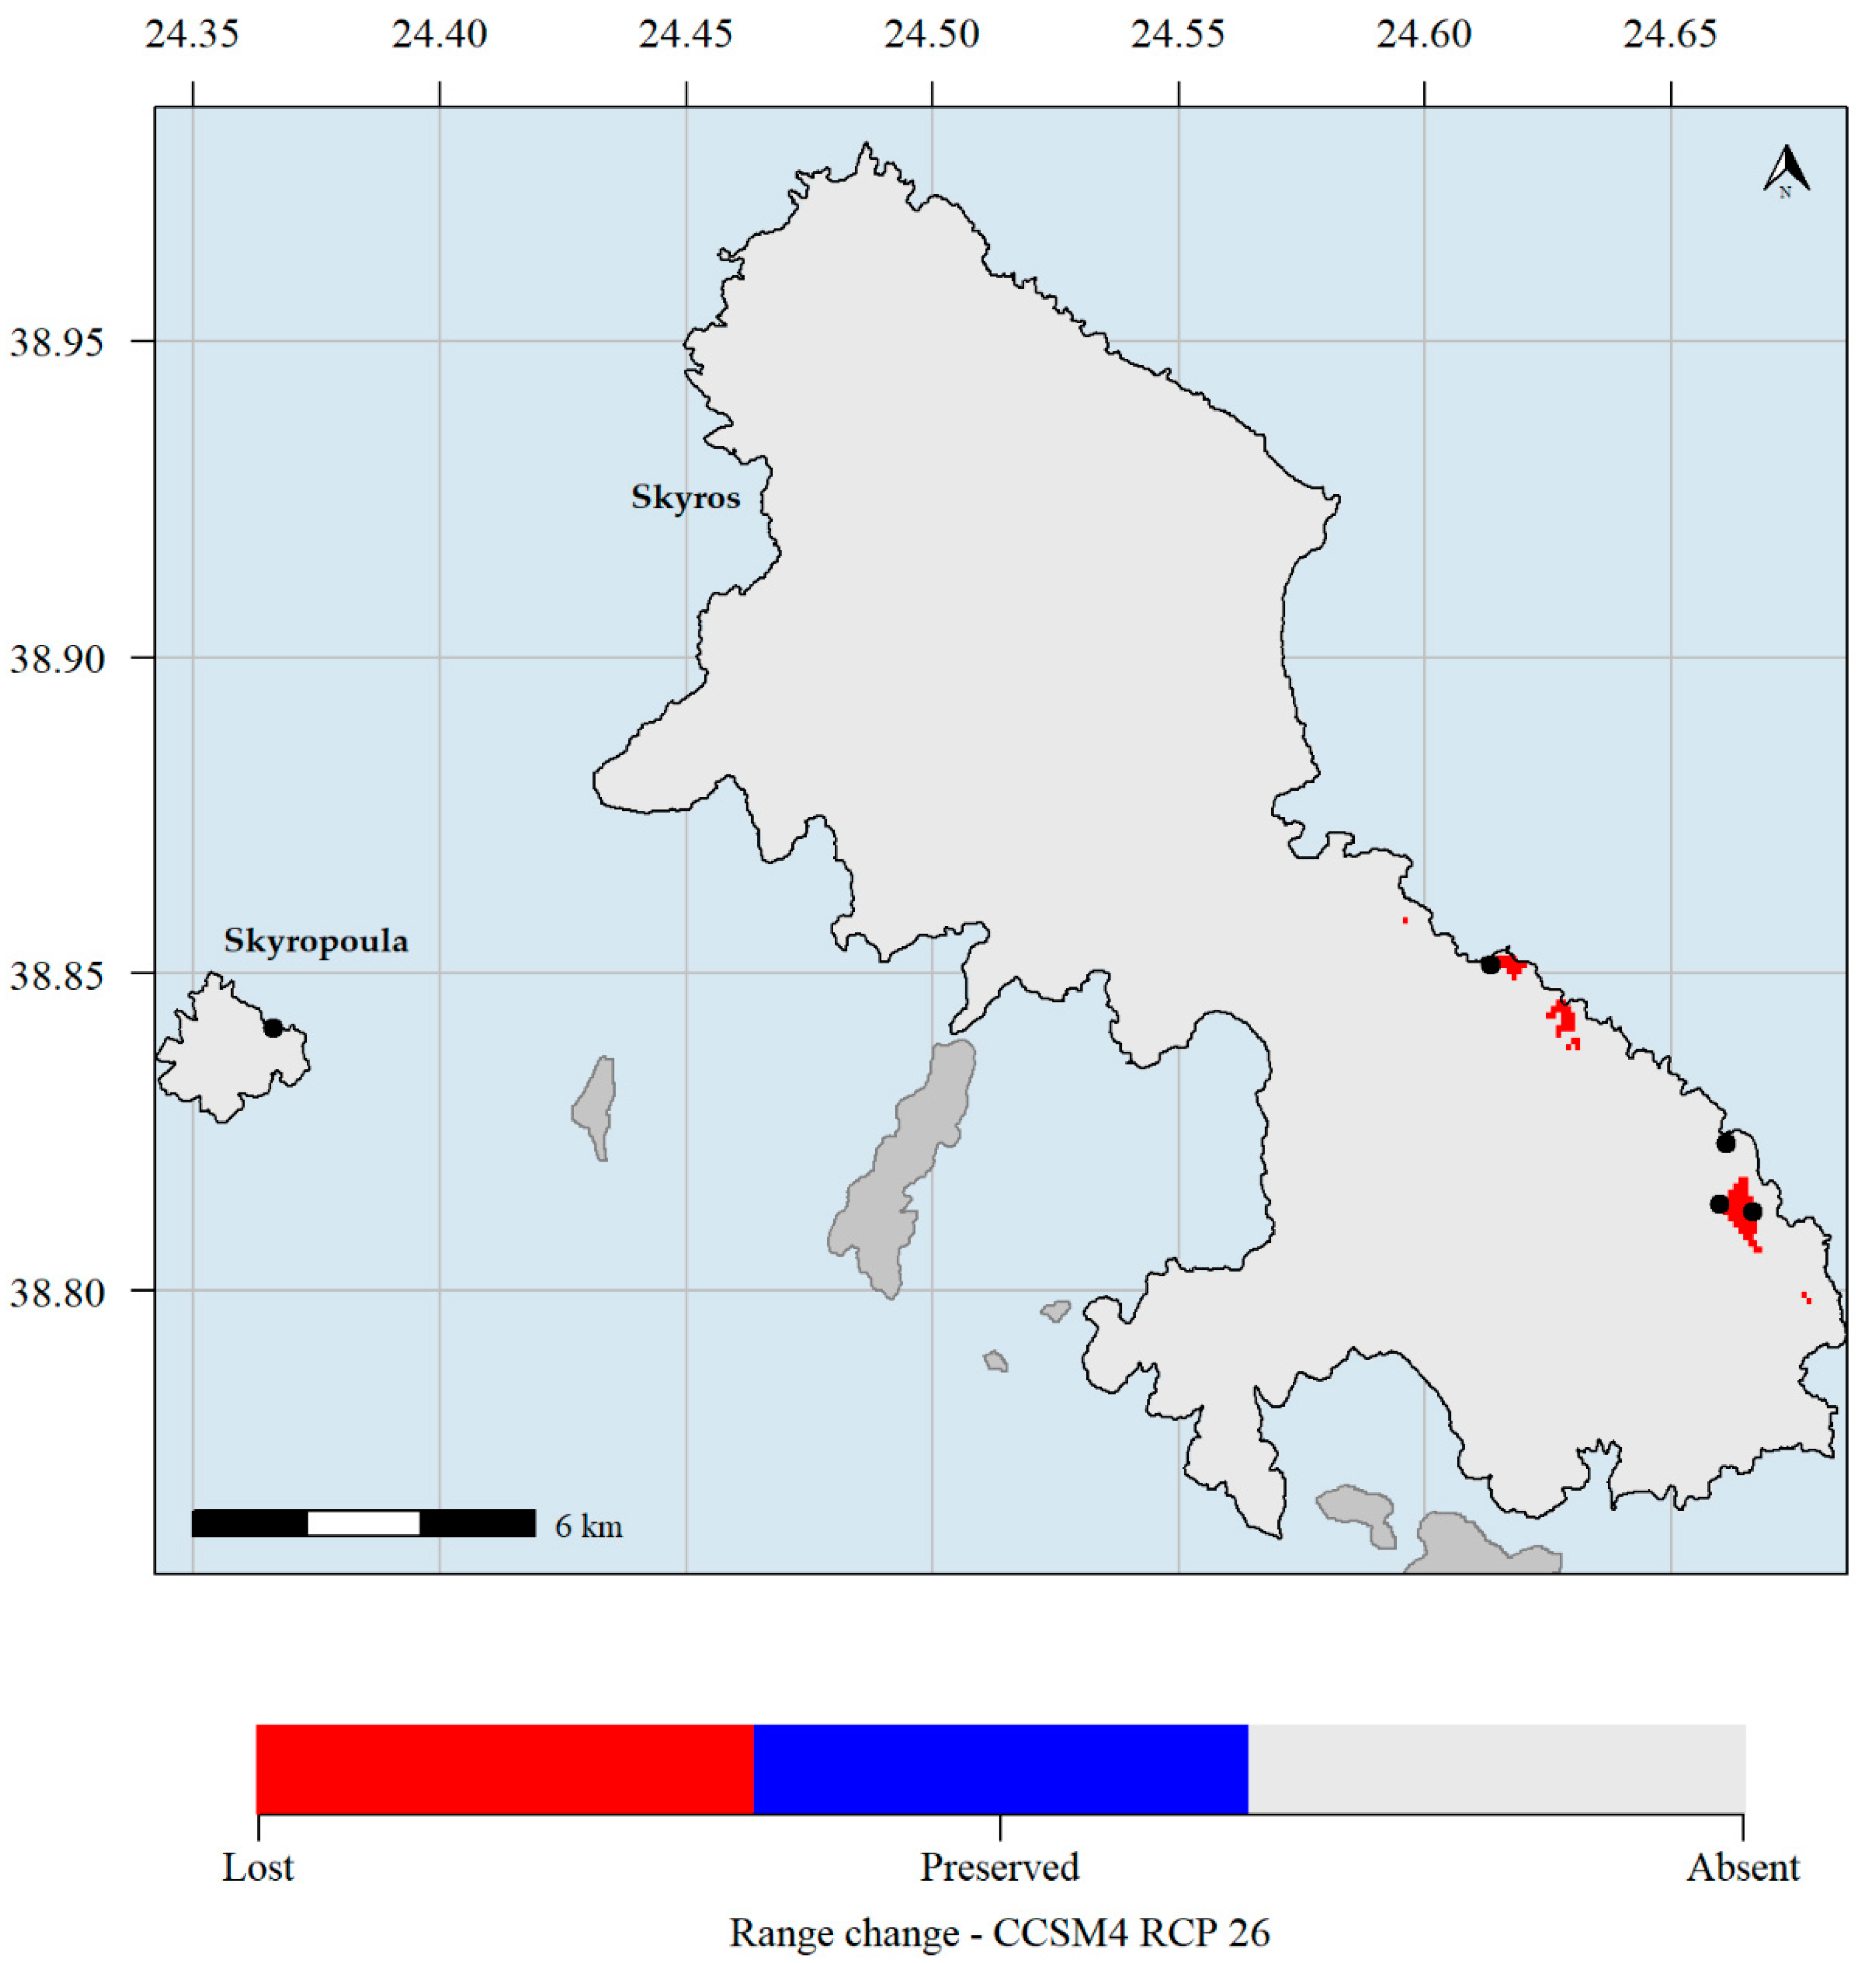
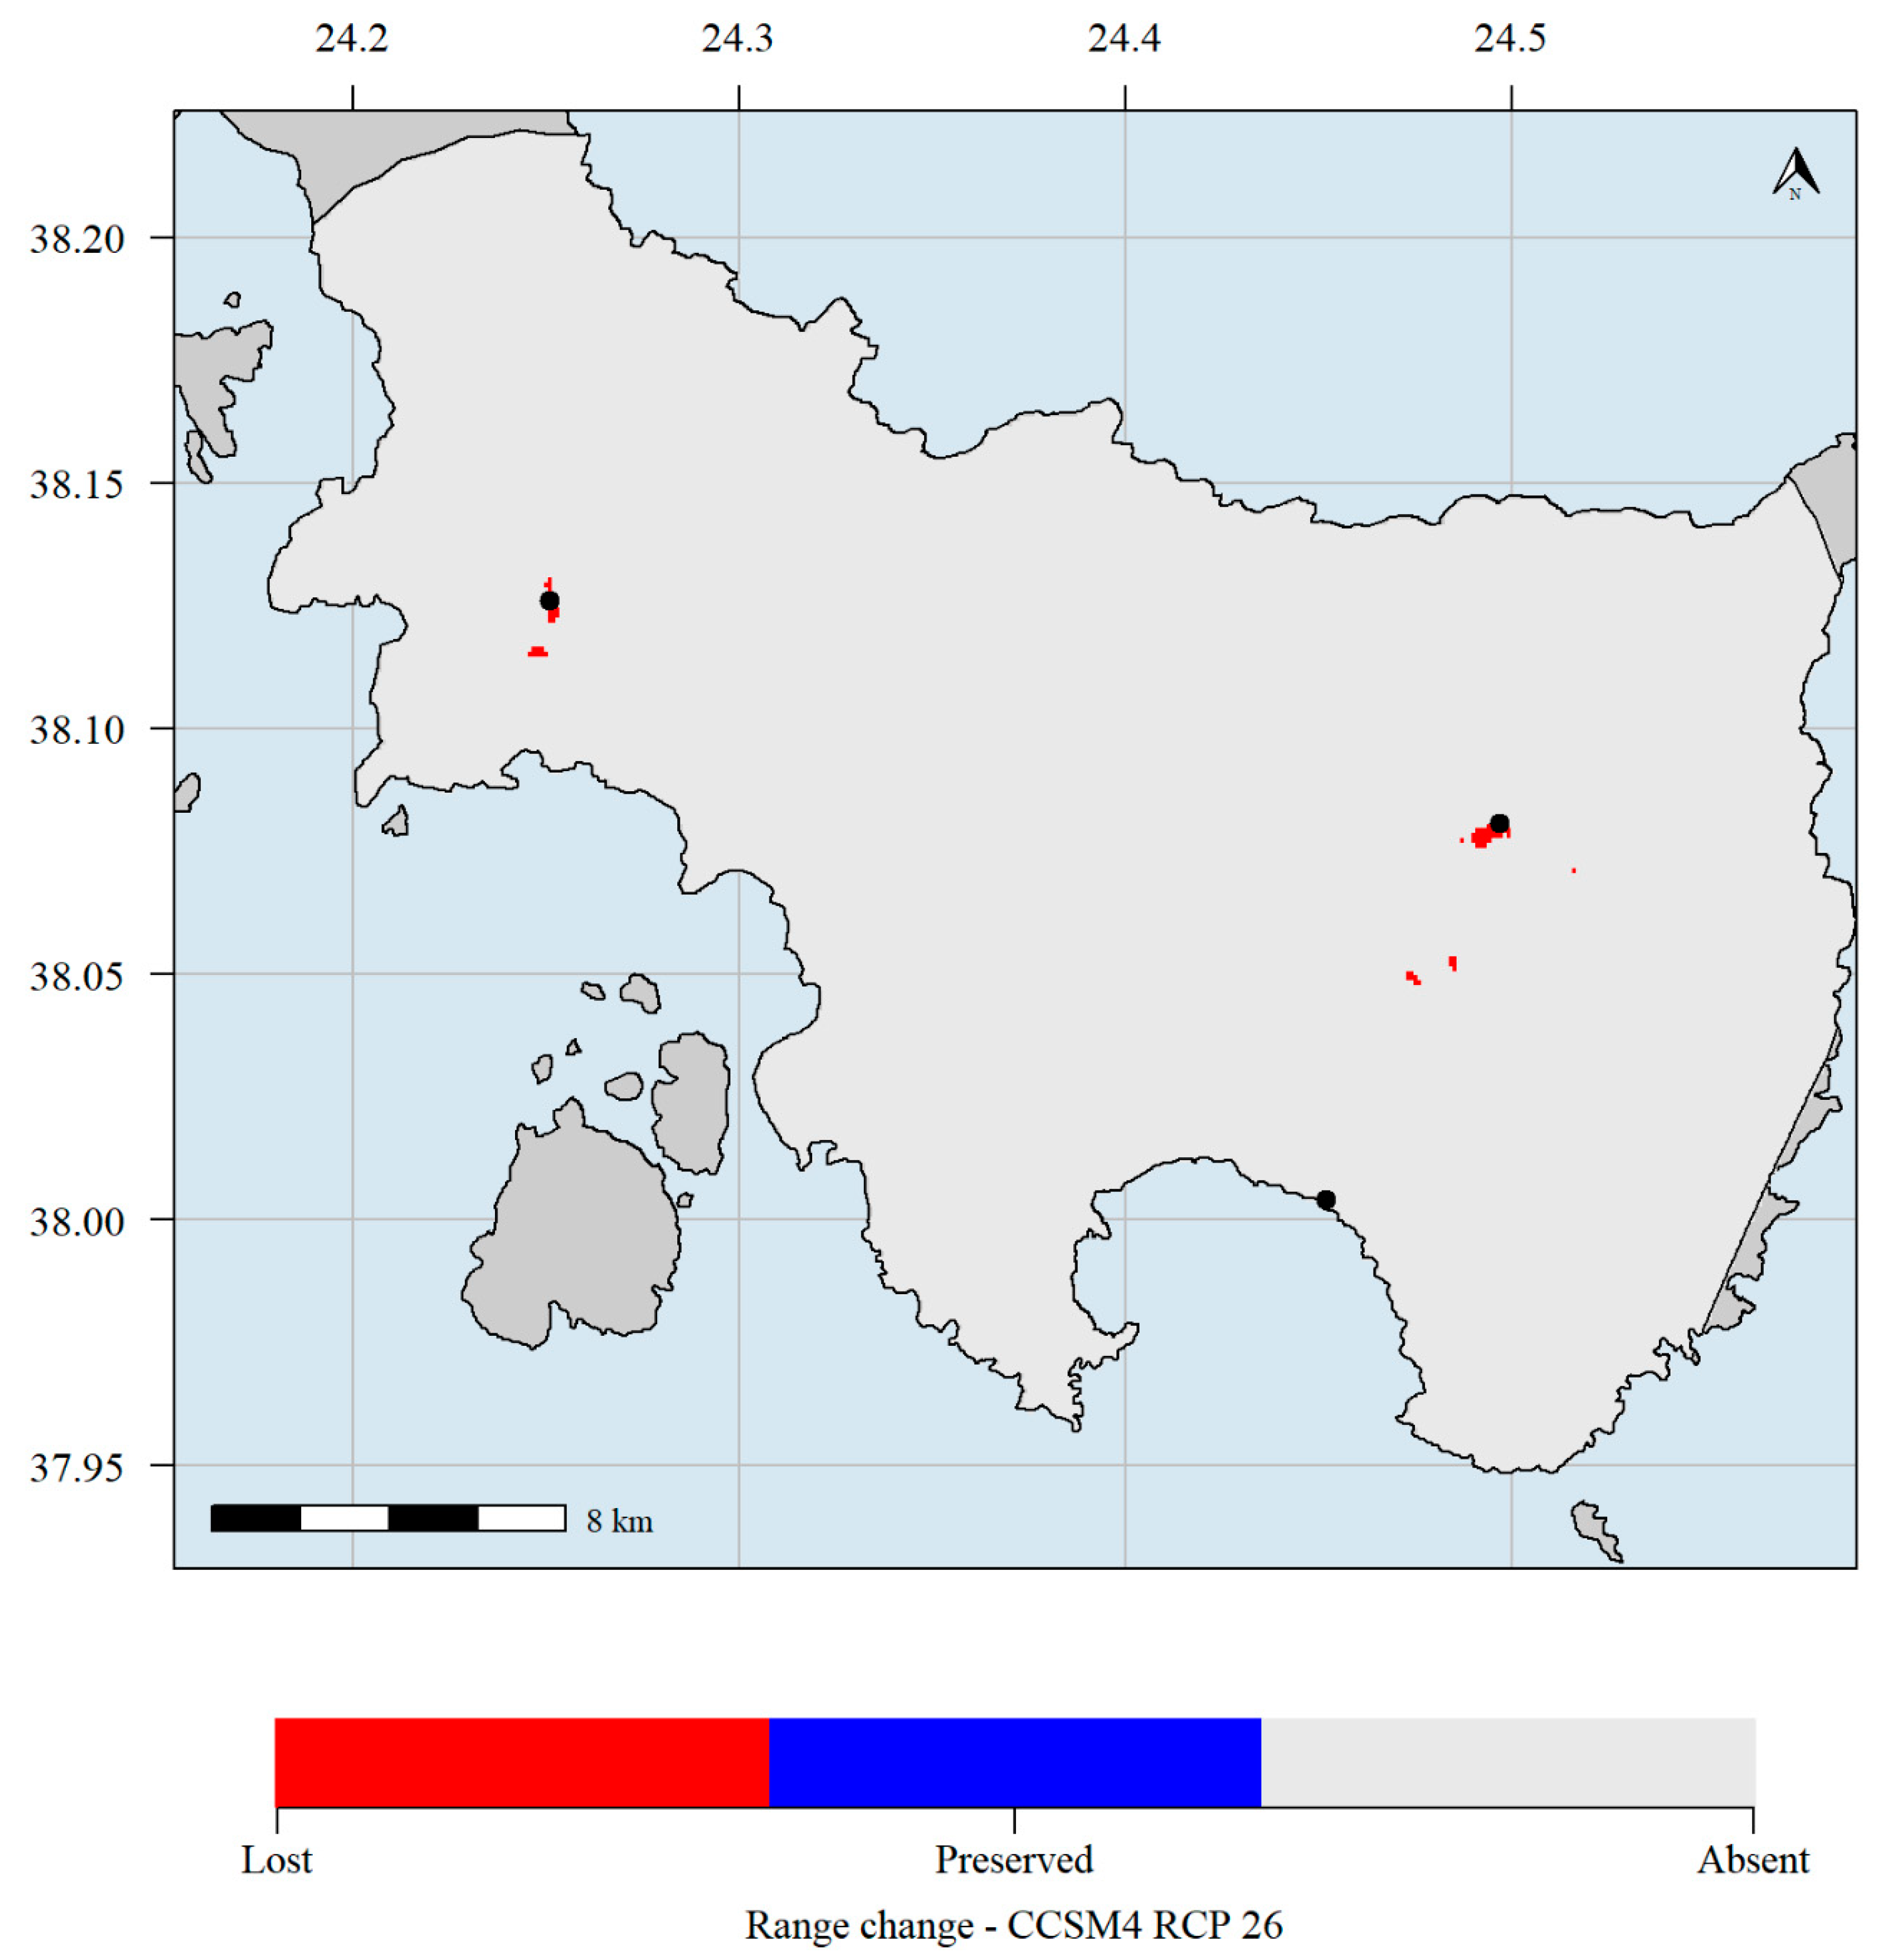
Our results indicate that, by 2070, Aethionema retsina and Allium iatrouinum will experience severe range contraction any GCM/RCP/climate database combination (Figure 6 and Figure 7 (WorldClim) and Figures S3–S22 (WorldClim and CHELSA)), since the median range contraction is 100.00%.
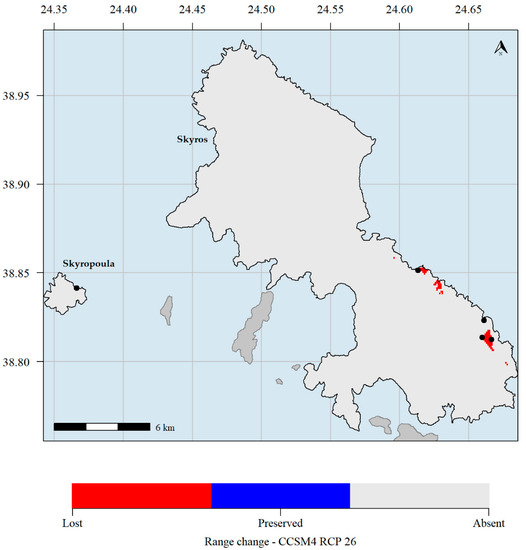
Figure 6.
Predicted potential distribution map for 2070 and the CCSM4 global circulation models (GCM) and the representative concentration pathways (RCP) 2.6 scenario. Red grid cells: Aethionema retsina is currently predicted to occupy these areas but will not occupy them in the future. Blue grid cells: Aethionema retsina is currently predicted to occupy these areas and will continue to occupy them in the future. Light grey grid cells: Aethionema retsina is not currently predicted to occupy these areas and it is not predicted to occupy them in the future. Black dots indicate the occurrences of Aethionema retsina in Skyros and Skyropoula. Climate data refer to the WorldClim database. Please note that the black dots in Skyropoula and south-eastern Skyros hide the red cells where the species is predicted to currently occupy.
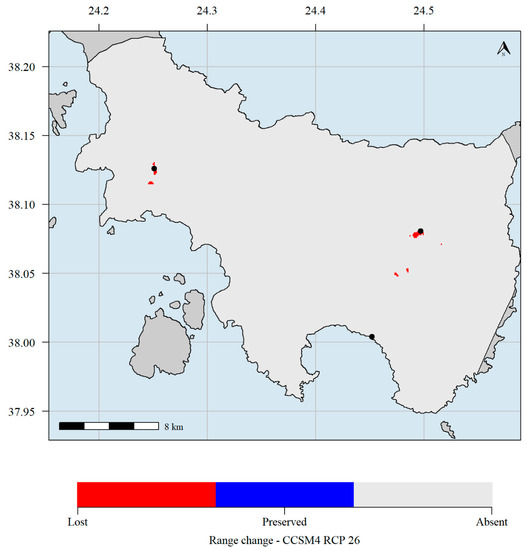
Figure 7.
Predicted potential distribution map for 2070 and the CCSM4 GCM and the RCP 2.6 scenario. Red grid cells: Allium iatrouinum is currently predicted to occupy these areas but will not occupy them in the future. Blue grid cells: Allium iatrouinum is currently predicted to occupy these areas and will continue to occupy them in the future. Light grey grid cells: Allium iatrouinum is not currently predicted to occupy these areas and it is not predicted to occupy them in the future. Black dots indicate the occurrences of Allium iatrouinum in Evvia. Climate data refer to the WorldClim database. Please note that the black dot in southern Evvia hides the red cell where the species is predicted to currently occupy.
4. Discussion
4.1. Genetic Diversity
By using ISSR markers, we were able to provide a first rough estimate of the genetic diversity patterns of four extremely rare and highly endangered Greek endemic plant taxa. All four of the studied taxa display moderate to high genetic diversity (uHe: 0.254–0.322; Table 3) compared to other plant taxa of conservation concern from the Mediterranean basin [32,33] or other parts of the world (e.g., the taxa mentioned in Table 3 by [96]) but within the range reported from other threatened plant taxa using ISSRs [33,41] (uHe: 0.029–0.400). Perennials usually are more genetically diverse than annuals ([97] and references therein), while plants occurring on islands and in dry climates often exhibit higher levels of genetic diversity [97]. This is in line with our results, since Aethionema retsina, Allium iatrouinum, and Convolvulus argyrothamnos showed higher genetic diversity than Saponaria jagelii. This could be also attributed to the higher extinction debt perennial species are generally displaying [98], as these species respond at a much slower pace to extrinsic disturbances [99,100,101] and thus to reduced population size and gene flow [97]. Consequently, the moderately high genetic diversity reported herein for all four studied taxa might actually be a delayed response to historical events and anthropogenic pressures and could indicate that the studied species’ genetic diversity is at a pre-fragmentation state, a phenomenon observed in other parts of the world as well [102,103,104,105]. The moderately high genetic diversity of the study species seems to align as well with the trend recently observed in insular endemics from several (continental or oceanic) archipelagos displaying relatively high genetic diversity ([106] and references therein). It is worth noting that all four species are found in areas that have been identified as endemism centres [107]. Convolvulus argyrothamnos—a species endemic in Crete, the largest and most environmentally heterogeneous Greek island—occurs in a paleo-endemism hotspot [107], which implies that it might have had ample time and opportunities to accumulate genetic diversity [108]. As for Allium iatrouinum, which shows the second highest level of genetic diversity within the species studied here and similar to that reported for other palaeoendemic taxa occurring in the Mediterranean basin and elsewhere [40,96,109], this could be attributed to the fact that it belongs to a species group highly diversified in the Mediterranean, and its origin probably dates back in the Messinian [56].
The genetic diversity of Aethionema retsina and Convolvulus argyrothamnos is similar to that expected for long-lived perennials (uHe: 0.25; [110]) and other extremely narrow Mediterranean endemics [33,111,112]. The same is true for Saponaria jagelii, which has an uHe value close to what [110] reports for endemic species and within the range of other extremely narrow Mediterranean endemics [33,111,112]; the uHe value for Allium iatrouinum falls within the upper quartile of other extremely narrow Mediterranean endemics [33]. Besides, a narrow geographical range does not necessarily equate to low genetic diversity, since many narrow endemic plant taxa display moderate to high genetic diversity [112]. When comparing the genetic diversity of Aethionema retsina, Allium iatrouinum, Convolvulus argyrothamnos, and Saponaria jagelii to the genetic diversity of Centaurea heldreichii and Minuartia dirphya, the only CR Greek endemic species that have been assessed at the European level and for which genetic data are available, Aethionema retsina, Allium iatrouinum, Convolvulus argyrothamnos, and Saponaria jagelii, are less genetically diverse only relatively to Centaurea heldreichii. The latter taxon’s high genetic diversity is attributed to increased gene flow and introgression during the quaternary stadials and interstadials [37] and might also be due to its substantially larger population size (up to 8000 individuals) apropos to all the other taxa mentioned here.
4.2. Climate Change Impacts and Conservation Implications
Small population size and low to moderate genetic diversity are often linked to reduced fitness (e.g., [113,114]), meaning that the species in question will likely be unable to adapt to novel environmental conditions and track its niche [115]. This of course depends on the species’ life-cycle and other species-specific traits, but in the Anthropocene [29], an era of rapid climate-change and land-use change, extinction rates and risk have been accelerating throughout the Tree of Life all over the globe [23,25,27,116,117,118,119]. This is even more eminent in narrow-ranged endemic species with strict ecological requirements that suffer from habitat loss and increased anthropogenic pressures [120], such as the ones studied here. Both Aethionema retsina and Allium iatrouinum are predicted to experience severe range decline in the next decades and will be faced with an extremely high extinction risk, irrespective of GCM, RCP and climate databases examined, as their distribution is largely affected by precipitation seasonality and temperature (Allium iatrouinum and Aethionema retsina, respectively). Our projections suppose that the soil variables will remain constant (as there are not publicly available data regarding the future soil characteristics at global, European, or national levels). This will hardly be the case, since climate change will undoubtedly alter the soil characteristics in the future, especially in the Mediterranean, where summer soil moisture is projected to significantly decrease [121,122,123,124]. This means that our projections are rather conservative in their nature and most probably our study species will be facing even harsher conditions the next decades. This in line with the projections for many other Greek endemics, regardless of their geographical range [41,46]. Even though plants are quite resilient to extinction pressures [98], most known plants assessed under the IUCN criteria are facing a greater extinction risk [30] due to a variety of extrinsic and intrinsic factors, with climate change and land-use change (via habitat degradation/destruction) being the most prominent ones (e.g., [31,125]). However, even threatened taxa may not become extinct due to environmental change before their genetic diversity is seriously depleted due to inbreeding depression [114]. Hence, since the studied taxa displayed heterozygosity values resembling those of mixed or outcrossing reproductive species (uHe: 0.213–0.331; uHe for mixed reproductive species: 0.18; uHe for outcrossing species: 0.27; [110]), they seem to have low to moderate inbreeding. This might give them a fighting chance against climate change if they are not faced simultaneously with habitat degradation (as in the case of Allium iatrouinum) and other human-induced threats, such as overgrazing, trampling, and increased touristic activity. Unfortunately, the intensity and the level of threat all these species are currently facing render their unassisted probability of long-term survival quite pessimistic; the locus classicus of Allium iatrouinum has been completely destroyed, the sites where Aethionema retsina occurs are subject to overgrazing, and Saponaria jagelii is found in rapidly urbanizing localities with accentuated seasonal touristic activities. Convolvulus argyrothamnos seems to be at a slightly better state as a result mainly of the inaccessibility of most of its individuals, but this does not mean that it is not showing signs of increased conservation concern (e.g., small population size, low genetic diversity). For all the above reasons, it might be prudent to take some steps towards an efficient ex- and in-situ conservation management plan of all of these species by, e.g., collecting and depositing seeds in a seed bank, collecting germplasm, promoting population reinforcement through artificial breeding, and establishing a micro-reserve, which has been shown to be a cost-effective conservation measure in Greece and elsewhere [58,126,127,128].
4.3. Caveats-Concluding Remarks
The low population size and the inaccessibility of the studied taxa limited the sample size we used in this study, especially for Aethionema retsina and Convolvulus argyrothamnos, even though, in all cases, we used up to three times more ISSR markers than all relevant studies conducted for similar taxa in the Mediterranean (up to four ISSR markers [33]). We acknowledge this limitation and, as such, our results should be regarded as informative and preliminary rather than conclusive. This adversity could be overcome by using other type of markers, such as single-nucleotide polymorphism (SNP) markers that are more suitable in deciphering genetic diversity patterns for small populations [129]. Nevertheless, our results constitute a significant contribution to the field of threatened plants’ conservation genetics in the Eastern Mediterranean, since data regarding the genetic diversity of only seven threatened and extremely narrow endemics of either Turkey or Greece, two of the most biodiversity-rich Mediterranean countries, were available before [33]. Despite their moderately high genetic diversity and their occurrence inside established protected areas, the future prospects of all four study species are not optimistic due to the intensity of the anthropogenic threats they are already facing, their rather low population size, their strict ecological requirements, and their narrow niche. Even small range decline due to climate change may result in the extinction of extremely locally restricted plant species in the Mediterranean. Although protected areas networks (e.g., Natura 2000 in the European Union (EU) member states) offer protection to several species against locally defined threats, such as habitat loss, it is not certain that they would be able to provide effective protection against climate change, especially for narrow-ranged species that are highly threatened (however, see [46]). As the intensity and the level of threats are projected to increase over the next decades [125], this is a call for urgent action, especially for Mediterranean countries with high national responsibilities due to their rich endemic flora, such as Greece [130].
Supplementary Materials
The following are available online at https://www.mdpi.com/article/10.3390/d13040152/s1, Figure S1: Habitat suitability map of Aethionema retsina under current climate conditions based on the CHELSA climate database. Red dots indicate the occurrences of Aethionema retsina in Skyros and Skyropoula. Figure S2: Habitat suitability map of Allium iatrouinum under current climate conditions based on the CHELSA climate database. Red dots indicate the occurrences of Allium iatrouinum in southern Evvia, Figure S3: Predicted potential distribution map for 2070 and the BCC GCM and the RCP 2.6 scenario. Red grid cells: Aethionema retsina is currently predicted to occupy these areas but will not occupy them in the future. Blue grid cells: Aethionema retsina is currently predicted to occupy these areas and will continue to occupy them in the future. Light grey grid cells: Aethionema retsina is not currently predicted to occupy these areas and it is not predicted to occupy them in the future. Black dots indicate the occurrences of Aethionema retsina in Skyros and Skyropoula. Climate data refer to the WorldClim database, Figure S4: Predicted potential distribution map for 2070 and the BCC GCM and the RCP 8.5 scenario. Red grid cells: Aethionema retsina is currently predicted to occupy these areas but will not occupy them in the future. Blue grid cells: Aethionema retsina is currently predicted to occupy these areas and will continue to occupy them in the future. Light grey grid cells: Aethionema retsina is not currently predicted to occupy these areas and it is not predicted to occupy them in the future. Black dots indicate the occurrences of Aethionema retsina in Skyros and Skyropoula. Climate data refer to the WorldClim database, Figure S5: Predicted potential distribution map for 2070 and the CCSM4 GCM and the RCP 2.6 scenario. Red grid cells: Aethionema retsina is currently predicted to occupy these areas but will not occupy them in the future. Blue grid cells: Aethionema retsina is currently predicted to occupy these areas and will continue to occupy them in the future. Light grey grid cells: Aethionema retsina is not currently predicted to occupy these areas and it is not predicted to occupy them in the future. Black dots indicate the occurrences of Aethionema retsina in Skyros and Skyropoula. Climate data refer to the WorldClim database, Figure S6: Predicted potential distribution map for 2070 and the CCSM4 GCM and the RCP 8.5 scenario. Red grid cells: Aethionema retsina is currently predicted to occupy these areas but will not occupy them in the future. Blue grid cells: Aethionema retsina is currently predicted to occupy these areas and will continue to occupy them in the future. Light grey grid cells: Aethionema retsina is not currently predicted to occupy these areas and it is not predicted to occupy them in the future. Black dots indicate the occurrences of Aethionema retsina in Skyros and Skyropoula. Climate data refer to the WorldClim database, Figure S7: Predicted potential distribution map for 2070 and the HadGEM2 GCM and the RCP 2.6 scenario. Red grid cells: Aethionema retsina is currently predicted to occupy these areas but will not occupy them in the future. Blue grid cells: Aethionema retsina is currently predicted to occupy these areas and will continue to occupy them in the future. Light grey grid cells: Aethionema retsina is not currently predicted to occupy these areas and it is not predicted to occupy them in the future. Black dots indicate the occurrences of Aethionema retsina in Skyros and Skyropoula. Climate data refer to the WorldClim database, Figure S8: Predicted potential distribution map for 2070 and the HadGEM2 GCM and the RCP 8.5 scenario. Red grid cells: Aethionema retsina is currently predicted to occupy these areas but will not occupy them in the future. Blue grid cells: Aethionema retsina is currently predicted to occupy these areas and will continue to occupy them in the future. Light grey grid cells: Aethionema retsina is not currently predicted to occupy these areas and it is not predicted to occupy them in the future. Black dots indicate the occurrences of Aethionema retsina in Skyros and Skyropoula. Climate data refer to the WorldClim database, Figure S9: Predicted potential distribution map for 2070 and the BCC GCM and the RCP 2.6 scenario. Red grid cells: Aethionema retsina is currently predicted to occupy these areas but will not occupy them in the future. Blue grid cells: Aethionema retsina is currently predicted to occupy these areas and will continue to occupy them in the future. Light grey grid cells: Aethionema retsina is not currently predicted to occupy these areas and it is not predicted to occupy them in the future. Black dots indicate the occurrences of Aethionema retsina in Skyros and Skyropoula. Climate data refer to the CHELSA database, Figure S10: Predicted potential distribution map for 2070 and the BCC GCM and the RCP 8.5 scenario. Red grid cells: Aethionema retsina is currently predicted to occupy these areas but will not occupy them in the future. Blue grid cells: Aethionema retsina is currently predicted to occupy these areas and will continue to occupy them in the future. Light grey grid cells: Aethionema retsina is not currently predicted to occupy these areas and it is not predicted to occupy them in the future. Black dots indicate the occurrences of Aethionema retsina in Skyros and Skyropoula. Climate data refer to the CHELSA database, Figure S11: Predicted potential distribution map for 2070 and the CCSM4 GCM and the RCP 2.6 scenario. Red grid cells: Aethionema retsina is currently predicted to occupy these areas but will not occupy them in the future. Blue grid cells: Aethionema retsina is currently predicted to occupy these areas and will continue to occupy them in the future. Light grey grid cells: Aethionema retsina is not currently predicted to occupy these areas and it is not predicted to occupy them in the future. Black dots indicate the occurrences of Aethionema retsina in Skyros and Skyropoula. Climate data refer to the CHELSA database, Figure S12: Predicted potential distribution map for 2070 and the CCSM4 GCM and the RCP 8.5 scenario. Red grid cells: Aethionema retsina is currently predicted to occupy these areas but will not occupy them in the future. Blue grid cells: Aethionema retsina is currently predicted to occupy these areas and will continue to occupy them in the future. Light grey grid cells: Aethionema retsina is not currently predicted to occupy these areas and it is not predicted to occupy them in the future. Black dots indicate the occurrences of Aethionema retsina in Skyros and Skyropoula. Climate data refer to the CHELSA database, Figure S13: Predicted potential distribution map for 2070 and the BCC GCM and the RCP 2.6 scenario. Red grid cells: Allium iatrouinum is currently predicted to occupy these areas but will not occupy them in the future. Blue grid cells: Allium iatrouinum is currently predicted to occupy these areas and will continue to occupy them in the future. Light grey grid cells: Allium iatrouinum is not currently predicted to occupy these areas and it is not predicted to occupy them in the future. Black dots indicate the occurrences of Allium iatrouinum in Skyros and Skyropoula. Climate data refer to the WorldClim database, Figure S14: Predicted potential distribution map for 2070 and the BCC GCM and the RCP 8.5 scenario. Red grid cells: Allium iatrouinum is currently predicted to occupy these areas but will not occupy them in the future. Blue grid cells: Allium iatrouinum is currently predicted to occupy these areas and will continue to occupy them in the future. Light grey grid cells: Allium iatrouinum is not currently predicted to occupy these areas and it is not predicted to occupy them in the future. Black dots indicate the occurrences of Allium iatrouinum in Skyros and Skyropoula. Climate data refer to the WorldClim database, Figure S15: Predicted potential distribution map for 2070 and the CCSM4 GCM and the RCP 2.6 scenario. Red grid cells: Allium iatrouinum is currently predicted to occupy these areas but will not occupy them in the future. Blue grid cells: Allium iatrouinum is currently predicted to occupy these areas and will continue to occupy them in the future. Light grey grid cells: Allium iatrouinum is not currently predicted to occupy these areas and it is not predicted to occupy them in the future. Black dots indicate the occurrences of Allium iatrouinum in Skyros and Skyropoula. Climate data refer to the WorldClim database, Figure S16: Predicted potential distribution map for 2070 and the CCSM4 GCM and the RCP 8.5 scenario. Red grid cells: Allium iatrouinum is currently predicted to occupy these areas but will not occupy them in the future. Blue grid cells: Allium iatrouinum is currently predicted to occupy these areas and will continue to occupy them in the future. Light grey grid cells: Allium iatrouinum is not currently predicted to occupy these areas and it is not predicted to occupy them in the future. Black dots indicate the occurrences of Allium iatrouinum in Skyros and Skyropoula. Climate data refer to the WorldClim database, Figure S17: Predicted potential distribution map for 2070 and the HadGEM2 GCM and the RCP 2.6 scenario. Red grid cells: Allium iatrouinum is currently predicted to occupy these areas but will not occupy them in the future. Blue grid cells: Allium iatrouinum is currently predicted to occupy these areas and will continue to occupy them in the future. Light grey grid cells: Allium iatrouinum is not currently predicted to occupy these areas and it is not predicted to occupy them in the future. Black dots indicate the occurrences of Allium iatrouinum in Skyros and Skyropoula. Climate data refer to the WorldClim database, Figure S18: Predicted potential distribution map for 2070 and the HadGEM2 GCM and the RCP 8.5 scenario. Red grid cells: Allium iatrouinum is currently predicted to occupy these areas but will not occupy them in the future. Blue grid cells: Allium iatrouinum is currently predicted to occupy these areas and will continue to occupy them in the future. Light grey grid cells: Allium iatrouinum is not currently predicted to occupy these areas and it is not predicted to occupy them in the future. Black dots indicate the occurrences of Allium iatrouinum in Skyros and Skyropoula. Climate data refer to the WorldClim database, Figure S19: Predicted potential distribution map for 2070 and the BCC GCM and the RCP 2.6 scenario. Red grid cells: Allium iatrouinum is currently predicted to occupy these areas but will not occupy them in the future. Blue grid cells: Allium iatrouinum is currently predicted to occupy these areas and will continue to occupy them in the future. Light grey grid cells: Allium iatrouinum is not currently predicted to occupy these areas and it is not predicted to occupy them in the future. Black dots indicate the occurrences of Allium iatrouinum in Skyros and Skyropoula. Climate data refer to the CHELSA database, Figure S20: Predicted potential distribution map for 2070 and the BCC GCM and the RCP 8.5 scenario. Red grid cells: Allium iatrouinum is currently predicted to occupy these areas but will not occupy them in the future. Blue grid cells: Allium iatrouinum is currently predicted to occupy these areas and will continue to occupy them in the future. Light grey grid cells: Allium iatrouinum is not currently predicted to occupy these areas and it is not predicted to occupy them in the future. Black dots indicate the occurrences of Allium iatrouinum in Skyros and Skyropoula. Climate data refer to the CHELSA database, Figure S21: Predicted potential distribution map for 2070 and the CCSM4 GCM and the RCP 2.6 scenario. Red grid cells: Allium iatrouinum is currently predicted to occupy these areas but will not occupy them in the future. Blue grid cells: Allium iatrouinum is currently predicted to occupy these areas and will continue to occupy them in the future. Light grey grid cells: Allium iatrouinum is not currently predicted to occupy these areas and it is not predicted to occupy them in the future. Black dots indicate the occurrences of Allium iatrouinum in Skyros and Skyropoula. Climate data refer to the CHELSA database, Figure S22: Predicted potential distribution map for 2070 and the CCSM4 GCM and the RCP 8.5 scenario. Red grid cells: Allium iatrouinum is currently predicted to occupy these areas but will not occupy them in the future. Blue grid cells: Allium iatrouinum is currently predicted to occupy these areas and will continue to occupy them in the future. Light grey grid cells: Allium iatrouinum is not currently predicted to occupy these areas and it is not predicted to occupy them in the future. Black dots indicate the occurrences of Allium iatrouinum in Skyros and Skyropoula. Climate data refer to the CHELSA database.
Author Contributions
Conceptualization, K.K., P.K. and A.P.; investigation, K.K. and P.K.; methodology, K.K. and P.K.; formal analysis, K.K., P.K. and E.S.; resources, K.K., P.T.; supervision, A.P.; writing—original draft preparation, K.K. and P.K.; writing—review and editing, K.K., P.K., E.S., P.T. and A.P.; visualization, K.K. All authors have read and agreed to the published version of the manuscript.
Funding
This research was funded by the Hellenic Foundation for Research and Innovation (HFRI) and the General Secretariat for Research and Technology (GSRT), grant number 2418.
Institutional Review Board Statement
Not applicable.
Data Availability Statement
Not applicable.
Acknowledgments
We are grateful to Apostolis Kaltsis, Ph.D. (Department of Biology, National and Kapodistrian University of Athens) and Ioannis Kofinas-Kallergis for their invaluable help regarding the detailed information they provided about the locations and the state of the populations of Aethionema retsina and Allium iatrouinum, respectively, prior to our own fieldwork visits.
Conflicts of Interest
The authors declare no conflict of interest. The funders had no role in the design of the study; in the collection, analyses, or interpretation of data; in the writing of the manuscript, or in the decision to publish the results.
References
- Barthlott, W.; Mutke, J.; Rafiqpoor, D.; Kier, G.; Kreft, H. Global Centers of Vascular Plant Diversity. Nov. Acta Leopoldina 2005, 92, 61–83. [Google Scholar]
- Myers, N.; Mittermeier, R.A.; Mittermeier, C.G.; Da Fonseca, G.A.B.; Kent, J. Biodiversity hotspots for conservation priorities. Nature 2000, 403, 853–858. [Google Scholar] [CrossRef] [PubMed]
- Critical Ecosystem Partnership Fund. Mediterranean Basin Biodiversity Hotspot. Ecosystem Profile; Birdlife International: Cambridge, UK, 2017. [Google Scholar]
- Médail, F. The specific vulnerability of plant biodiversity and vegetation on Mediterranean islands in the face of global change. Reg. Environ. Chang. 2017, 17, 1775–1790. [Google Scholar] [CrossRef]
- Valente, L.M.; Vargas, P. Contrasting evolutionary hypotheses between two mediterranean-climate floristic hotspots: The Cape of southern Africa and the Mediterranean Basin. J. Biogeogr. 2013, 40, 2032–2046. [Google Scholar] [CrossRef]
- Rundel, P.W.; Arroyo, M.T.K.; Cowling, R.M.; Keeley, J.E.; Lamont, B.B.; Vargas, P. Mediterranean Biomes: Evolution of Their Vegetation, Floras, and Climate. Annu. Rev. Ecol. Evol. Syst. 2016, 47, 383–407. [Google Scholar] [CrossRef]
- Vargas, P.; Fernández-Mazuecos, M.; Heleno, R. Phylogenetic evidence for a Miocene origin of Mediterranean lineages: Species diversity, reproductive traits and geographical isolation. Plant Biol. 2018, 20, 157–165. [Google Scholar] [CrossRef]
- Thompson, J.D. Plant Evolution in the Mediterranean; Oxford University Press: Oxford, UK, 2005; ISBN 0198515332. [Google Scholar]
- Taberlet, P.; Fumagalli, L.; Wust-Saucy, A.G.; Cosson, J.F. Comparative phylogeography and postglacial colonization routes in Europe. Mol. Ecol. 1998. [Google Scholar] [CrossRef]
- Hewitt, G.M. Mediterranean Peninsulas: The Evolution of Hotspots. In Biodiversity Hotspots; Springer: Berlin/Heidelberg, Geramny, 2011; pp. 123–147. [Google Scholar]
- Petit, R.J.; Aguinagalde, I.; De Beaulieu, J.L.; Bittkau, C.; Brewer, S.; Cheddadi, R.; Ennos, R.; Fineschi, S.; Grivet, D.; Lascoux, M.; et al. Glacial refugia: Hotspots but not melting pots of genetic diversity. Science 2003. [Google Scholar] [CrossRef]
- Horne, D.J.; Griffiths, H.I.; Krystufek, B.; Reed, J.M. (Eds.) Balkan Biodiversity: Pattern and Process in the European Hotspot. J. Paleolimnol. 2007, 38, 609–611. [Google Scholar] [CrossRef]
- Tzedakis, P.C. The Balkans as Prime Glacial Refugial Territory of European Temperate Trees. In Balkan Biodiversity; Springer: Dordrecht, The Netherlands, 2004; pp. 49–68. [Google Scholar]
- Mansion, G.; Rosenbaum, G.; Schoenenberger, N.; Bacchetta, G.; Rosselló, J.A.; Conti, E. Phylogenetic analysis informed by geological history supports multiple, sequential invasions of the Mediterranean Basin by the angiosperm family Araceae. Syst. Biol. 2008, 57, 269–285. [Google Scholar] [CrossRef]
- Frajman, B.; Pachschwöll, C.; Schönswetter, P. Contributions to the knowledge of the flora of the dinarides (Balkan Peninsula). Phyt. Ann. Rei Bot. 2014. [Google Scholar] [CrossRef]
- Lakušić, D.; Liber, Z.; Nikolić, T.; Surina, B.; Kovačić, S.; Bogdanović, S.; Stefanović, S. Molecular phylogeny of the Campanula pyramidalis species complex (Campanulaceae) inferred from chloroplast and nuclear non-coding sequences and its taxonomic implications. Taxon 2013, 62, 505–524. [Google Scholar] [CrossRef]
- Surina, B.; Schönswetter, P.; Schneeweiss, G.M. Quaternary range dynamics of ecologically divergent species (Edraianthus serpyllifolius and E. tenuifolius, Campanulaceae) within the Balkan refugium. J. Biogeogr. 2011. [Google Scholar] [CrossRef]
- Surina, B.; Schneeweiss, G.M.; Glasnović, P.; Schönswetter, P. Testing the efficiency of nested barriers to dispersal in the Mediterranean high mountain plant Edraianthus graminifolius (Campanulaceae). Mol. Ecol. 2014. [Google Scholar] [CrossRef] [PubMed]
- Kutnjak, D.; Kuttner, M.; Niketić, M.; Dullinger, S.; Schönswetter, P.; Frajman, B. Escaping to the summits: Phylogeography and predicted range dynamics of Cerastium dinaricum, an endangered high mountain plant endemic to the western Balkan Peninsula. Mol. Phylogenet. Evol. 2014. [Google Scholar] [CrossRef]
- Pacifici, M.; Foden, W.B.; Visconti, P.; Watson, J.E.M.; Butchart, S.H.M.; Kovacs, K.M.; Scheffers, B.R.; Hole, D.G.; Martin, T.G.; Akçakaya, H.R.; et al. Assessing species vulnerability to climate change. Nat. Clim. Chang. 2015, 5, 215–224. [Google Scholar] [CrossRef]
- Giorgi, F.; Lionello, P. Climate change projections for the Mediterranean region. Glob. Planet. Chang. 2008, 63, 90–104. [Google Scholar] [CrossRef]
- Newbold, T. Future effects of climate and land-use change on terrestrial vertebrate community diversity under different scenarios. Proc. R. Soc. B Biol. Sci. 2018, 285. [Google Scholar] [CrossRef]
- Newbold, T.; Hudson, L.N.; Contu, S.; Hill, S.L.L.; Beck, J.; Liu, Y.; Meyer, C.; Phillips, H.R.P.; Scharlemann, J.P.W.; Purvis, A. Widespread winners and narrow-ranged losers: Land use homogenizes biodiversity in local assemblages worldwide. PLoS Biol. 2018, 16, e2006841. [Google Scholar] [CrossRef]
- Powers, R.P.; Jetz, W. Global habitat loss and extinction risk of terrestrial vertebrates under future land-use-change scenarios. Nat. Clim. Chang. 2019, 9, 323–329. [Google Scholar] [CrossRef]
- Li, D.; Olden, J.D.; Lockwood, J.L.; Record, S.; McKinney, M.L.; Baiser, B. Changes in taxonomic and phylogenetic diversity in the Anthropocene. Proc. R. Soc. B Biol. Sci. 2020, 287, 20200777. [Google Scholar] [CrossRef]
- Menéndez-Guerrero, P.A.; Green, D.M.; Davies, T.J. Climate change and the future restructuring of Neotropical anuran biodiversity. Ecography 2020, 43, 222–235. [Google Scholar] [CrossRef]
- Kougioumoutzis, K.; Kokkoris, I.P.; Panitsa, M.; Trigas, P.; Strid, A.; Dimopoulos, P. Spatial Phylogenetics, Biogeographical Patterns and Conservation Implications of the Endemic Flora of Crete (Aegean, Greece) under Climate Change Scenarios. Biology 2020, 9, 199. [Google Scholar] [CrossRef]
- Lavergne, S.; Thuiller, W.; Molina, J.; Debussche, M. Environmental and human factors influencing rare plant local occurrence, extinction and persistence: A 115-year study in the Mediterranean region. J. Biogeogr. 2005, 32, 799–811. [Google Scholar] [CrossRef]
- Zalasiewicz, J.; Waters, C.N.; Williams, M.; Barnosky, A.D.; Cearreta, A.; Crutzen, P.; Ellis, E.; Ellis, M.A.; Fairchild, I.J.; Grinevald, J.; et al. When did the Anthropocene begin? A mid-twentieth century boundary level is stratigraphically optimal. Quat. Int. 2015, 383, 196–203. [Google Scholar] [CrossRef]
- Nic Lughadha, E.; Bachman, S.P.; Leão, T.C.C.; Forest, F.; Halley, J.M.; Moat, J.; Acedo, C.; Bacon, K.L.; Brewer, R.F.A.; Gâteblé, G.; et al. Extinction risk and threats to plants and fungi. Plants People Planet 2020, 2, 389–408. [Google Scholar] [CrossRef]
- Le Roux, J.J.; Hui, C.; Castillo, M.L.; Iriondo, J.M.; Keet, J.H.; Khapugin, A.A.; Médail, F.; Rejmánek, M.; Theron, G.; Yannelli, F.A.; et al. Recent Anthropogenic Plant Extinctions Differ in Biodiversity Hotspots and Coldspots. Curr. Biol. 2019, 29, 2912–2918.e2. [Google Scholar] [CrossRef] [PubMed]
- López-Pujol, J.; Martinell, M.C.; Massó, S.; Blanché, C.; Sáez, L. The “paradigm of extremes”: Extremely low genetic diversity in an extremely narrow endemic species, Coristospermum huteri (Umbelliferae). Plant Syst. Evol. 2013, 299, 439–446. [Google Scholar] [CrossRef]
- Médail, F.; Baumel, A. Using phylogeography to define conservation priorities: The case of narrow endemic plants in the Mediterranean Basin hotspot. Biol. Conserv. 2018, 224, 258–266. [Google Scholar] [CrossRef]
- Andreou, M.; Delipetrou, P.; Kadis, C.; Tsiamis, G.; Bourtzis, K.; Georghiou, K. An integrated approach for the conservation of threatened plants: The case of Arabis kennedyae (Brassicaceae). Acta Oecol. 2011, 37, 239–248. [Google Scholar] [CrossRef]
- Dimopoulos, P.; Raus, T.; Bergmeier, E.; Constantinidis, T.; Iatrou, G.; Kokkini, S.; Strid, A.; Tzanoudakis, D. Vascular Plants of Greece: An Annotated Checklist; Botanical Garden and Botanical Museum: Berlin, Germany, 2013; Volume 46, pp. 1–372. [Google Scholar]
- Bilz, M.; Kell, S.P.; Maxted, N.; Lansdown, R.V. European Red List of Vascular Plants; Publications Office of the European Union: Luxembourg, 2011; ISBN 9789279201998. [Google Scholar]
- López-Vinyallonga, S.; López-Pujol, J.; Constantinidis, T.; Susanna, A.; Garcia-Jacas, N. Mountains and refuges: Genetic structure and evolutionary history in closely related, endemic Centaurea in continental Greece. Mol. Phylogenet. Evol. 2015, 92, 243–254. [Google Scholar] [CrossRef] [PubMed]
- Kozlowski, G.; Frey, D.; Fazan, L.; Egli, B.; Bétrisey, S.; Gratzfeld, J.; Garfì, G.; Pirintsos, S. The Tertiary relict tree Zelkova abelicea (Ulmaceae): Distribution, population structure and conservation status on Crete. Oryx 2014, 48, 80–87. [Google Scholar] [CrossRef]
- Christe, C.; Kozlowski, G.; Frey, D.; Fazan, L.; Bétrisey, S.; Pirintsos, S.; Gratzfeld, J.; Naciri, Y. Do living ex situ collections capture the genetic variation of wild populations? A molecular analysis of two relict tree species, Zelkova abelica and Zelkova carpinifolia. Biodivers. Conserv. 2014, 23, 2945–2959. [Google Scholar] [CrossRef]
- Fineschi, S.; Cozzolino, S.; Migliaccio, M.; Vendramin, G.G. Genetic variation of relic tree species: The case of Mediterranean Zelkova abelicea (Lam.) Boisser and Z. sicula Di Pasquale, Garfì and Quézel (Ulmaceae). For. Ecol. Manag. 2004, 197, 273–278. [Google Scholar] [CrossRef]
- Stathi, E.; Kougioumoutzis, K.; Abraham, E.M.; Trigas, P.; Ganopoulos, I.; Avramidou, E.V.; Tani, E. Population genetic variability and distribution of the endangered Greek endemic Cicer graecum under climate change scenarios. AoB Plants 2020, 12. [Google Scholar] [CrossRef] [PubMed]
- Fassou, G.; Kougioumoutzis, K.; Iatrou, G.; Trigas, P.; Papasotiropoulos, V. Genetic Diversity and Range Dynamics of Helleborus odorus subsp. cyclophyllus under Different Climate Change Scenarios. Forests 2020, 11, 620. [Google Scholar] [CrossRef]
- Walas, L.; Ganatsas, P.; IszkuLo, G.; Thomas, P.A.; Dering, M. Spatial genetic structure and diversity of natural populations of Aesculus hippocastanum L. In Greece. PLoS ONE 2019, 14, 1–27. [Google Scholar] [CrossRef]
- Drouzas, A.D.; Charitonidou, M.; Tsiftsis, S. Chloroplast DNA variation in Epipactis atrorubens populations from northern Greece. Bot. Lett. 2017, 164, 55–62. [Google Scholar] [CrossRef]
- Augustinos, A.; Sotirakis, K.; Trigas, P.; Kalpoutzakis, E.; Papasotiropoulos, V. Genetic Variation in Three Closely Related Minuartia (Caryophyllaceae) Species Endemic to Greece: Implications for Conservation Management. Folia Geobot. 2014, 49, 603–621. [Google Scholar] [CrossRef]
- Kougioumoutzis, K.; Kokkoris, I.P.; Panitsa, M.; Trigas, P.; Strid, A.; Dimopoulos, P. Plant Diversity Patterns and Conservation Implications under Climate-Change Scenarios in the Mediterranean: The Case of Crete (Aegean, Greece). Diversity 2020, 12, 270. [Google Scholar] [CrossRef]
- Van Proosdij, A.S.J.; Sosef, M.S.M.; Wieringa, J.J.; Raes, N. Minimum required number of specimen records to develop accurate species distribution models. Ecography 2016, 39, 542–552. [Google Scholar] [CrossRef]
- Dimopoulos, P.; Raus, T.; Bergmeier, E.; Constantinidis, T.; Iatrou, G.; Kokkini, S.; Strid, A.; Tzanoudakis, D. Vascular plants of Greece: An annotated checklist. Supplement. Willdenowia 2016, 46, 301–348. [Google Scholar] [CrossRef]
- Strid, A. Atlas of the Aegean Flora; Botanic Garden and Botanical Museum Berlin-Freie Universität Berlin: Berlin, Germany, 2016. [Google Scholar]
- Phitos, D.; Strid, A.; Snogerup, S.; Greuter, W. The Red Data Book of Rare and Threatened Plants of Greece; World Wide Fund for Nature: Gland, Switzerland, 1995; ISBN 9789607506047. [Google Scholar]
- Phitos, D.; Constantinidis, T.H.; Kamari, G. The Red Data Book of Rare and Threatened Plants of Greece, Volume II; Hellenic Botanical Society: Patras, Greece, 2009. [Google Scholar]
- De Montmollin, B.; Strahm, W. The Top 50 Mediterranean Island Plants: Wild Plants at the Brink of Extinction, and What Is Needed to Save Them; IUCN: Gland, Switzerland, 2005; ISBN 283170832X. [Google Scholar]
- Kaltsis, A.; Koutsovoulou, K.; Thanos, C.A. Aethionema retsina. In The Red Data Book of Rare and Threatened Plants of Greece, Volume I; Phitos, D., Constantinidis, T., Kamari, G., Eds.; Hellenic Βotanical Society: Patras, France, 2009; pp. 53–55. [Google Scholar]
- Constantinidis, T.; Kaltsis, A.; Karamplianis, T.; Tountas, T.; Pasoulas, X. Demonstration of the Biodiversity Action Planning Approach, to Benefit local Biodiversity on an Aegean Island, Skyros; Hellenic Society of Environment and Culture: Athens, Greece; National and Kapodistrian University of Athens: Athens, Greece, 2012; p. 99. [Google Scholar]
- Iatrou, G. Aethionema Retsina. (Errata Version Published in 2016). IUCN Red List Threat. Species 2006. [Google Scholar] [CrossRef]
- Trigas, P.; Kalpoutzakis, E.; Constantinidis, T. Two new Allium (A. sect. Cupanioscordum, Amaryllidaceae) species from Greece. Phytotaxa 2017, 297, 179. [Google Scholar] [CrossRef]
- Fournaraki, C.; Thanos, C.A. Bupleurum kakiskalae. In The Red Data Book of Rare and Threatened Plants of Greece, Volume I; Phitos, D., Constantinidis, T., Kamari, G., Eds.; Hellenic Βotanical Society: Patras, Greece, 2009; pp. 163–165. [Google Scholar]
- Fournaraki, C. Conservation of Threatened Plants of Crete—Seed Ecology, Operation and Management of a Gene Bank. Ph.D. Thesis, Department of Botany, Faculty of Biology, National and Kapodistrian University of Athens, Athens, Greece, 2010. (In Greek with English Abstract). [Google Scholar]
- Iatrou, G.; Kypriotakis, Z.; Fournaraki, C.; Kaltsis, A.; Koutsovoulou, K. Convolvulus argyrothamnos. Available online: https://dx.doi.org/10.2305/IUCN.UK.2018-1.RLTS.T61677A102932388.en (accessed on 11 January 2021).
- Phitos, D.; Greuter, W. Saponaria jagelii, a new species from the island of Elafonisos (Peloponnisos, Greece). Flora Mediterr. 1993, 3, 277–278. [Google Scholar]
- Iatrou, G. Saponaria jagelii. The IUCN Red List of Threatened Species 2013: e.T61639A50017799. Available online: http://dx.doi.org/10.2305/IUCN.UK.2013-2.RLTS.T61639A50017799.en (accessed on 5 February 2021).
- Winnepenninckx, B.; Backeljau, T.; De Wachter, R. Extraction of high molecular weight DNA from molluscs. Trends Genet. 1993. [Google Scholar] [CrossRef]
- Parmakelis, A.; Spanos, E.; Papagiannakis, G.; Louis, C.; Mylonas, M. Mitochondrial DNA phylogeny and morphological diversity in the genus Mastus (Beck, 1837): A study in a recent (Holocene) island group (Koufonisi, south-east Crete). Biol. J. Linn. Soc. 2003. [Google Scholar] [CrossRef]
- Dos Santos, L.F.; de Oliveira, E.J.; dos Santos Silva, A.; de Carvalho, F.M.; Costa, J.L.; Pádua, J.G. ISSR markers as a tool for the assessment of genetic diversity in Passiflora. Biochem. Genet. 2011, 49, 540–554. [Google Scholar] [CrossRef] [PubMed]
- Pe, P.R.S. GenAlEx 6.5: Genetic analysis in Excel. Population genetic software for teaching and research—An update. Bioinformatics 2012, 28, 2537. [Google Scholar]
- Krawczak, M.; Nikolaus, S.; von Eberstein, H.; Croucher, P.J.P.; El Mokhtari, N.E.; Schreiber, S. PopGen: Population-based recruitment of patients and controls for the analysis of complex genotype-phenotype relationships. Public Health Genom. 2006, 9, 55–61. [Google Scholar] [CrossRef]
- Hijmans, R.J.; Cameron, S.E.; Parra, J.L.; Jones, P.G.; Jarvis, A. Very high resolution interpolated climate surfaces for global land areas. Int. J. Climatol. 2005, 25, 1965–1978. [Google Scholar] [CrossRef]
- Karger, D.N.; Conrad, O.; Böhner, J.; Kawohl, T.; Kreft, H.; Soria-Auza, R.W.; Zimmermann, N.E.; Linder, H.P.; Kessler, M. Climatologies at high resolution for the earth’s land surface areas. Sci. Data 2017, 4, 170122. [Google Scholar] [CrossRef]
- Title, P.O.; Bemmels, J.B. ENVIREM: An expanded set of bioclimatic and topographic variables increases flexibility and improves performance of ecological niche modeling. Ecography 2017. [Google Scholar] [CrossRef]
- Hengl, T.; de Jesus, J.M.; Heuvelink, G.B.M.; Gonzalez, M.R.; Kilibarda, M.; Blagotić, A.; Shangguan, W.; Wright, M.N.; Geng, X.; Bauer-Marschallinger, B.; et al. SoilGrids250m: Global gridded soil information based on machine learning. PLoS ONE 2017, 12, e0169748. [Google Scholar] [CrossRef] [PubMed]
- Jarvis, A.; Reuter, H.I.; Nelson, A.; Guevara, E. Hole-filled SRTM for the globe Version 4. CGIAR CSI SRTM 90m Database 2008, 15, 25–54. [Google Scholar]
- Hijmans, R.J. Raster: Geographic Data Analysis and Modeling. R Package Version 3.4-5. Available online: https://CRAN.R-project.org/package=raster (accessed on 14 November 2020).
- Evans, J.S. spatialEco. R Package Version 1.3-4. Available online: https://github.com/jeffreyevans/spatialEco (accessed on 10 December 2020).
- Hiemstra, P.H.; Pebesma, E.J.; Twenhofel, C.J.W.; Heuvelink, G.B.M. Real-time automatic interpolation of ambient gamma dose rates from the Dutch Radioactivity Monitoring Network. Comput. Geosci. 2008. [Google Scholar] [CrossRef]
- McSweeney, C.F.; Jones, R.G.; Lee, R.W.; Rowell, D.P. Selecting CMIP5 GCMs for downscaling over multiple regions. Clim. Dyn. 2015, 44, 3237–3260. [Google Scholar] [CrossRef]
- Araújo, M.B.; Anderson, R.P.; Barbosa, A.M.; Beale, C.M.; Dormann, C.F.; Early, R.; Garcia, R.A.; Guisan, A.; Maiorano, L.; Naimi, B.; et al. Standards for distribution models in biodiversity assessments. Sci. Adv. 2019, 5, eaat4858. [Google Scholar] [CrossRef] [PubMed]
- Morales-Barbero, J.; Vega-Álvarez, J. Input matters matter: Bioclimatic consistency to map more reliable species distribution models. Methods Ecol. Evol. 2019. [Google Scholar] [CrossRef]
- Dormann, C.F.; Elith, J.; Bacher, S.; Buchmann, C.; Carl, G.; Carré, G.; Marquéz, J.R.G.; Gruber, B.; Lafourcade, B.; Leitão, P.J.; et al. Collinearity: A review of methods to deal with it and a simulation study evaluating their performance. Ecography 2013, 36, 027–046. [Google Scholar] [CrossRef]
- Naimi, B.; Hamm, N.A.S.; Groen, T.A.; Skidmore, A.K.; Toxopeus, A.G. Where is positional uncertainty a problem for species distribution modelling? Ecography 2014, 37, 191–203. [Google Scholar] [CrossRef]
- Breiner, F.T.; Nobis, M.P.; Bergamini, A.; Guisan, A. Optimizing ensembles of small models for predicting the distribution of species with few occurrences. Methods Ecol. Evol. 2018. [Google Scholar] [CrossRef]
- Breiner, F.T.; Guisan, A.; Nobis, M.P.; Bergamini, A. Including environmental niche information to improve IUCN Red List assessments. Divers. Distrib. 2017. [Google Scholar] [CrossRef]
- Breiner, F.T.; Guisan, A.; Bergamini, A.; Nobis, M.P. Overcoming limitations of modelling rare species by using ensembles of small models. Methods Ecol. Evol. 2015, 6, 1210–1218. [Google Scholar] [CrossRef]
- Lawler, J.J.; White, D.; Neilson, R.P.; Blaustein, A.R. Predicting climate-induced range shifts: Model differences and model reliability. Glob. Chang. Biol. 2006. [Google Scholar] [CrossRef]
- Barbet-Massin, M.; Jiguet, F.; Albert, C.H.; Thuiller, W. Selecting pseudo-absences for species distribution models: How, where and how many? Methods Ecol. Evol. 2012, 3, 327–338. [Google Scholar] [CrossRef]
- Valavi, R.; Elith, J.; Lahoz-Monfort, J.J.; Guillera-Arroita, G. blockCV: An r package for generating spatially or environmentally separated folds for k-fold cross-validation of species distribution models. Methods Ecol. Evol. 2019. [Google Scholar] [CrossRef]
- Dauby, G.; Stévart, T.; Droissart, V.; Cosiaux, A.; Deblauwe, V.; Simo-Droissart, M.; Sosef, M.S.M.; Lowry, P.P.; Schatz, G.E.; Gereau, R.E.; et al. ConR: An R package to assist large-scale multispecies preliminary conservation assessments using distribution data. Ecol. Evol. 2017. [Google Scholar] [CrossRef]
- Meyer, L.; Diniz-Filho, J.A.F.; Lohmann, L.G. A comparison of hull methods for estimating species ranges and richness maps. Plant Ecol. Divers. 2017, 10, 389–401. [Google Scholar] [CrossRef]
- Allouche, O.; Tsoar, A.; Kadmon, R. Assessing the accuracy of species distribution models: Prevalence, kappa and the true skill statistic (TSS). J. Appl. Ecol. 2006, 43, 1223–1232. [Google Scholar] [CrossRef]
- Raes, N.; Ter Steege, H. A null-model for significance testing of presence-only species distribution models. Ecography 2007, 30, 727–736. [Google Scholar] [CrossRef]
- Thuiller, W.; Lafourcade, B.; Engler, R.; Araújo, M.B. BIOMOD—A platform for ensemble forecasting of species distributions. Ecography 2009, 32, 369–373. [Google Scholar] [CrossRef]
- Di Cola, V.; Broennimann, O.; Petitpierre, B.; Breiner, F.T.; D’Amen, M.; Randin, C.; Engler, R.; Pottier, J.; Pio, D.; Dubuis, A.; et al. ecospat: An R package to support spatial analyses and modeling of species niches and distributions. Ecography 2017, 40, 774–787. [Google Scholar] [CrossRef]
- Liu, C.; Berry, P.M.; Dawson, T.P.; Pearson, R.G. Selecting thresholds of occurrence in the prediction of species distributions. Ecography 2005, 28, 385–393. [Google Scholar] [CrossRef]
- Liu, C.; White, M.; Newell, G. Selecting thresholds for the prediction of species occurrence with presence-only data. J. Biogeogr. 2013, 40, 778–789. [Google Scholar] [CrossRef]
- Liu, C.; Newell, G.; White, M. On the selection of thresholds for predicting species occurrence with presence-only data. Ecol. Evol. 2016. [Google Scholar] [CrossRef] [PubMed]
- Elith, J.; Kearney, M.; Phillips, S. The art of modelling range-shifting species. Methods Ecol. Evol. 2010, 1, 330–342. [Google Scholar] [CrossRef]
- Wright, S.A.; Hutchison, M.; Hale, M.L.; Gemmill, C.E.C.; de Lange, P.J.; Pelser, P.B. A preliminary conservation genetic study of Pittosporum obcordatum (Pittosporaceae), an endemic New Zealand species with a disjunct distribution. N. Zeal. J. Bot. 2017. [Google Scholar] [CrossRef]
- De Kort, H.; Prunier, J.G.; Ducatez, S.; Honnay, O.; Baguette, M.; Stevens, V.M.; Blanchet, S. Life history, climate and biogeography interactively affect worldwide genetic diversity of plant and animal populations. Nat. Commun. 2021. [Google Scholar] [CrossRef] [PubMed]
- Cronk, Q. Plant extinctions take time. Science 2016. [Google Scholar] [CrossRef]
- Halley, J.M.; Monokrousos, N.; Mazaris, A.D.; Vokou, D. Extinction debt in plant communities: Where are we now? J. Veg. Sci. 2017, 28, 459–461. [Google Scholar] [CrossRef]
- Halley, J.M.; Monokrousos, N.; Mazaris, A.D.; Newmark, W.D.; Vokou, D. Dynamics of extinction debt across five taxonomic groups. Nat. Commun. 2016, 7, 1–6. [Google Scholar] [CrossRef]
- Halley, J.M.; Van Houtan, K.S.; Mantua, N. How survival curves affect populations vulnerability to climate change. PLoS ONE 2018, 13, e0203124. [Google Scholar] [CrossRef] [PubMed]
- Liber, Z.; Surina, B.; Nikolić, T.; Škrtić, D.; Šatović, Z. Spatial distribution, niche ecology and conservation genetics of Degenia velebitica (Brassicaceae), a narrow endemic species of the north-western Dinaric Alps. Plant Syst. Evol. 2020, 306, 1–19. [Google Scholar] [CrossRef]
- Aavik, T.; Thetloff, M.; Träger, S.; Hernández-Agramonte, I.M.; Reinula, I.; Pärtel, M. Delayed and immediate effects of habitat loss on the genetic diversity of the grassland plant Trifolium montanum. Biodivers. Conserv. 2019, 28, 3299–3319. [Google Scholar] [CrossRef]
- Chen, J.; Gituru, W.R.; Liu, X.; Wang, Q. Genetic diversity in Isoetes yunguiensis, a rare and endangered endemic fern in China. Front. Biol. China 2007. [Google Scholar] [CrossRef]
- Wang, T.; Su, Y.; Ye, H.; Ouyang, P.; Jiang, Y.; Sun, Y.; Chen, G.; Deng, F.; Zhang, H. Genetic differentiation and conservation of 14 surviving individuals of Euryodendron excelsum endemic to China. Front. Biol. China 2006. [Google Scholar] [CrossRef]
- Urquía, D.; Pozo, G.; Gutierrez, B.; Rowntree, J.K.; Torres, M.d.L. Understanding the genetic diversity of the guayabillo (Psidium galapageium), an endemic plant of the Galapagos Islands. Glob. Ecol. Conserv. 2020. [Google Scholar] [CrossRef]
- Kougioumoutzis, K.; Kokkoris, I.P.; Panitsa, M.; Kallimanis, A.; Strid, A.; Dimopoulos, P. Plant Endemism Centres and Biodiversity Hotspots in Greece. Biology 2021, 10, 72. [Google Scholar] [CrossRef]
- Chapman, M.A.; Hiscock, S.J.; Filatov, D.A. The genomic bases of morphological divergence and reproductive isolation driven by ecological speciation in Senecio (Asteraceae). J. Evol. Biol. 2016. [Google Scholar] [CrossRef]
- Christe, C.; Kozlowski, G.; Frey, D.; Bétrisey, S.; Maharramova, E.; Garfì, G.; Pirintsos, S.; Naciri, Y. Footprints of past intensive diversification and structuring in the genus Zelkova (Ulmaceae) in south-western Eurasia. J. Biogeogr. 2014, 41, 1081–1093. [Google Scholar] [CrossRef]
- Nybom, H. Comparison of different nuclear DNA markers for estimating intraspecific genetic diversity in plants. Mol. Ecol. 2004. [Google Scholar] [CrossRef] [PubMed]
- Fernández-Mazuecos, M.; Jiménez-Mejías, P.; Rotllan-Puig, X.; Vargas, P. Narrow endemics to Mediterranean islands: Moderate genetic diversity but narrow climatic niche of the ancient, critically endangered Naufraga (Apiaceae). Perspect. Plant Ecol. Evol. Syst. 2014, 16, 190–202. [Google Scholar] [CrossRef]
- Forrest, A.; Escudero, M.; Heuertz, M.; Wilson, Y.; Cano, E.; Vargas, P. Testing the hypothesis of low genetic diversity and population structure in narrow endemic species: The endangered Antirrhinum charidemi (Plantaginaceae). Bot. J. Linn. Soc. 2017. [Google Scholar] [CrossRef]
- Armstrong, T.T.J.; De Lange, P.J. Conservation genetics of Hebe speciosa (Plantaginaceae) an endangered New Zealand shrub. Bot. J. Linn. Soc. 2005. [Google Scholar] [CrossRef]
- Spielman, D.; Brook, B.W.; Frankham, R. Most species are not driven to extinction before genetic factors impact them. Proc. Natl. Acad. Sci. USA 2004. [Google Scholar] [CrossRef]
- Jump, A.S.; Penuelas, J. Running to stand still: Adaptation and the response of plants to rapid climate change. Ecol. Lett. 2005, 8, 1010–1020. [Google Scholar] [CrossRef]
- Urban, M.C. Accelerating extinction risk from climate change. Science 2015, 348, 571–573. [Google Scholar] [CrossRef] [PubMed]
- Gray, A. The ecology of plant extinction: Rates, traits and island comparisons. Oryx 2019, 53, 424–428. [Google Scholar] [CrossRef]
- Vellend, M.; Baeten, L.; Becker-Scarpitta, A.; Boucher-Lalonde, V.; McCune, J.L.; Messier, J.; Myers-Smith, I.H.; Sax, D.F. Plant Biodiversity Change Across Scales During the Anthropocene. Annu. Rev. Plant Biol. 2017, 68, 563–586. [Google Scholar] [CrossRef]
- Enquist, B.J.; Feng, X.; Boyle, B.; Maitner, B.; Newman, E.A.; Jørgensen, P.M.; Roehrdanz, P.R.; Thiers, B.M.; Burger, J.R.; Corlett, R.T.; et al. The commonness of rarity: Global and future distribution of rarity across land plants. Sci. Adv. 2019, 5, eaaz0414. [Google Scholar] [CrossRef] [PubMed]
- Warren, R.; Vanderwal, J.; Price, J.; Welbergen, J.A.; Atkinson, I.; Ramirez-Villegas, J.; Osborn, T.J.; Jarvis, A.; Shoo, L.P.; Williams, S.E.; et al. Quantifying the benefit of early climate change mitigation in avoiding biodiversity loss. Nat. Clim. Chang. 2013, 3, 678–682. [Google Scholar] [CrossRef]
- Castellari, S.; Kurnik, B. Climate Change, Impacts and Vulnerability in Europe; European Environment Agency: Copenhagen, Denmark, 2017; ISBN 9789292138356. [Google Scholar]
- Nearing, M.A.; Pruski, F.F.; O’Neal, M.R. Expected climate change impacts on soil erosion rates: A review. J. Soil Water Conserv. 2004, 59, 43–50. [Google Scholar]
- Borrelli, P.; Robinson, D.A.; Panagos, P.; Lugato, E.; Yang, J.E.; Alewell, C.; Wuepper, D.; Montanarella, L.; Ballabio, C. Land use and climate change impacts on global soil erosion by water (2015–2070). Proc. Natl. Acad. Sci. USA 2020, 117, 21994–22001. [Google Scholar] [CrossRef]
- Trnka, M.; Kersebaum, K.C.; Eitzinger, J.; Hayes, M.; Hlavinka, P.; Svoboda, M.; Dubrovský, M.; Semerádová, D.; Wardlow, B.; Pokorný, E.; et al. Consequences of climate change for the soil climate in Central Europe and the central plains of the United States. Clim. Chang. 2013, 120, 405–418. [Google Scholar] [CrossRef]
- Newbold, T.; Oppenheimer, P.; Etard, A.; Williams, J.J. Tropical and Mediterranean biodiversity is disproportionately sensitive to land-use and climate change. Nat. Ecol. Evol. 2020. [Google Scholar] [CrossRef]
- Fenu, G.; Bacchetta, G.; Christodoulou, C.S.; Cogoni, D.; Fournaraki, C.; del Galdo Gian Pietro, G.; Gotsiou, P.; Kyratzis, A.; Piazza, C.; Vicens, M.; et al. A common approach to the conservation of threatened island vascular plants: First results in the mediterranean basin. Diversity 2020, 12, 157. [Google Scholar] [CrossRef]
- Plant, M.; Unit, C.; Management, N.R. PMRs in Western Crete. Plant Micro Reserves Theory Pract. 2013, 2000, 27–36. [Google Scholar]
- Laguna, E.; Fos, S.; Jiménez, J.; Volis, S. Role of micro-reserves in conservation of endemic, rare and endangered plants of the Valencian region (Eastern Spain). Isr. J. Plant Sci. 2016, 63, 320–332. [Google Scholar] [CrossRef]
- Nazareno, A.G.; Bemmels, J.B.; Dick, C.W.; Lohmann, L.G. Minimum sample sizes for population genomics: An empirical study from an Amazonian plant species. Mol. Ecol. Resour. 2017. [Google Scholar] [CrossRef]
- Kougioumoutzis, K.; Kokkoris, I.P.; Panitsa, M.; Strid, A.; Dimopoulos, P. Extinction Risk Assessment of the Greek Endemic Flora. Biology 2021, 10, 195. [Google Scholar] [CrossRef]
Publisher’s Note: MDPI stays neutral with regard to jurisdictional claims in published maps and institutional affiliations. |
© 2021 by the authors. Licensee MDPI, Basel, Switzerland. This article is an open access article distributed under the terms and conditions of the Creative Commons Attribution (CC BY) license (https://creativecommons.org/licenses/by/4.0/).

