Abstract
Biodiversity loss has multiple causes, but habitat degradation through land-use change is the predominant driver. We investigated the effectiveness of the Natura 2000 network in preserving the main wetlands of the two largest islands of the Mediterranean region, whose conservation is critical for many avian species at European and global level, in a 23-year period (1990–2012). In Sardinia, the surroundings of 22 wetlands were affected by an increase in artificial areas (+64 ha/year) and decrease in agricultural (−54 ha/year) and natural (−17 ha/year) ones. In Sicily, the surroundings of 16 wetlands were impacted by an increase in agricultural areas (+50 ha/year) and decrease in natural and semi-natural ones (−62 ha/year). Results show that the Natura 2000 policies were effective in preserving wetlands (no shrinkages detected in both regions), but their surroundings experienced intense processes of degradation and artificialization in all the sub-periods considered (1990–2000, 2000–2006, 2006–2012), whose effects are now threatening waterbirds and wetland integrity. The enlargement of the existing Natura 2000 sites, the creation of new ones and the speedup of the application of the rules of the Habitats and Birds Directives seem necessary to counteract the rapid land-use changes around these important stopover sites.
1. Introduction
Wetlands contribute more than 20% of the total value of global ecosystem services [1] while covering <10% of global land surface [2]. Besides the great variety of goods and ecosystem services (e.g., carbon fixation, climate regulation, nutrient cycling, provisioning of food, fibers and biochemicals; [3,4]), wetlands also provide critical habitat for biodiversity [2]. Wetlands supply the food and shelter for waterbirds [5,6], and act as stopover sites that allow waterbirds to make migratory journeys [7,8]. Wetlands also support waterbirds that do not migrate, and are important during the entire annual cycle [9].
Despite their ecological importance, wetlands have been massively reduced in area, and their surroundings degraded [10,11]. Urban development and agricultural management have caused a significant loss and degradation of these areas [2] and >50% of the world’s wetlands have been modified, degraded, or lost in the last 150 years [12]. Some wetlands have been over-exploited for fish and water, whereas others have been drained and converted for agricultural activities [13]. Climate change exacerbates the risk of complete drainage of wetlands in summer [14]. Tourism can exert a substantial impact on wetland integrity and biodiversity [15], and consequent increase in transport by air, road, and rail leads to severe local pollution [2]. The construction of hotels and recreation facilities can induce an increase in sewage and waste water pollution [15]. Water quality, largely determined by pollution, directly and indirectly affects the use of wetlands by waterbirds [15]. The development of tourism facilities can also involve sand mining and extensive paving, therefore impacting habitat use by waterbirds [12].
Italy represents a flyway of critical importance for many bird species crossing the Mediterranean [16]. Sardinia and Sicily are the largest islands in the Mediterranean sea, and their wetlands act as important stopover sites along the Mediterranean bird flyways [17], therefore the conservation of these wetlands is critical for many avian species. In summer (July–September), the Sardinian wetlands host 59 bird species, and 70 species are present in the Sicilian wetlands [18]. Almost 90% of these species are migratory, therefore their conservation interest is primarily at European and global level [18]. The purple heron Ardea purpurea, the western swamphen Porphyrio porphyrio, the kentish plover Charadrius alexandrinus, the greater flamingo Phoenicopterus roseus, the little tern Sternula albifrons are species of high conservation interest in the Sardinian wetlands; the pied avocet Recurvirostra avosetta, the little bittern Ixobrychus minutus and the ferruginous duck Aythya nyroca are of major conservation interest in Sicily [18].
Protected areas have been established worldwide to promote the long-term conservation of biodiversity and ecosystems. In Europe, the increasing human density has resulted in a substantial reduction and fragmentation of natural landscapes and, despite the increase in the number of protected areas thanks to the Natura 2000 policies, serious concerns exist regarding to the degree to which they can effectively preserve biodiversity [19]. In this study, we carried out a detailed quantitative assessment of the land-use/land-cover changes in the Sardinian and Sicilian wetlandscapes during 1990–2012, and investigated the effectiveness of the Natura 2000 network in preserving the largest wetlands in these two regions. Studies about human pressure on protected areas are usually static, i.e., present the current human pressure as it results from processes working over decades. Such studies provide limited information on where human pressure has increased, decreased, or remained equal over time; therefore, they do not show if conservation efforts may be working, failing, or may require additional effort [20]. In addition, ecological research about the conservation of habitat for migratory avian species conducted at a few, small areas and over short time periods, potentially raises a conflict among scientists and conservation planners who have an urgent need for data over larger extents [21]. Accordingly, we adopted a wetlandscape perspective [22], which involved moving away from the individual wetland scale to consider the large-scale system of multiple wetlands and their surrounding landscape.
2. Methods
2.1. Selection of the Study Areas
We used three criteria to select the wetlands of interest in both regions: (a) exclusion of artificial wetlands; (b) surface area ≥ 10 ha (1 ha = 10,000 sq. m); (c) inclusion of the temporary wetlands that met the first two criteria. Temporary wetlands are in fact rather common in Sardinia and Sicily, where several wetlands are completely dry in summer due to evaporation, decrease in rainfalls and water diversion for agricultural activities [18].
2.2. Data Preparation
To detect the land-use/land-cover (LULC) transition processes, we used the available spatial datasets at 1:25,000 scale describing LULC in 1990, 2000, 2006, 2012 for Sardinia and 1990, 2006, 2012 for Sicily, available from the ISPRA (Italian National Institute for Environmental Protection and Research) website, where the territories of the two regions are classified in vector format in compliance with the European CORINE Land Cover project [23]. We also reclassified the CORINE codes into four groups, as to be functional to our study: arable land and permanent crops (ARA); artificial surfaces (ART); natural and semi-natural areas (NAT); wetlands and water bodies (WAT). The reclassification scheme is detailed in Table S1.
2.3. Change-Detection Analyses
Within GIS, we first compared the GIS polygons of the selected wetlands at different time steps. We then created a 2-km buffer zone around each wetland and used it in order to clip the LULC dataset. We chose this buffer size because during field surveys we observed that in both regions the distance at which the human impacts (water diversions, water pollution discharges, recreational and tourism pressure etc.) on wetlands occurred was >1 km and, approximately, not higher than 2 km [18]. Therefore, we estimated that a 2-km buffer size could realistically capture the degree of human influence upon the studied wetlands.
We superimposed the clipped GIS layers belonging to different years (1990, 2000, 2006, 2012) to detect the LULC changes over different time periods [24]. This step produced the LULC transition matrices, where cells in the diagonal denote LULC persistence, while cells off the diagonal correspond to the transitions from the generic LULC class i (in rows) to class j (in columns). The detected changes were then interpreted as: (1) anthropization processes (NAT→ARA, NAT→ART, WAT→ARA, WAT→ART), (2) naturalization processes (ARA→NAT, ART→NAT, ARA→WAT, ART→WAT); (3) internal changes (i.e., transitions to a different CORINE land cover code belonging to the same group).
3. Results
Twenty-two wetlands (average inter-distance = 12.6 km; total surface area = 5545 ha) in Sardinia and 16 (average inter-distance = 11.8 km; total surface area = 676 ha) in Sicily (Figure 1; Table 1; Figures S1 and S2) met our selection criteria. In Sardinia, 20 wetlands belong to the Natura 2000 network, in Sicily 14 are included in the network.
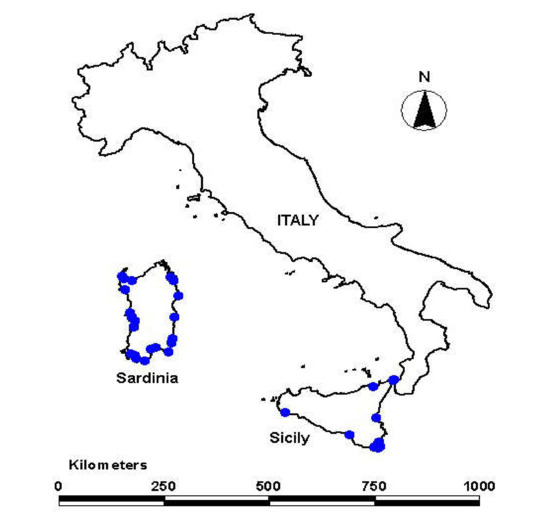
Figure 1.
The 38 wetlands (blue dots) under study.

Table 1.
Description of the 38 wetlands selected in Sardinia and Sicily (Italy).
3.1. Land-Use Changes in the Sardinian Wetlandscape
During 1990–2012, no changes occurred to the extents of the studied wetlands. In their surroundings, LULC transitions involved 6235 out of 43,310 ha (=14.4% of the 2-km buffers around the 22 wetlands; Figure 2).
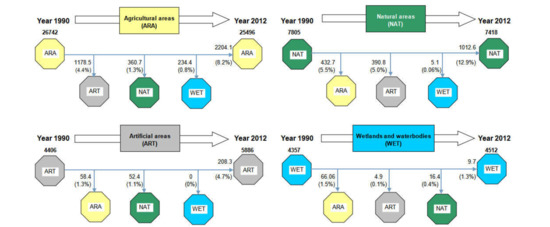
Figure 2.
Sardinia. Detected land-cover/land-use changes within the 2-km buffer areas around 22 principal wetlands during 1990–2012, separately for agricultural areas (ARA), artificial areas (ART), natural areas (NAT) and wetlands/waterbodies (WET). Key to reading: 26,742 ha of ARA were present in 1990, of which 1178.5 ha (4.4%) changed to ART during 1990–2012. In addition, 2204.1 ha (8.2%) showed internal transitions (i.e., changes to a different CORINE land cover code belonging to ARA). In 2012, ARA amounted to 25,496 ha.
ARA and NAT declined by 1246 and 388 ha respectively, while ART increased by 1480 ha and WET by 154 ha. ARA replaced 433 ha of NAT (i.e., 268 ha of “natural grasslands” and 150 ha of “sclerophyllous vegetation”; Table S2). ART replaced 391 ha of NAT (i.e., 106 ha of “sclerophyllous vegetation”, 114 ha of “pine forests” and 144 ha of “natural grasslands”) and 1178 ha of ARA (i.e., 581 ha of “complex cultivation patterns” and 382 ha of “land mainly occupied by agriculture with areas of natural vegetation” that prevalently changed to “discontinuous urban fabric”). NAT replaced “land mainly occupied by agriculture with areas of natural vegetation” (−256 ha) and “non-irrigated arable land” (−83 ha), whereas it declined in favour of ARA (+433 ha) and ART (+390 ha). WET increased due to wetland reestablishment on agricultural lands (i.e., 79 ha from “land mainly occupied by agriculture with areas of natural vegetation”, 74 ha from “complex cultivation patterns” and 54 ha from “non-irrigated arable land”). WET also shifted to “land mainly occupied by agriculture with areas of natural vegetation” (+45 ha), “non-irrigated arable land” (+20 ha) and “garigue” (+16 ha).
Considering the sub-periods separately (Table S3), it resulted that: (a) ARA declined prevalently in the period 1990–2000; (b) ART increased in all the sub-periods; (c) NAT declined constantly since the year 2000; (d) WET increased in the period 2006–2012. Over the period 1990–2000, the dominant dynamic was the abandonment of ARA in favour of NAT (+668 ha) and ART (+596 ha). The increase of NAT primarily involved transitions from “land mainly occupied by agriculture with areas of natural vegetation” to “garigue” (+368 ha), and from “non-irrigated arable land” to “typical meadows” (+157 ha). During 2000–2006, the prevalent dynamic was the expansion of ART in place of ARA (−185 ha) and NAT (−186 ha). The decline of NAT primarily concerned the transitions from “garigue” to “port areas” (+58 ha) and to “discontinuous urban fabric” (+73 ha). WET partially shifted to ARA, in particular “land mainly occupied by agriculture with areas of natural vegetation” (+40 ha). During 2006–2012, the predominant transitions were the decline of ARA (−613 ha) in favour of ART, and the expansion of ARA (+598 ha) in place of NAT. WET expanded at the expense of “land mainly occupied by agriculture with areas of natural vegetation” (−54 ha), “cropping systems and complex particles” (−74 ha) and “garigue” (−67 ha).
3.2. Land-Use Changes in the Sicilian Wetlandscape
During 1990–2012, no changes occurred to the extents of the studied wetlands. In their surroundings, LULC transitions involved 3496 out of 14,850 ha (=23.54% of the 2-km buffers around the 16 wetlands; Figure 3), NAT declined by 1428 ha, whereas ARA, ART and WET increased by 1161, 101 and 166 ha respectively.
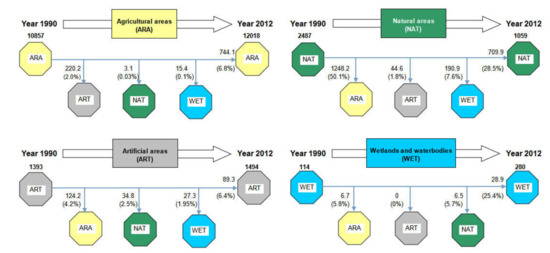
Figure 3.
Sicily. Detected land-cover / land-use changes (in hectares) in the 2-km buffer areas around 16 main wetlands during 1990–2012, separately for agricultural areas (ARA), artificial areas (ART), natural areas (NAT) and wetlands/waterbodies (WET).
NAT declined primarily due to three kinds of transitions (Table S4): (a) from “sclerophyllous vegetation” to “areas predominantly occupied by agricultural crops with important natural spaces” (+404 ha) and “irrigated arable land” (+375 ha); (b) from “moors and heathland” to “areas mainly occupied by agricultural crops with the presence of important natural spaces” (+140 ha); (c) from “natural grasslands” to “irrigated arable land” (+138 ha). ARA increased almost exclusively at the expense of NAT, plus 124 ha from ART (mostly, “discontinuous urban fabric”). ART increased primarily at the expense of ARA (−220 ha). WET were scarcely affected by LULC changes, except for 6.68 ha that shifted to “vineyards” and 6.54 ha to “garrigue”. WET also expanded at the expense of “sclerophyllous vegetation” (−161 ha).
Considering the sub-periods separately (Table S5), it emerged that: (a) ARA increased in all the sub-periods; (b) ART increased only in the period 2006–2012; (c) NAT declined constantly since the year 1990; (d) WET increased prevalently in the 1990–2006 period. During 1990–2006, the dominant dynamic was the expansion of ARA in place of NAT (−1091 ha). The most frequent transitions were from “garrigue” (−609 ha) and “moors and heathland” (−294 ha) to “irrigated arable land” and “areas mainly occupied by agricultural crops with the presence of important natural spaces”. An expansion (+138 ha) of WET occurred at the expense of NAT. During 2006–2012, the prevalent dynamic was the expansion (+423 ha) of ARA, primarily from “garrigue” to “irrigated arable land” (+240 ha), and from “natural grasslands” to “complex cultivation patterns” (+124 ha). ARA decreased in favour of ART (+249 ha) and NAT (+212 ha). ART, intended as “residential areas with discontinuous and sparse fabric”, partially shifted to ARA (+76 ha). WET expanded at the expense of ARA (−20 ha) and NAT (−20 ha).
4. Discussion
Our study shows that the surroundings of the largest wetlands in Sardinia and Sicily underwent clear anthropization processes (urbanization in Sardinia and agricultural expansion in Sicily) in the period 1990–2012 (Figures S3 and S4). Such dynamics were active in all the sub-periods considered, thus suggesting that they represent systematic LULC transitions that will probably persist also on short- and mid-term.
In Sardinia, the studied wetlands were primarily affected by an increase in artificial areas (at the annual rate of about 64 ha) and concomitant decrease in agricultural (−54 ha/year) and natural (−17 ha/year) ones. Most of the newly created artificial areas corresponded to infrastructures for tourist activities, classified here as “discontinuous urban fabric” (net gain = 38 ha/year; Table S2). This result agrees with economic studies about Sardinia, a region where mass tourism during the summer months has led to the development of hotel accommodations, camping sites, tourist villages and resorts at a large scale [25]. In contrast, in Sicily the surroundings of the principal wetlands were mainly interested by an increase (about 50 ha/year) in agricultural areas in place of natural ones (−62 ha/year). Such an increase was primarily related to intensive agriculture in irrigated arable lands (net gain = 39 ha/year; Table S4) due to the construction of new greenhouses for fruit-growing. This agrees with economic studies about the fast development of greenhouses in Sicily, aimed to further increase the production of oranges, tangerines, wine and lemons [26,27].
The detected LULC changes provide meaningful explanation of the current threats acting upon the main wetlands in both regions. In Sardinia, tourism pressure (e.g., walking, camping, watersports, angling, wildfowling etc.) is nowt threatening several wetlands, in particular Calich, S. Teodoro, Tartanelle and Tortoli [18]. Pollution discharges from nearby tourism facilities are already widespread in six wetlands, i.e., Cabras, Colostrai, Feraxi, Is Benas, S. Giusta and Tortoli [18]. In Sicily, agricultural activities are widespread in the surroundings of six wetlands, i.e., Auruca, Faro, Ganzirri, Gela, Longarini and Morghella [18]. Pollution discharges from the surrounding agricultural areas are already widespread in two wetlands (Gela, Longarini), and scattered in other eight wetlands [18]. Water diversion for agricultural activities is widespread in four wetlands (Auruca, Gela, Longarini, Morghella; [18]). Agriculture generally overuses water resources for irrigation, easily resulting in water shortage and degradation, and in Sicily water scarcity in summer already affects five wetlands (Auruca, Cuba, Longarini, Morghella, Pantano Grande; average water depth in summer < 5 cm) out of 16 [18]. The detected 904-ha net gain in “irrigated arable land” during 1990–2012 evidences the increase in water demand for agronomic practices. In Sicily, on average 4673 m3 of water are used yearly for each irrigated hectare [28], and up to 40% of water for irrigation is taken outside the agricultural areas from the neighboring wetlands [28]. It is possible to roughly compute how much the annual water demand, potentially coming from the wetlands under study, increased from 1990 to 2012 due to the detected gain in irrigated lands: 1,689,756 m3 (= 40% × 904 ha × 4673 m3/ha).
The alterations associated with the detected anthropization processes are now threatening wetland integrity and the associated avian diversity. Discharges from the surrounding agricultural areas and tourist facilities pollute the water with fertilizers, pesticides and other agrochemicals, and increase sediments entering wetlands [29,30]. The resulting decrease in water quality (e.g., temperature, dissolved oxygen, pH) directly and indirectly affects the use of wetlands by waterbirds. For example, the temperature of water and the organic matter content influence the hatching of invertebrate eggs, which affect prey accessibility for waterbirds [31]. Tourist activities, where not properly regulated, lead to the removal of waterbirds by direct kill, the damage to nests causing reduced productivity, the disturbance through noise leading to reduced breeding success and modified habitat use [32]. Change in water depth, due to the over-extraction of water, affects the use of wetland habitats by many waterbird species [33]. The first consequence of reduction in water depth is the turnover in waterbird species, favouring non-diving waterbirds (such as wading and dabbling birds) that prefer shallow water to forage [33]. As reduction in water depth will proceed, several wetlands in Sicily will be at high risk of complete drainage in the summer period, when they should instead act as important stopover sites along the most important flyways between Europe and Africa. Climate change will further exacerbate the risk of complete drainage of the Sicilian wetlands in summer [18].
5. Conclusions
Detecting changes in human pressure is meaningful to inform land planning, and can be used to evaluate the outcomes of conservation interventions. Our study provides a regional overview of the conversion processes occurring in the wetlandscape of the two largest islands of the Mediterranean area along important migratory bird flyways. Results emphasized that the wetlandscapes of Sardinia and Sicily have been characterized by large processes of degradation and artificialization during 1990–2012. The impacts of these land-use dynamics are now severely jeopardizing the wetlands of these two regions. Given the probable persistence also on short- and mid-term, our study suggests that impacts on wetland integrity and avian diversity will likely exacerbate in the next future.
Our study evidences that the Natura 2000 network was effective in preserving the individual wetlands in both regions (i.e., no losses or shrinkages detected), but not the surrounding wetlandscape. These findings highlight the need to pay more attention to strategies concerning wetland management in these two regions. The enlargement of the existing Natura 2000 sites or the designation of new ones under the rules of the Habitats (92/43/EEC) and Birds (2009/147/EC) Directives, and the creation of nature reserves as well, might help better manage LULC changes and limit their impacts on wetlands. In addition, the complex and long-lasting processes required for the application of the conservation measures of the Habitats and Birds Directives should be highly accelerated in order to keep up with the velocity of the land-use changes that emerged in this study.
Supplementary Materials
The following are available online at https://www.mdpi.com/article/10.3390/d13060240/s1, Figure S1: The 22 wetlands under study in Sardinia (Italy), Figure S2: The 16 wetlands under study in Sicily (Italy). The inset map shows enlarged detail of the 9 wetlands present in the South-East portion of the region, Figure S3: The total area in hectares (1 ha = 10,000 sq. m) of land cover groups for each time step (1990, 2000, 2006, 2012) in the 2-km buffer areas around the studied wetlands in Sardinia. ARA = agricultural areas, ART = artificial areas, NAT = natural areas, WET = wetlands/waterbodies, Figure S4: The total area in hectares (1 ha = 10,000 sq. m) of land cover groups for each time step in the 2-km buffer areas around the studied wetlands in Sicily. ARA = agricultural areas, ART = artificial areas, NAT = natural areas, WET = wetlands/waterbodies, Table S1: CORINE land cover legend. Only the codes used in this study are shown, Table S2: Sardinia. Transition matrix showing land-cover/land-use transitions in hectares (1 ha = 10,000 sq. m) during 1990–2012 within the 2-km buffer zones around the 22 main wetlands. Codes refer to the standard CORINE land cover legend (Table S1), Table S3: Sardinia. Land-use/land-cover (LULC) changes in hectares (1 ha = 10,000 sq. m) during the sub-periods 1990–2000 (A), 2000–2006 (B) and 2006–2012 (C) within the 2-km buffer zones around the 22 largest wetlands. ARA = agricultural areas, ART = artificial areas, NAT = natural areas, WET = wetlands/waterbodies. Cells in the diagonal denote LULC persistence, Table S4: Sicily. Transition matrix showing land-cover/land-use transitions in hectares (1 ha = 10,000 sq. m) in the period 1990–2012 within the 2-km buffer zones around the 16 main wetlands. Codes refer to the standard CORINE land cover legend (Table S1), Table S5: Sicily. Land-use/land-cover (LULC) changes in hectares (1 ha = 10,000 sq. m) within the 2-km buffer zones around the 16 main wetlands in the sub-periods 1990–2006 (A) and 2006–2012 (B). ARA = agricultural areas, ART = artificial areas, NAT = natural areas, WET = wetlands/waterbodies. Cells in the diagonal denote LULC persistence.
Author Contributions
C.C., M.G. and A.F. conceptualized the research design; A.F. processed the data and developed the analytical framework; A.F., M.G. and C.C. analyzed the results; A.F. drafted the main text. All authors were involved in discussions and editing. All authors have read and agreed to the published version of the manuscript.
Funding
This study was supported by the “Mediterranean Mosaics II” project, funded by the MAVA Foundation for the period 2016–2019.
Institutional Review Board Statement
Not applicable.
Informed Consent Statement
Not applicable.
Data Availability Statement
The spatial datasets describing LULC in 1990, 2000, 2006, 2012 for Sardinia and in 1990, 2006, 2012 for Sicily are available from the ISPRA (Italian National Institute for Environmental Protection and Research) website platform http://www.sinanet.isprambiente.it/it/sia-ispra/download-mais/corine-land-cover (accessed on 16 December 2020).
Acknowledgments
We acknowledge the helpful comments and suggestions provided by three anonymous reviewers.
Conflicts of Interest
The authors declare no conflict of interest.
References
- Costanza, R.; de Groot, R.; Sutton, P.; van der Ploeg, S.; Anderson, S.J.; Kubiszewski, I.; Farber, S.; Turner, R.K. Changes in the global value of ecosystem services. Glob. Environ. Chang. 2014, 26, 152–158. [Google Scholar] [CrossRef]
- Mitsch, W.J.; Gosselink, J.G. Wetlands; John Wiley & Sons: New York, NY, USA, 2015. [Google Scholar]
- Brander, L.M.; Florax, R.J.G.M.; Vermaat, J.E. The empirics of wetland valuation: A comprehensive summary and a meta-analysis of the literature. Environ. Resour. Econ. 2006, 33, 223–250. [Google Scholar] [CrossRef]
- De Groot, R.; Brander, L.; Ploeg, R.; Costanza, F.; Costanza, R.; Bernard, F.; Braat, L.; Christie, M.; Crossman, N.; Ghermandi, A.; et al. Global estimates of the value of ecosystems and their services in monetary units. Ecosyst. Serv. 2012, 1, 50–61. [Google Scholar] [CrossRef]
- Gibbs, J.P. Importance of small wetlands for the persistence of local populations of wetland-associated animals. Wetlands 1993, 13, 25–31. [Google Scholar] [CrossRef]
- Darnell, T.; Smith, E.H. Avian use of natural and created salt marsh in Texas, USA. Waterbirds 2004, 27, 355–361. [Google Scholar] [CrossRef]
- Fraser, L.H.; Keddy, P.A. The World’s Largest Wetlands: Ecology and Conservation; Cambridge University Press: Cambridge, UK, 2005. [Google Scholar]
- Kelly, J.P.; Stralberg, D.; Etienne, K.; McCaustland, M. Landscape influence on the quality of heron and egret colony sites. Wetlands 2008, 28, 257–275. [Google Scholar] [CrossRef]
- Keddy, P.A. Wetland Ecology: Principles and Conservation, 2nd ed.; Cambridge University Press: Cambridge, UK, 2010. [Google Scholar]
- Valiela, I.; Fox, S. Managing coastal wetlands. Science 2008, 319, 290–291. [Google Scholar] [CrossRef]
- Mao, Q.; Liao, C.; Wu, Z.; Guan, W.; Yang, W.; Tang, Y.; Wu, G. Effects of land cover pattern along urban-rural gradient on bird diversity in wetlands. Diversity 2019, 11, 86. [Google Scholar] [CrossRef]
- Gardner, R.C.; Barchiesi, S.; Beltrame, C.; Finlayson, C.M.; Galewski, T.; Harrison, I.; Perennou, C.; Pritchard, D.; Rosenqvist, A.; Walpole, M. State of the World’s Wetlands and Their Services to People: A Compilation of Recent Analyses; Social Science Electronic Publishing: Gland, Switzerland, 2015. [Google Scholar]
- Baker, C.; Lawrence, R.L.; Montagne, C.; Patten, D. Change detection of wetland ecosystems using Landsat imagery and change vector analysis. Wetlands 2007, 27, 610–619. [Google Scholar] [CrossRef]
- Erwin, K.L. Wetlands and global climate change: The role of wetland restoration in a changing world. Wetl. Ecol. Manag. 2009, 17, 71–84. [Google Scholar] [CrossRef]
- Gardner, R.C.; Finlayson, C.M. Global Wetland Outlook: State of the World’s Wetlands and Their Services to People; Ramsar Convention: Gland, Switzerland, 2018. [Google Scholar]
- Berthold, P. Bird Migration: A General Survey; Oxford University Press: New York, NY, USA, 2001. [Google Scholar]
- ISPRA. Introduction to the Italian Bird Migration Atlas; ISPRA Editore: Varese, Italy, 2008. [Google Scholar]
- Ferrarini, A.; Celada, C.; Gustin, M. Preserving the Mediterranean bird flyways: Assessment and prioritization of 38 main wetlands under human and climate threats in Sardinia and Sicily (Italy). Sci. Total Environ. 2020, 751, 141556. [Google Scholar] [CrossRef]
- Dos Santos Ribas, L.G.; Pressey, R.L.; Loyola, R.; Bini, L.M. A global comparative analysis of impact evaluation methods in estimating the effectiveness of protected areas. Biol. Conserv. 2020, 246, 108595. [Google Scholar] [CrossRef]
- Geldmann, J.; Joppa, L.N.; Burgess, N.D. Mapping change in human pressure globally on land and within protected areas. Conserv. Biol. 2014, 28, 1604–1616. [Google Scholar] [CrossRef]
- Haig, S.M.; Mehlman, D.W.; Oring, L.W. Avian movements and wetland connectivity in landscape conservation. Conserv. Biol. 1998, 12, 749–758. [Google Scholar] [CrossRef]
- Preston, E.M.; Bedford, B.L. Evaluating cumulative effects on wetland functions: A conceptual overview and generic framework. Environ. Manag. 1988, 12, 565–583. [Google Scholar] [CrossRef]
- EEA. CORINE Land Cover. 1995. Available online: http://www.eea.europa.eu/publications/COR0-landcover (accessed on 29 April 2018).
- Ilsever, M.; Unsalan, C. Two-Dimensional Change Detection Methods; Springer: Berlin/Heidelberg, Germany, 2012. [Google Scholar]
- Iorio, M.; Geoffrey, W. Behind the masks: Tourism and community in Sardinia. Tour. Manag. 2012, 33, 1440–1449. [Google Scholar] [CrossRef]
- Riguccio, L.; Tomaselli, G.; Russo, P.; Falanga, C. Identification of “Typical Agricultural Districts” for the development of rural areas applied to Eastern Sicily. Land Use Policy 2015, 44, 122–130. [Google Scholar] [CrossRef]
- Riguccio, L.; Carullo, L.; Russo, P.; Tomaselli, G. A landscape project for the coexistence of agriculture and nature: A proposal for the coastal area of a Natura 2000 site in Sicily (Italy). J. Agric. Eng. 2016, 46, 59–68. [Google Scholar] [CrossRef]
- ISTAT. Utilizzo della risorsa idrica a fini irrigui in agricoltura. In Sesto Censimento Generale Dell’agricoltura; ISTAT Editore: Rome, Italy, 2014. [Google Scholar]
- Van Asselen, S.; Verburg, P.H.; Vermaat, J.E.; Janse, J.H. Drivers of wetland conversion: A global meta-analysis. PLoS ONE 2013, 8, e81292. [Google Scholar] [CrossRef]
- Jensen, R.A.; Wisz, M.S.; Madsen, J. Prioritizing refuge sites for migratory geese to alleviate conflicts with agriculture. Biol. Conserv. 2008, 141, 1806–1818. [Google Scholar] [CrossRef]
- Czech, H.A.; Parsons, K.C. Agricultural wetlands and waterbirds: A review. Waterbirds 2002, 25, 56–65. [Google Scholar]
- Kirby, J.; Davidson, N.; Giles, N.; Owen, M.; Spray, C. Waterbirds and Wetland Recreation Handbook. A Review of Issues and Management Practice; The Wildfowl and Wetlands Trust Publisher: Slimbridge, UK, 2004. [Google Scholar]
- Colwell, M.A.; Taft, O.W. Waterbird communities in managed wetlands of varying water depth. Waterbirds 2000, 23, 45–55. [Google Scholar]
Publisher’s Note: MDPI stays neutral with regard to jurisdictional claims in published maps and institutional affiliations. |
© 2021 by the authors. Licensee MDPI, Basel, Switzerland. This article is an open access article distributed under the terms and conditions of the Creative Commons Attribution (CC BY) license (https://creativecommons.org/licenses/by/4.0/).