Abstract
Copepods have been known to be able to cause an increase in phytoplankton through trophic cascades, as copepods consume heterotrophic protists that feed on phytoplankton. However, how the intensity of copepod-induced trophic cascades varies with environmental conditions remains elusive. We hypothesized that a higher proportion of large phytoplankton in the phytoplankton size distribution, a higher stoichiometric quality of phytoplankton, and a higher temperature could mitigate the intensity of a trophic cascade through increasing direct grazing on phytoplankton by copepods. To explore this issue, we quantified the intensity of a trophic cascade as the difference in phytoplankton concentration reduction by grazing using in situ incubations with and without copepods in the East China Sea. We then investigated the relationship between the intensity of trophic cascades versus the slope of the normalized biomass size spectrum (NBSS) of the phytoplankton community, the C:N ratio of particulate organic matter (POM), and temperature. We found that the intensity of trophic cascades weakly decreased with the NBSS slope and increased with temperature; however, both relationships were not statistically significant. We did not find a clear relationship between the strength of the trophic cascades and the C:N ratio of POM. Our results do not support the hypothesis that the proportion of large phytoplankton, the stoichiometric quality of phytoplankton, and the temperature affect trophic cascades. Instead, we suggest that other critical factors, such as protist abundance, play a role in affecting trophic cascades in the plankton food web in the East China Sea. We further propose some issues which should be addressed when conducting in situ shipboard incubation.
1. Introduction
Trophic cascades are defined as indirect trophic interactions triggered by predators and propagate downward the food web, thus influencing the density and productivity of prey across more than one trophic level [1,2]. Trophic cascades have substantial impacts on food web dynamics and are widely found in aquatic ecosystems [3]. For example, in freshwater and marine food webs, the addition or removal of piscivores would change the abundance of planktivorous fishes, and the effects are propagated down to regulate the abundance of zooplankton and the grazing pressure of phytoplankton [4,5].
In plankton food webs, copepods are the key predators that have been known to be able to induce trophic cascades to microbes and phytoplankton [6,7]. Copepods, constituting about 80% of the mesozooplankton biomass in the ocean [8], play a central role in trophic transferring in marine food webs. As a predator of unicellular eukaryotic protists, copepods feed on and control the density of phytoplankton, heterotrophic protists, and other microplankton [9,10]. Copepods link the primary production and microbial production with higher trophic levels, regulating the abundance and productivity of their planktonic prey [6,11,12,13].
The preference of copepods for grazing on diverse unicellular eukaryotic protists affects the abundance and composition of phytoplankton via trophic cascades [7,14,15,16]. Heterotrophic protists, such as ciliates and heterotrophic dinoflagellates that consume phytoplankton, fall in the range of optimal prey sizes for copepods [11,17]; their higher stoichiometric and biochemical quality are usually preferred by copepods over autotrophic phytoplankton [11,18,19,20,21]. Therefore, the selective grazing of copepods on heterotrophic protists decreases the abundance of heterotrophic protists, reduces the grazing pressure of heterotrophic protists on phytoplankton [16,22,23], and indirectly increases the phytoplankton abundance [24,25].
Although the preference of copepods for heterotrophic protists is suggested to generate trophic cascades [26], the preference of copepods may change with the trophic state of the environment and alter the strength of trophic cascades. In more eutrophic environments, the phytoplankton community is dominated by large species, and copepods can thus directly feed on large phytoplankton, which reduces trophic cascades. On the contrary, in oligotrophic environments small phytoplankton dominate the community and copepods feed more on heterotrophic protists, inducing stronger trophic cascades [6]. In addition to the cell size of phytoplankton, and improved phytoplankton stoichiometric quality (i.e., lower C:N ratio) may shift the diet preference of copepods to phytoplankton [27,28,29,30] and lower the trophic cascade.
In addition to the cell size and stoichiometric quality of phytoplankton, changes in the dietary demand of copepods caused by temperature may alter the copepods’ prey preference. Temperature has been found to regulate copepod grazing and metabolic rate in lab-manipulated experiments [31,32,33]; high temperatures increase the demand for metabolic carbon, and thus copepods consume more phytoplankton for carbon supply [34,35]. High temperatures increase the ratio of phytoplankton in copepod diets and non-selective feeding, which is suggested to reduce the intensity of trophic cascades [36,37].
To understand the changes in the intensity of trophic cascades under different environmental conditions, in situ grazing experiments were conducted in the East China Sea (ECS) to estimate the intensity of trophic cascade in the plankton community. We proposed that (1) a higher proportion of large phytoplankton in the prey community, (2) improved phytoplankton stoichiometric quality (low phytoplankton C:N ratio), and (3) higher temperatures would reduce the intensity of trophic cascades by altering copepod prey preference for phytoplankton.
2. Materials and Methods
2.1. Study Area
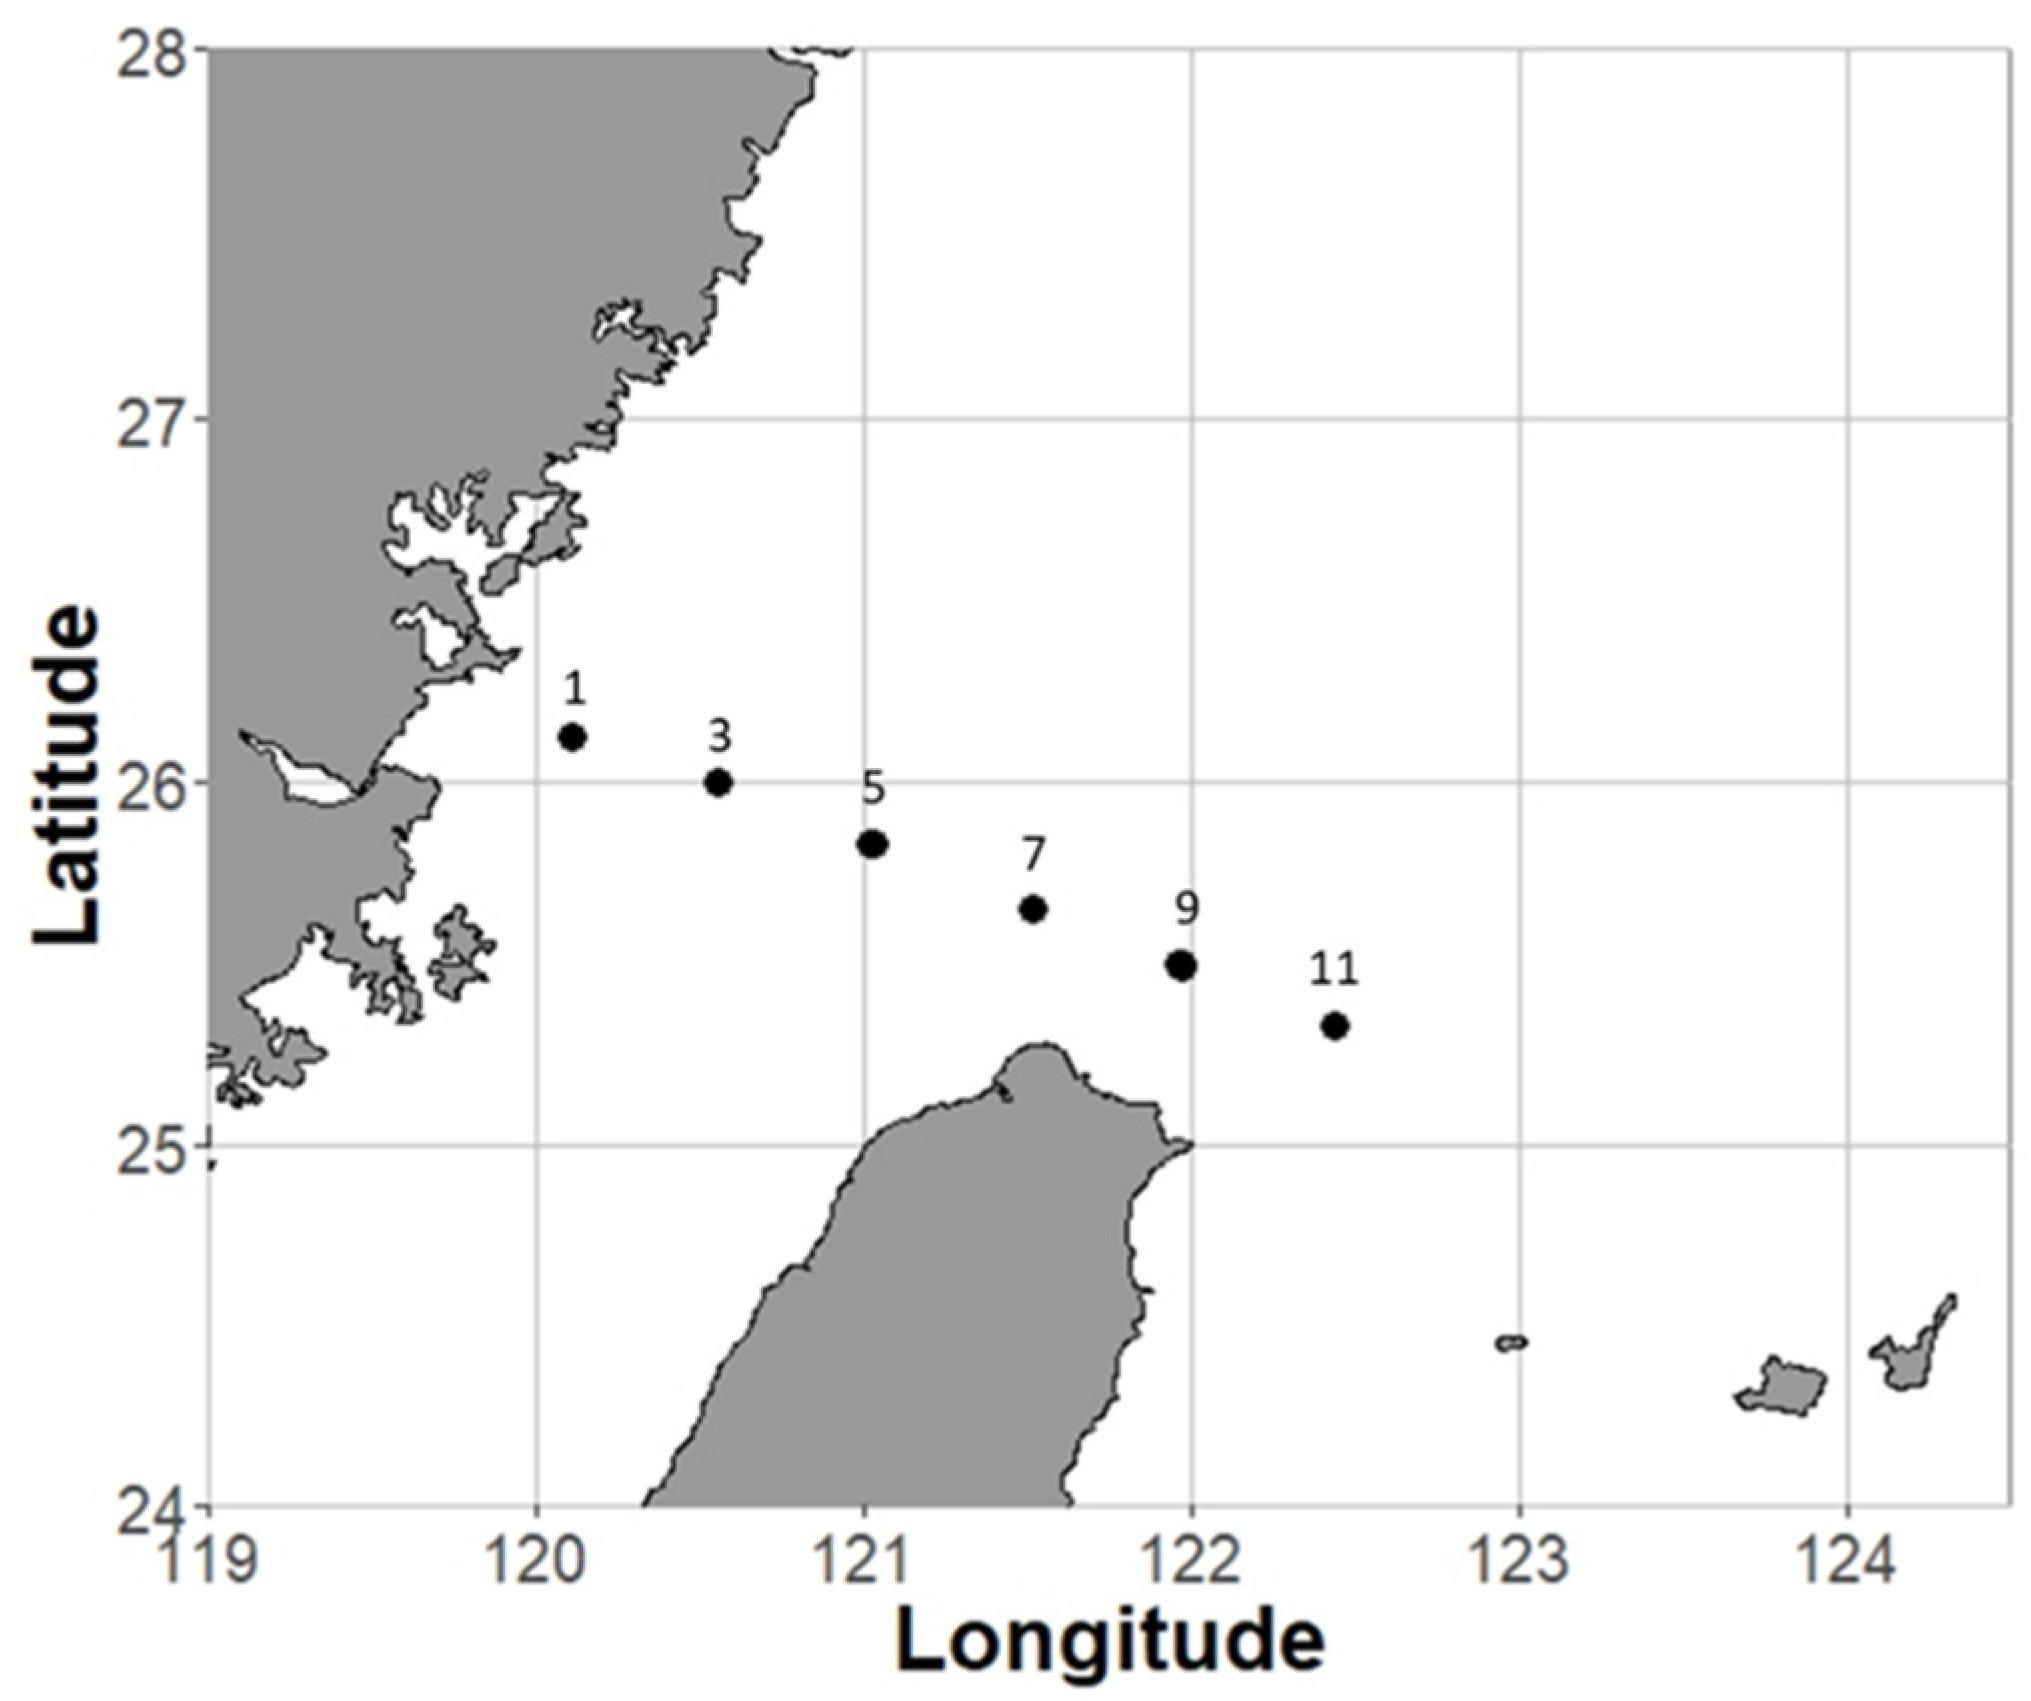
In situ grazing incubation experiments were conducted in the southern part of the East China Sea (ECS) during four cruises (15 incubation experiments) from September 2014 to June 2017 (Figure 1 and Table S1). The southern ECS is a subtropical continental shelf affected by several water masses and multiple ocean currents. Large environmental gradients, such as temperature and resource quantity, form from the coastal to offshore areas [38]. The strong environmental gradients make the southern ECS an ideal region in which to study the influence of environmental variations on trophic cascades (Figure S1).
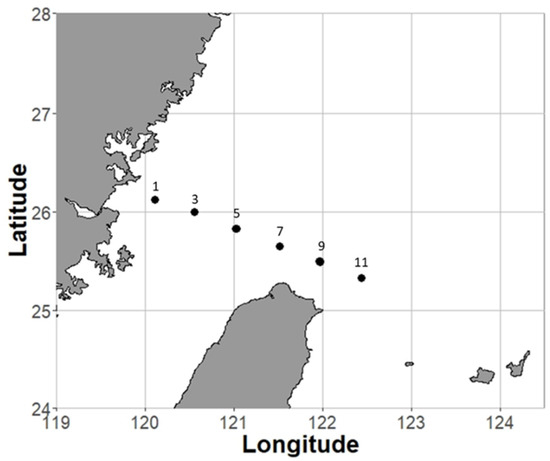
Figure 1.
Sampling area and sites (1, 3, 5, 7, 9, 11) in the southern East China Sea.
2.2. Shipboard Grazing Experiment
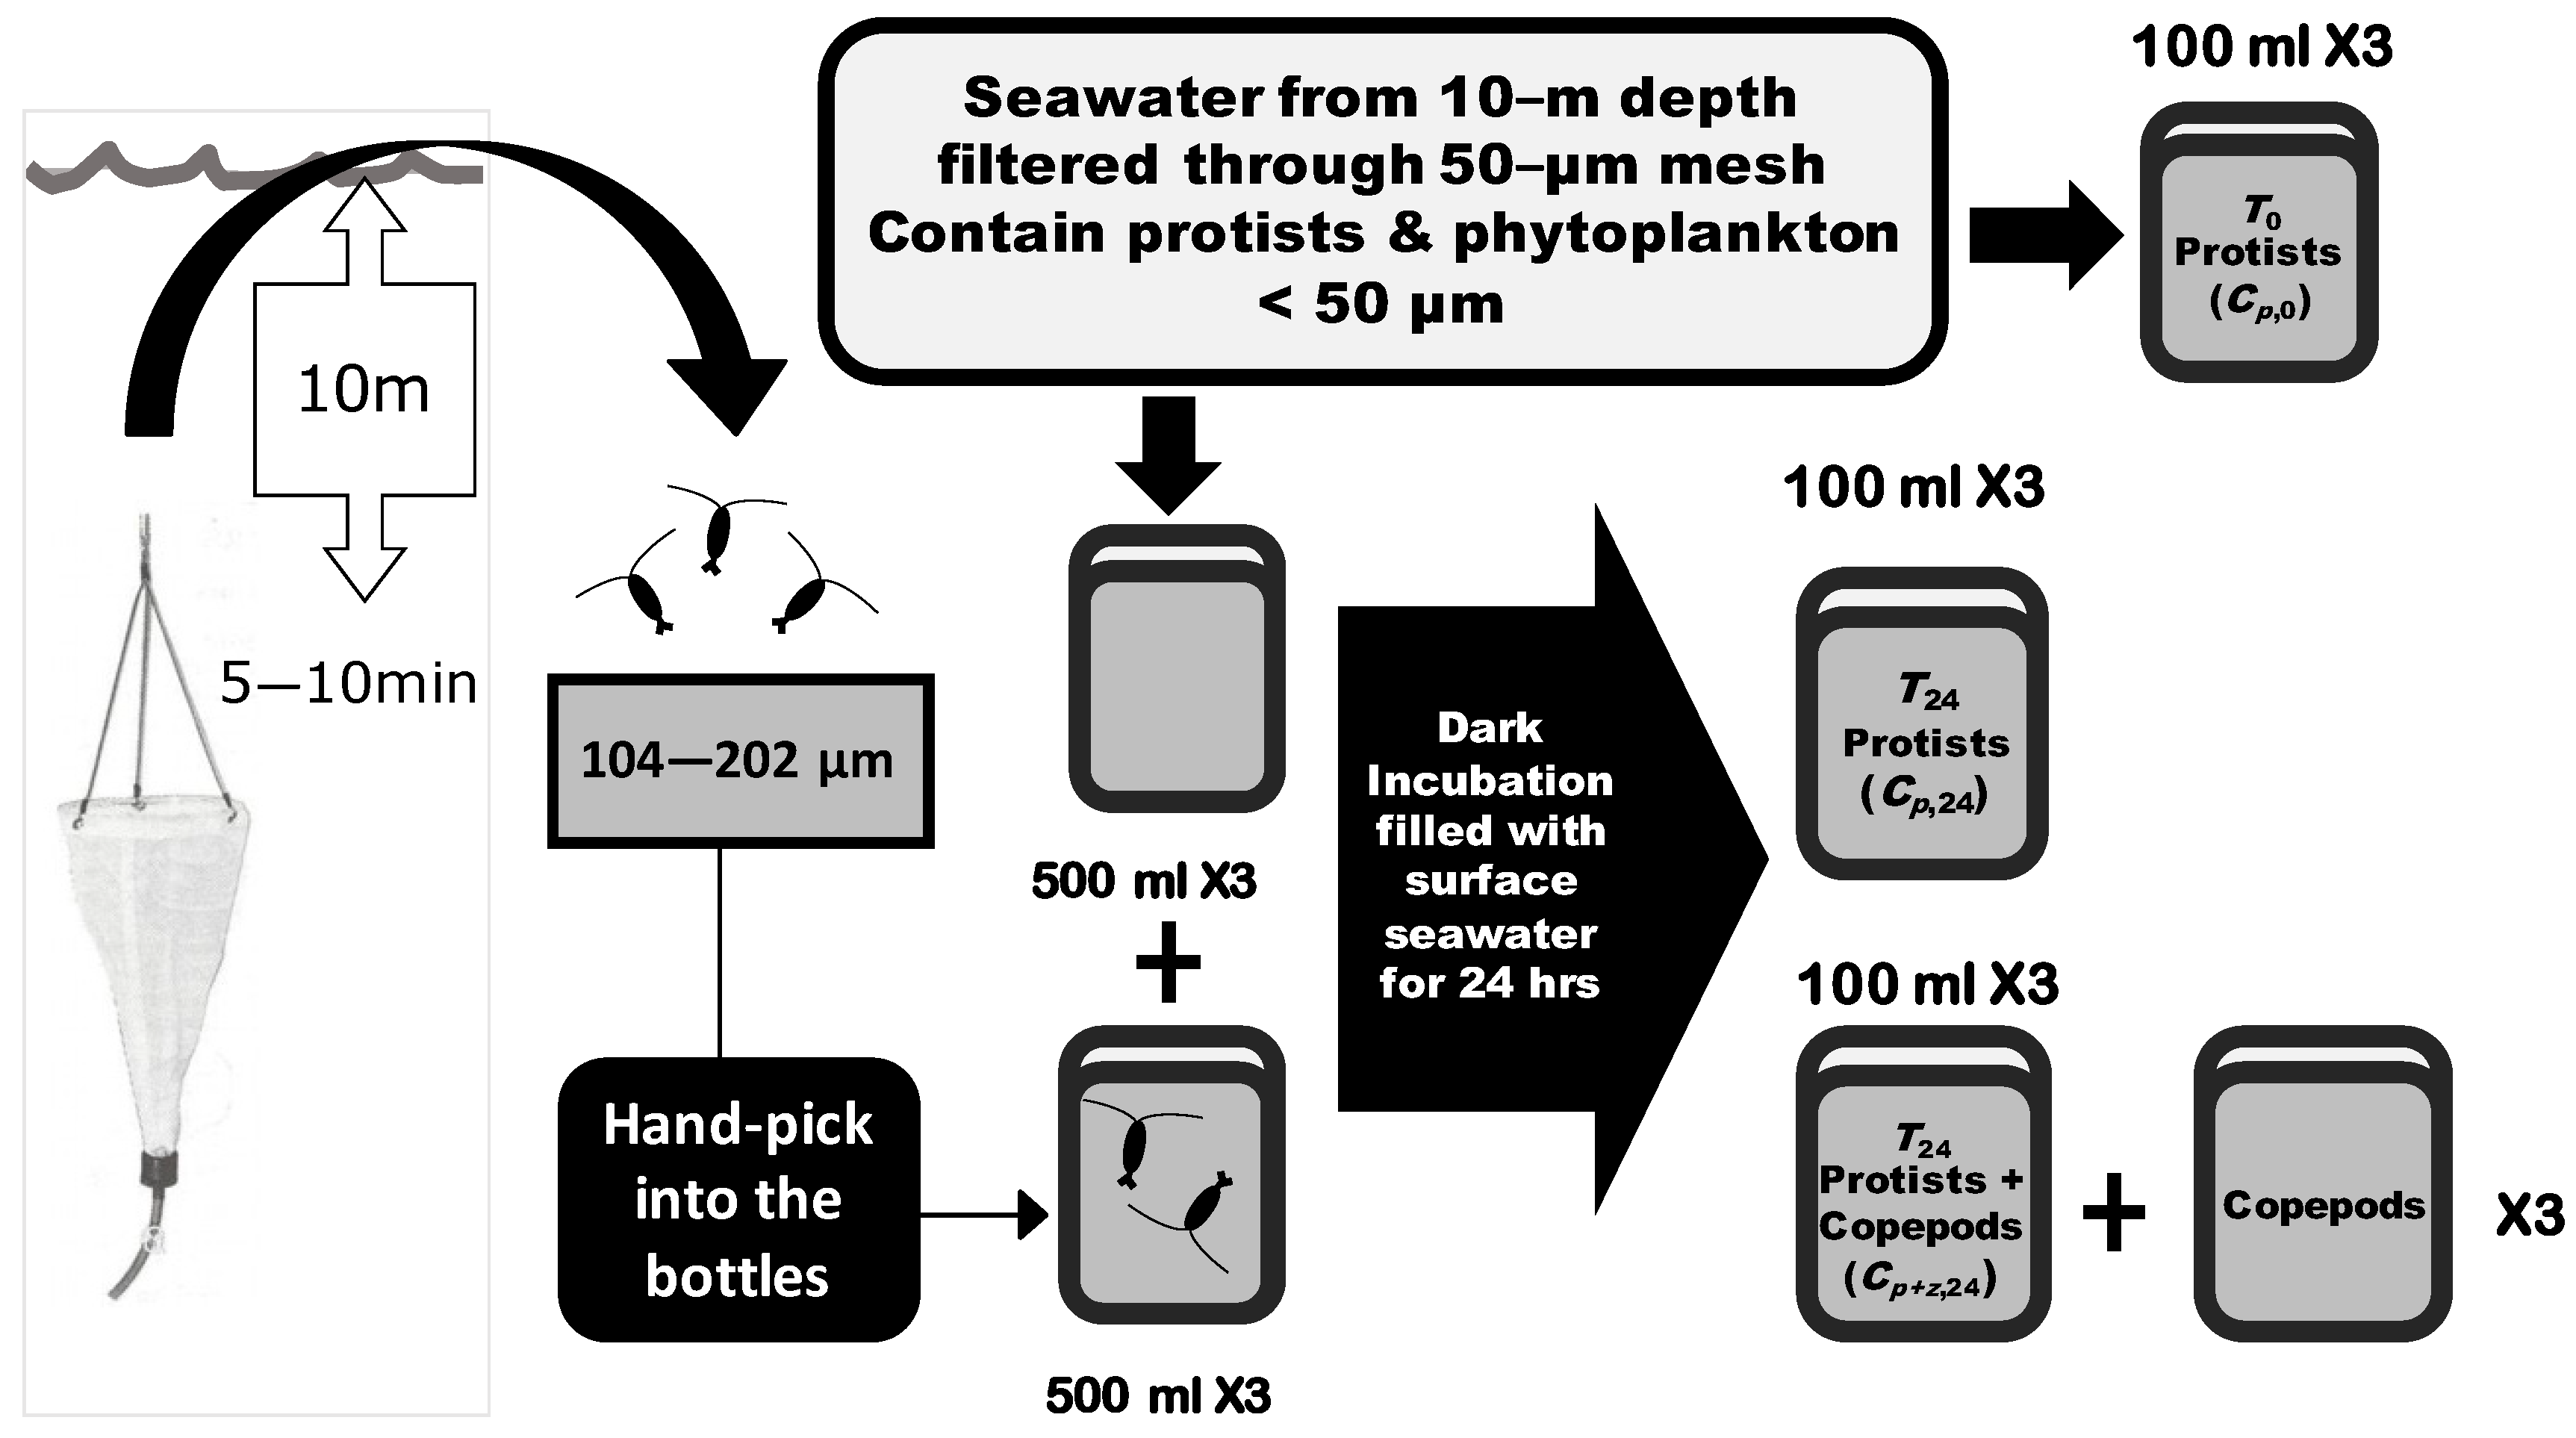
Incubation seawater was taken at a 10 m depth by 20 L Go-Flo bottles (General Oceanics). The collected seawater was filtered through a 50 μm mesh to exclude crustacean zooplankton and leave only unicellular heterotrophic protists and phytoplankton. Filtered seawater was then filled into 500 mL plastic bottles. For the control group, mesh-filtered seawater with only heterotrophic protists and phytoplankton was poured into three replicates of bottles. For the group with copepod grazing, the zooplankton community collected from the seawater was added into the bottles with filtered seawater. To collect living copepods, at each sampling site a 50 μm meshed Norpac net was set to a 10 m depth and allowed to drift with the ship for 5~10 min. The collected zooplankton were gently filtered through sieves of 202 and 104 μm sizes, and living zooplankton (mainly copepods) within this size range were randomly selected and placed into incubation bottles. The initial abundance of phytoplankton and heterotrophic protists were preserved in seawater-buffered 0.2% paraformaldehyde in 100 mL bottles in triplicate before the incubation (protists without cell walls may not be well preserved by this method). Both control and experimental bottles were incubated for 24 h in 200 L dark incubation tanks filled with constantly circulating surface seawater to inhibit photosynthesis (Figure 2).
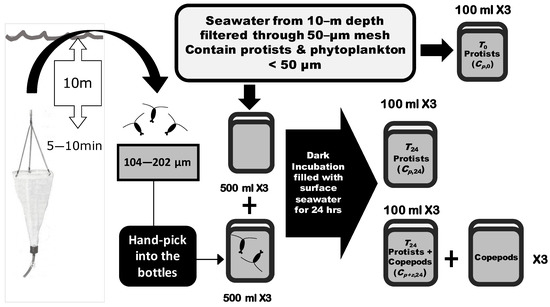
Figure 2.
Flowchart of shipboard grazing experiments. Plankton samples preserved for each experiment included (1) heterotrophic protists and phytoplankton at the beginning of incubation (T0 Protists, Cp,0); (2) heterotrophic protists and phytoplankton after 24 h of incubation without copepod addition (T24 Protists, Cp,24); (3) heterotrophic protists and phytoplankton after 24 h of incubation with copepod addition (T24 Protists + Copepods, Cp+z,24); (4) copepods added into the experimental bottles. The incubations with and without copepods were conducted in three replicates (×3) of 500 mL bottles. The density of heterotrophic protists and phytoplankton at the beginning Cp,0, the density of heterotrophic protists and phytoplankton without and with the addition of copepods after 24 h of incubation with Cp,24 and Cp+z,24, and the copepod community were collected from the three replicates (×3) of incubated bottles (100 mL from each bottle).
After incubation, zooplankton were preserved in seawater-buffered formalin (final concentration 5%) and phytoplankton and protist cells smaller than 50 μm in seawater-buffered paraformaldehyde (final concentration 0.2%). All zooplankton samples were preserved at room temperature and the phytoplankton and heterotrophic protist samples were preserved at 4 °C until analysis.
2.3. Phytoplankton Density
The carbon density of the phytoplankton before and after the grazing incubations was estimated using FlowCAM® (Yokogawa Fluid Imaging Technologies, Scarborough, Maine, USA), which automatically captures images of particles and is suitable for zooplankton grazing experiments [39]. Based on the abundance of phytoplankton in each sample, a subsample of 1~5 mL was examined by the FlowCAM® with a 10x magnification objective and 100 μm flowcells in autoimage mode. Due to the limitations in precision, only particles ranging from 5 to 50 μm were classified. Images of the particles were classified into phytoplankton cells and detritus. Phytoplankton cells were not further classified to taxonomic groups such as cyanobacteria and small diatoms, due to the limitations of the image resolution. After the classification, the phytoplankton carbon biomass density was calculated based on the biovolume using the carbon conversion factor [40] (Table S2) and the water volume of the sample. Heterotrophic protists were fragile to paraformaldehyde fixation and thus could not be quantified in this research.
2.4. Copepod Composition
The number of individuals of dominant copepod groups, including the copepodites of calanoids, oithonids (Order: Cyclopoida; Family: Oithonidae), harpacticoids, oncaeids (Suborder: Poecilostomatoida; Family: Oncaeidae), and corycaeids (Suborder: Poecilostomatoida; Family: Corycaeidae), as well as the nauplii of calanoids, cyclopoids, and harpacticoids, were enumerated using a dissecting microscope. Zooplankton other than copepods were found in our incubations, but the abundance of these animals was low (Table S3) and may not contribute to significant grazing effects on phytoplankton.
2.5. Intensity of Trophic Cascade
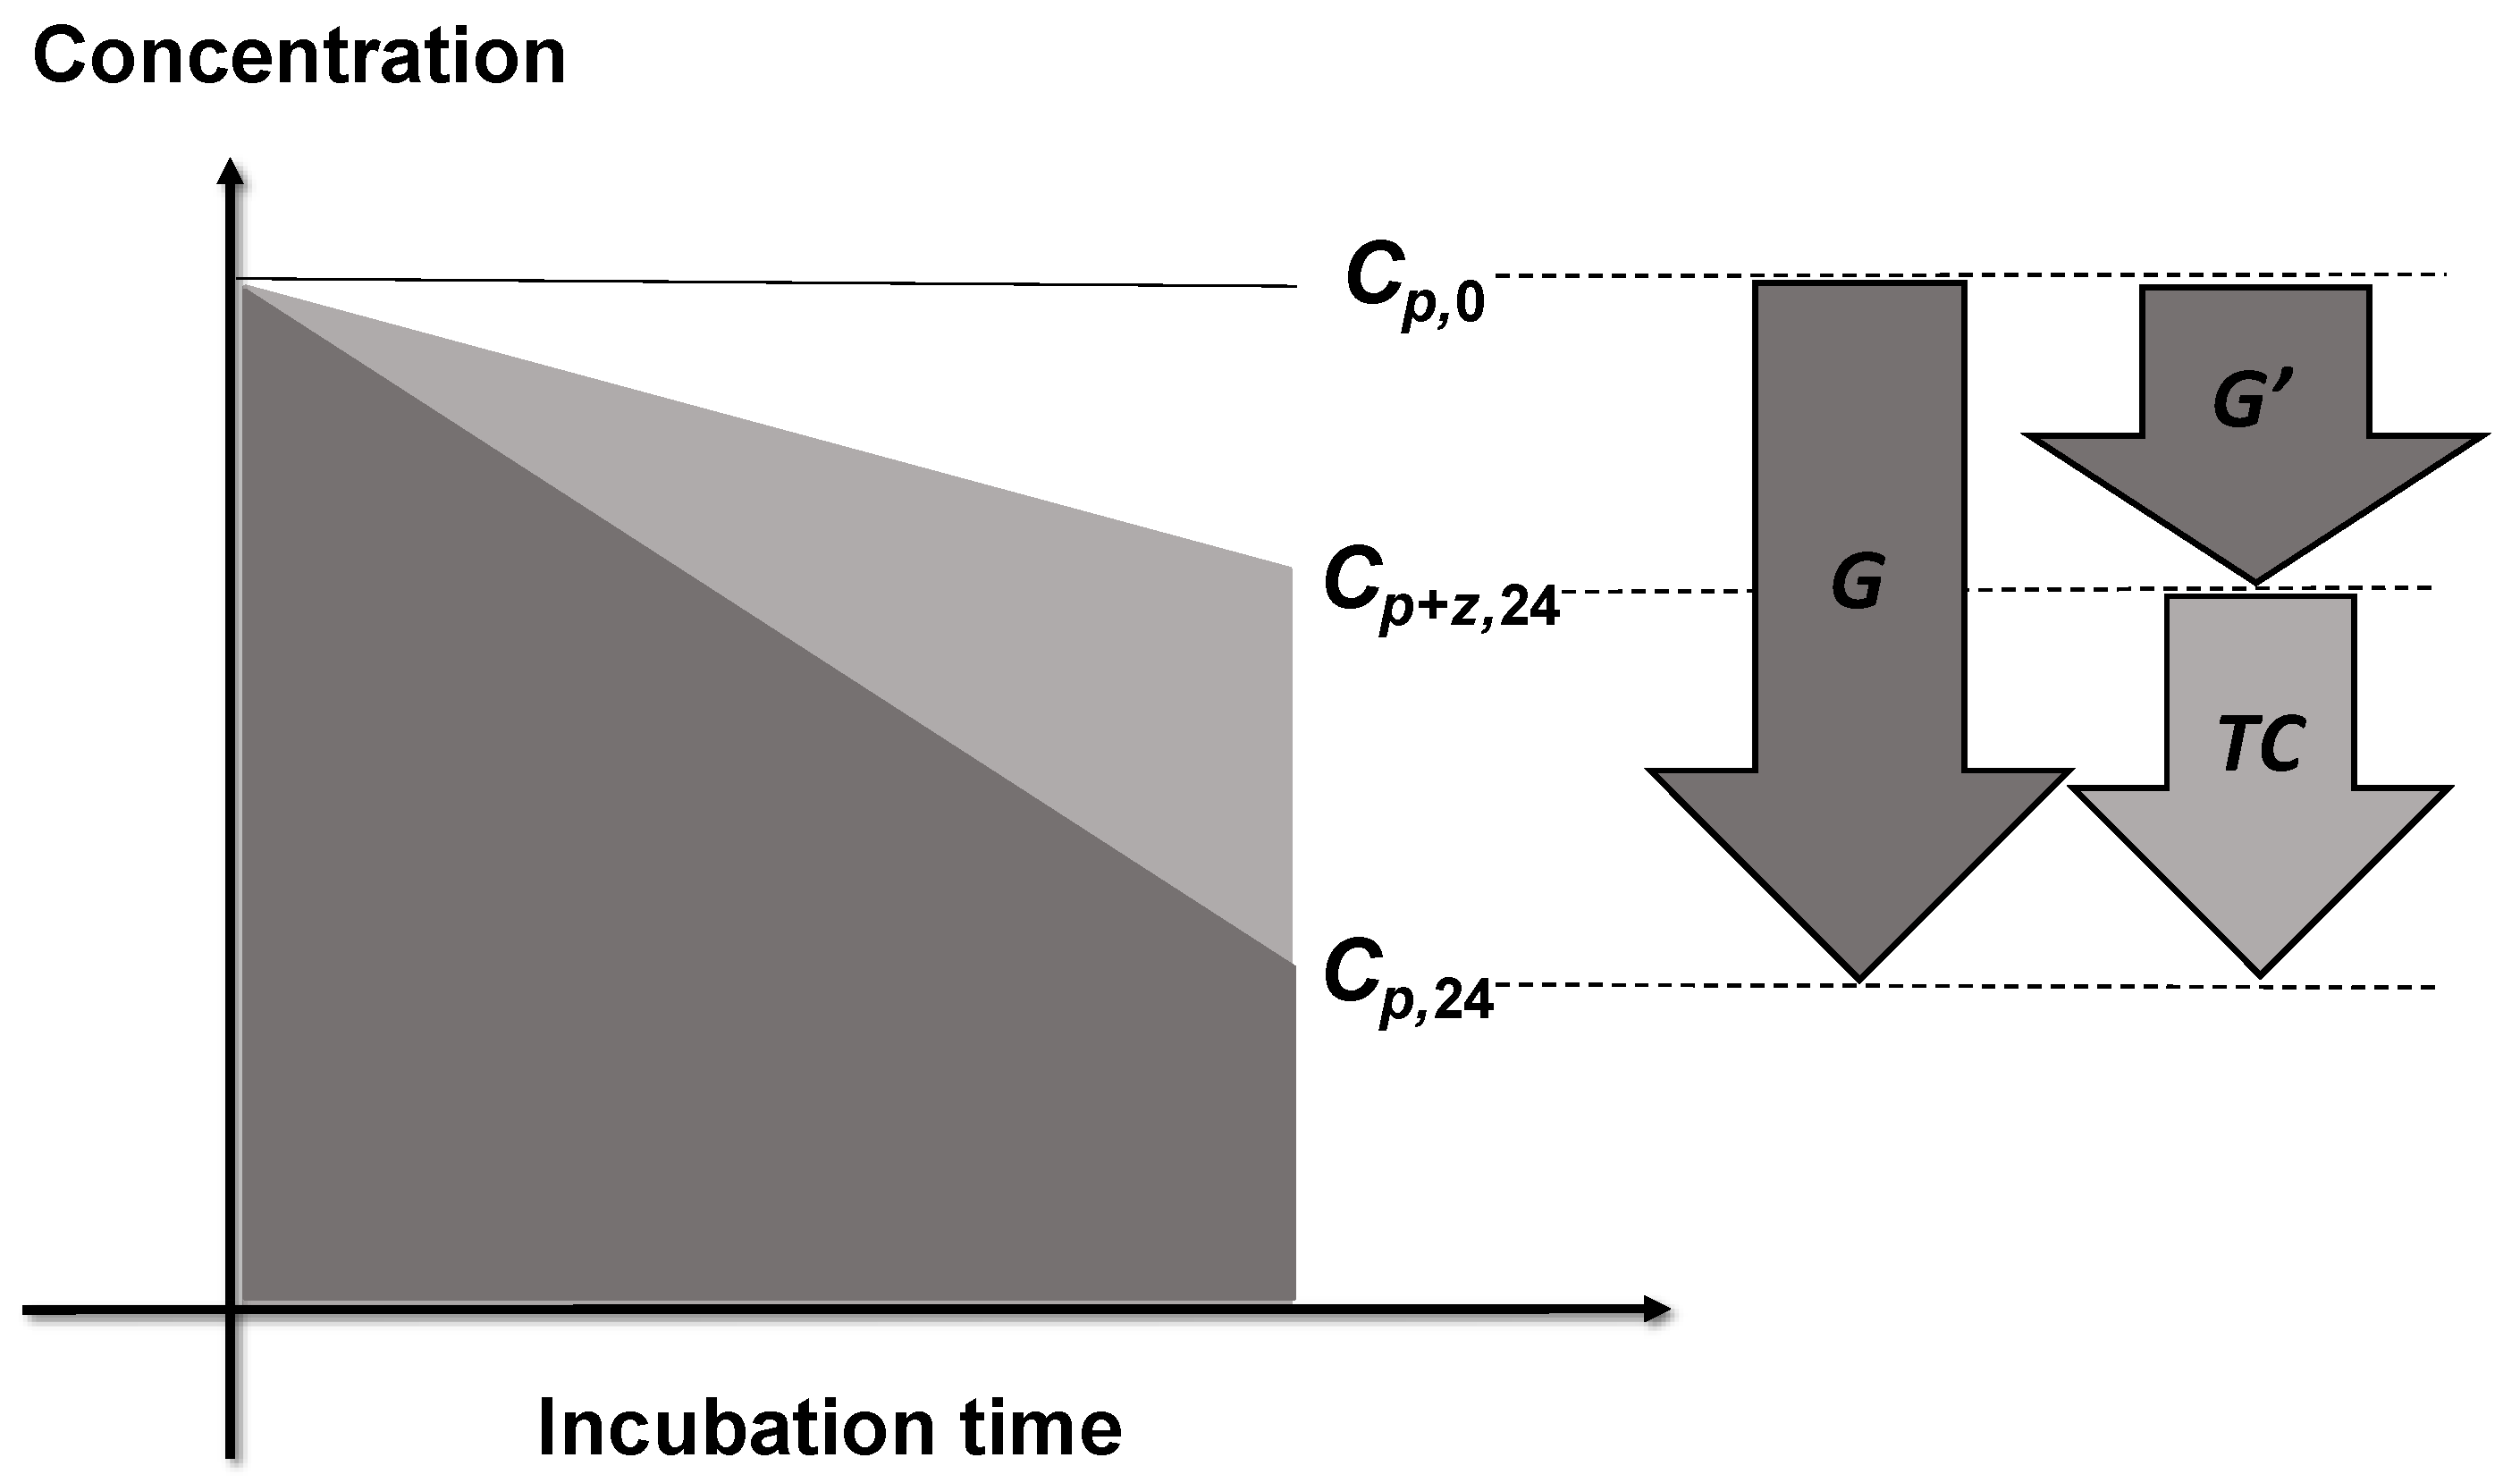
Trophic cascade (TC) was defined as the difference in the specific elimination rate between bottles with and without copepod grazing (G and G′ in Figure 3):
where Cp,0 is the initial phytoplankton carbon biomass density. Cp,24 and Cp+z,24 represent the phytoplankton carbon biomass density in the control group (without copepods) and the experimental group (with copepods) after T = 24 h of incubation, respectively.
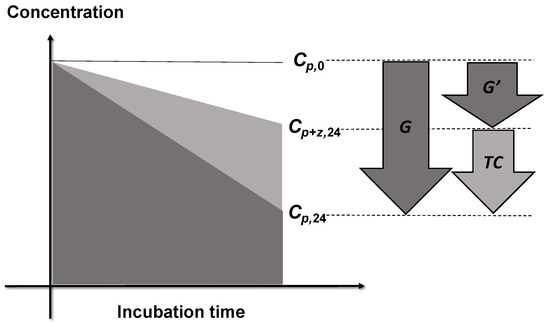
Figure 3.
Definition of the intensity of trophic cascades (TC). Concentrations of phytoplankton at the beginning of incubation are shown by Cp,0. Concentrations of phytoplankton in the bottles without and with copepod grazers after 24 h of incubation are Cp,24 and Cp+z,24, respectively. Copepods ingest protists, thus the grazing from protists on phytoplankton is reduced in the bottles containing copepods. As a consequence, the phytoplankton concentrations in the experimental bottles with copepods and heterotrophic protists are higher than those in the control bottles with only heterotrophic protists. The elimination rate in the experimental bottles (G′) is lower than the elimination rate in the control bottles (G) by trophic cascade.
The intensity of the trophic cascade in each experimental bottle was calculated as:
where is the mean specific elimination rate of the three replicates of the control group. and are the specific elimination rate and number of zooplankton in replicate i of the experimental group, respectively. If TC > 0, this incubation exhibited a trophic cascade; otherwise, no trophic cascade was observed.
2.6. Size Structure of Phytoplankton Community
To quantify the variation in the phytoplankton community size structure, the slope of the normalized biomass size spectrum (NBSS) was used as an indicator of the relative abundance of small versus large cells in a community [41]. If the relative density of large cells in one community is higher, then the NBSS slope is shallower (less negative). For each experiment, the phytoplankton body size distribution of three replicates before the incubation was combined and fitted to the normalized biovolume size spectrum:
where BS is the total biovolume (μm3) of size class S and Δs is the bin width of the body size class. On a log2-log2 scale, log2(a) is the intercept and b is the slope of the NBSS fitted to the linear regression.
2.7. Stoichiometric Quality of Phytoplankton
The C:N ratio of particulate organic matter (POM) was used as the index of phytoplankton stoichiometric quality. POM < 50 μm was collected from 4 depths spanning the euphotic zone. From each depth, 5 L of water collected by 20 L Go-Flo bottles was filtered through 50 μm mesh, and particles < 50 μm were filtered onto GF/F papers. The samples were frozen at −20 °C until analysis. Before measuring the C and N contents, POM samples were acidified by 1N HCl and dried to eliminate inorganic C. The C and N contents of POM were measured by an elemental analyzer (EA1108, Fisons, Italy, and FLASH 2000, Thermo SCIENTIFIC, Waltham, MA, USA) and the molar C:N ratio was calculated from the C and N contents.
2.8. Temperature
The temperature (°C) in the incubator was measured at day and night during the incubation in each cruise station.
2.9. Data Analyses
A linear model was fitted to the relationships between the intensity of the trophic cascade (TC) versus the phytoplankton NBSS slope, the C: N ratio of POM, and the temperature. For TC, the negative values were not included in the analysis, since there were no trophic cascades in the bottles. In addition, multiple linear regression was also conducted to find the combination of variables best explaining the variation in TC, with TC as the response variable and the NBSS slopes, the C:N ratio of POM, and temperature as the explanatory variables. All analyses were conducted using R version 4.0.4.
3. Results
Among the 15 experiments we conducted, trophic cascades (TC) were detected in 11 experiments (Table S4). In seven incubations with TC, phytoplankton growth was found; that is, a higher phytoplankton carbon density was found in the incubation bottles than in the initial phytoplankton community, indicating a negative elimination rate (Tables S5 and S6). Even though the elimination rate is negative, the intensity of TC can still be calculated if the increase in phytoplankton carbon density in bottles with copepods (G′) is larger than in bottles without copepods (G) (see Figure S2). The larger the increase in phytoplankton after incubation, the more negative the elimination rate. TC calculated from negative elimination rates are presented as triangular points in Figure 4, Figure 5 and Figure 6.

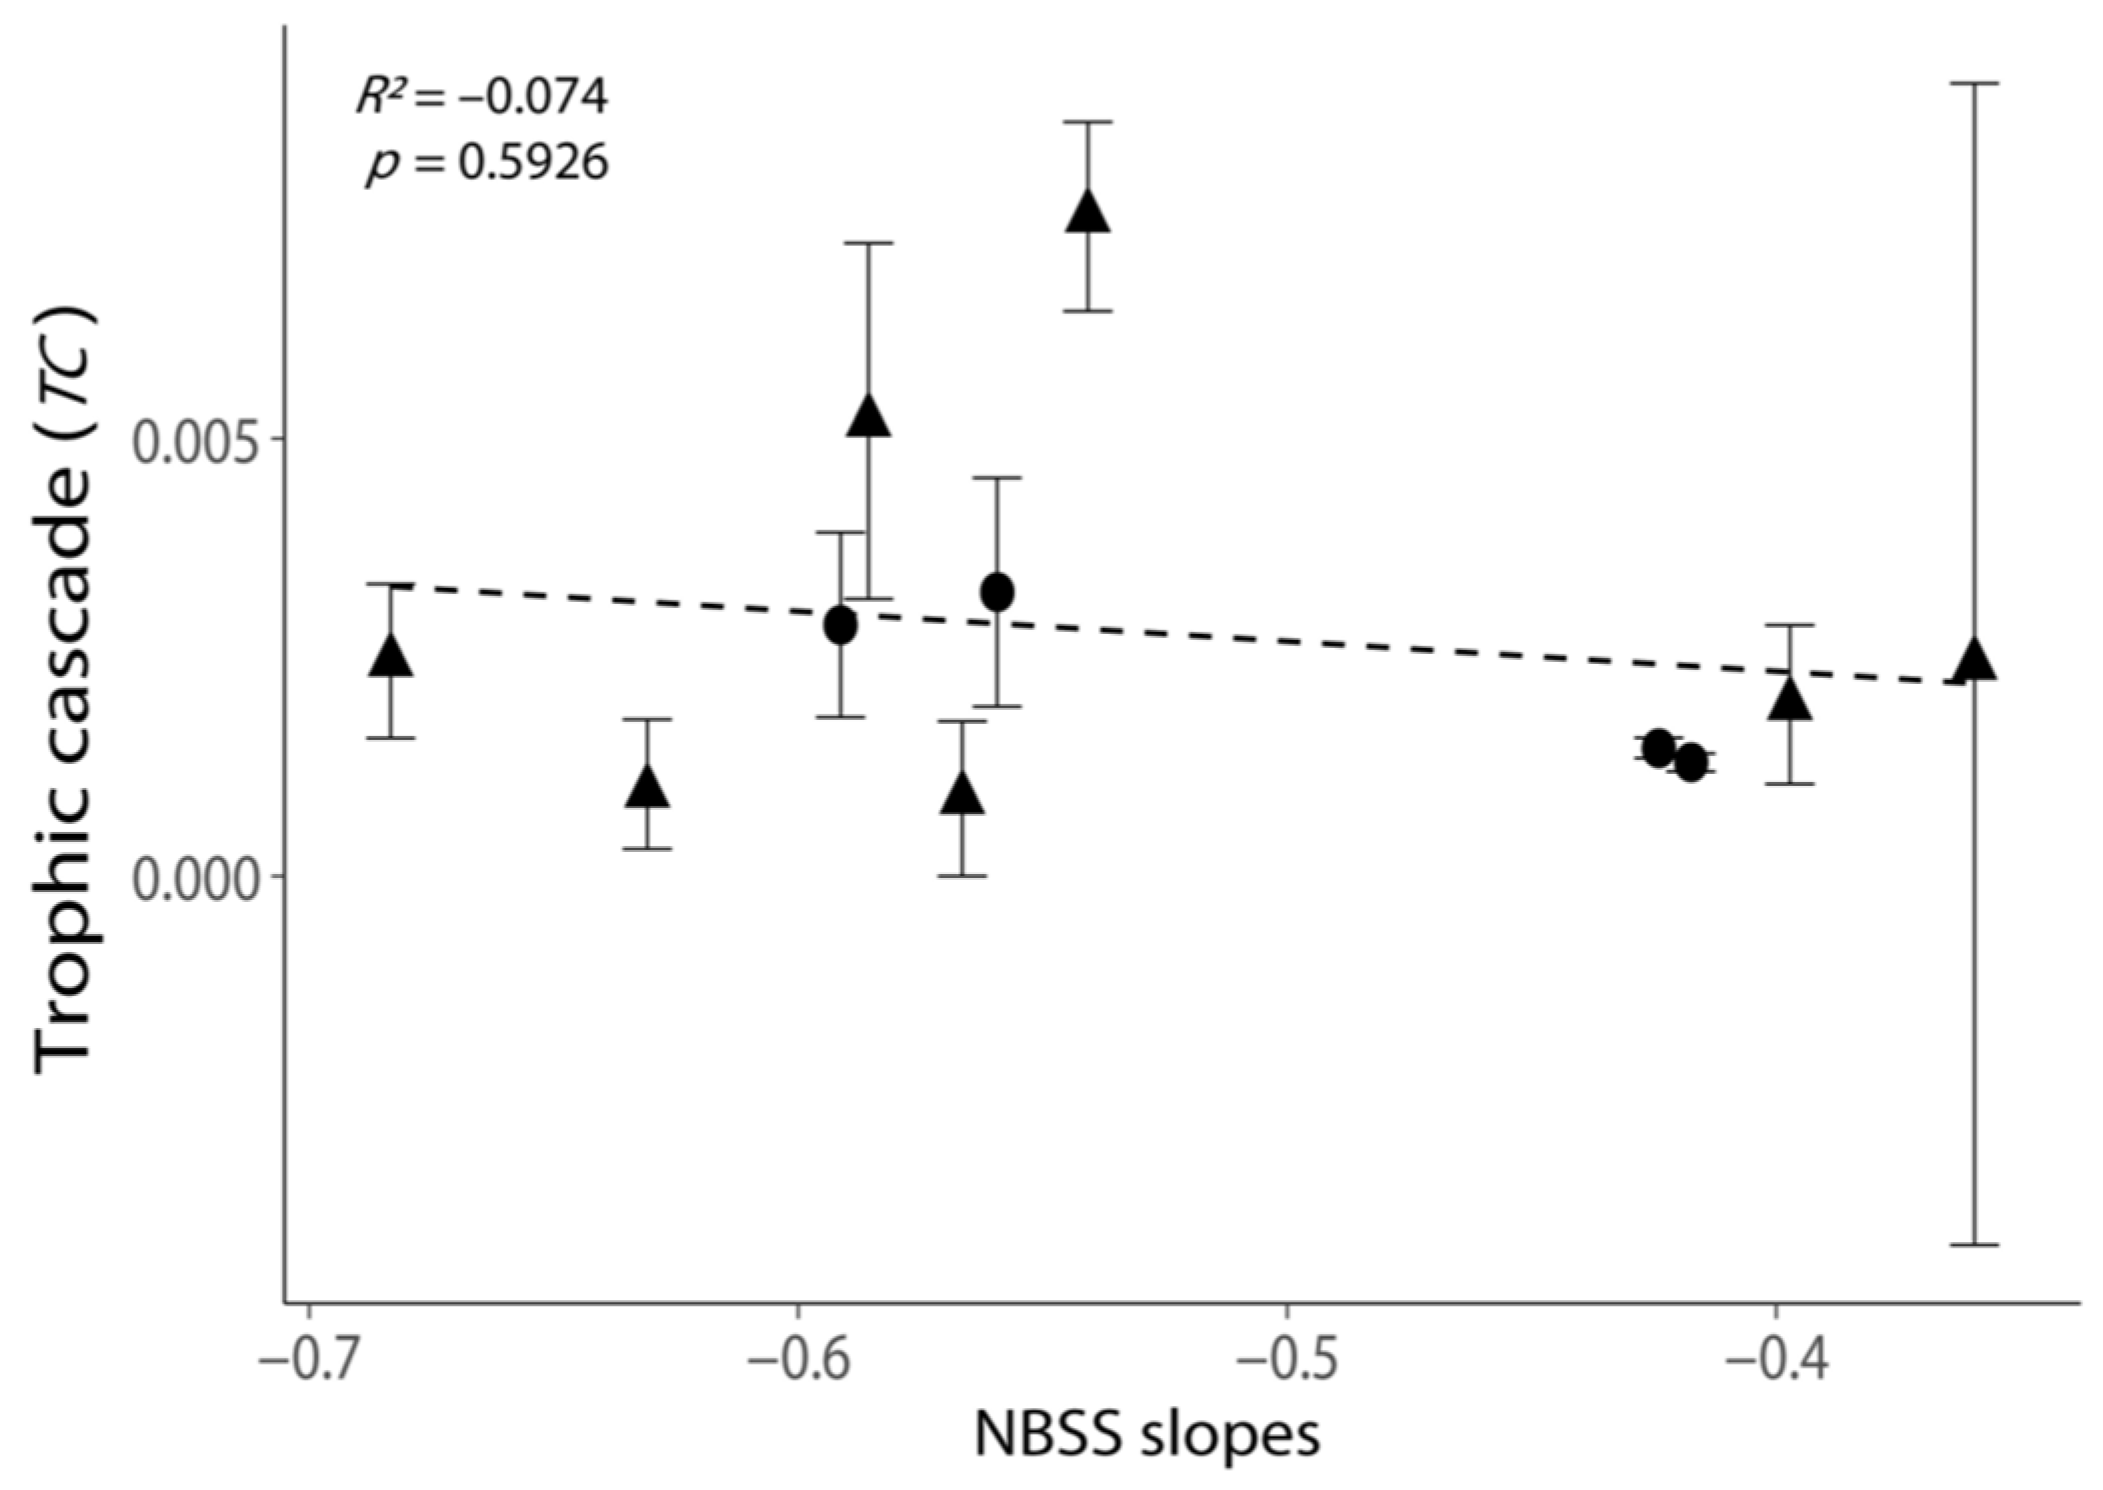
Figure 4.
Relationship between the intensities of trophic cascades (TC) and the NBSS slopes. All values are shown as the mean ± 1 standard error. Negative values of TC were removed, as these experiments exhibited no trophic cascade. Triangular points indicate the TC calculated from the incubations with phytoplankton growth (Figure S2). The dash line indicates the best-fit regression line.
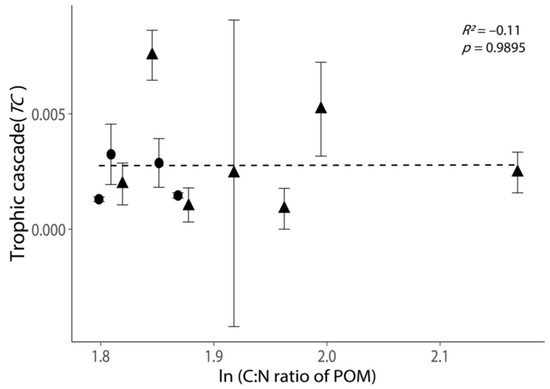
Figure 5.
Relationship between the intensities of trophic cascades (TC) and the C: N ratio of POM. All values are shown as the mean ± 1 standard error. Negative values of TC were removed, as these experiments exhibited no trophic cascade. Triangular points indicate the TC calculated from the incubations with phytoplankton growth (Figure S2). The dash line indicates the best-fit regression line.
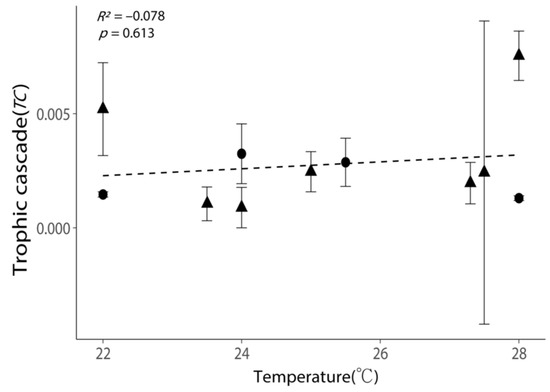
Figure 6.
Relationship between the intensities of trophic cascades (TC) and the incubation temperatures. All values are shown as the mean ± 1 standard error. Negative values of TC were removed, as these experiments exhibited no trophic cascade. Triangular points indicate the TC calculated from the incubations with phytoplankton growth (Figure S2). The dash line indicates the best-fit regression line.
NBSS slopes exhibited a weak positive relationship with TC (Figure 4, p = 0.5926), but the regression was not statistically significant. The TC was the highest when the NBSS slope was −0.566 (Table S8, cruise 2016_May_st09). The variation in TC was large when the NBSS slope was least negative due to the negative TC in one replicate (Figure 4; Table S6, elimination rate G′ > G in replicate 1 of cruise 2014_Oct_st09).
The C: N ratio of POM did not exhibit a clear relationship with TC (Figure 5, p = 0.9895). Moreover, the variation in TC was large when the C:N of POM was low (ln(C:N) < 1.9, Figure 5).
Temperature exhibited a weak positive relationship with TC; nevertheless, the positive relationship was not statistically significant (Figure 6, p = 0.613). High TC (>0.005) could occur in both low- and high-temperature conditions (Figure 6).
The best fitting linear model selected by AIC did not include any of the above factors (Table S7), indicating that the three factors we proposed could not explain the variation in TC well. The values of the NBSS slopes, temperature, and the C:N ratio of POM in each cruise station are shown in Table S8.
4. Discussion
4.1. Relationships between Intensity of Trophic Cascade versus Phytoplankton Size Distribution, Stoichiometric Composition and Temperature Are Not Clearly Identified
Our first hypothesis proposed that a higher proportion of large phytoplankton reduces the intensity of trophic cascades by shifting the copepod prey preference toward phytoplankton. However, we did not find a clear relationship between the size spectrum slope of the phytoplankton community and the trophic cascade. Previous studies have suggested that, instead of the proportion of large phytoplankton in prey communities, the density of phytoplankton that fall in the range of optimal prey size range of copepods (1/18 of copepod body size in equivalent spherical diameter [42]) more critically regulates copepod-phytoplankton trophic interactions [43,44,45]. Considering our incubations, the body lengths of copepod grazers ranged from 104 to 202 μm; as such, the optimal prey size of these copepods was between 5.8 and 11.2 μm. Thus, the intensity of a trophic cascade is expected to decrease when the density of phytoplankton within this size range increases. In our study, although the intensity of the trophic cascade exhibited a weak negative relationship with the density of phytoplankton within the optimal prey size range, the relationship was not statistically significant (p = 0.6088, Figure S3). Thus, the intensity of trophic cascades seems to be determined by other critical factors rather than phytoplankton size structure. One possibility is that diatom bloom lowers copepod ingestion and trophic cascades on phytoplankton, since feeding on bloom-forming diatoms inhibits development and causes the malformation of copepods [46]. However, in this study, we did not discuss the effect of diatoms on the ingestion and growth of copepods, due to limitations in the FlowCAM analysis. In addition to phytoplankton size and composition, the size structure of heterotrophic protists, which are also important prey of copepods, may also alter the intensity of trophic cascades [23,47]. Yet, in this study, the size distribution and density of heterotrophic protists could not be investigated, since heterotrophic protists preserved in paraformaldehyde solution in our samples had degraded before analysis. To better assess the effects of prey size, taxonomic composition and trophic structure on trophic cascades, phytoplankton and protists falling in the optimal prey size range should be better preserved and analyzed through flow cytometry and microscopy, instead of only studying the relative dominance of large phytoplankton cells by FlowCAM when estimating trophic cascades. Trophic cascades are expected to be stronger in phytoplankton size classes that are grazed by heterotrophic flagellates (smaller than 5 μm, considering the predator-prey length ratio of 1.3–1.4 [42]), but at the same time not by copepods (optimal prey range of 5.8–11.2 μm in this experiment [42]). However, in our results, the size-specific trophic cascade did not exhibit a clear pattern with phytoplankton cell size as the effects of the trophic cascade were detected in the phytoplankton community (Figures S4–S6). The size-specific elimination rates and trophic cascades in small size classes were reasonable, showing a clearer cascading effect. On the contrary, the cascading effect on large phytoplankton that were intensely grazed by copepods and/or heterotrophic protists could not be estimated; in these cases, phytoplankton were completely removed by copepods and/or protists, resulting in the unrealistic infinite elimination rates in large size classes (shaded positive bars in Figures S7–S9). Nevertheless, it is still difficult to identify the size classes in which size-specific trophic cascades regularly occur. To estimate trophic cascades, not only the prey preferences of copepods, but also prey preferences and the density of heterotrophic protists should be considered.
Higher phytoplankton stoichiometric quality (low C:N ratio) is expected to increase the prey preference of copepods for phytoplankton and reduce the intensity of trophic cascades. However, we did not find a positive relationship between the trophic cascades and the POM C:N ratio. One possible explanation is that the POM collected in the eutrophic zone may have contained particles other than phytoplankton, such as detritus with low nutritious values. Therefore, the C:N ratio of eutrophic POM may not have fully represented the C:N ratio of phytoplankton. Another explanation is that the phytoplankton stoichiometry is not the main factor that drives copepod prey selection in oceans [48]. Other prey traits—such as the prey’s resistance to ingestion—that may affect predator preference or prey mortality [49,50] are proposed to further influence the intensity of trophic cascades [51,52].
We hypothesized that higher temperatures enhance copepod metabolism, and thus shift the copepods’ prey preference toward phytoplankton that are rich in carbon and reduce trophic cascades. However, our results did not support this hypothesis. In natural environments, copepods are usually adapted to the seasonal variation of ambient temperature, and thus the effect of in situ temperature variation on copepod metabolism is relatively minor [53,54]. In order to observe the shift of copepod prey preference driven by temperature, incubation experiments with the gradient of temperature exceeding the range of temperature in their natural habitat is necessary [53].
The intensity of copepod-induced trophic cascades may be determined by critical factors other than our proposed hypotheses. One important piece of missing information is the dynamics and composition of heterotrophic protists. Heterotrophic protists are preferred by copepods and contribute to a considerable portion in copepod diets [11,17,20,55,56]; moreover, they are predators of phytoplankton [57,58,59,60,61]. The grazing impact from heterotrophic protists on phytoplankton is suggested to mediate the trophic cascade [62,63]. Our experiments considered only the prey preference of copepods on phytoplankton and the variation in phytoplankton composition and assumed that the abundance and composition of heterotrophic protists does not change in different environments and that the contribution of these protists to a copepod’s diet is constant, which may not be true [64]. Measuring the abundance and composition of heterotrophic protists and their influence on trophic cascades should be considered in in situ experiments.
4.2. Perspective of Experimental Design of Shipboard Incubation
For shipboard incubation, due to the difficulty of experimental manipulation in dynamical environments, confounding factors are much more than the well-controlled incubation conducted in the laboratory. If we aim to investigate plankton trophic dynamics, the conditions of both predator and prey in the incubation should be as natural as possible, so that the results can represent a realistic energy transfer in the plankton food web. According to our experience, certain issues must be considered in this kind of shipboard incubation.
To estimate the in situ grazing impact of predators, the density of a predator should be similar to natural conditions. In our grazing experiments, because the copepods in the experimental bottles were randomly picked by a dropper from a condensed copepod community collected by net tow, more than one hundred copepods could be incubated in some experimental bottles (Table S3). Such an unrealistically high copepod density may cause an extremely high grazing pressure on phytoplankton, which does not correspond to copepod grazing pressure under natural conditions. Furthermore, the large variation of copepod numbers in the replicates may bias the intensity of a trophic cascade (Table S3), since the number of copepods was used for standardization in the calculation of the intensity of the trophic cascade.
Optimal copepod density in the incubating containers could be determined according to the expected per capita clearance rates [65]. For example, the copepods should not clear more than 30–40% of the volume in the containers [66]. Thus, the grazing pressure from copepods to their preys would remain at a reasonable level. In addition to the initial predator density, predator mortality should also be considered, since it determines the actual grazing pressure the predators impose on prey. While collecting the copepods, the status of each copepod should be checked and only living individuals should be picked for the incubation. After incubation, the status of each copepod can be identified using neutral red staining [67]. Thus, to secure the realistic predator density and that only living individuals are included in the experiment, copepods are recommended to be individually picked [65,68] or filtered [69] into the incubating containers while setting up the incubation.
Changes to phytoplankton abundance and community structure by growth during incubation may cause biases in the estimation of grazing impact. Thus, dark incubation is applied to prevent photosynthesis and inhibit phytoplankton growth, so that the phytoplankton community structure and abundance are stable. However, we found that phytoplankton grew in many size classes in several experiments, leading to a higher phytoplankton carbon density in the bottles after dark incubation than that in the initial phytoplankton communities (Figure S2 and Table S5). This caused the unrealistic negative infinite size-specific elimination rate and trophic cascade (shaded negative bars in Figures S4–S9). In our study, dark incubation proved unable to completely inhibit phytoplankton growth and create a stable phytoplankton structure. Although most phytoplankton growth would be suppressed in the dark, some species can still increase their cell number even after several days of dark incubation [70,71]. Since the incubation in our study was conducted for only 24 h, phytoplankton metabolism and growth might have been reduced but not fully inhibited during the incubation.
5. Conclusions
In conclusion, although our study did not identify the factors influencing the intensity of trophic cascades on the phytoplankton community, it still provides a possible framework to investigate copepod-induced trophic cascades by in situ incubation. Our current experimental design cannot measure the density and composition of protists, and the control of copepod density incubated is not good enough. In addition, the growth of phytoplankton in dark incubation interrupts the estimation of trophic cascades. Critical factors such as protist abundance, phytoplankton community structure, and improved manipulation of copepod density during the experiment should be considered in future research.
Supplementary Materials
The following are available online at https://www.mdpi.com/article/10.3390/d13070299/s1, Figure S1–S9, Table S1–S8.
Author Contributions
T.-C.C., P.-C.H., and C.-h.H. conceived the research question. T.-C.C. and P.-C.H. conducted the in situ incubations. T.-C.C. conducted FlowCAM and microscopy analysis of phytoplankton and zooplankton. G.-C.G. measured environmental data in the East China Sea. T.-C.C. analyzed the data. T.-C.C. wrote the manuscript and P.-C.H., A.-Y.T. refined the structure of texts. All authors contributed to the revision. All authors have read and agreed to the published version of the manuscript.
Funding
This work was supported by the Ministry of Science and Technology, Taiwan.
Institutional Review Board Statement
Not applicable, for this study did not involve humans or animals.
Informed Consent Statement
Not applicable, for this study did not involve humans.
Data Availability Statement
All data are provided in the main text and the supplementary.
Acknowledgments
We thank the crew of Ocean Researcher II for sampling. We also thank Fan-Sian Lin for assisting FlowCAM analyses and classifying phytoplankton images, and Yu-Ching Lee for assisting copepods classification.
Conflicts of Interest
The authors declare no conflict of interest.
References
- Polis, G.A.; Sears, A.L.; Huxel, G.R.; Strong, D.R.; Maron, J. When is a trophic cascade a trophic cascade? Trends Ecol. Evol. 2000, 15, 473–475. [Google Scholar] [CrossRef]
- Ripple, W.J.; Estes, J.A.; Schmitz, O.J.; Constant, V.; Kaylor, M.J.; Lenz, A.; Motley, J.L.; Self, K.E.; Taylor, D.S.; Wolf, C. What is a trophic cascade? Trends Ecol. Evol. 2016, 31, 842–849. [Google Scholar] [CrossRef]
- Pace, M.L.; Cole, J.J.; Carpenter, S.R.; Kitchell, J.F. Trophic cascades revealed in diverse ecosystems. Trends Ecol. Evol. 1999, 14, 483–488. [Google Scholar] [CrossRef]
- Carpenter, S.R.; Kitchell, J.F.; Hodgson, J.R. Cascading trophic interactions and lake productivity. BioScience 1985, 35, 634–639. [Google Scholar] [CrossRef]
- Frank, K.T.; Petrie, B.; Choi, J.S.; Leggett, W.C. Trophic cascades in a formerly cod-dominated ecosystem. Science 2005, 308, 1621–1623. [Google Scholar] [CrossRef] [PubMed] [Green Version]
- Stibor, H.; Vadstein, O.; Diehl, S.; Gelzleichter, A.; Hansen, T.; Hantzsche, F.; Katechakis, A.; Lippert, B.; Løseth, K.; Peters, C. Copepods act as a switch between alternative trophic cascades in marine pelagic food webs. Ecol. Lett. 2004, 7, 321–328. [Google Scholar] [CrossRef]
- Pree, B.; Larsen, A.; Egge, J.K.; Simonelli, P.; Madhusoodhanan, R.; Tsagaraki, T.M.; Våge, S.; Erga, S.R.; Bratbak, G.; Thingstad, T.F. Dampened copepod-mediated trophic cascades in a microzooplankton-dominated microbial food web: A mesocosm study. Limnol. Oceanogr. 2017, 62, 1031–1044. [Google Scholar] [CrossRef]
- Kiørboe, T. Population regulation and role of mesozooplankton in shaping marine pelagic food webs. Hydrobiologia 1997, 363, 13–27. [Google Scholar] [CrossRef]
- Atkinson, A. Subantarctic copepods in an oceanic, low chlorophyll environment: Ciliate predation, food selectivity and impact on prey populations. Mar. Ecol. Prog. Ser. 1996, 130, 85–96. [Google Scholar] [CrossRef] [Green Version]
- Saiz, E.; Calbet, A. Copepod feeding in the ocean: Scaling patterns, composition of their diet and the bias of estimates due to microzooplankton grazing during incubations. Hydrobiologia 2011, 666, 181–196. [Google Scholar] [CrossRef] [Green Version]
- Calbet, A.; Saiz, E. The ciliate-copepod link in marine ecosystems. Aquat. Microb. Ecol. 2005, 38, 157–167. [Google Scholar] [CrossRef]
- Steinberg, D.K.; Landry, M.R. Zooplankton and the ocean carbon cycle. Annu. Rev. Mar. Sci. 2017, 9, 413–444. [Google Scholar] [CrossRef]
- Uye, S.I.; Nagano, N.; Shimazu, T. Abundance, biomass, production and trophic roles of micro- and net-zooplankton in Ise Bay, central Japan, in Winter. J. Oceanogr. 2000, 56, 389–398. [Google Scholar] [CrossRef]
- Calbet, A.; Landry, M.R. Mesozooplankton influences on the microbial food web: Direct and indirect trophic interactions in the oligotrophic open ocean. Limnol. Oceanogr. 1999, 44, 1370–1380. [Google Scholar] [CrossRef]
- Katechakis, A.; Stibor, H.; Sommer, U.; Hansen, T. Changes in the phytoplankton community and microbial food web of Blanes Bay (Catalan Sea, NW Mediterranean) under prolonged grazing pressure by doliolids (Tunicata), cladocerans or copepods (Crustacea). Mar. Ecol. Prog. Ser. 2002, 234, 55–69. [Google Scholar] [CrossRef]
- Schnetzer, A.; Caron, D.A. Copepod grazing impact on the trophic structure of the microbial assemblage of the San Pedro Channel, California. J. Plankton Res. 2005, 27, 959–971. [Google Scholar] [CrossRef]
- Campbell, R.G.; Sherr, E.B.; Ashjian, C.J.; Plourde, S.; Sherr, B.F.; Hill, V.; Stockwell, D.A. Mesozooplankton prey preference and grazing impact in the western Arctic Ocean. Deep-Sea Res. Part. II 2009, 56, 1274–1289. [Google Scholar] [CrossRef]
- Broglio, E.; Saiz, E.; Calbet, A.; Trepat, I.; Alcaraz, M. Trophic impact and prey selection by crustacean zooplankton on the microbial communities of an oligotrophic coastal area (NW Mediterranean Sea). Aquat. Microb. Ecol. 2004, 35, 65–78. [Google Scholar] [CrossRef] [Green Version]
- Golz, A.L.; Burian, A.; Winder, M. Stoichiometric regulation in micro-and mesozooplankton. J. Plankton Res. 2015, 37, 293–305. [Google Scholar] [CrossRef] [Green Version]
- Levinsen, H.; Turner, J.T.; Nielsen, T.G.; Hansen, B.W. On the trophic coupling between protists and copepods in arctic marine ecosystems. Mar. Ecol. Prog. Ser. 2000, 204, 65–77. [Google Scholar] [CrossRef]
- Sherr, E.B.; Sherr, B.F. Heterotrophic dinoflagellates: A significant component of microzooplankton biomass and major grazers of diatoms in the sea. Mar. Ecol. Prog. Ser. 2007, 352, 187–197. [Google Scholar] [CrossRef] [Green Version]
- York, J.K.; McManus, G.B.; Kimmerer, W.J.; Slaughter, A.M.; Ignoffo, T.R. Trophic links in the plankton in the low salinity zone of a large temperate estuary: Top-down effects of introduced copepods. Estuar. Coasts 2014, 37, 576–588. [Google Scholar] [CrossRef]
- Zöllner, E.; Hoppe, H.G.; Sommer, U.; Jürgens, K. Effect of zooplankton-mediated trophic cascades on marine microbial food web components (bacteria, nanoflagellates, ciliates). Limnol. Oceanogr. 2009, 54, 262–275. [Google Scholar] [CrossRef]
- Leising, A.W.; Pierson, J.J.; Halsband-Lenk, C.; Horner, R.; Postel, J. Copepod grazing during spring blooms: Can Pseudocalanus newmani induce trophic cascades? Prog. Oceanogr. 2005, 67, 406–421. [Google Scholar] [CrossRef]
- Nejstgaard, J.C.; Gismervik, I.; Solberg, P.T. Feeding and reproduction by Calanus finmarchicus, and microzooplankton grazing during mesocosm blooms of diatoms and the coccolithophore Emiliania huxleyi. Mar. Ecol. Prog. Ser. 1997, 147, 197–217. [Google Scholar] [CrossRef]
- Wickham, S.A. Trophic relations between cyclopoid copepods and ciliated protists: Complex interactions link the microbial and classic food webs. Limnol. Oceanogr. 1995, 40, 1173–1181. [Google Scholar] [CrossRef]
- Boersma, M.; Kreutzer, C. Life at the edge: Is food quality really of minor importance at low quantities? Ecology 2002, 83, 2552–2561. [Google Scholar] [CrossRef]
- Cowles, T.J.; Olson, R.J.; Chisholm, S.W. Food selection by copepods: Discrimination on the basis of food quality. Mar. Biol. 1988, 100, 41–49. [Google Scholar] [CrossRef]
- Houde, S.E.L.; Roman, M.R. Effects of food quality on the functional ingestion response of the copepod Acartia tonsa. Mar. Ecol. Prog. Ser. 1987, 40, 69–77. [Google Scholar] [CrossRef]
- Mitra, A.; Flynn, K.J. Predator–prey interactions: Is ‘ecological stoichiometry’ sufficient when good food goes bad? J. Plankton Res. 2005, 27, 393–399. [Google Scholar] [CrossRef] [Green Version]
- Hirst, A.G.; Bunker, A.J. Growth of marine planktonic copepods: Global rates and patterns in relation to chlorophyll a, temperature, and body weight. Limnol. Oceanogr. 2003, 48, 1988–2010. [Google Scholar] [CrossRef] [Green Version]
- Ikeda, T.; Kanno, Y.; Ozaki, K.; Shinada, A. Metabolic rates of epipelagic marine copepods as a function of body mass and temperature. Mar. Biol. 2001, 139, 587–596. [Google Scholar] [CrossRef]
- Møller, E.F.; Maar, M.; Maar, M.; Jónasdóttir, S.H.; Nielsen, T.G.; Tönnesson, K. The effect of changes in temperature and food on the development of Calanus finmarchicus and Calanus helgolandicus populations. Limnol. Oceanogr. 2012, 57, 211–220. [Google Scholar] [CrossRef]
- Boersma, M.; Mathew, K.A.; Niehoff, B.; Schoo, K.L.; Franco-Santos, R.M.; Meunier, C.L. Temperature driven changes in the diet preference of omnivorous copepods: No more meat when it’s hot? Ecol. Lett. 2016, 19, 45–53. [Google Scholar] [CrossRef] [PubMed]
- Malzahn, A.M.; Doerfler, D.; Boersma, M. Junk food gets healthier when it’s warm. Limnol. Oceanogr. 2016, 61, 1677–1685. [Google Scholar] [CrossRef] [Green Version]
- Shurin, J.B.; Borer, E.T.; Seabloom, E.W.; Anderson, K.; Blanchette, C.A.; Broitman, B.; Cooper, S.D.; Halpern, B.S. A cross-ecosystem comparison of the strength of trophic cascades. Ecol. Lett. 2002, 5, 785–791. [Google Scholar] [CrossRef]
- Vadeboncoeur, Y.; McCann, K.S.; Zanden, M.J.V.; Rasmussen, J.B. Effects of multi-chain omnivory on the strength of trophic control in lakes. Ecosystems 2005, 8, 682–693. [Google Scholar] [CrossRef] [Green Version]
- Gong, G.C.; Wen, Y.H.; Wang, B.W.; Liu, G.J. Seasonal variation of chlorophyll a concentration, primary production and environmental conditions in the subtropical East China Sea. Deep-Sea Res. Part. II 2003, 50, 1219–1236. [Google Scholar] [CrossRef]
- Ide, K.; Takahashi, K.; Kuwata, A.; Nakamachi, M.; Saito, H. A rapid analysis of copepod feeding using FlowCAM. J. Plankton Res. 2008, 30, 275–281. [Google Scholar] [CrossRef] [Green Version]
- Menden-Deuer, S.; Lessard, E.J. Carbon to volume relationships for dinoflagellates, diatoms, and other protist plankton. Limnol. Oceanogr. 2000, 45, 569–579. [Google Scholar] [CrossRef] [Green Version]
- Platt, T.; Denman, K. Organisation in the pelagic ecosystem. Helgoländer Wissenschaftliche Meeresuntersuchungen 1977, 30, 575–581. [Google Scholar] [CrossRef]
- Hansen, B.; Bjornsen, P.K.; Hansen, P.J. The size ratio between planktonic predators and their prey. Limnol. Oceanogr. 1994, 39, 395–403. [Google Scholar] [CrossRef] [Green Version]
- Barnes, C.; Maxwell, D.; Reuman, D.C.; Jennings, S. Global patterns in predator–prey size relationships reveal size dependency of trophic transfer efficiency. Ecology 2010, 91, 222–232. [Google Scholar] [CrossRef] [Green Version]
- Brooks, J.L.; Dodson, S.I. Predation, body size, and composition of plankton. Science 1965, 150, 28–35. [Google Scholar] [CrossRef] [PubMed]
- García-Comas, C.; Sastri, A.R.; Ye, L.; Chang, C.Y.; Lin, F.S.; Su, M.S.; Gong, G.C.; Hsieh, C.H. Prey size diversity hinders biomass trophic transfer and predator size diversity promotes it in planktonic communities. Proc. R. Soc. B 2016, 283, 2015–2129. [Google Scholar] [CrossRef] [PubMed] [Green Version]
- Ianora, A.; Miralto, A.; Poulet, S.; Carotenuto, Y.; Buttino, I.; Romano, G.; Casotti, R.; Pohnert, G.; Wichard, T.; Colucci-D’Amato, L.; et al. Aldehyde suppression of copepod recruitment in blooms of a ubiq-uitous planktonic diatom. Nature 2004, 429, 403–407. [Google Scholar] [CrossRef] [PubMed]
- Zöllner, E.; Santer, B.; Boersma, M.; Hoppe, H.G.; Jürgens, K. Cascading predation effects of Daphnia and copepods on microbial food web components. Freshw. Biol. 2003, 48, 2174–2193. [Google Scholar] [CrossRef] [Green Version]
- Lürling, M. Grazing resistance in phytoplankton. Hydrobiologia 2021, 848, 237–249. [Google Scholar] [CrossRef]
- Isari, S.; Antomicron, M.; Saiz, E. Copepod foraging on the basis of food nutritional quality: Can copepods really choose? PLoS ONE 2013, 8, e84742. [Google Scholar] [CrossRef]
- Vad, C.F.; Schneider, C.; Lukić, D.; Horváth, Z.; Kainz, M.J.; Stibor, H.; Ptacnik, R. Grazing resistance and poor food quality of a widespread mixotroph impair zooplankton secondary production. Oecologia 2020, 193, 489–502. [Google Scholar] [CrossRef]
- Ehrlich, E.; Gaedke, U. Coupled changes in traits and biomasses cascading through a tritrophic plankton food web. Limnol. Oceanogr. 2020, 65, 2502–2514. [Google Scholar] [CrossRef]
- Hall, S.R.; Shurin, J.B.; Diehl, S.; Nisbet, R.M. Food quality, nutrient limitation of secondary production, and the strength of trophic cascades. Oikos 2007, 116, 1128–1143. [Google Scholar] [CrossRef]
- Saiz, E.; Calbet, A. Scaling of feeding in marine calanoid copepods. Limnol. Oceanogr. 2007, 52, 668–675. [Google Scholar] [CrossRef] [Green Version]
- Straile, D. Gross growth efficiencies of protozoan and metazoan zooplankton and their dependence on food concentration, predator-prey weight ratio, and taxonomic group. Limnol. Oceanogr. 1997, 42, 1375–1385. [Google Scholar] [CrossRef] [Green Version]
- Berk, S.G.; Brownlee, D.C.; Heinle, D.R.; Kling, H.J.; Colwell, R.R. Ciliates as a food source for marine planktonic copepods. Microb. Ecol. 1977, 4, 27–40. [Google Scholar] [CrossRef]
- Pierce, R.W.; Turner, J.T. Ecology of planktonic ciliates in marine food webs. Rev. Aquat. Sci. 1992, 6, 139–181. [Google Scholar]
- Burkill, P.; Edwards, E.; Sleight, M. Microzooplankton and their role in controlling phytoplankton growth in the marginal ice zone of the Bellingshausen Sea. Deep-Sea Res. Part. II 1995, 42, 1277–1290. [Google Scholar] [CrossRef]
- Calbet, A.; Landry, M.R. Phytoplankton growth, microzooplankton grazing, and carbon cycling in marine systems. Limnol. Oceanogr. 2004, 49, 51–57. [Google Scholar] [CrossRef] [Green Version]
- Chen, B.; Liu, H.; Landry, M.R.; Dai, M.; Huang, B.; Sune, J. Close coupling between phytoplankton growth and microzooplankton grazing in the western South China Sea. Limnol. Oceanogr. 2009, 54, 1084–1097. [Google Scholar] [CrossRef]
- Kamiyama, T. The impact of grazing by microzooplankton in northern Hiroshima Bay, the Seto Inland Seam, Japan. Mar. Biol. 1994, 119, 77–88. [Google Scholar] [CrossRef]
- Sherr, E.B.; Sherr, B.F. Significance of predation by protists in aquatic microbial food webs. Antonie Van Leeuwenhoek. 2002, 81, 293–308. [Google Scholar] [CrossRef] [PubMed]
- DeLong, J.P.; Gilbert, B.; Shurin, J.B.; Savage, V.M.; Barton, B.T.; Clements, C.F.; Dell, A.I.; Greig, H.S.; Harley, C.D.G.; Kratina, P. The body size dependence of trophic cascades. Am. Nat. 2015, 185, 354–366. [Google Scholar] [CrossRef] [PubMed] [Green Version]
- Shurin, J.B.; Seabloom, E.W. The strength of trophic cascades across ecosystems: Predictions from allometry and energetics. J. Anim. Ecol. 2005, 74, 1029–1038. [Google Scholar] [CrossRef]
- Caron, D.A.; Countway, P.D. Hypotheses on the role of the protistan rare biosphere in a changing world. Aquat. Microb. Ecol. 2009, 57, 227–238. [Google Scholar] [CrossRef] [Green Version]
- Morison, F.; Pierson, J.J.; Oikonomou, A.; Menden-Deuer, S. Mesozooplankton grazing minimally impacts phytoplankton abundance during spring in the western North Atlantic. PeerJ 2020, 8, e9430. [Google Scholar] [CrossRef]
- Gifford, D.J. Protozoa in the diets of Neocalanus spp. in the oceanic subarctic Pacific Ocean. Prog. Oceanogr. 1993, 32, 223–237. [Google Scholar] [CrossRef]
- Elliott, D.T.; Tang, K.W. Simple staining method for differentiating live and dead marine zooplankton in field samples. Limnol. Oceanogr. Methods 2009, 7, 585–594. [Google Scholar] [CrossRef] [Green Version]
- Djeghri, N.; Atkinson, A.; Fileman, E.S.; Harmer, R.A.; Widdicombe, C.E.; McEvoy, A.J.; Cornwell, L.; Mayor, D.J. High prey-predator size ratios and unselective feeding in copepods: A seasonal comparison of five species with contrasting feeding modes. Prog. Oceanogr. 2018, 165, 63–74. [Google Scholar] [CrossRef]
- Armengol, L.; Franchy, G.; Ojeda, A.; Santana-del Pino, Á.; Hernández-León, S. Effects of copepods on natural microplankton communities: Do they exert top-down control? Mar. Biol. 2017, 164, 136. [Google Scholar] [CrossRef]
- Jochem, F.J. Dark survival strategies in marine phytoplankton assessed by cytometric measurement of metabolic activity with fluorescein diacetate. Mar. Biol. 1999, 135, 721–728. [Google Scholar] [CrossRef]
- van de Poll, W.H.; Abdullah, E.; Visser, R.J.; Fischer, P.; Buma, A.G. Taxon-specific dark survival of diatoms and flagellates affects Arctic phytoplankton composition during the polar night and early spring. Limnol. Oceanogr. 2020, 65, 903–914. [Google Scholar] [CrossRef] [Green Version]


Publisher’s Note: MDPI stays neutral with regard to jurisdictional claims in published maps and institutional affiliations. |
© 2021 by the authors. Licensee MDPI, Basel, Switzerland. This article is an open access article distributed under the terms and conditions of the Creative Commons Attribution (CC BY) license (https://creativecommons.org/licenses/by/4.0/).