Article

Hyperspectral Inversion of Soil Carbon and Nutrient Contents in the Yellow River Delta Wetland

1
Institute of Wetland Research, Chinese Academy of Forestry, Beijing 100091, China
2
Beijing Key Laboratory of Wetland Services and Restoration, Beijing 100091, China
3
Institute of Ecological Conservation and Restoration, Chinese Academy of Forestry, Beijing 100091, China
*
Author to whom correspondence should be addressed.
Diversity 2022, 14(10), 862; https://doi.org/10.3390/d14100862
Submission received: 17 July 2022 / Revised: 4 October 2022 / Accepted: 6 October 2022 / Published: 11 October 2022
(This article belongs to the Special Issue Ecosystem Observation, Simulation and Assessment)

Abstract

:
Hyperspectral inversion techniques can facilitate soil quality monitoring and evaluation. In this study, the Yellow River Delta Wetland Nature Reserve was used as the study area. By measuring and analyzing soil samples under different vegetation types and collecting soil reflectance spectra, the relationships between vegetation types, soil depth, and the changes in soil total carbon (TC), total nitrogen (TN), and total phosphorus (TP) contents were assessed. The spectral data set was changed by spectral first derivative processing and division of the sample set according to vegetation type. The correlation between soil carbon, nitrogen, and phosphorus contents, and soil spectra was also analyzed, sensitive bands were selected, and the partial least-squares (PLS) method, support vector machine (SVM) method, and random forest (RF) model were used to establish the inversion model based on the characteristic bands. The optimal combination of spectral transformation, sample set partitioning, and inversion model was explored. The results showed significant differences (p < 0.05) in soil TC, TN, and TP contents under reed and saline alkali poncho vegetation, but not between soil element contents under different stratifications of the same plant species. The first derivative reflectance had higher correlation coefficients with soil TC, TN, and TP contents compared with the original reflectance, while the sensitive bands and quantities of the three elements differed. The division of the sample sets according to vegetation type and the first derivative treatment can improve the prediction accuracy of the model. The best combination of sample set plus FD plus RF for TC, TN, and TP in reed soil and sample set plus FD plus SVM for TC, TN, and TP in saline alkali pine soil provides technical support to further improve the prediction accuracy of TC, TN, and TP in wetland soil.

1. Introduction

Soils are unparalleled in terms of their complexity and dynamics, and they contain minerals, organic matter, innumerable microorganisms, and varying amounts of air, water, and essential nutrients [1,2,3]. Soil carbon, nitrogen, and phosphorus are important elements required for plant physiological processes in terrestrial ecosystems, and they have a great impact on the structure and function of ecosystems, along with being important indicators of soil nutrient levels [4,5,6,7]. The soil whole carbon content is an important indicator of the soil carbon pool, while soil nitrogen and phosphorus are indicators of soil nutrient elements [8,9,10].
To understand the key role played by soils in global material cycling, a quantitative assessment of the soil carbon, nitrogen, and phosphorus contents and their management is needed [11]. However, the traditional methods of soil element quantification are laborious and expensive, and a large number of samples is required to maintain the statistical robustness of the analysis [12,13]. Therefore, traditional estimation methods pose critical analytical and environmental challenges. Reflectance spectroscopy techniques serve as alternatives to laboratory practices that require more analysis time and use large amounts of hazardous reagents [14]. The principles of reflectance spectroscopy in soil science are related to the variability of material surfaces and their optically active components [15]. For example, soil elements, such as carbon, nitrogen, and phosphorus, have a significant impact on the form and nature of soil reflectance spectra and can be estimated quickly [16,17,18,19]. Recently, the use of hyperspectral techniques to obtain information on soil elemental content has gained popularity and become a reliable method for exploring soil-related issues [20,21,22]. In the process of modelling inversion, scholars have found that different models perform differently because of the differences in computational principles; hence, it is necessary to construct different models to compare the inversion effects to determine the best inversion model [23,24,25]. Owing to the redundancy of hyperspectral data, a mathematical transformation of spectral data or of the extraction of sensitive bands via principal component analysis and the correlation coefficient method can improve the modelling accuracy [26,27,28]. Naveen et al. collected soil hyperspectral data from mangrove and salt marsh wetlands and established a partial least-squares regression model between the spectral information and soil carbon and nitrogen variables in an attempt to determine the best band for soil variable inversion [29]. Meanwhile, Zhang et al. used several mathematical transformation methods to screen out the sensitive bands of soil carbon and nitrogen. Based on the sensitive bands, the authors established a hyperspectral inversion model of the coastal wetland surface soil carbon and nitrogen contents and achieved a better prediction accuracy [30]. In addition, the partitioning of the hyperspectral sample also has an important impact on the predictive power of the model [31,32]. Taking coastal wetland soil as the study object, Wei et al. established partial least-squares regression and support vector machine (SVM) prediction models based on three different sample set division methods and found that different sample set partitioning methods also impact modelling accuracy [33].
Previous studies have focused on different models and different data processing methods to carry out research, and although some studies have used the division of sample sets, there remains a lack of research that incorporates the influence of surface vegetation into the division factors of sample sets. Surface vegetation is the primary factor influencing soil elemental carbon, nitrogen, and phosphorus contents, while apoplastic material and root secretion during vegetation growth cause differences in soil physicochemical properties under different vegetation types, and the level of soil carbon, nitrogen, and phosphorus contents causes differences in soil spectral properties. Therefore, when targeting samples of soil carbon, nitrogen, and phosphorus contents of different vegetation types, this study, through different data processing methods and models, proposes a strategy to divide the sample set according to the surface vegetation, and it determines whether dividing the sample pool according to different types of vegetation types could improve the model’s prediction accuracy. The objectives of this study are to: (1) investigate and analyze the differences in soil total carbon (TC), total nitrogen (TN), and total phosphorus (TP) contents under reed and saline alkali pong communities in coastal wetlands of the Yellow River Delta; (2) compare and analyze the effects of different data processing methods, different sample set division methods, and different models on soil carbon, nitrogen, and content prediction; and (3) evaluate the reliability of soil carbon, nitrogen, and phosphorus content prediction using hyperspectral techniques.

2. Materials and Methods

2.1. Study Area

The study area is located in the Yellow River Delta Wetland Nature Reserve in Shandong Province (37°35′ N–38°12′ N, 118°33′ E–119°20′ E) (Figure 1). The Yellow River Delta is the largest estuarine delta nature reserve in China. It is a representative example of estuarine wetland ecosystems worldwide and has been included in the list of internationally important wetlands by the Ramsar Convention [34]. The terrain of this area is flat, with an altitude of 2.0–15.0 m. The total research area is approximately 2902 km2, and the land use types mainly include cultivated land, wetlands, and saline-alkali land [35]. The Yellow River Delta belongs to a warm, temperate, semi-humid, continental monsoon climate zone, with significant temperature differences between the four seasons. The annual average temperature is 11.7–12.6 °C, the extreme maximum temperature is 41.9 °C, and the extreme minimum temperature is −23.3 °C; the frost-free period is 211 d, and the average annual rainfall is 530–630 mm [36].

2.2. Data Collection

Sampling was conducted in October 2021, and the sampling sites were randomly distributed within the study area. A total of 80 sampling sites were selected, of which 42 were Suaeda salsa ponies and 38 were Phragmites australis. Three layers of soil were collected from each sampling site, and the sampling depth was 0–60 cm, divided into three layers (0–20 cm, 20–40 cm, and 40–60 cm). A total of 240 soil samples were collected, of which 126 were collected from the P. australis ponies and 114 were collected from the S. salsa. The minimum quantity of each soil sample was 500 g. The soil samples were dried naturally in a cool, dry, and ventilated area and then ground and sieved through a 100-mesh sieve after removing impurities (e.g., plant roots and stones). The screened soil was divided into two parts: one part was used for the determination of soil carbon, nitrogen, and phosphorus using traditional chemical methods. The soil organic carbon (SOC) content was determined via potassium dichromate-ferric sulfate titration, soil TN content was determined using the semi-micro Kjeldahl method, and soil TP content was measured using the sulfuric acid-perchloric acid digestion-molybdenum antimony colorimetric method. Soil spectral reflectance data were collected using an ASD FS4 portable geospectrometer (Analytical Spectral Devices, Inc., Boulder, CO, USA) equipped with a soil spectral probe in the wavelength range of 350–2500 nm with a sampling interval of 1 nm. The soil samples were sieved and placed in a 1.0 cm deep glass Petri dish such that the soil surface was flat and the probe was kept perpendicular to the soil surface during measurements. Reference white plate calibration was performed before each spectral test.

2.3. Data Set Division

Firstly, the significant difference analysis of soil carbon, nitrogen, and phosphorus contents between different vegetation types and soil layers was conducted to determine whether the classification of the sample set was reasonable based on the results. Different classification criteria of the sample data sets will cause differences in modelling effects [37]. Therefore, in this study, all soil spectra obtained were classified into two categories: the soil spectra of P. australis and the soil spectra of S. salsa, based on the different surface vegetation. From this, three sample libraries could be established: a sample library of P. australis soil spectra containing 114 spectral data, a sample library of S. salsa soil spectra containing 126 spectral data, and a total sample library of 240 soil spectra not classified according to surface vegetation. Based on the three sample libraries, subsequent pre-processing and modelling validation were conducted to investigate the effect of dividing the soil sample set according to the surface samples on the modelling effect.

2.4. Pre-Processing Methods

Viewspec Pro software was used to extract the spectral data. First, the spectral curve was modified through the parabola correction function to avoid the jumping of connection points in spectral acquisition, and then the Savitzky–Golay smoothing filter with 10 points was used to smooth the spectral reflectance curve in order to eliminate the reflectance error caused by background noise during spectral data acquisition.
To highlight the correlation between the spectral reflectance and soil elements, two spectral mathematical transformations, original spectral reflectance (OR) and first derivative reflectance (FD), were used. The first derivative processing of the spectrum can decompose the overlapping mixed spectrum, expand the spectral characteristic difference between samples, and facilitate the determination of the spectral sensitive band (SB) [38]. The first derivative (FD) conversion formula is:
FDR λ ı = R λ ı + 1 R λ ı 1 Δ λ
where λ ı is the wavelength of each band, FDR λ ı is the first derivative spectral value at wavelength λ ı , and Δ λ is the wavelength value from the band I to band i plus 1.
In addition, owing to data redundancy in many hyperspectral data bands, to improve the model’s accuracy, the original spectral reflectance (OR) and first derivative reflectance (FD) were used as independent variables, while Pearson correlation analysis was performed with soil carbon, nitrogen, and phosphorus contents, separately; this process was implemented based on R software. Since the correlation between the raw spectral reflectance and soil carbon, nitrogen, and phosphorus contents was poorly calculated, the band with the first derivative spectral reflectance correlation coefficient of > 0.3 was selected as the sensitive band.

2.5. Model Establishment and Verification

The three soil spectral sample libraries were divided into two groups: one group was the sample set for the model building construction, while the other was the validation set for verifying the accuracy of the model built. The ratio of the number of samples in the modelling set to the number of samples in the validation set for each sample library was 2:1 by soil. The hybrid sample library was modelled and validated based on the original spectral reflectance and first derivative spectral reflectance, respectively; the P. australis and S. salsa soil sample libraries were modelled and validated based on the original spectral reflectance, first derivative spectral reflectance, and sensitive band spectral reflectance. In this study, three models—random forest, support vector machine, and partial least-squares regression—were selected for hyperspectral inversion of soil carbon, nitrogen, and phosphorus contents. SVM is a popular machine learning technique with relevant learning algorithms for the analysis, classification, and regression analysis of the data provided. PLSR is an operational method based on principal component analysis that facilitates data dimensionality reduction. RF is an integrated learning algorithm for classification and regression and is constructed by combining the results of various decision trees and bagging the original dataset to select samples. The model construction in this study was implemented using Wake 3.8 software, where the model was first trained by a modelling set and then tested for accuracy using a validation set. The accuracy and stability of the models were assessed using the coefficient of determination (R2), root-mean-square error (RMSE), and residual prediction deviation (RPD). The larger the R2, the smaller the RMSE, indicating a higher model estimation accuracy; otherwise, the accuracy of model estimation was poor [39]. The RPD values reflect the calibration model’s ability to predict the chemical data. Regarding the RPD statistic, an RPD of <1.4 indicates that it is insufficient for applications, values ranging from 1.4–2.0 indicate approximately quantitative predictions, and a value of >2.0 indicates excellent prediction [40].

3. Results

3.1. Characterization of Carbon, Nitrogen, and Phosphorus Contents of Soils in the Yellow River Delta

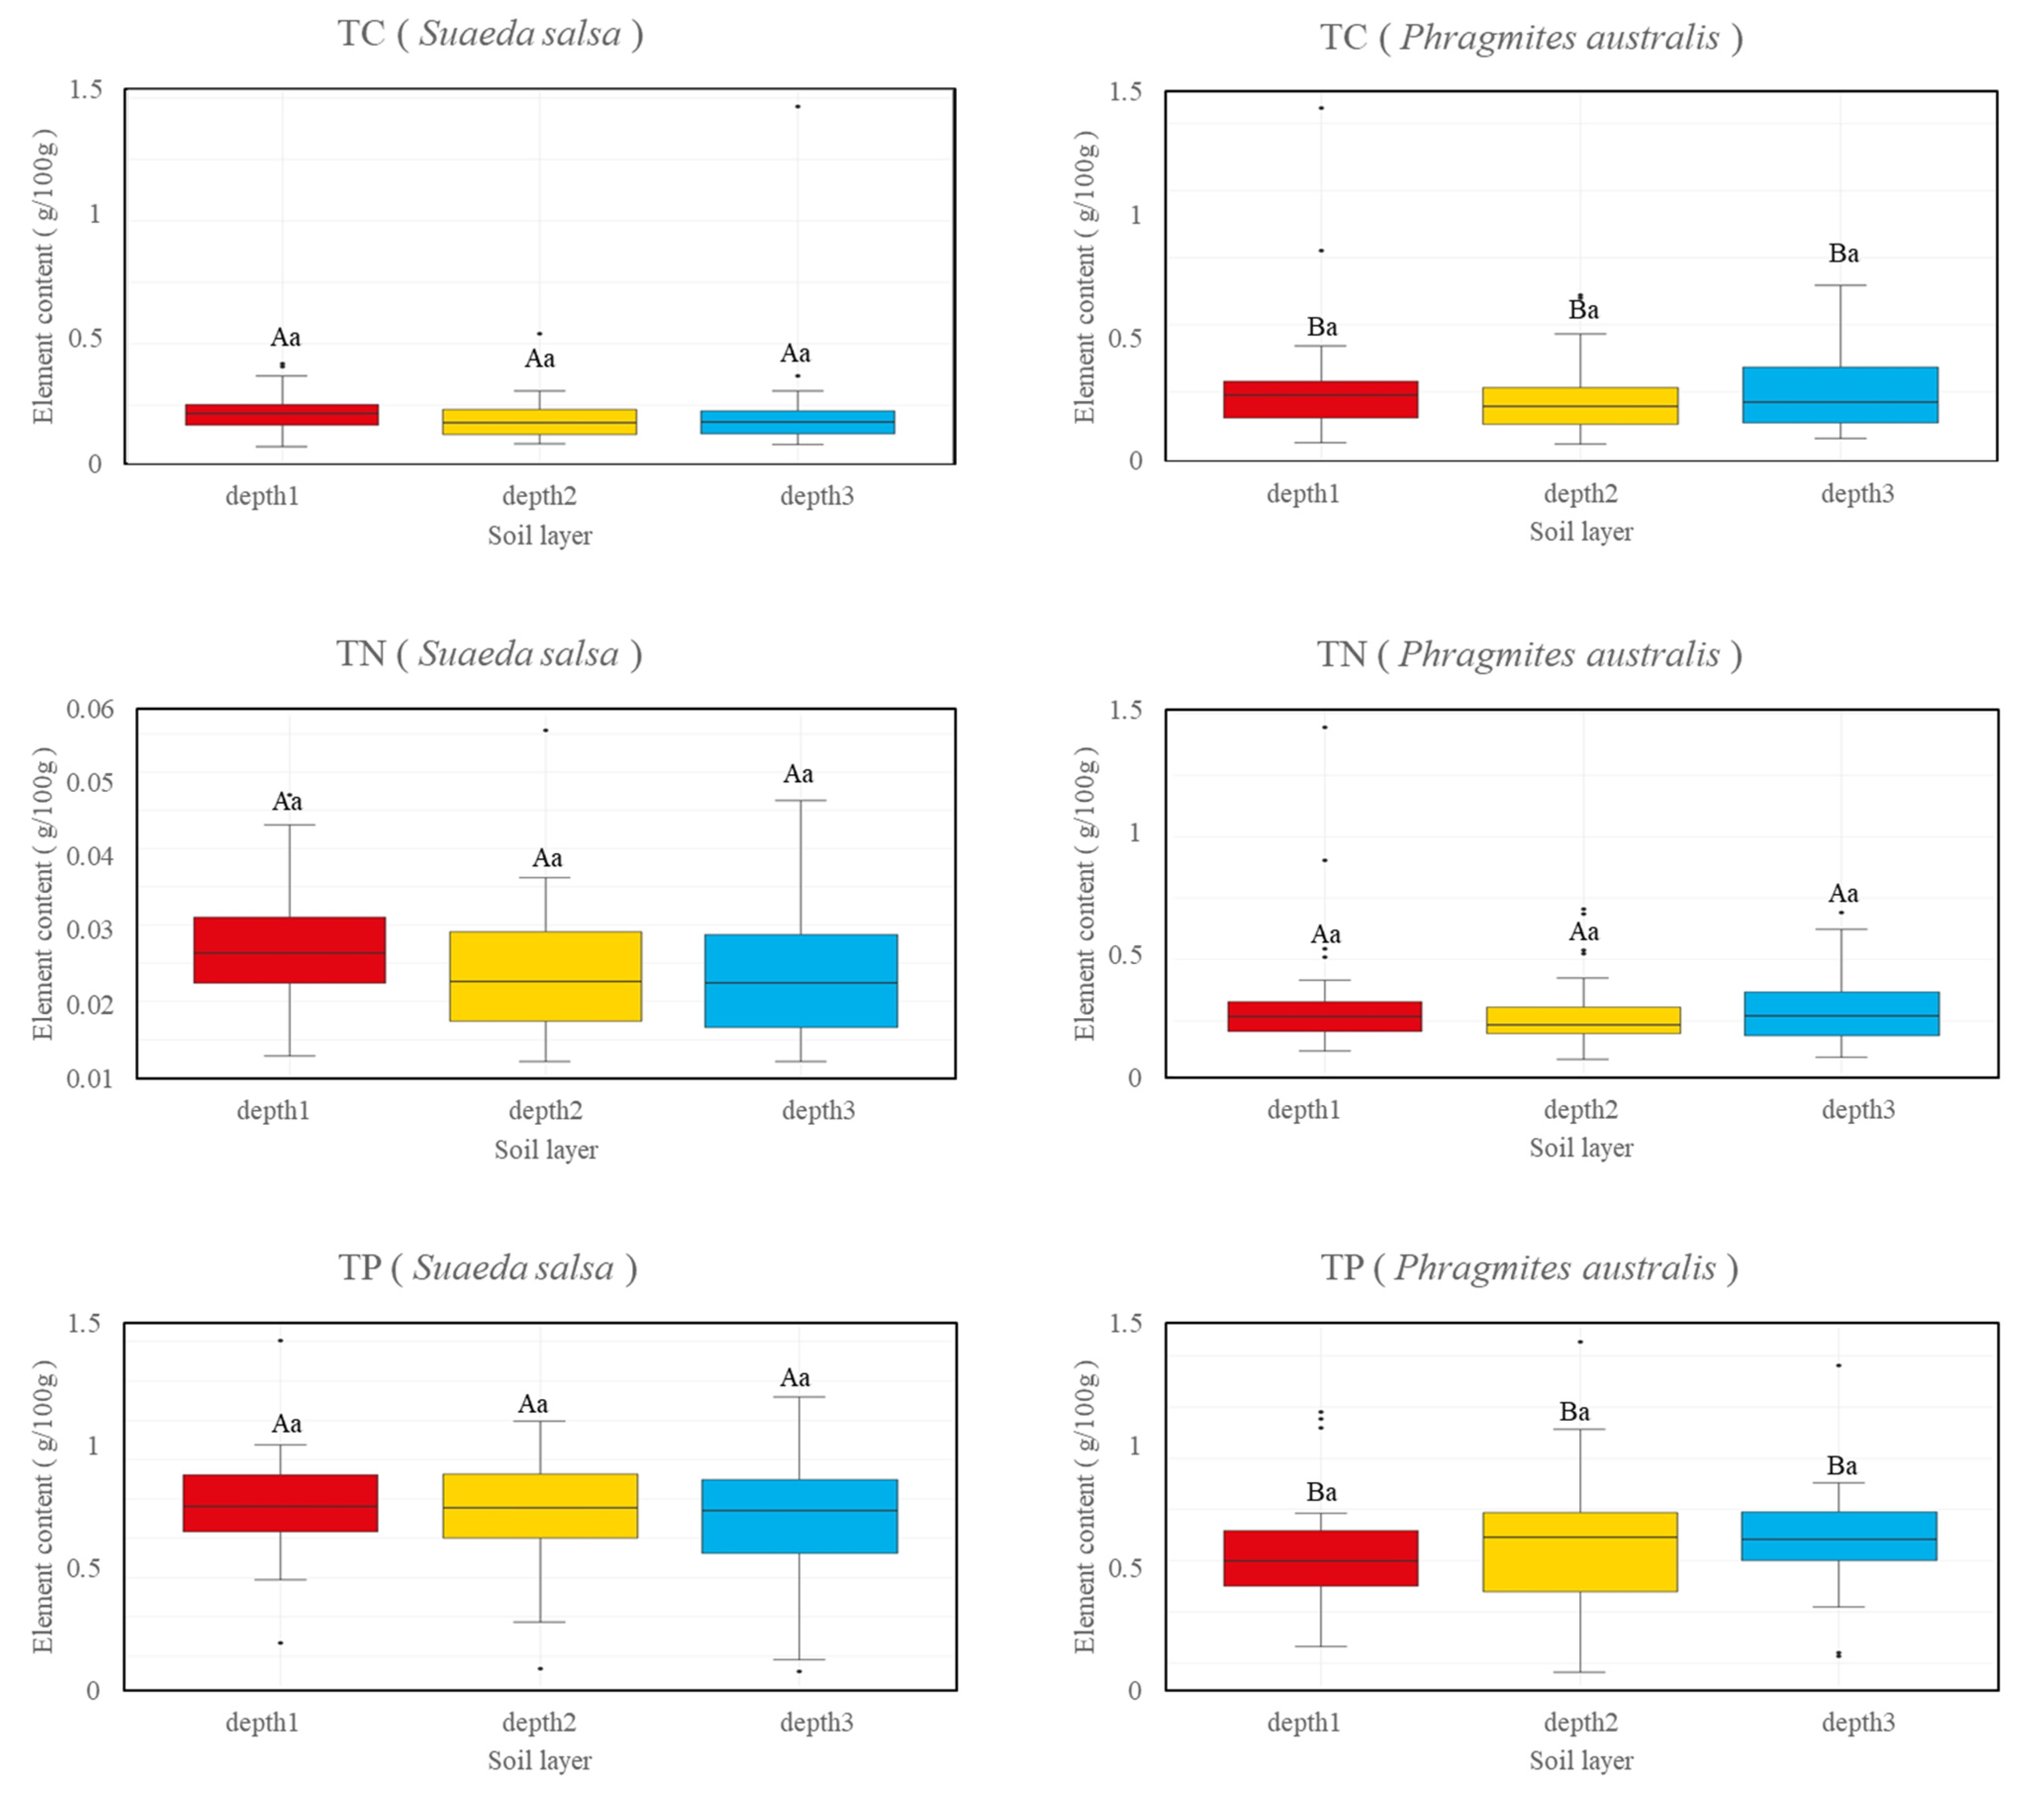
One-way ANOVA implemented in SPSS was used to test the significance of the carbon, nitrogen, and phosphorus contents in the soil under the two coastal wetland plants and under different soil layers, respectively. The results in Figure 2 show a significant difference (p < 0.05) between the soil TC and TP contents under P. australis and S. salsa, while no significant difference was observed in soil TN. Uniformly, there were no significant differences in the soil carbon, nitrogen, and phosphorus contents between the soil layers for either P. australis or S. salsa. The trend of the soil carbon, nitrogen, and phosphorus contents of S. salsa basically followed the pattern of decreasing with the deepening of the soil layer, while the second soil layer (20–40 cm) of P. australis had the lowest TC and TN, and TP increased with the deepening of the soil layer.
Based on the results of the significance tests of the soil TC, TN, and TP under different vegetation types, P. australis and S. salsa can be divided into separate layers for their respective modelling predictions, while there is no significant difference between the carbon, nitrogen, and phosphorus contents of the different soil layers, and hence, the three layers of soil spectral data can be mixed for analysis and processing.

3.2. Spectral Data of the Two Wetland Plant Soils

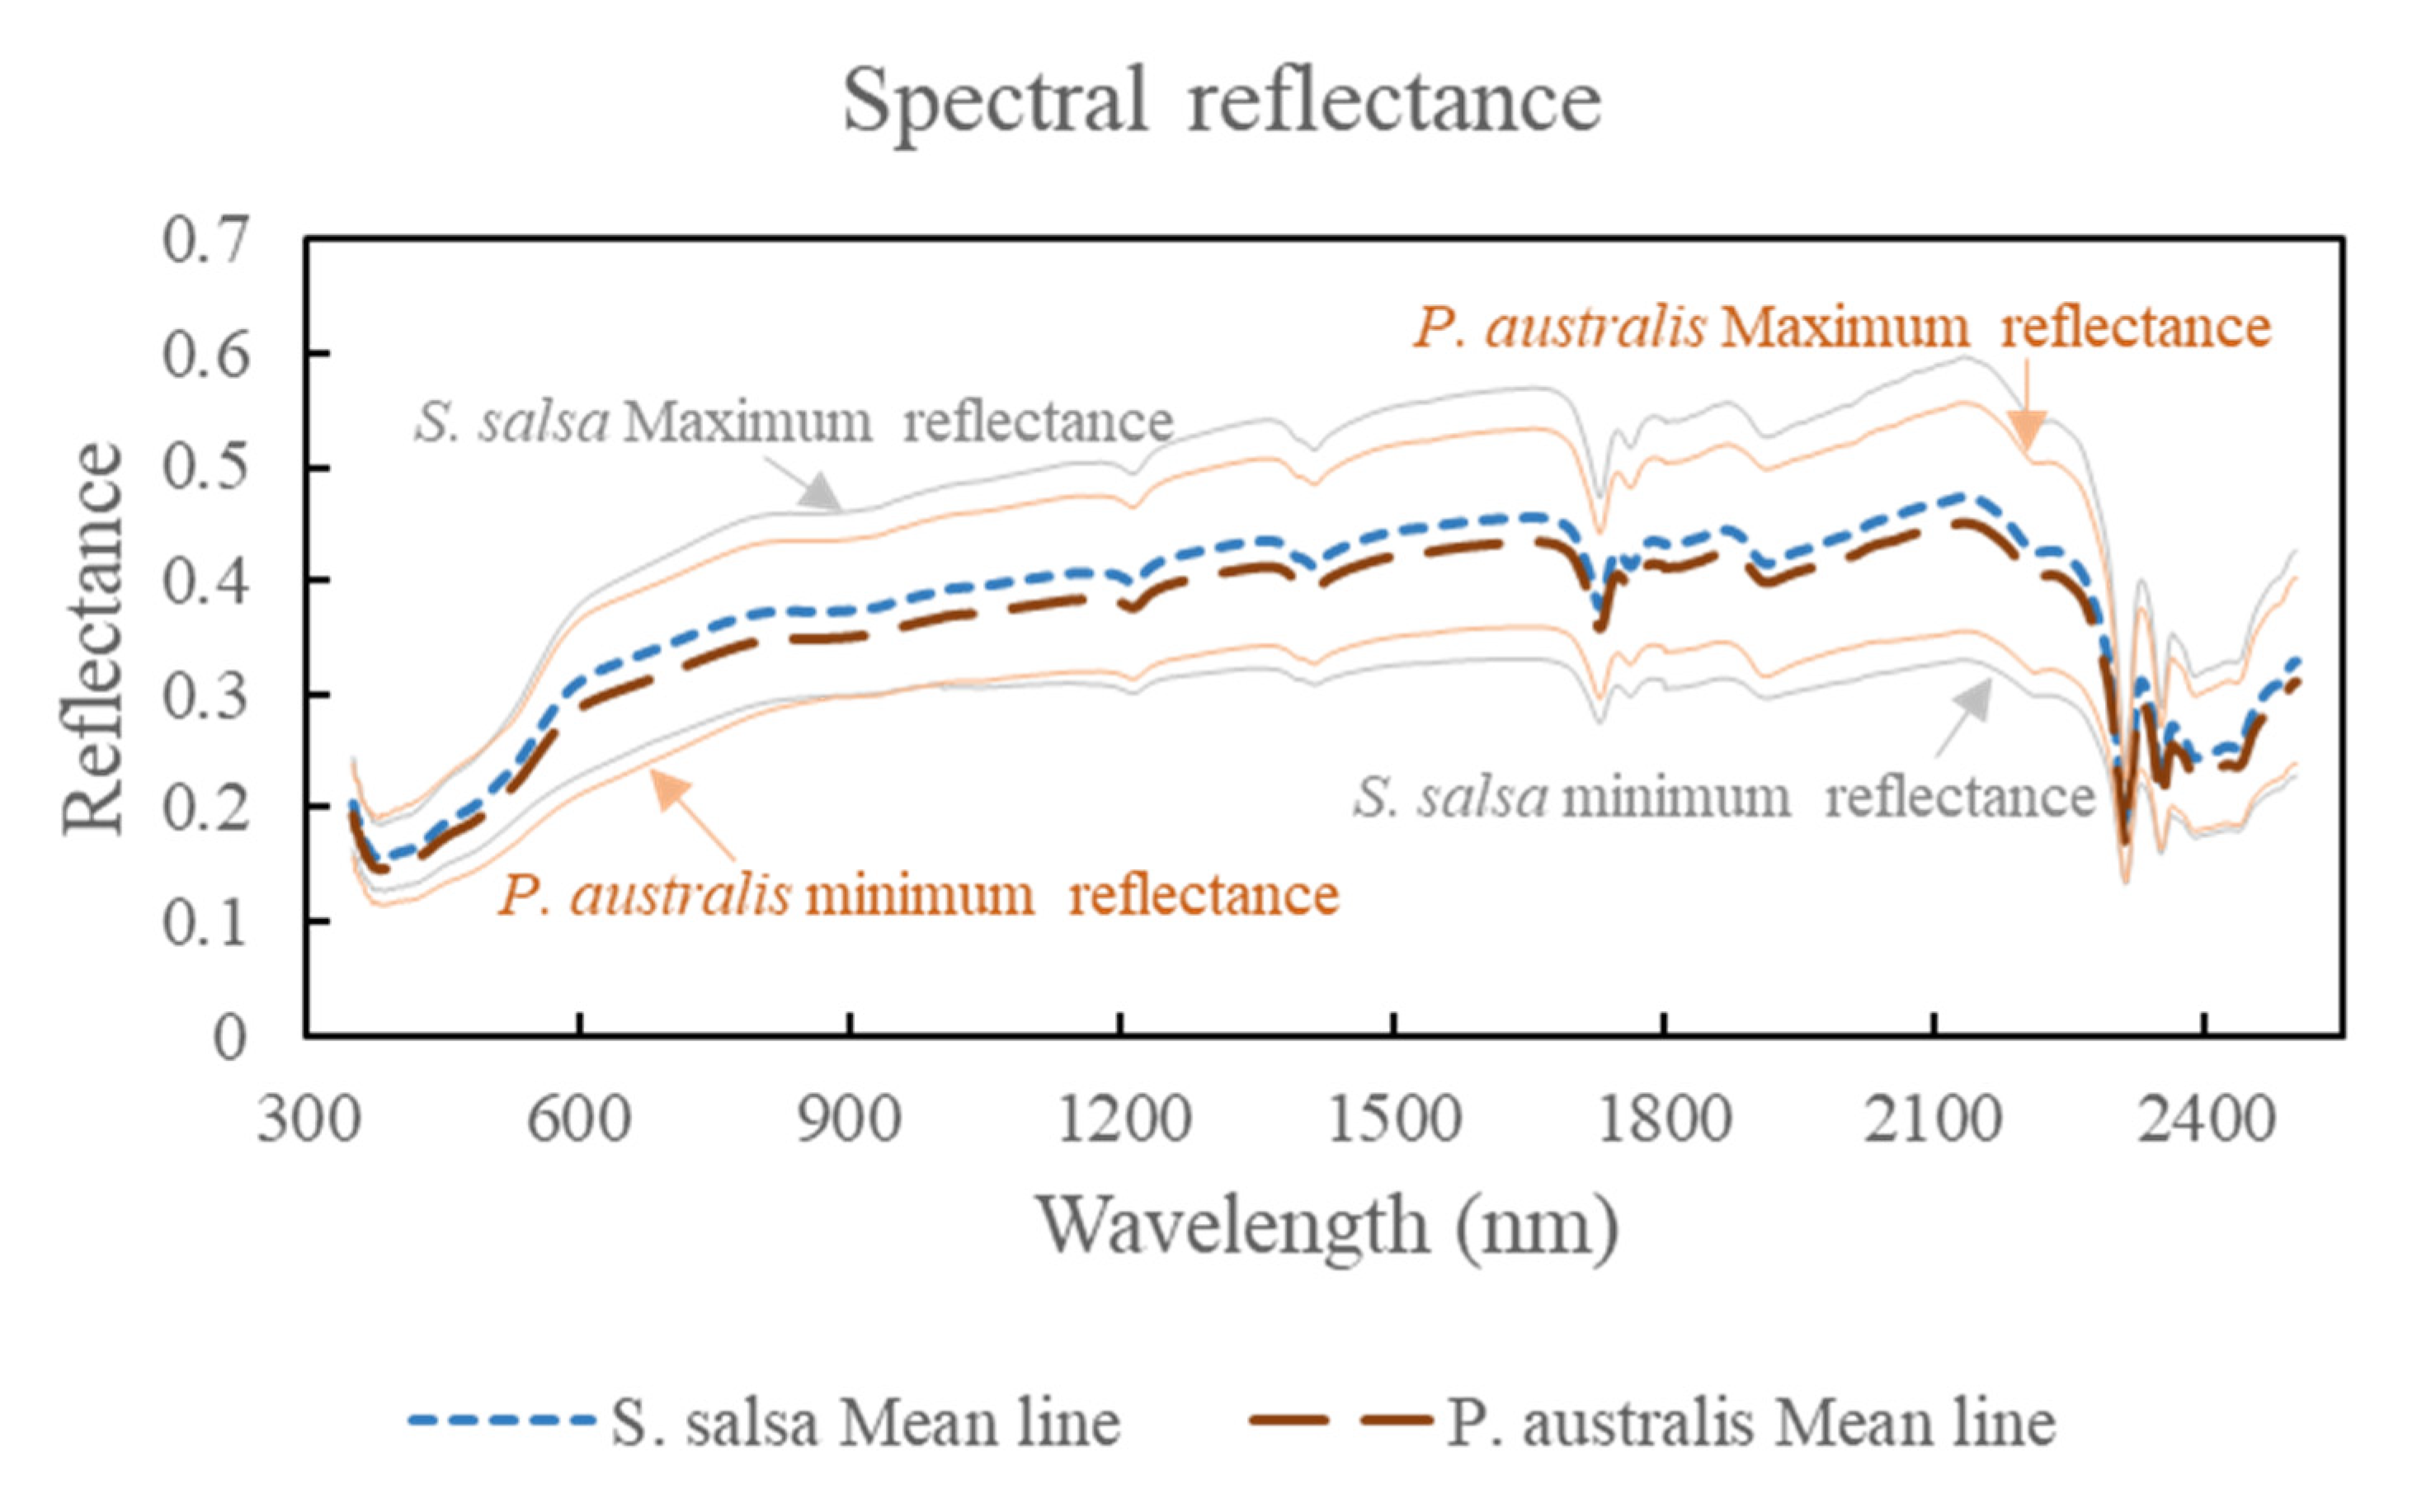
The spectral reflectance curves of all soil samples under the two vegetation types in the wavelength range of 350–2500 nm are shown in Figure 3, where the general trends of the measured spectral reflectance curves of the soil samples under the different vegetation types are the same. The soil spectra under both vegetation types showed distinct soil spectral absorption peaks near 1400, 1750, and 2300 nm, but the depths and areas of the absorption peaks were different. Comparing the spectral reflectance curves of S. salsa and P. australis, the reflectance curves of P. australis soils were more concentrated, indicating that the structural components of the P. australis root soils were relatively stable.

3.3. Correlation Analysis

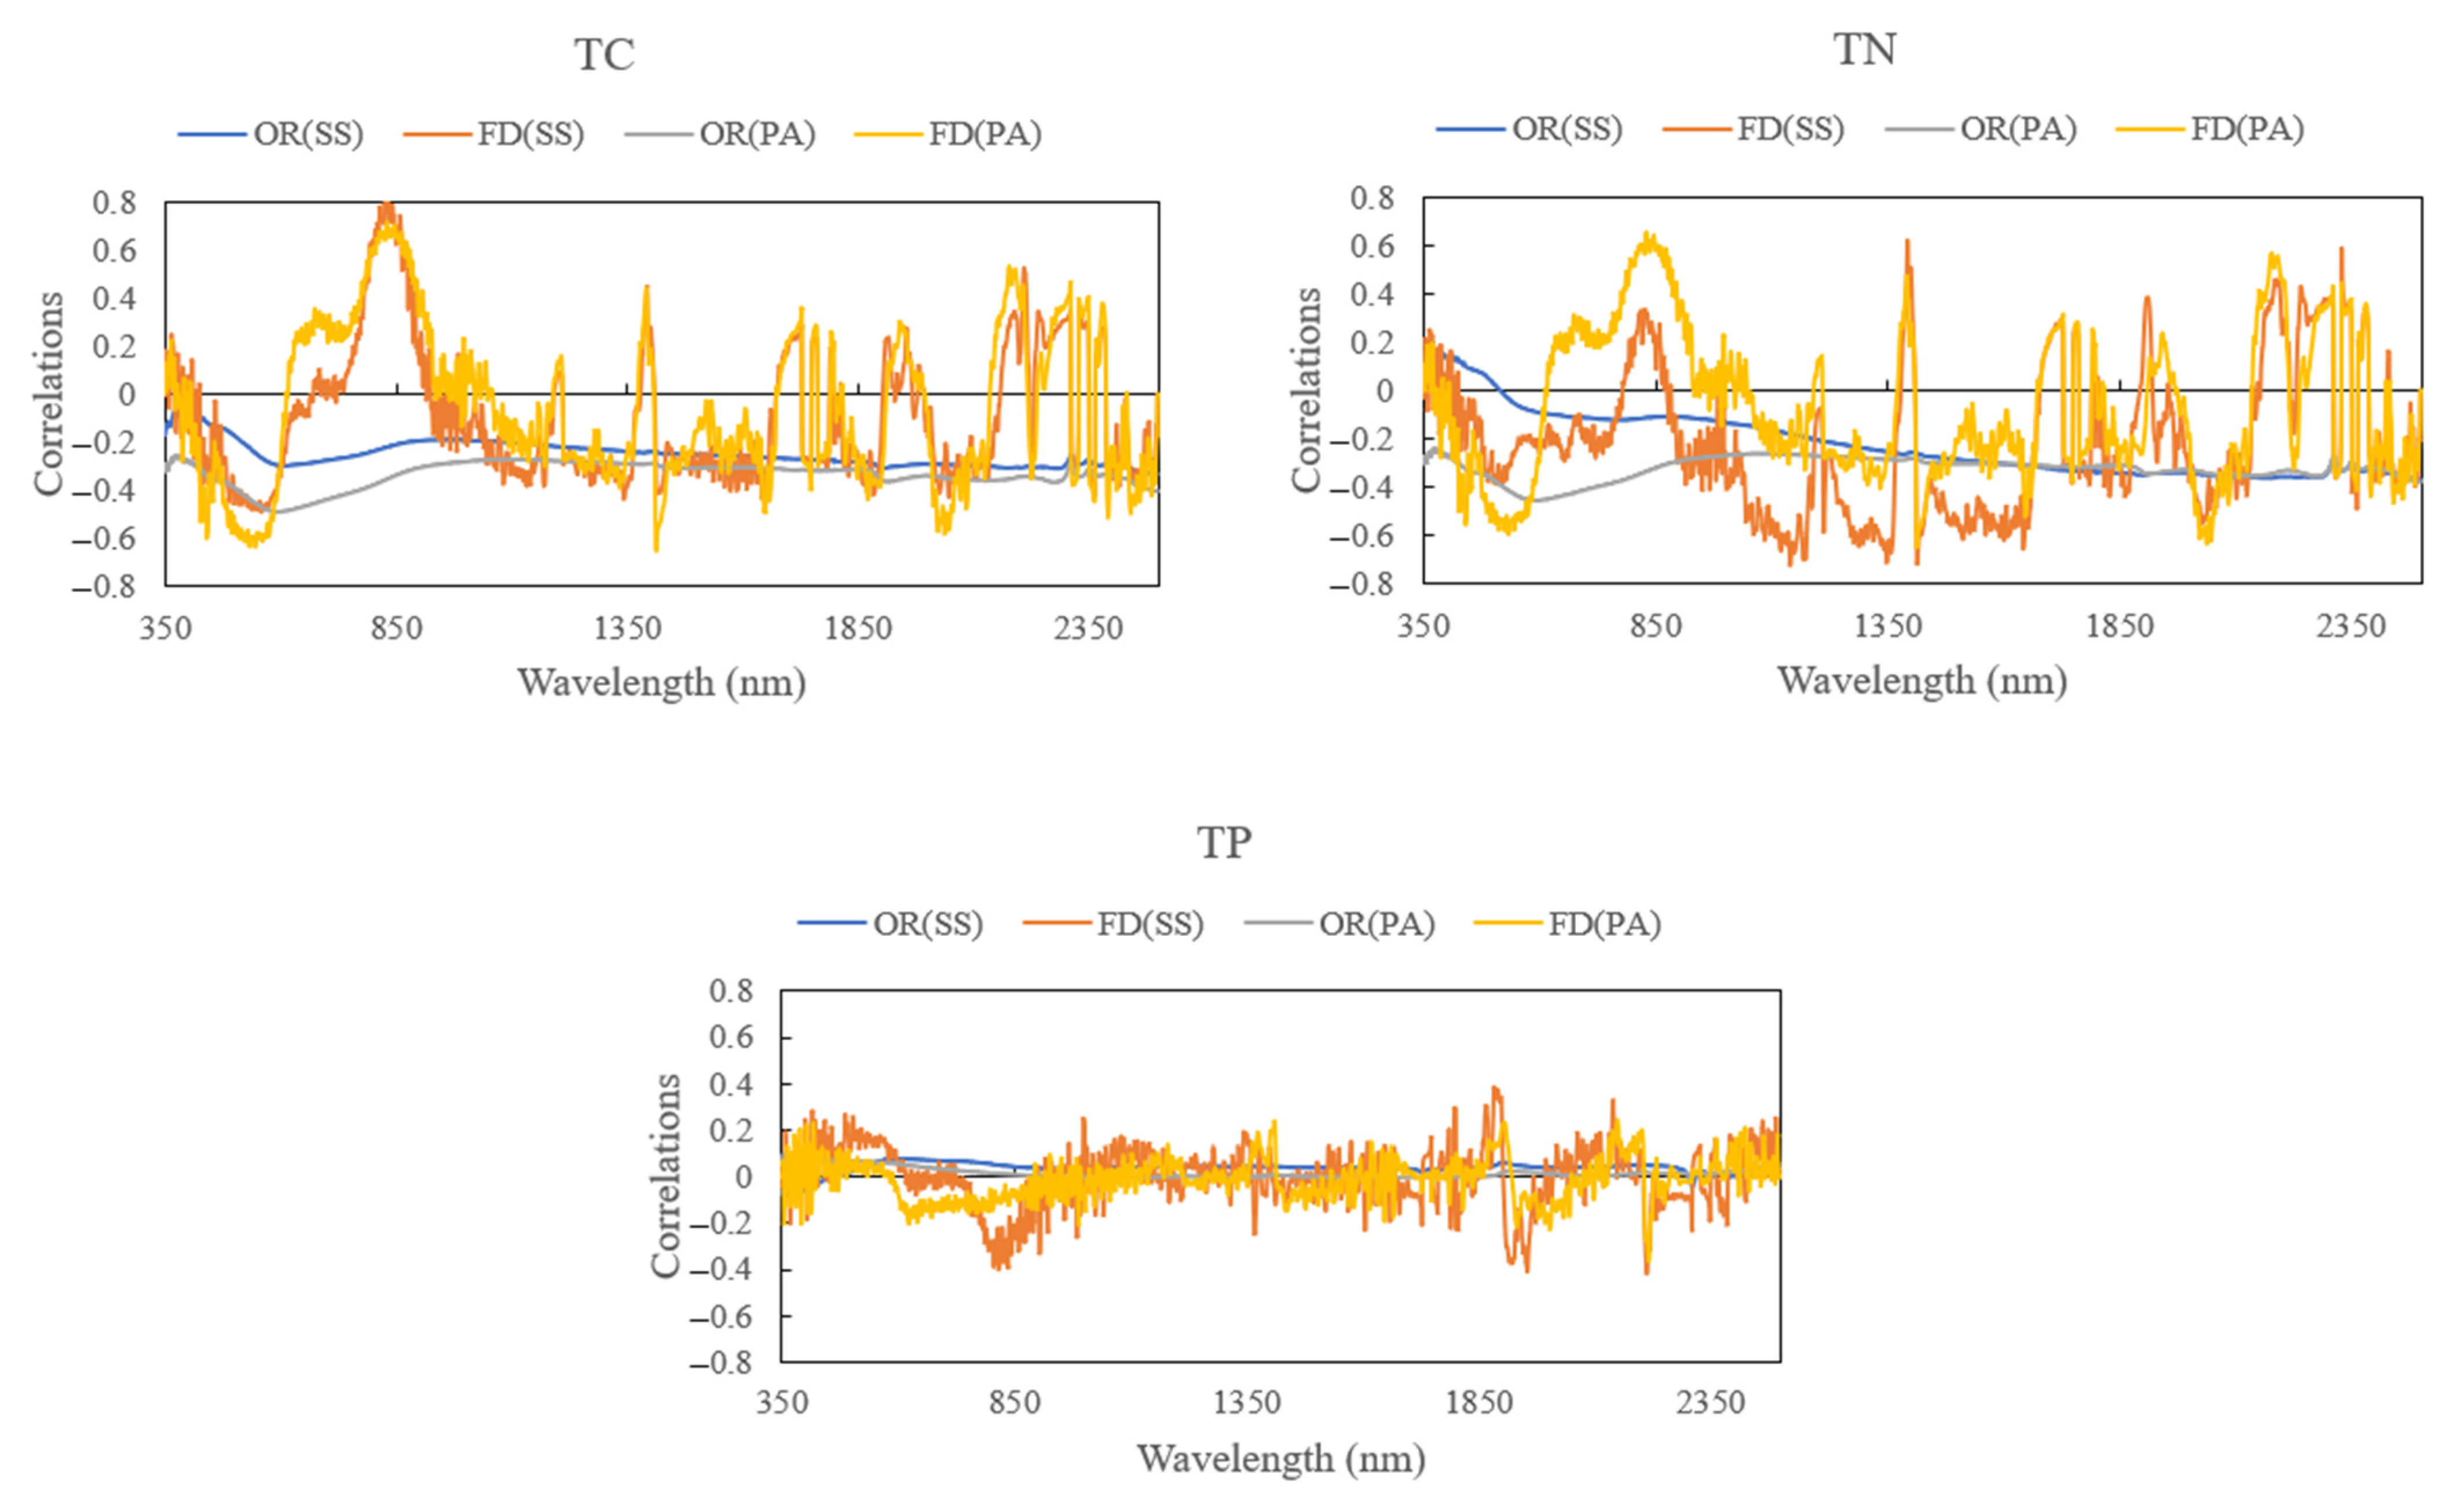
The correlation coefficients were calculated between the soil TC, TN, and TP contents and the soil original spectral reflectance and first derivative reflectance, respectively (Figure 4). The soil correlation coefficient curves of the two vegetation types showed similar trends, but the maximum correlation coefficients differed.
Among them, the soil TC and TN are negatively correlated with spectral reflectance, while the soil TP is positively correlated with spectral reflectance. Compared with the original spectral reflectance, the correlation coefficients of the first derivative reflectance were higher, while those between the soil TC, TN, and TP contents and the first derivative reflectance showed a positive and negative crossover, with more peaks and valleys, and the maximum correlation coefficients were greatly improved compared with the original spectra. As the correlation coefficients between the first derivative reflectance and the soil carbon, nitrogen, and phosphorus were much higher than the original reflectance, the first derivative reflectance of each element was used to establish a new database of sensitive bands for each element.

3.4. Mixed Species Modelling Effects

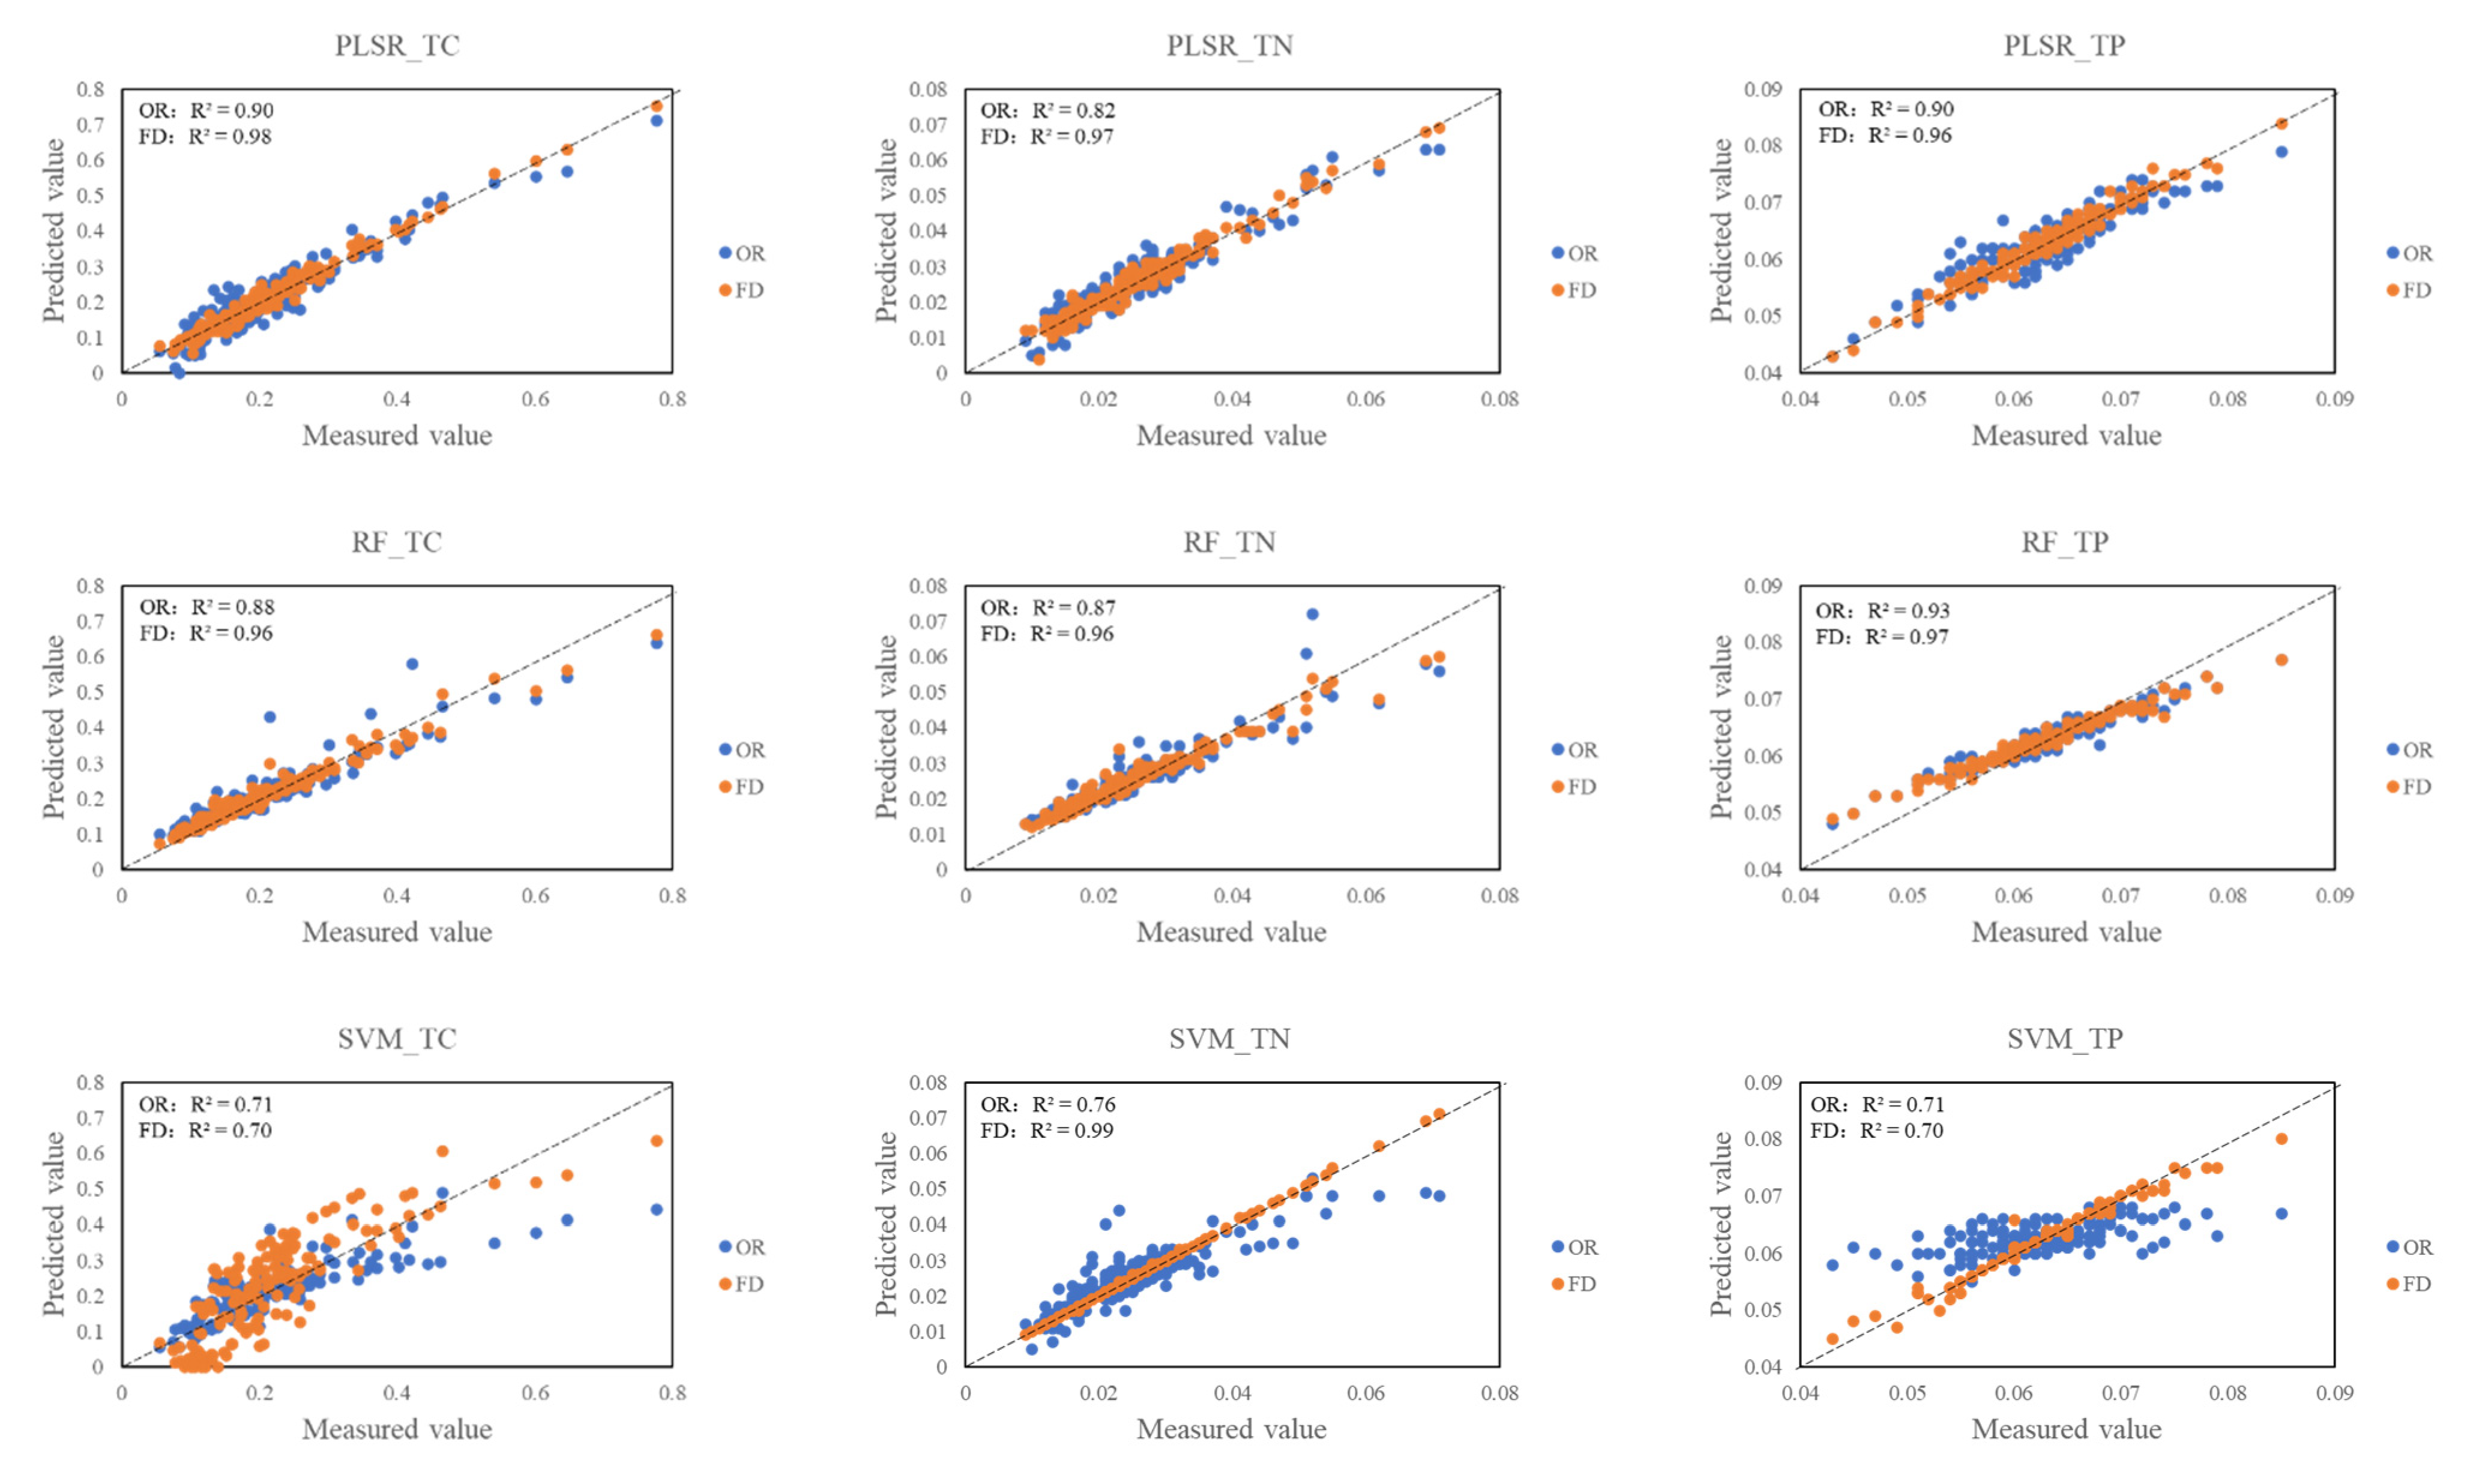
The P. australis and S. salsa sample data were mixed and then divided into sample and validation sets. Prediction models based on the original spectral reflectance and first derivative spectral reflectance data were established using PLSR, RF, and SVM models. Comparing the models obtained using these three methods (Figure 5) revealed that the modelling accuracies of the PLSR and RF were relatively higher than that of the SVM. Additionally, the R2 values of the PLSR models were >0.82, with most values being >0.90. However, the modelling accuracy of SVM was relatively low. Except for the R2 of the TN prediction model based on first derivative processing, which reached 0.99, the other R2 values were <0.80. The prediction model based on the first derivative processing of the spectral reflectance was significantly more accurate than the prediction model based on the original spectral reflectance data, except for the SVM models for TC and TN.
Among the three modelling methods, the PLSR and RF models had the best modelling and prediction accuracies, whereas the SVM model had a relatively poor prediction accuracy.

3.5. Effect of Sample Set Division and Sensitive Band on Modelling

3.5.1. Random Forest Regression Models

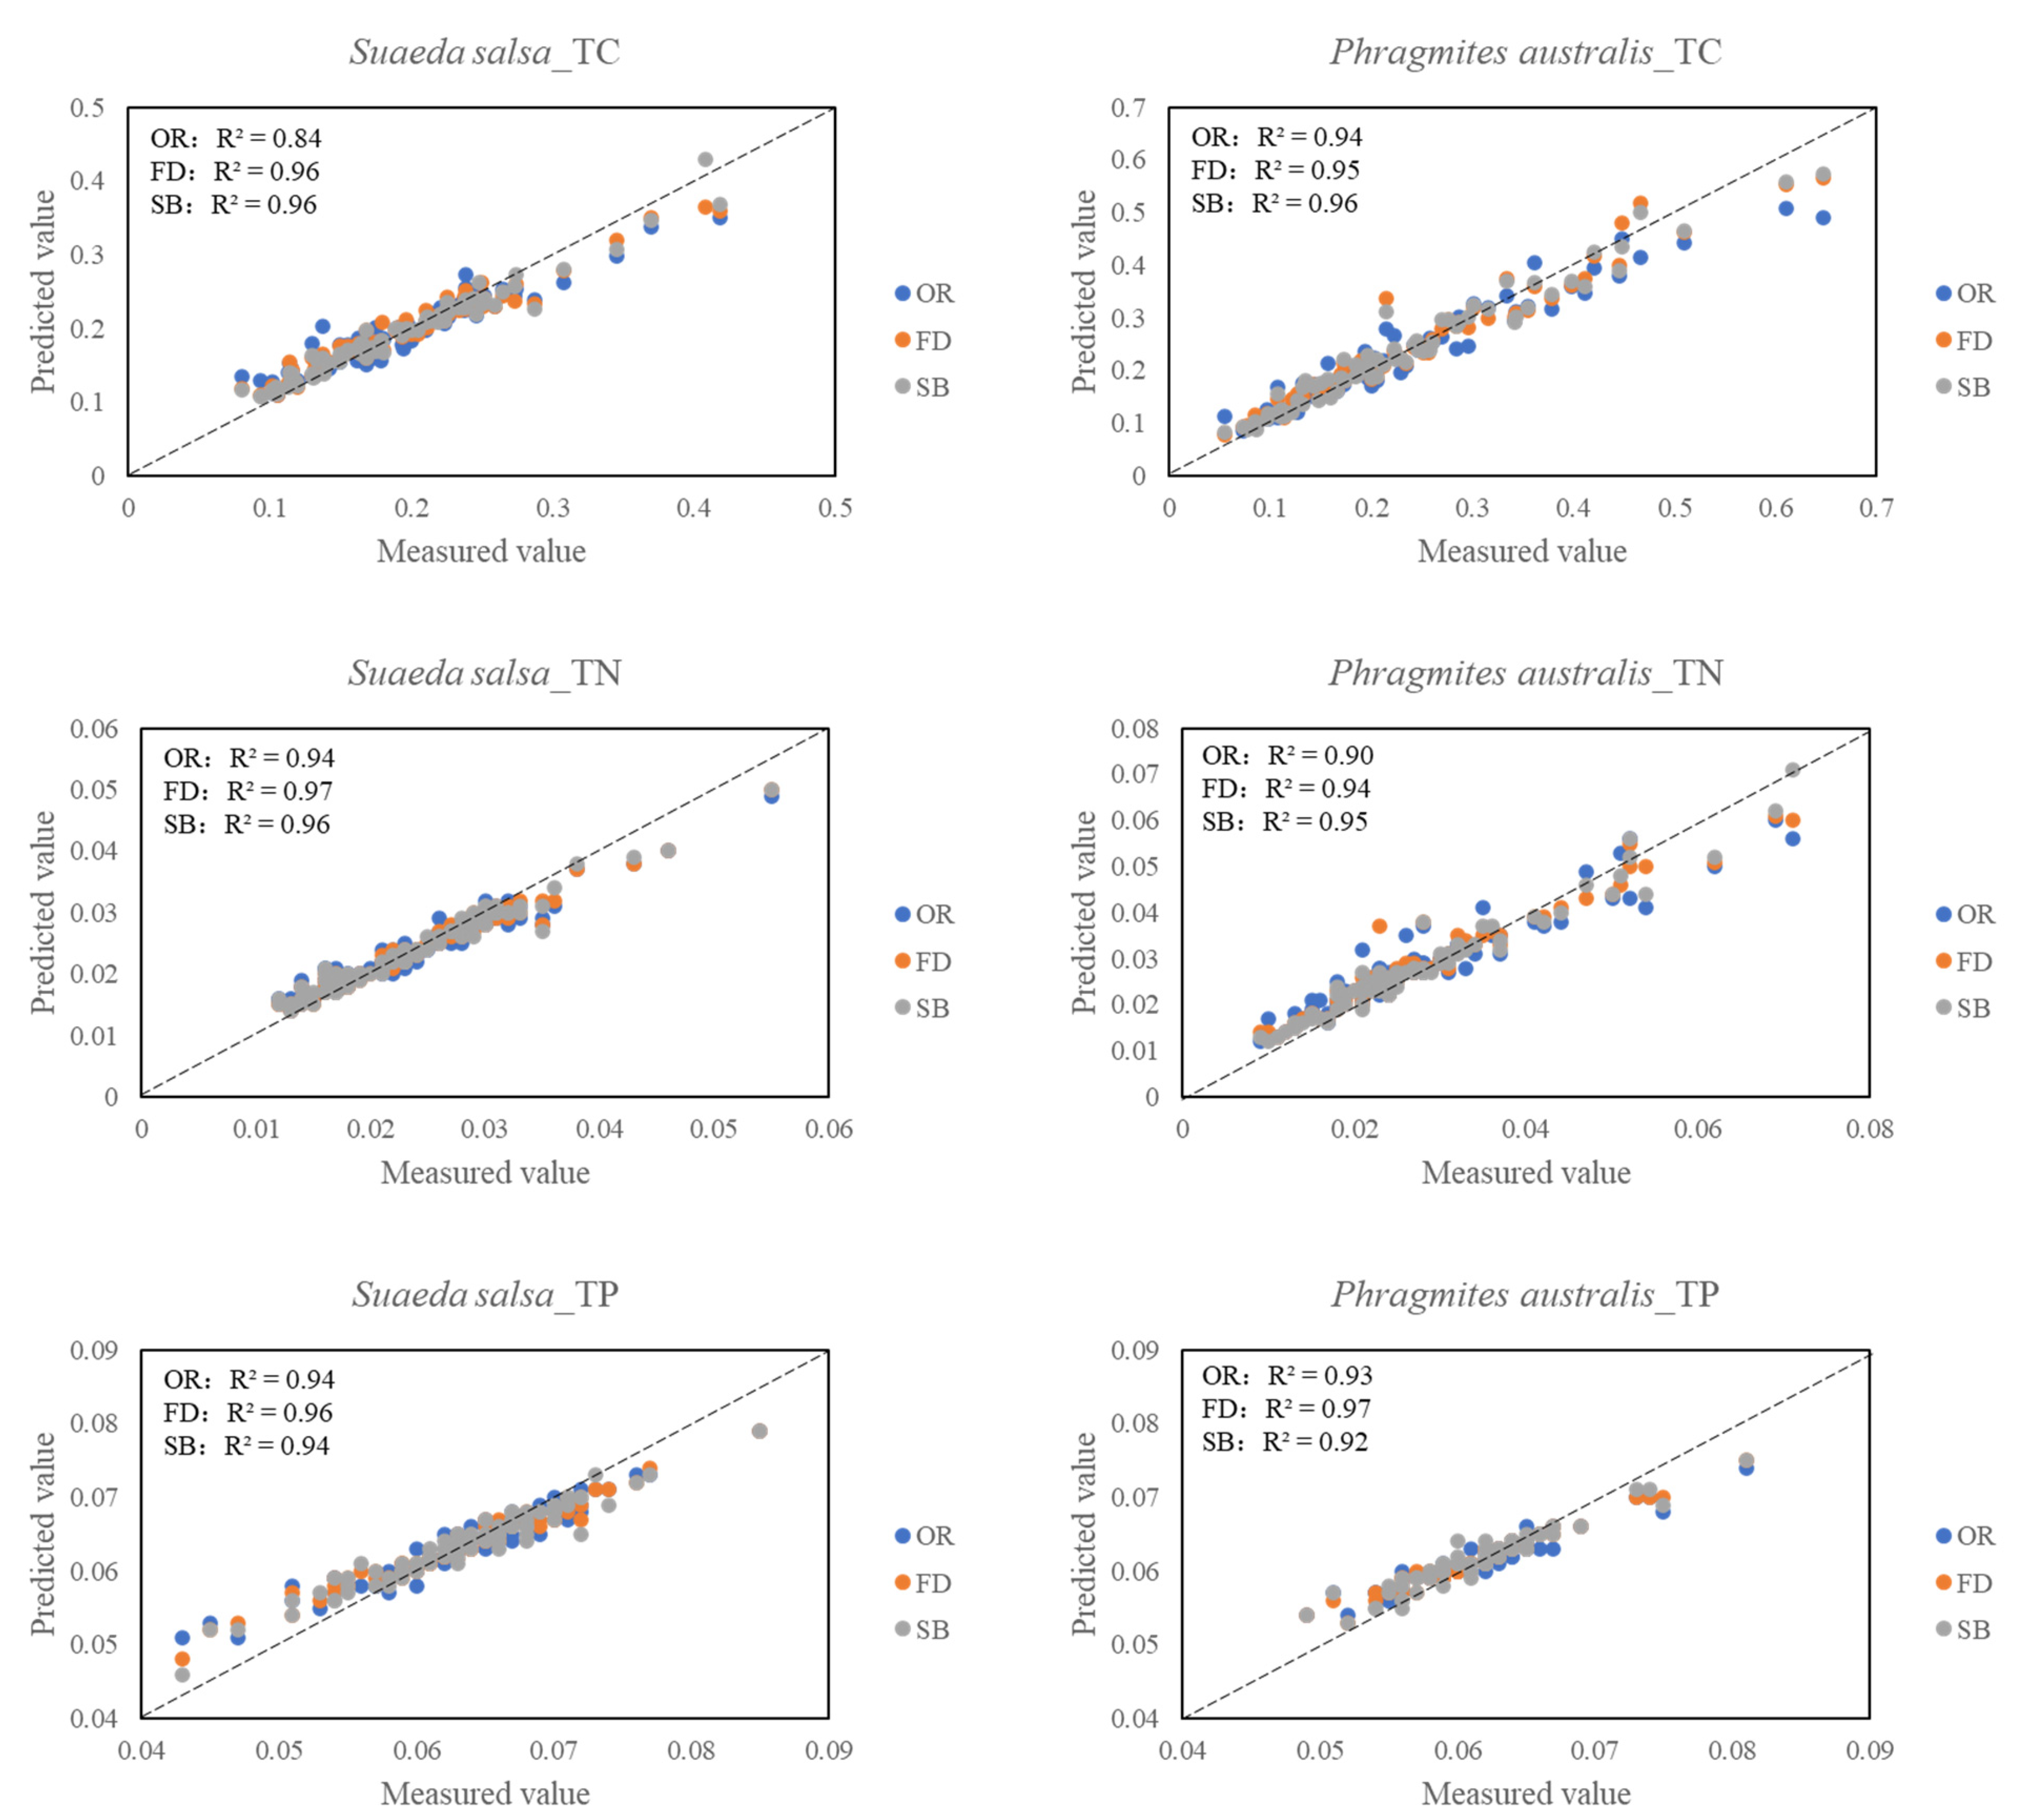
The RF model had a high prediction accuracy for the soil TC, TN, and TP (Figure 6). The modelling and verification of these three models were great, with high stability and accuracy. The prediction accuracy of the soil TC, TN, and TP in the models was high. The R2 of the TC model was at least 0.84, and the RMSE was 0.053 g/kg. The accuracy of soil TN prediction in the model was slightly better than that of TC, with a lowest R2 of 0.90 and an RMSE of 0.006. When modelling the soil TP, the model accuracy was the highest, with the highest R2 (reaching 0.92), while the RMSE was 0.002. Considering model accuracy, the RF model was reliable and excellent in predicting the results of the soil TC, TN, and TP.

3.5.2. Partial Least-Squares Regression Models

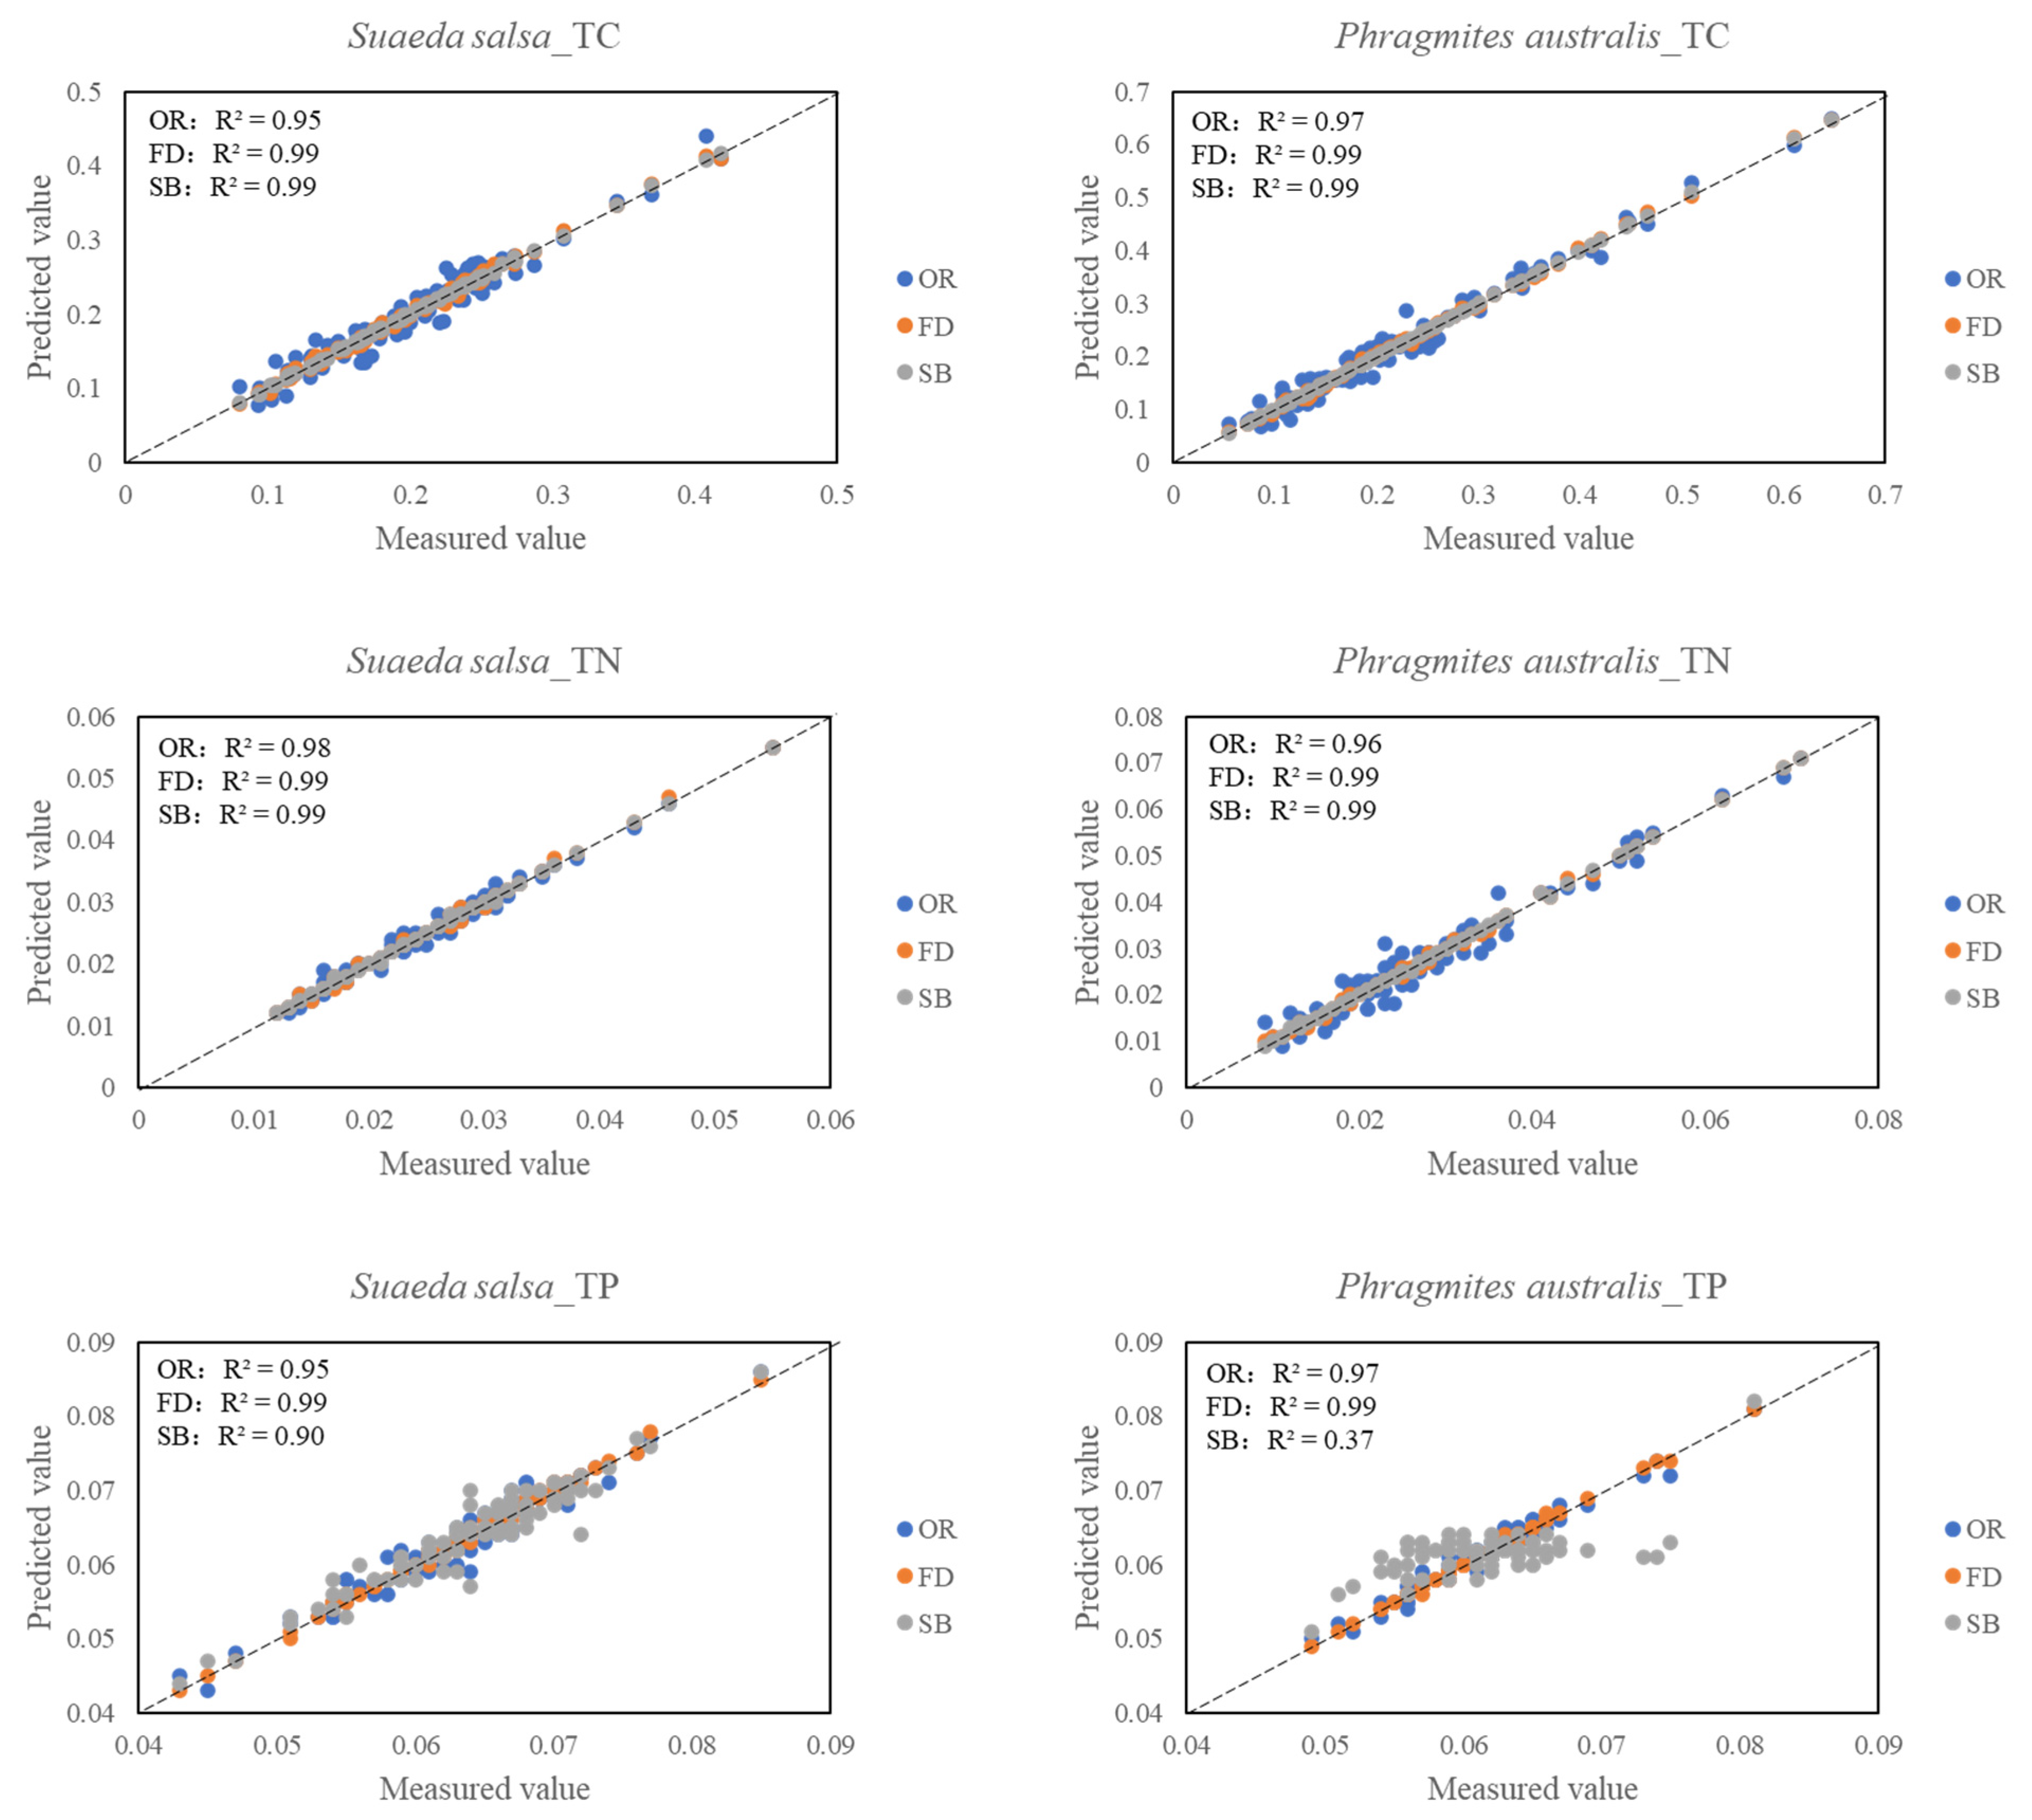
The PLSR model could accurately model and predict the soil carbon, nitrogen, and phosphorus contents (Figure 7). The modelling accuracy of the PLSR model based on the original spectral reflectance and first derivative spectral reflectance was very high, with an R2 of >0.95. The PLSR model based on the sensitive bands performed equally well in most cases, but the R2 value of the PLSR model for the P. australis rhizosphere soil TP was only 0.37; thus, the model was not reliable. Comparing the models constructed using the three spectral data types, the model accuracy of the PLSR model based on the first derivative for both P. australis and S. salsa was very high, with an R2 of 0.99. The PLSR model based on the sensitive bands was less stable than the PLSR model based on the other two spectral data types.

3.5.3. Support Vector Machine Regression Models

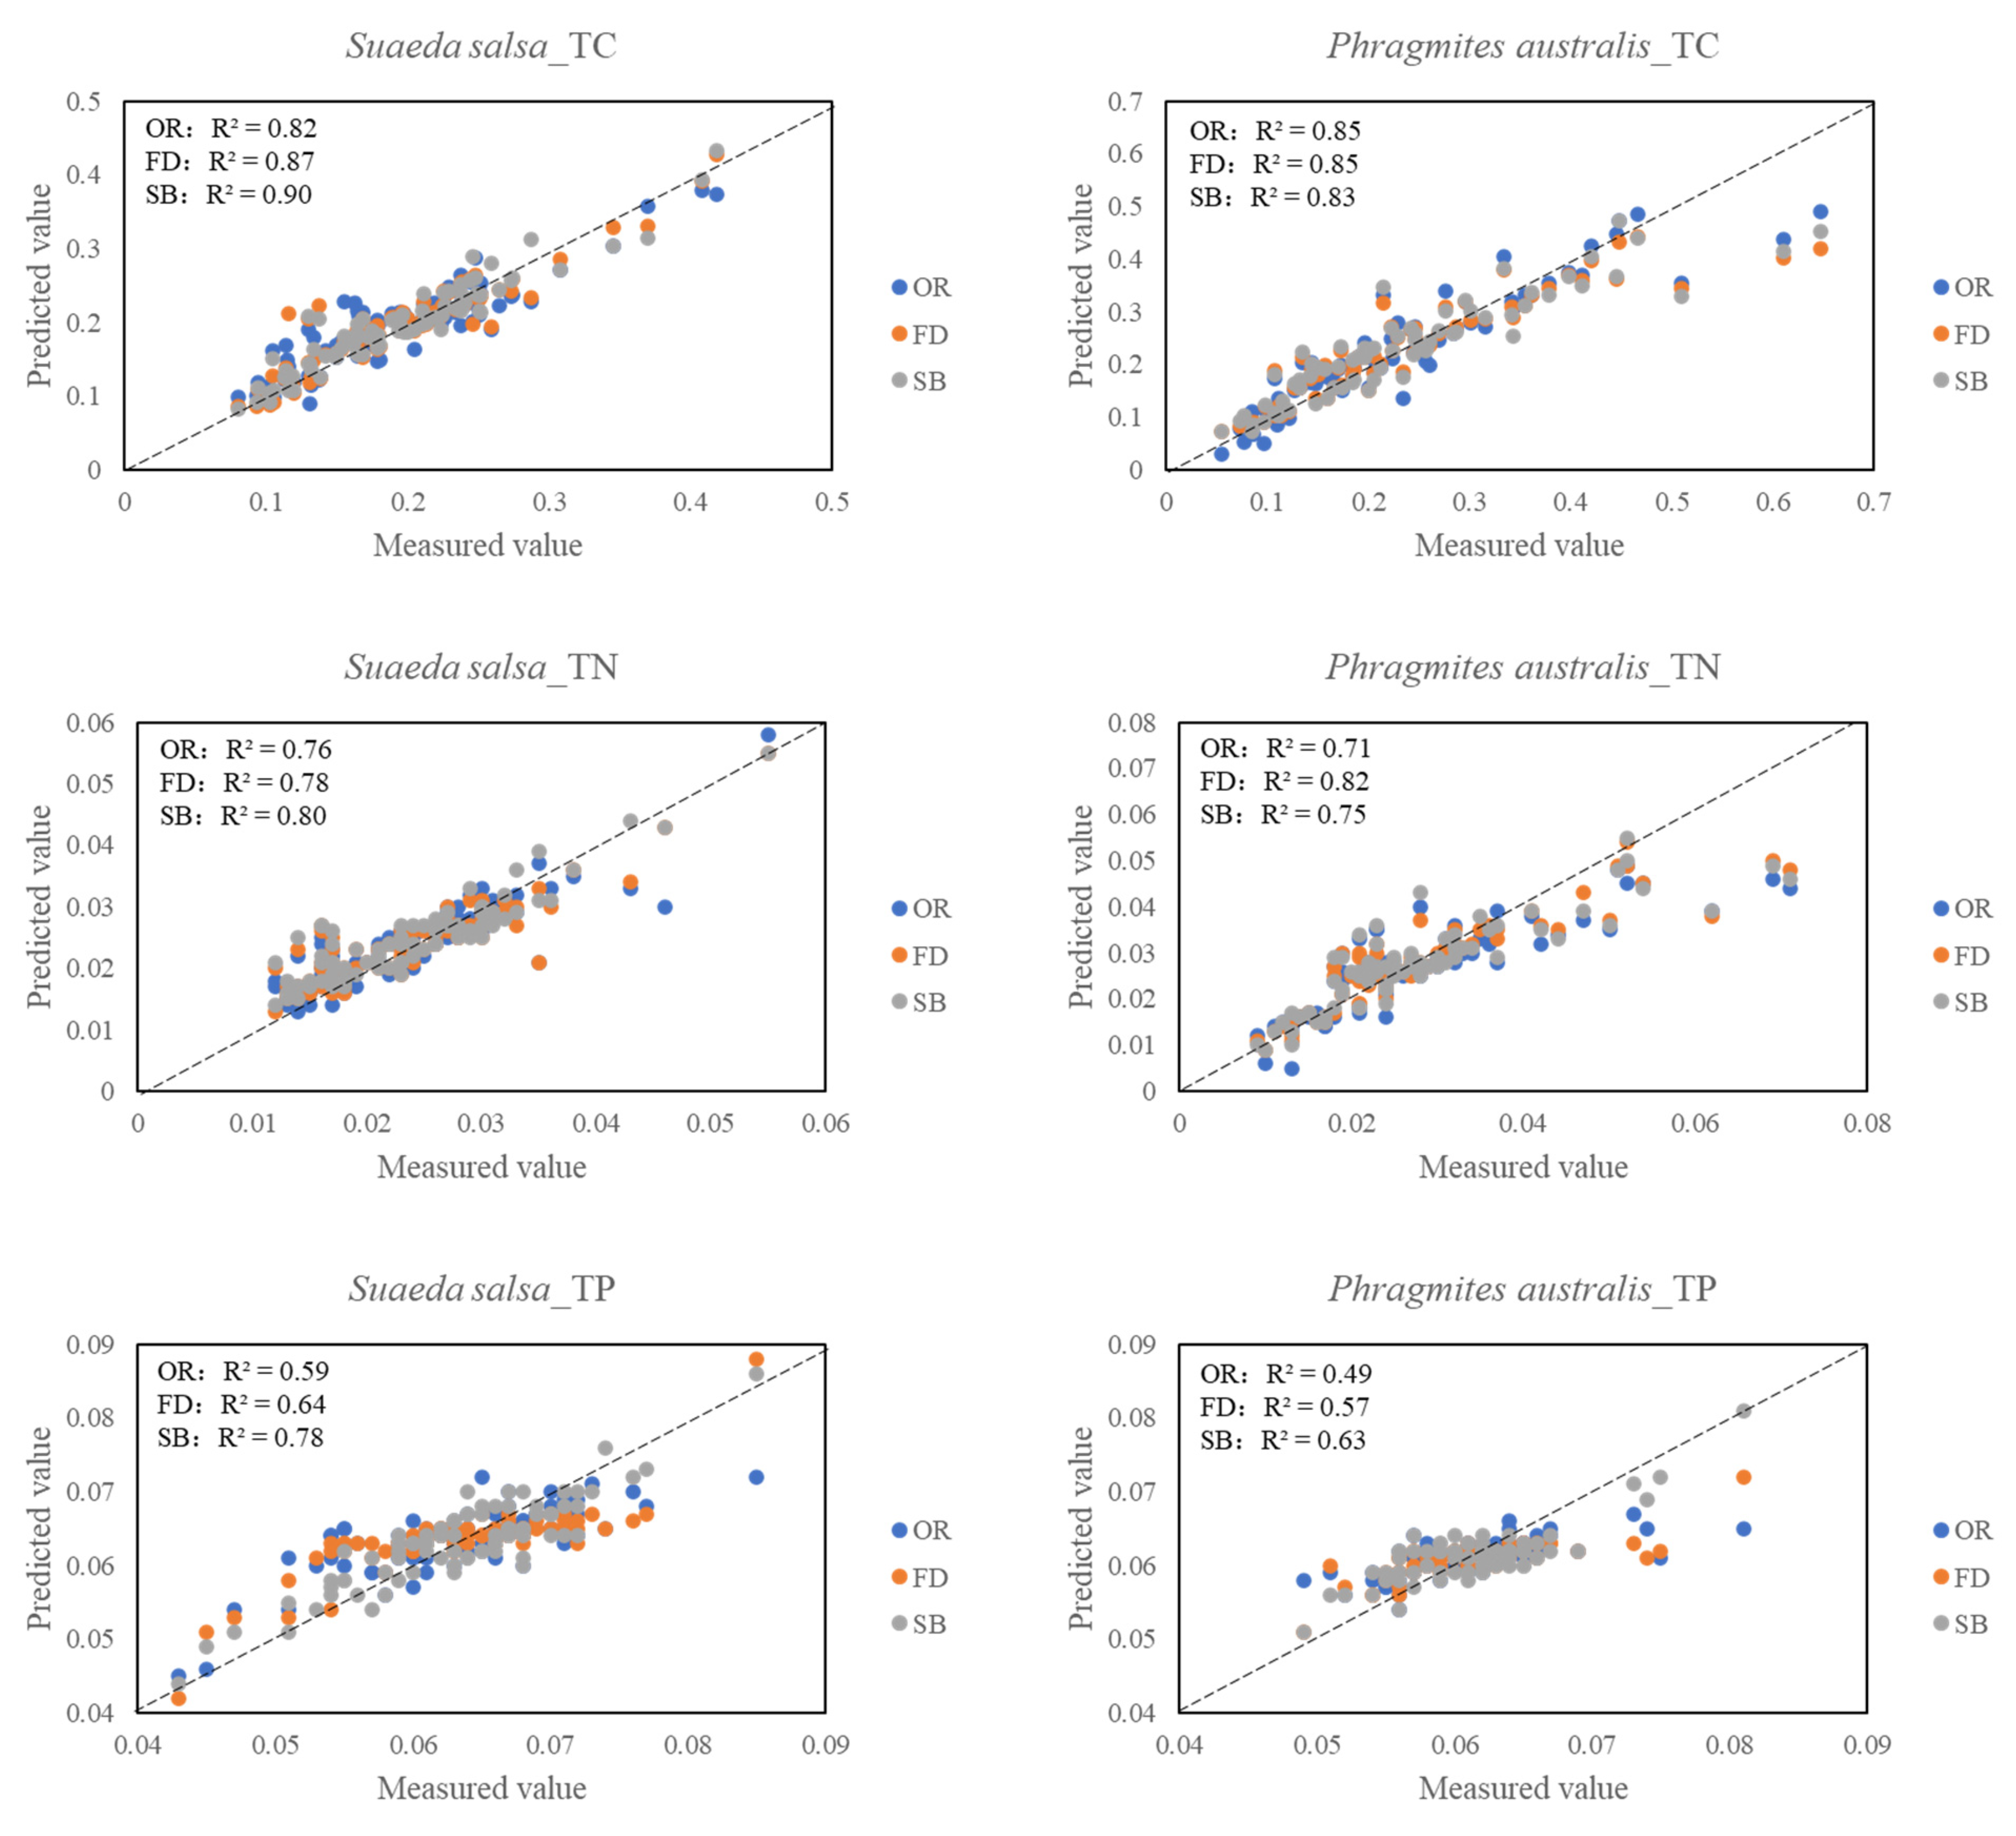
The SVM model had good prediction effects for the soil TC, TN, and TP. The prediction accuracy among the different elements decreased in the following order: TC, TN, and TP (Figure 8). The prediction effect for the soil TC was the best, where the highest R2 was 0.90 and the lowest was 0.82. The prediction of the soil TN was slightly less accurate, where the highest R2 was 0.82 and the lowest was 0.71. The prediction of the soil TP was the worst, with the highest R2 being 0.78 and the lowest being 0.33. Consequently, the reliability of the model predictions was low. Comparing the models of the three spectral data, we found that the R2 of the SVM model based on the sensitive bands was improved compared with that of the SVM model based on the original spectral reflectance, and it was significantly improved compared with that of the SVM model based on the first derivative spectral reflectance. However, the usage of the sensitive bands reduced the R2 of the model when modelling the contents of TC and TN in the P. australis root soil.

3.6. Accuracy of the Prediction Models

In this study, the R2, RMSE, and RPD were used to evaluate the stability and accuracy of retrieving the soil carbon, nitrogen, and phosphorus contents of two dominant plant species using different spectral processing methods and different models. As shown in Table 1, among the three models, the RF model had the best inversion results for the soil carbon, nitrogen, and phosphorus contents. Both the modelling and verification effects were better than those of the other two models, while the PLSR model was slightly better than the SVM model in the other two models. Among the inversion models for soil TC, TN, and TP, the model for TC had the highest prediction accuracy, where its R2 was the highest (0.57) and its RPD was 1.46, indicating that the prediction results of the model were reliable. The prediction effect of TN was slightly worse than that of TC, where the lowest R2 value was 0.47. The inversion effect of each model was largely reliable. The inversion effect of TP was the worst: its lowest R2 was 0.29 and its RPD was less than 1.4. However, some of these prediction models are unreliable. By comparing the prediction effects on different plant root systems, it was found that the prediction effect for the P. australis root soil nutrient elements was slightly better than that for the S. salsa soil.

4. Discussion

4.1. Soil Nutrient Differences

Changes in the soil nutrient contents are the result of a combination of environmental and biological factors, with the former dominated by the altitude gradient, temperature, and soil texture and the latter dominated by vegetation type and soil animal activity. Soil nutrient elements vary in their concentrations and forms of existence, among which the soil organic carbon content is primarily influenced by the decomposition and transformation rate of apoplastic matter, and it is also highly affected by surface vegetation growth [41]. The soil TN content is also closely related to the soil organic carbon content, whereas soil nitrogen is mainly fixed by rhizobia. The soil TP content varied greatly among the sample types. A likely cause of such variation is that soil phosphorus content is affected by multiple soil ecochemical processes, such as weathering and the leaching enrichment of phosphorus-bearing ores [42].
As shown in Figure 2, the distribution trends of the root soil nutrients displayed differences between the P. australis and S. salsa samples. The C, N, and P contents in the root soil of S. salsa in saline land decreased with increasing soil depth; however, the root soil of P. australis showed the opposite trend. Noticeably, the C, N, and P contents in the deepest soil (20–40 cm) were the highest. This phenomenon may have been caused by the combined effects of the degree of soil flooding and the morphological differences between P. australis and S. salsa [43]. The C content of P. australis root soil was higher, which was likely due to the fact that P. australis has much more biomass than S. salsa and that the residual organic matter in the soil is higher. The N and P contents in the root soil system of S. salsa were higher than those in P. australis, which may be caused by the long-term flooding of the soil near the sea and the high contents of N and P in the soil pore water.

4.2. Differences in the Element Contents Retrieved from the Hyperspectral Data

Hyperspectral technology is used to identify substances and determine their chemical compositions and relative contents according to their spectral reflectance. Earlier studies have reported that the visible spectrum is created by the outer electronic transition, whereas the near-infrared spectrum is mainly affected by molecular vibrations, which potentially reflect the compositions and structures of molecules [44]. This basic principle is applied during the quantitative analysis of target substances using hyperspectral technology. While no two substances have the same spectral characteristics, this approach ensures that similar substances will have similar spectral characteristics. Noticeably, during the collection of the soil spectral information, the presence of soil moisture and clay minerals was the main cause for the occurrence of spectral absorption peaks [45,46]. The complex structure and composition of soil often leads to a large number of interference factors in the spectral information [47]. To avoid these unwanted spectral peaks, unified drying and grinding steps are used, which reduce the impacts of soil moisture and soil structure on the spectral reflectance, thus improving the signal-to-noise ratio and contributing to modelling and inversion in the next step.
The contents of soil C and N are considered soil properties that have a direct impact on reflectance [48]. The multiplicity and ensemble frequencies of molecular vibrations are the main sources of differences in spectral reflectance; therefore, spectral analysis is commonly used for the analysis of organic matter containing C-H, N-H, O-H, and other groups. The vast majority of soil N is in the organic-bound state and displays a strong correlation with the C content. Therefore, hyperspectral technology can be used to establish a model of the C and N soil contents for rapid estimation, as well as to achieve a high prediction accuracy. In our study, the prediction accuracy of the TP content prediction models for all types of samples and treated soils was lower than that for soil TC and soil TN. This situation was consistent with the results of the correlation analysis. The poor accuracy of the prediction models and correlation analysis was likely caused by the low P content in the soil, which is known to increase the difficulty of prediction [49].

4.3. Preprocessing Transformations

Hyperspectral data have very high spectral resolutions; thus, while they provide information, most are redundant. Therefore, it is necessary to remove this redundant information to reduce its impact on the establishment of soil TC, TN, and TP content prediction models. In our study, three types of soil spectral reflectance data, namely original spectral reflectance, first derivative spectral reflectance, and first derivative sensitive band spectral reflectance, were selected. The soil nutrient contents of TC, TN, and TP were estimated using three modelling methods—PLSR, RF, and SVM, respectively—and the model prediction accuracy was also improved or largely similar in this study compared with the results of the previous study (Table 2). The correlation analysis indicated that the first derivative processing of spectral reflectance significantly improved the correlation between the spectral reflectance and soil nutrient content compared with the original spectral reflectance, and this result is consistent with the conclusions of other recent studies [50]. Table 1 and Figure 4, Figure 5 and Figure 6 show the prediction results of the prediction models based on the three spectral reflectance data. In general, the accuracy of the prediction model based on the sensitive band was higher than that of those based on the original spectral reflectance and first derivative spectral reflectance. However, there were exceptions, such as the prediction model of soil TP content, which displayed a decline in accuracy. This was likely caused by the spectral reduction in the signal-to-noise ratio [51]. The process of extracting sensitive bands removed some information related to soil phosphorus. In addition, the prediction model based on the first derivative spectral reflectance had better accuracy than the prediction model based on the original spectral reflectance, which suggests that the conversion of spectral variables could effectively eliminate the impacts of environment, soil, and other factors on the spectral information.

4.4. Differences in the Prediction Accuracy of the Different Models

RF is an integral machine learning algorithm that is used for classification and regression. It was constructed by combining the results of various decision trees and bagging the original dataset to select samples. SVM is a popular machine learning technology. This supervised learning model contains related learning algorithms that are used to analyze, classify, and conduct regression analyses on the supplied data. PLSR integrates various analyses, such as correlation, principal component analysis, and multiple linear regression, to identify the primary control factors affecting the dependent variable (soil C, N, and P contents) from the high-dimensional data while reducing the dimensionality of spectral analysis, which makes the constructed model more robust [60].
By comparing the results in Table 1 and Figure 5, Figure 6, Figure 7 and Figure 8, we found that the best inversion model for the soil nutrient content was the RF model. Compared with the other two models, the modelling R2 was higher, and the RMSE was lower. The R2 of the PLSR model was much higher than that of the SVM model during modelling; however, there was little difference between the PLSR and SVM models during validation. This could have been caused by overfitting during modelling by the PLSR, resulting in high modelling but low validation accuracy.

5. Conclusions

To explore the spatial distribution characteristics of soil carbon, nitrogen, and phosphorus contents of different plant roots in the Yellow River Delta and to predict soil carbon, nitrogen, and phosphorus potential using hyperspectral techniques, stratified soil sampling was conducted for two vegetation types. In addition, soil samples were subjected to traditional chemical measurements and spectral data collection. While studying the distribution characteristics of TC, TN, and TP soil nutrients based on the measured values, a rapid inversion of soil total carbon, nitrogen, and phosphorus contents and real-time monitoring of the soil quality were established based on the original spectral reflectance and first spectral reflectance of the soil. Our findings are as follows:
(1)
There was a significant difference in soil total carbon and phosphorus contents between the two vegetation types, and no significant difference in soil carbon, nitrogen, and phosphorus contents between the different strata under the same vegetation type was observed. Therefore, the influence of vegetation type should be considered prior to making modelling predictions.
(2)
The trends of soil correlation coefficient curves were similar for different vegetation types, while the maximum correlation coefficients differed. The first derivative reflectance had a large increase in correlation coefficients compared with the correlation coefficients between the original spectral reflectance and soil carbon, nitrogen, and phosphorus contents.
(3)
The first derivative treatment and division of sample sets according to vegetation types improved the modelling accuracy. The best prediction method for the TC, TN, and TP contents of the P. australis soils was to divide the sample set plus FD plus RF, while that of the S. salsa soils was to divide the sample set plus FD plus SVM.

Author Contributions

Conceptualization, L.N. and W.L.; data curation, L.N. and Z.D.; funding acquisition, W.L.; methodology, X.T.; project administration, Y.L.; resources, L.C.; software, X.Z. (Xiajie Zhai) and X.Z. (Xinsheng Zhao); supervision, J.W.; visualization, J.L. and W.L.; writing—original draft, L.N.; writing—review and editing, W.L. All authors have read and agreed to the published version of the manuscript.

Funding

This work was supported by China’s Special Fund for Basic Scientific Research Business of Central Public Research Institutes (CAFYBB2021ZB003) and the National Key R&D Program of China (2017YFC0506200).

Institutional Review Board Statement

Not applicable.

Data Availability Statement

Data is available from the corresponding author upon request.

Conflicts of Interest

The authors declare no conflict of interest.

References

  1. Bartholomeus, H.; Kooistra, L.; Stevens, A.; van Leeuwen, M.; van Wesemael, B.; Ben-Dor, E.; Tychon, B. Soil Organic Carbon mapping of partially vegetated agricultural fields with imaging spectroscopy. Int. J. Appl. Earth Obs. Geoinf. 2011, 13, 81–88. [Google Scholar] [CrossRef]
  2. Rahman, M.M.; Kamal, M.Z.U.; Ranamukhaarachchi, S.; Alam, M.S.; Alam, M.K.; Khan, M.A.R.; Islam, M.M.; Alam, M.A.; Jiban, S.I.; Al Mamun, M.A.; et al. Effects of Organic Amendments on Soil Aggregate Stability, Carbon Sequestration, and Energy Use Efficiency in Wetland Paddy Cultivation. Sustainability 2022, 14, 4475. [Google Scholar] [CrossRef]
  3. Ledford, K.; Schmidt, S.A.; Ahn, C. Assessing carbon storage potential of forested wetland soils in two physiographic provinces of northern virginia, USA. Sustainability 2022, 14, 2048. [Google Scholar] [CrossRef]
  4. Reich, P.B.; Tjoelker, M.G.; Machado, J.; Oleksyn, J. Universal scaling of respiratory metabolism, size and nitrogen in plants. Nature 2006, 439, 7075. [Google Scholar] [CrossRef] [PubMed]
  5. Lu, M.; Liu, K.; Zhang, L.; Zeng, F.; Song, T.; Peng, W.; Du, H. Stoichiometric Variation in Soil Carbon, Nitrogen, and Phosphorus Following Cropland Conversion to Forest in Southwest China. Forests 2022, 13, 1155. [Google Scholar] [CrossRef]
  6. Spohn, M.; Stendahl, J. Carbon, nitrogen, and phosphorus stoichiometry of organic matter in Swedish forest soils and its relationship with climate, tree species, and soil texture. Biogeosciences 2022, 19, 2171–2186. [Google Scholar] [CrossRef]
  7. Wang, X.W.; Sun, X.X.; Sun, L.; Chen, N.; Du, Y. Small-Scale Variability of Soil Quality in Permafrost Peatland of the Great Hing’an Mountains, Northeast China. Water 2022, 14, 2597. [Google Scholar] [CrossRef]
  8. Serrani, D.; Cocco, S.; Cardelli, V.; D′Ottavio, P.; Borguete, A.R.R.; Feniasse, D.; Vilanculos, A.; Fernández-Marcos, M.L.; Giosué, C.; Tittarelli, F.; et al. Soil fertility in slash and burn agricultural systems in central Mozambique. J. Environ. Manag. 2022, 322, 116031. [Google Scholar] [CrossRef]
  9. Tedontsah, V.P.L.; Mbog, M.B.; Ngon, G.F.N.; Edzoa, R.C.; Tassongwa, B.; Bitom, D.; Etame, J. Physicochemical Properties and Fertility Assessment of Soils in Foumban (West Cameroon). Appl. Environ. Soil Sci. 2022, 2022, 7889430. [Google Scholar] [CrossRef]
  10. Chen, M.Y.; Yang, X.; Shao, M.A.; Wei, X.R.; Li, T.C. Changes in soil C-N-P stoichiometry after 20 years of typical artificial vegetation restoration in semiarid continental climate zones. Sci. Total Environ. 2022, 852, 158380. [Google Scholar] [CrossRef]
  11. Sweetman, A.J.; Valle, M.D.; Prevedouros, K.; Jones, K.C. The role of soil organic carbon in the global cycling of persistent organic pollutants (POPs): Interpreting and modelling field data. Chemosphere 2005, 60, 959–972. [Google Scholar] [CrossRef] [PubMed]
  12. Amol, D.V.; Karbhari, V.K.; Sandeep, V.G. Estimation of soil nitrogen in agricultural regions by VNIR reflectance spectroscopy. SN Appl. Sci. 2020, 2, 21–56. [Google Scholar]
  13. Zheng, W.; Lu, X.; Li, Y. Hyperspectral identification of chlorophyll fluorescence parameters of Suaeda salsa in coastal wetlands. Remote Sens. 2021, 13, 2066. [Google Scholar] [CrossRef]
  14. Lin, C.; Hu, Y.; Liu, Z.; Peng, Y.; Wang, L.; Peng, D. Estimation of cultivated land quality based on soil hyperspectral data. Agriculture 2022, 12, 93–98. [Google Scholar] [CrossRef]
  15. Dhawale, N.M.; Adamchuk, V.I.; Prasher, S.O.; Rossel, R.A.V.; Ismail, A.A. Evaluation of two portable hyperspectral-sensor-based instruments to predict key soil properties in canadian soils. Sensors 2022, 22, 2556. [Google Scholar] [CrossRef] [PubMed]
  16. Yu, S.y.; Bu, H.R.; Dong, W.C.; Jiang, Z.; Zhang, L.X.; Xia, Y.Q. Construction and Evaluation of Prediction Model of Main Soil Nutrients Based on Spectral Information. Appl. Sci. 2022, 12, 6298. [Google Scholar] [CrossRef]
  17. Odebiri, O.; Mutanga, O.; Odindi, J.; Naicker, R.; Masemola, C.; Sibanda, M. Deep learning approaches in remote sensing of soil organic carbon: A review of utility, challenges, and prospects. Environ. Monit. Assess. 2021, 193, 802. [Google Scholar] [CrossRef]
  18. Misbah, K.; Laamrani, A.; Khechba, K.; Dhiba, D.; Chehbouni, A. Multi-Sensors remote sensing applications for assessing, monitoring, and mapping npk content in soil and crops in african agricultural land. Remote Sens. 2021, 14, 81. [Google Scholar] [CrossRef]
  19. Chandan, G.; Naorem, J.S.; Bijoy, K.H. Hyperspectral spectroscopic study of soil properties a review. Int. J. Plant Soil Sci. 2020, 23, 14–25. [Google Scholar]
  20. Ewing, J.; Oommen, T.; Jayakumar, P.; Alger, R. Utilizing hyperspectral remote sensing for soil gradation. Remote Sens. 2020, 12, 3312. [Google Scholar] [CrossRef]
  21. Mônica, S.C.; Marcos, R.N.; Marcelo, L.C.; Renato, H.F.; Everson, C.; Roney, B.D.O. Hyperspectral remote detection as an alternative to correlate data of soil constituents. Remote Sens. Appl. Soc. Environ. 2019, 16, 100270. [Google Scholar]
  22. Michael, V.; Marie, L.; Sören, T.; Bernard, L. Quantification of soil properties with hyperspectral data: Selecting spectral variables with different methods to improve accuracies and analyze prediction mechanisms. Remote Sens. 2017, 9, 1103. [Google Scholar]
  23. Xu, S.X.; Wang, M.Y.; Shi, X.Z.; Yu, Q.B.; Zhang, Z.Q. Integrating hyperspectral imaging with machine learning techniques for the high-resolution mapping of soil nitrogen fractions in soil profiles. Sci. Total Environ. 2021, 754, 142135. [Google Scholar] [CrossRef] [PubMed]
  24. Dhawale, N.M.; Adamchuk, V.I.; Prasher, S.O.; Rossel, R.A.V. Evaluating the Precision and Accuracy of Proximal Soil vis–NIR Sensors for Estimating Soil Organic Matter and Texture. Soil Syst. 2021, 5, 48. [Google Scholar] [CrossRef]
  25. Guo, H.L.; Zhang, R.R.; Dai, W.H.; Zhou, X.W.; Zhang, D.J.; Yang, Y.H.; Cui, J. Mapping Soil Organic Matter Content Based on Feature Band Selection with ZY1-02D Hyperspectral Satellite Data in the Agricultural Region. Agronomy 2022, 12, 2111. [Google Scholar] [CrossRef]
  26. Zhu, J.J.; Jin, X.; Li, S.W.; Han, Y.L.; Zheng, W.R. Prediction of Soil Available Boron Content in Visible-Near-Infrared Hyperspectral Based on Different Preprocessing Transformations and Characteristic Wavelengths Modeling. Comput. Intell. Neurosci. 2022, 2022, 9748257. [Google Scholar] [CrossRef]
  27. Tang, R.N.; Li, X.W.; Li, C.; Jiang, K.X.; Hu, W.F.; Wu, J.J. Estimation of Total Nitrogen Content in Rubber Plantation Soil Based on Hyperspectral and Fractional Order Derivative. Electronics 2022, 11, 1956. [Google Scholar] [CrossRef]
  28. Zhang, Z.H.; Guo, F.; Xu, Z.; Yang, X.Y.; Wu, K.Z. On retrieving the chromium and zinc concentrations in the arable soil by the hyperspectral reflectance based on the deep forest. Ecol. Indic. 2022, 144, 109440. [Google Scholar] [CrossRef]
  29. Naveen, J.P.A.; Amr, H.A.; David, B.L.; Nicole, A.H. Modeling soil parameters using hyperspectral image reflectance in subtropical coastal wetlands. Int. J. Appl. Earth Obs. Geoinf. 2014, 33, 47–56. [Google Scholar]
  30. Zhang, S.; Lu, X.; Zhang, Y.; Nie, G.; Li, Y. Estimation of soil organic matter, total nitrogen and total carbon in sustainable coastal wetlands. Sustainability 2019, 11, 667. [Google Scholar] [CrossRef] [Green Version]
  31. Zhao, D.M.; Wang, J.Z.; Miao, J.; Zhen, J.N.; Wang, J.J.; Gao, C.J.; Jiang, J.C.; Wu, G.F. Spectral features of Fe and organic carbon in estimating low and moderate concentration of heavy metals in mangrove sediments across different regions and habitat types. Geoderma 2022, 426, 116093. [Google Scholar] [CrossRef]
  32. Chen, Z.Y.; Ren, S.J.; Qin, R.M.; Nie, P.C. Rapid Detection of Different Types of Soil Nitrogen Using Near-Infrared Hyperspectral Imaging. Molecules 2022, 27, 2017. [Google Scholar] [CrossRef] [PubMed]
  33. Wei, D.; Zheng, G. Estimation of soil total phosphorus content in coastal areas based on hyperspectral reflectance. Spectrosc. Spectr. Anal. 2022, 42, 158–163. [Google Scholar]
  34. Gao, Y.; Liu, L.; Zhu, P.; Yang, S.; Guo, W.; Yu, X. Patterns and dynamics of the soil microbial community with gradual vegetation succession in The Yellow River Delta, China. Wetlands 2021, 41, 9. [Google Scholar] [CrossRef]
  35. Li, F.; Xie, Y.; Chen, X.; Hou, Z.; Li, X.; Deng, Z.; Liu, Y.; Hu, J.; Liu, N. Succession of aquatic macrophytes in the Modern Yellow River Delta after 150 years of alluviation. Wetl. Ecol. Manag. 2013, 21, 219–228. [Google Scholar] [CrossRef]
  36. Liu, Q.; Liu, G.; Huang, C.; Li, H. Soil physicochemical properties associated with quasi-circular vegetation patches in the Yellow River Delta, China. Geoderma 2019, 337, 202–214. [Google Scholar] [CrossRef]
  37. Li, G.; Ma, S.; Li, K.; Zhou, M.; Lin, L. Heterogeneity classification based on hyperspectral transmission imaging and multivariate data analysis. Infrared Phys. Technol. 2022, 123, 104180. [Google Scholar] [CrossRef]
  38. Chen, Y.; Wang, J.; Liu, G. Hyperspectral estimation model of forest soil organic matter in northwest Yunnan Province, China. Forests 2019, 10, 217–233. [Google Scholar] [CrossRef] [Green Version]
  39. Nikolaos, T.; Nikolaos, T.; Yaron, O.; Eleni, K.; Eyal, B.; John, T.; George, Z. An integrated methodology using open soil spectral libraries and Earth Observation data for soil organic carbon estimations in support of soil-related SDGs. Remote Sens. Environ. 2020, 244, 111793. [Google Scholar]
  40. Wang, J.J.; Xu, Y.; Wu, G.F. The integration of species information and soil properties for hyperspectral estimation of leaf biochemical parameters in mangrove forest. Ecol. Indic. 2020, 115, 106467. [Google Scholar] [CrossRef]
  41. Cui, L.; Dou, Z.; Liu, Z.; Zuo, X.; Lei, Y.; Li, J.; Zhao, X.; Zhai, X.; Pan, X.; Li, W. Hyperspectral inversion of phragmites australis carbon, nitrogen, and phosphorus stoichiometry using three models. Remote Sens. 2020, 12, 1998. [Google Scholar] [CrossRef]
  42. Lin, Y.; Li, Z.; Lv, S.; Huang, H.; Hu, J. Detection of soil total nitrogen, phosphorus and potassium content based on the spectral information of citrus canopy. Am. J. Biochem. Biotechnol. 2020, 16, 177–183. [Google Scholar]
  43. Sun, W.; Shuo, L.; Xia, Z.; Yao, L. Estimation of soil organic matter content using selected spectral subset of hyperspectral data. Geoderma 2022, 409, 115653. [Google Scholar] [CrossRef]
  44. Danesh, M.; Bahrami, H.A. Modeling of Soil Sand Particles Using Spectroscopy Technology. Commun. Soil Sci. Plant Anal. 2022, 53, 2216–2228. [Google Scholar] [CrossRef]
  45. Divyesh, M.V.; Ajay, K.M.; Onkar, D. Development of Spectral Indexes in Hyperspectral Imagery for Land Cover Assessment. IETE Tech. Rev. 2019, 36, 216–230. [Google Scholar]
  46. Andrea, C.; Frédéric, A.; Francesca, G.; Gilles, G.; Sébastien, L.; Leandro, C.; Sandro, M. Improved estimation of soil clay content by the fusion of remote hyperspectral and proximal geophysical sensing. J. Appl. Geophys. 2015, 116, 135–145. [Google Scholar]
  47. Nikolaos, T.; Nikolaos, T.; Eyal, B.; John, T.; George, Z. Employing a Multi-Input Deep Convolutional Neural Network to Derive Soil Clay Content from a Synergy of Multi-Temporal Optical and Radar Imagery Data. Remote Sens. 2020, 12, 1389. [Google Scholar]
  48. Michael, S.K.; David, S.; Kevin, T.; Court, S. The Effects of tidal inundation on the reflectance characteristics of coastal marsh vegetation. J. Coast. Res. 2009, 25, 1177–1186. [Google Scholar]
  49. Ribeiro, S.G.; Teixeira, A.D.S.; de Oliveira, M.R.R.; Costa, M.C.G.; Araújo, I.C.D.S.; Moreira, L.C.J.; Lopes, F.B. Soil Organic Carbon Content Prediction Using Soil-Reflected Spectra: A Comparison of Two Regression Methods. Remote Sens. 2021, 13, 4752. [Google Scholar] [CrossRef]
  50. Gao, L.L.; Zhu, X.C.; Han, Z.Y.; Wang, L.; Zhao, G.X.; Jiang, Y.M. Spectroscopy-Based Soil Organic Matter Estimation in Brown Forest Soil Areas of the Shandong Peninsula, China. Pedosphere 2019, 29, 810–818. [Google Scholar] [CrossRef]
  51. Xu, X.; Chen, S.; Xu, Z.; Yu, Y.; Zhang, S.; Dai, R. Exploring appropriate preprocessing techniques for hyperspectral soil organic matter content estimation in black soil area. Remote Sens. 2020, 12, 3765. [Google Scholar] [CrossRef]
  52. Wang, S.; Guan, K.Y.; Zhang, C.H.; Lee, D.; Margenot, A.J.; Ge, Y.F.; Peng, J.; Zhou, W.; Zhou, Q.; Huang, Y.Z. Using soil library hyperspectral reflectance and machine learning to predict soil organic carbon: Assessing potential of airborne and spaceborne optical soil sensing. Remote Sens. Environ. 2022, 271, 112914. [Google Scholar] [CrossRef]
  53. Mondal, B.P.; Sekhon, B.S.; Sahoo, R.N.; Paul, P. Vis-nir reflectance spectroscopy for assessment of soil organic carbon in a rice-wheat field of ludhiana district of punjab. ISPRS-Int. Arch. Photogramm. Remote Sens. Spat. Inf. Sci. 2019, 43, 417–422. [Google Scholar] [CrossRef] [Green Version]
  54. Anna, P.; Marcin, C.; Jakub, R.; Tadeusz, U. Application of FT-NIR spectroscopy and NIR hyperspectral imaging to predict nitrogen and organic carbon contents in mine soils. Measurement 2020, 164, 108117. [Google Scholar]
  55. Lin, L.X.; Liu, X.X. Mixture-based weight learning improves the random forest method for hyperspectral estimation of soil total nitrogen. Comput. Electron. Agric. 2022, 192, 106634. [Google Scholar] [CrossRef]
  56. Pechanec, V.; Mráz, A.; Rozkošný, L.; Vyvlečka, P. Usage of airborne hyperspectral imaging data for identifying spatial variability of soil nitrogen content. ISPRS Int. J. Geo-Inf. 2021, 10, 355. [Google Scholar] [CrossRef]
  57. Li, H.Y.; Jia, S.Y.; Le, Z.C. Quantitative analysis of soil total nitrogen using hyperspectral imaging technology with extreme learning machine. Sensors 2019, 19, 4355. [Google Scholar] [CrossRef] [Green Version]
  58. Malmir, M.; Tahmasbian, I.; Xu, Z.H.; Farrar, M.B.; Bai, S.H. Prediction of soil macro- and micro-elements in sieved and ground air-dried soils using laboratory-based hyperspectral imaging technique. Geoderma 2019, 340, 70–80. [Google Scholar] [CrossRef]
  59. Lu, P.; Wang, L.; Niu, Z.; Li, L.H.; Zhang, W.H. Prediction of soil properties using laboratory VIS–NIR spectroscopy and Hyperion imagery. J. Geochem. Explor. 2013, 132, 26–33. [Google Scholar] [CrossRef]
  60. Li, W.; Dou, Z.; Cui, L.; Wang, R.; Zhao, Z.; Cui, S.; Zhai, X. Suitability of hyperspectral data for monitoring nitrogen and phophorus content in constructed wetlands. Remote Sens. Lett. 2020, 11, 495–504. [Google Scholar] [CrossRef]
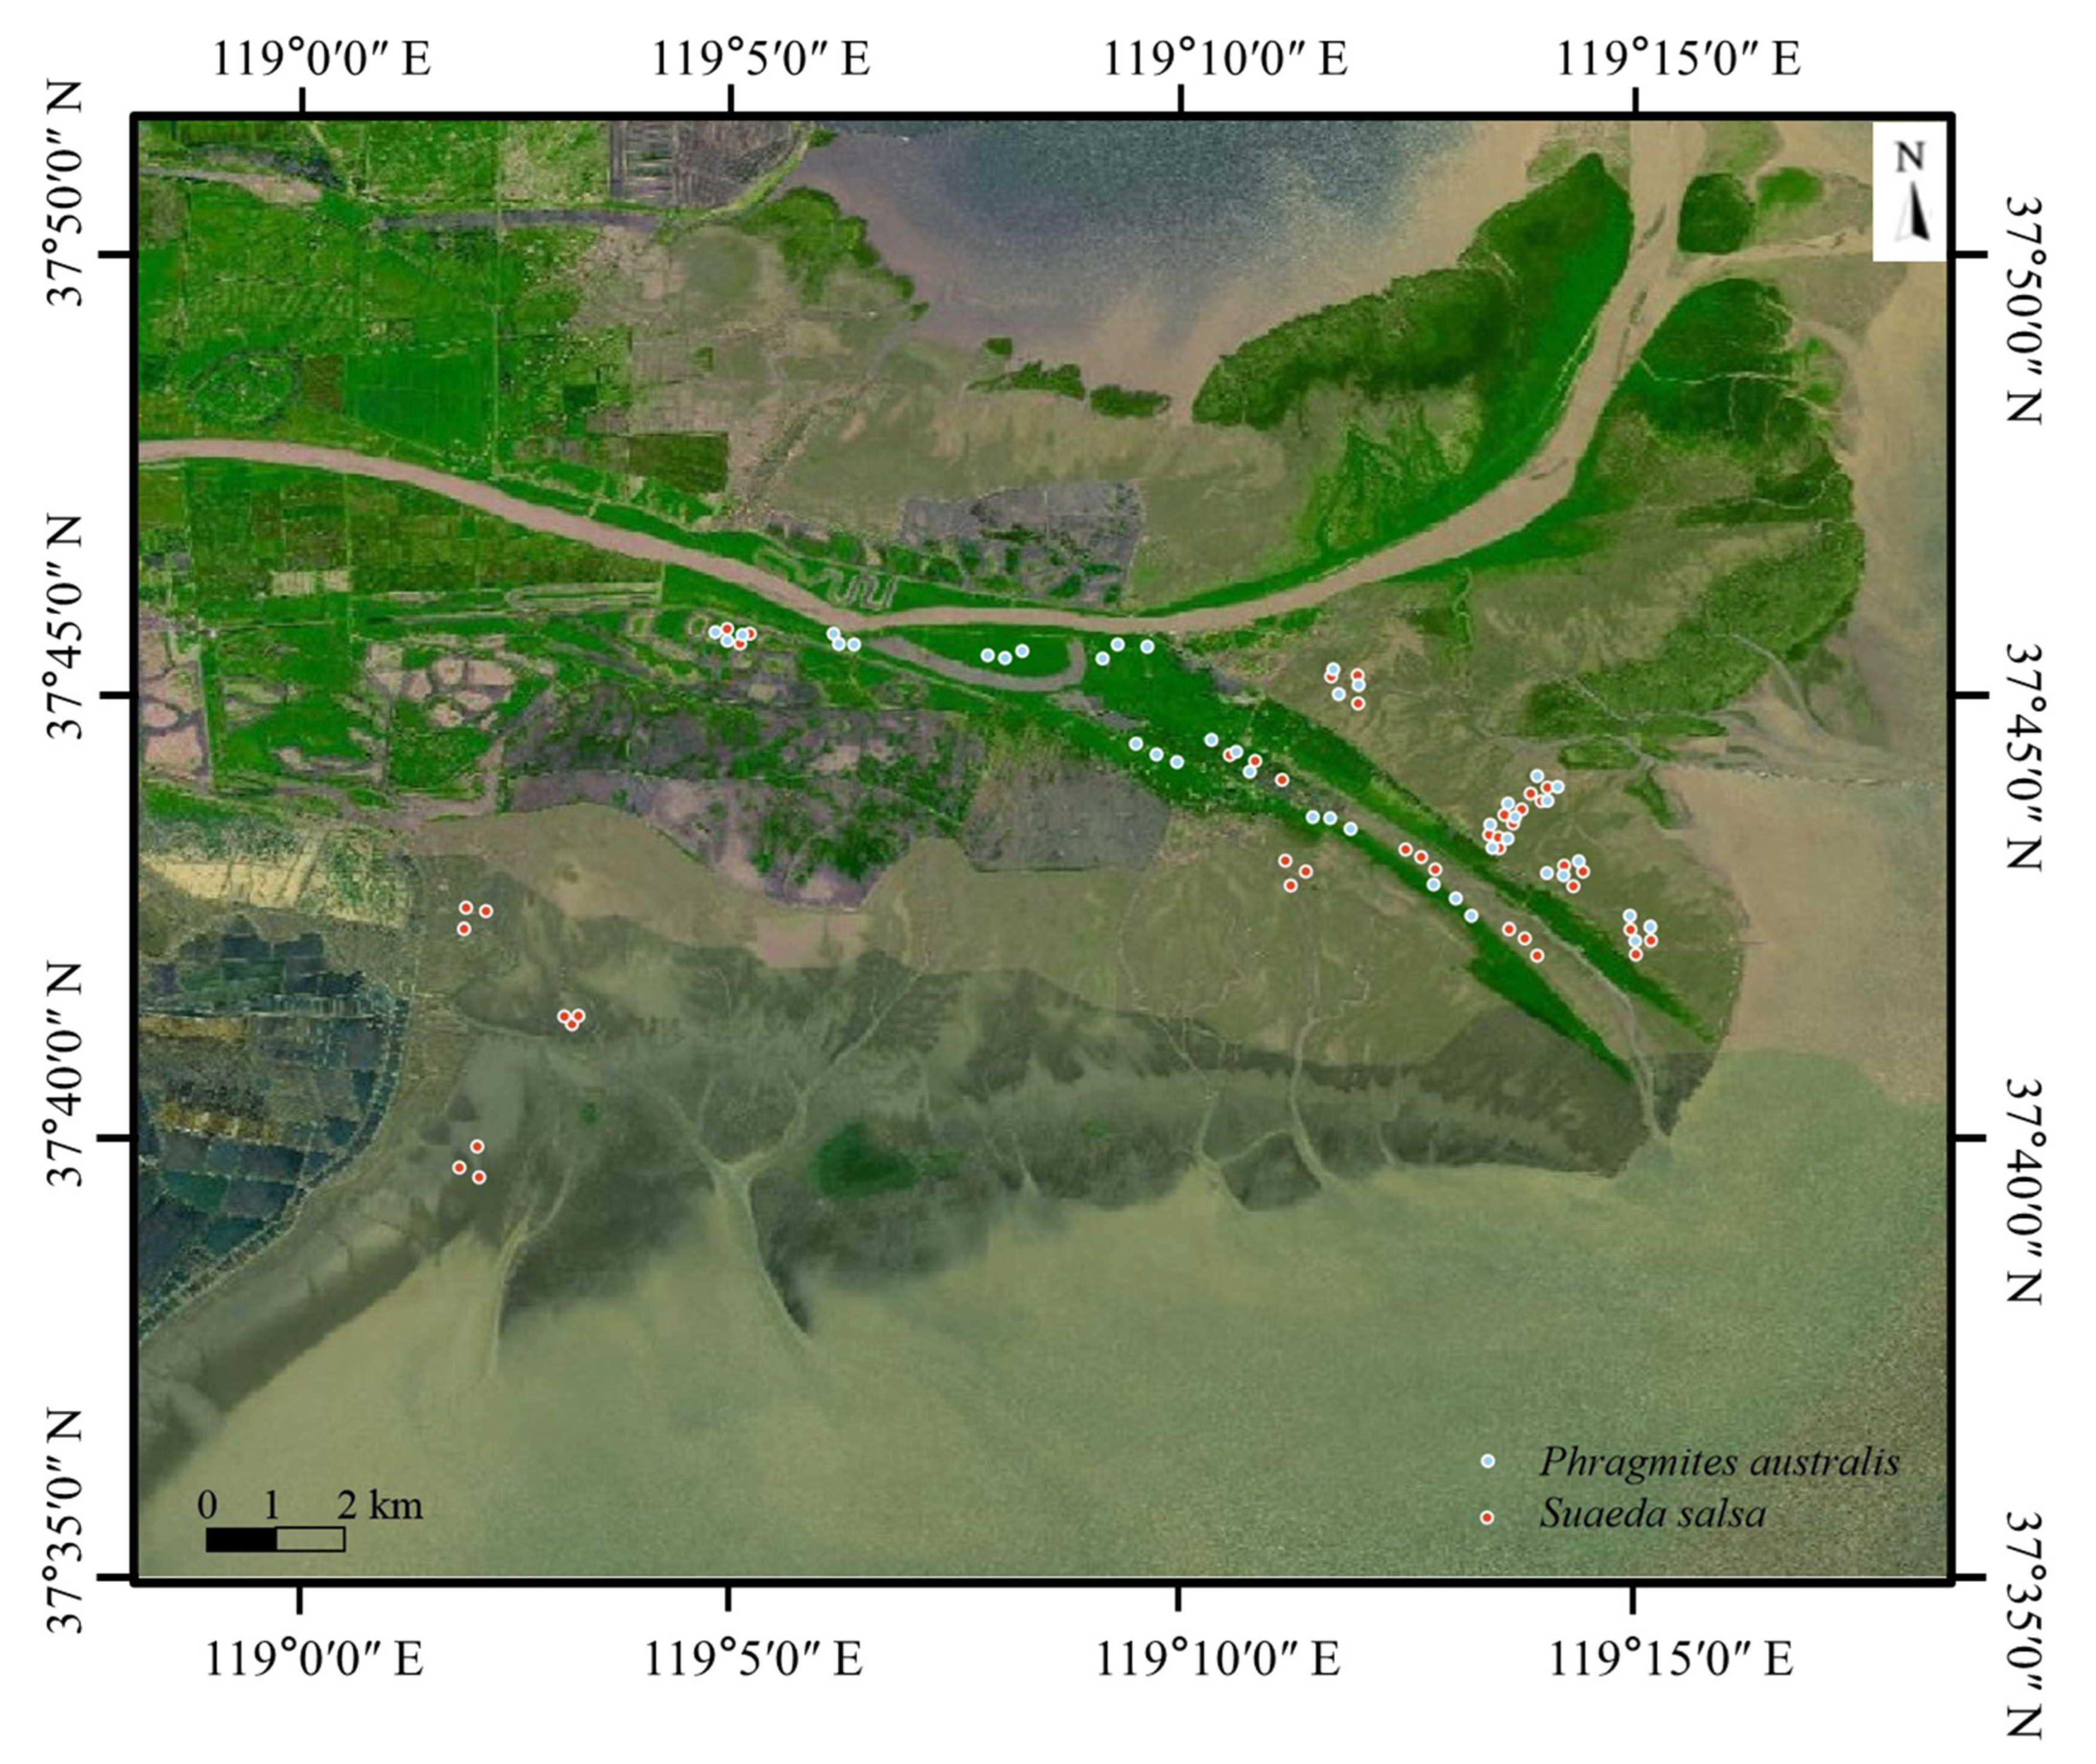
Figure 1. Location of the study area and sampling sites.
Diversity 14 00862 g001
Figure 2. Total carbon (TC), total nitrogen (TN), and total phosphorus (TP) contents of the inter-root soils of two plants, S. salsa and P. australis (depth 1 = 0–20 cm, depth 2 = 20–40 cm, and depth 3 = 40–60 cm). Notes: different capital letters (A, B) represent significant differences in the soil elements under the different vegetation types, and lowercase letters (a) represent nosignificant differences in the soil elements in the different soil layers of the same vegetation type.
Diversity 14 00862 g002
Figure 3. Spectral reflectance curves of P. australis and S. salsa.
Diversity 14 00862 g003
Figure 4. Correlation between the original reflectance (OR) and first derivative reflectance (FD) of P. australis (PA) and S. salsa (SS) and the soil total carbon (TC), total nitrogen (TN), and total phosphorus (TP) contents.
Diversity 14 00862 g004
Figure 5. Modelling results of the carbon, nitrogen, and phosphorus levels in inverted wetland soils using three models: partial least-squares regression (PLSR), random forest (RF), and support vector machine (SVM). OR: original reflectance; FD: first derivative reflectance.
Diversity 14 00862 g005
Figure 6. RF modelling results for P. australis and S. salsa. OR: original reflectance; FD: first derivative reflectance; SB: sensitive band.
Diversity 14 00862 g006
Figure 7. PLSR modelling results for P. australis and S. salsa. OR: original reflectance; FD: first derivative reflectance; SB: sensitive band.
Diversity 14 00862 g007
Figure 8. SVM modelling results for P. australis and S. salsa. OR: original reflectance; FD: first derivative reflectance; SB: sensitive band.
Diversity 14 00862 g008
Table 1. Accuracy of the prediction models for P. australis (PA) and S. salsa (SS) total carbon (TC), total nitrogen (TN), and total phosphorus (TP).
IndexPLSRRFSVM
ModelTestRPDModelTestRPDModelTestRPD
RMSERMSERMSERMSERMSERMSE
TCPAOR0.970.0200.790.0782.110.940.0510.870.0542.690.850.0940.770.0741.37
FD0.990.0040.860.0642.310.950.0450.910.0462.900.850.1020.800.0840.98
SB0.990.0010.890.0522.950.960.0420.920.0433.190.830.0980.790.0831.09
SSOR0.950.0160.570.0601.460.840.0530.670.0471.560.820.0990.790.0391.78
FD0.990.0150.620.0561.580.960.0230.810.0371.930.870.0240.850.0332.37
SB0.990.0050.630.0571.550.960.0100.870.0312.270.900.0230.880.0282.76
MIXOR0.900.0350.670.1191.120.880.0500.730.109 0.910.710.0890.640.1040.76
FD0.980.0020.650.1221.040.960.0270.860.0920.970.700.0960.610.1131.37
TNPAOR0.960.0030.580.0081.990.900.0060.850.0062.260.710.0120.610.0110.82
FD0.990.0010.760.0081.880.940.0050.920.0052.920.820.0110.680.0101.04
SB0.990.0010.870.0062.740.950.0040.940.0043.430.750.0110.640.0100.91
SSOR0.980.0010.470.0061.400.940.0030.640.0051.230.760.0040.710.004 1.22
FD0.990.0010.620.0051.340.970.0010.760.0041.800.780.0020.730.0041.58
SB0.990.0010.660.0051.460.960.0010.780.0041.850.800.0020.760.0041.68
MIXOR0.820.0030.710.0101.360.870.0050.480.0120.740.760.0080.720.0101.29
FD0.970.0010.640.0113.330.960.0020.700.0091.030.990.0040.780.0081.36
TPPAOR0.970.0010.520.0041.410.930.0020.620.0031.330.490.0040.440.0041.10
FD0.990.0010.600.0041.490.970.0020.700.0031.180.570.0040.500.0041.17
SB0.370.0040.290.0050.750.920.0020.760.0031.730.630.0030.530.0041.20
SSOR0.950.0020.450.0061.180.940.0030.520.0051.000.590.0050.520.0051.19
FD0.990.0010.530.0051.210.960.0010.640.0041.340.640.0030.610.0041.11
SB0.900.0020.690.0041.740.940.0010.730.0041.810.780.0030.740.0041.95
MIXOR0.900.0020.470.0071.000.930.0020.400.0060.470.710.0020.390.0050.48
FD0.960.0010.490.0060.930.970.0010.310.0060.300.700.0020.330.0060.72
Table 2. Comparison of soil carbon, nitrogen, and phosphorus between other research results and this paper.
ElementAccuracySpectral DataModelAuthorAccuracy in the Present Study
CR2 = 0.95First derivativeRFWang S. et al., 2022 [52]R2 = 0.91
CR2 = 0.44UntransformedPLSRMondal B. P. et al., 2019 [53]R2 = 0.67
CR2 = 0.81Smoothed reflectancePLSRRibeiro S. G. et al., 2021 [49]R2 = 0.89
CRPD = 2.52UntransformedPLSRAnna P. et al., 2020 [54]RPD = 2.11
NR2 = 0.76UntransformedRFLin X. L. et al., 2022 [55]R2 = 0.85
NR2 = 0.35UntransformedPLSRPechanec V. et al., 2021 [56]R2 = 0.71
NR2 = 0.94UntransformedSVMXu S. X. et al., 2021 [23]R2 = 0.72
NR2 = 0.81Smoothed reflectancePLSRLi H. Y. et al., 2019 [57]R2 = 0.87
PR2 = 0.34UntransformedPLSRMalmir M. et al., 2019 [58]R2 = 0.47
PR2 = 0.54UntransformedPLSRLu P. et al., 2013 [59]R2 = 0.47
Publisher’s Note: MDPI stays neutral with regard to jurisdictional claims in published maps and institutional affiliations.