
Why Did Brown Hare Lepus europaeus Disappear from Some Areas in Central Poland?

Abstract
:1. Introduction
2. Methods
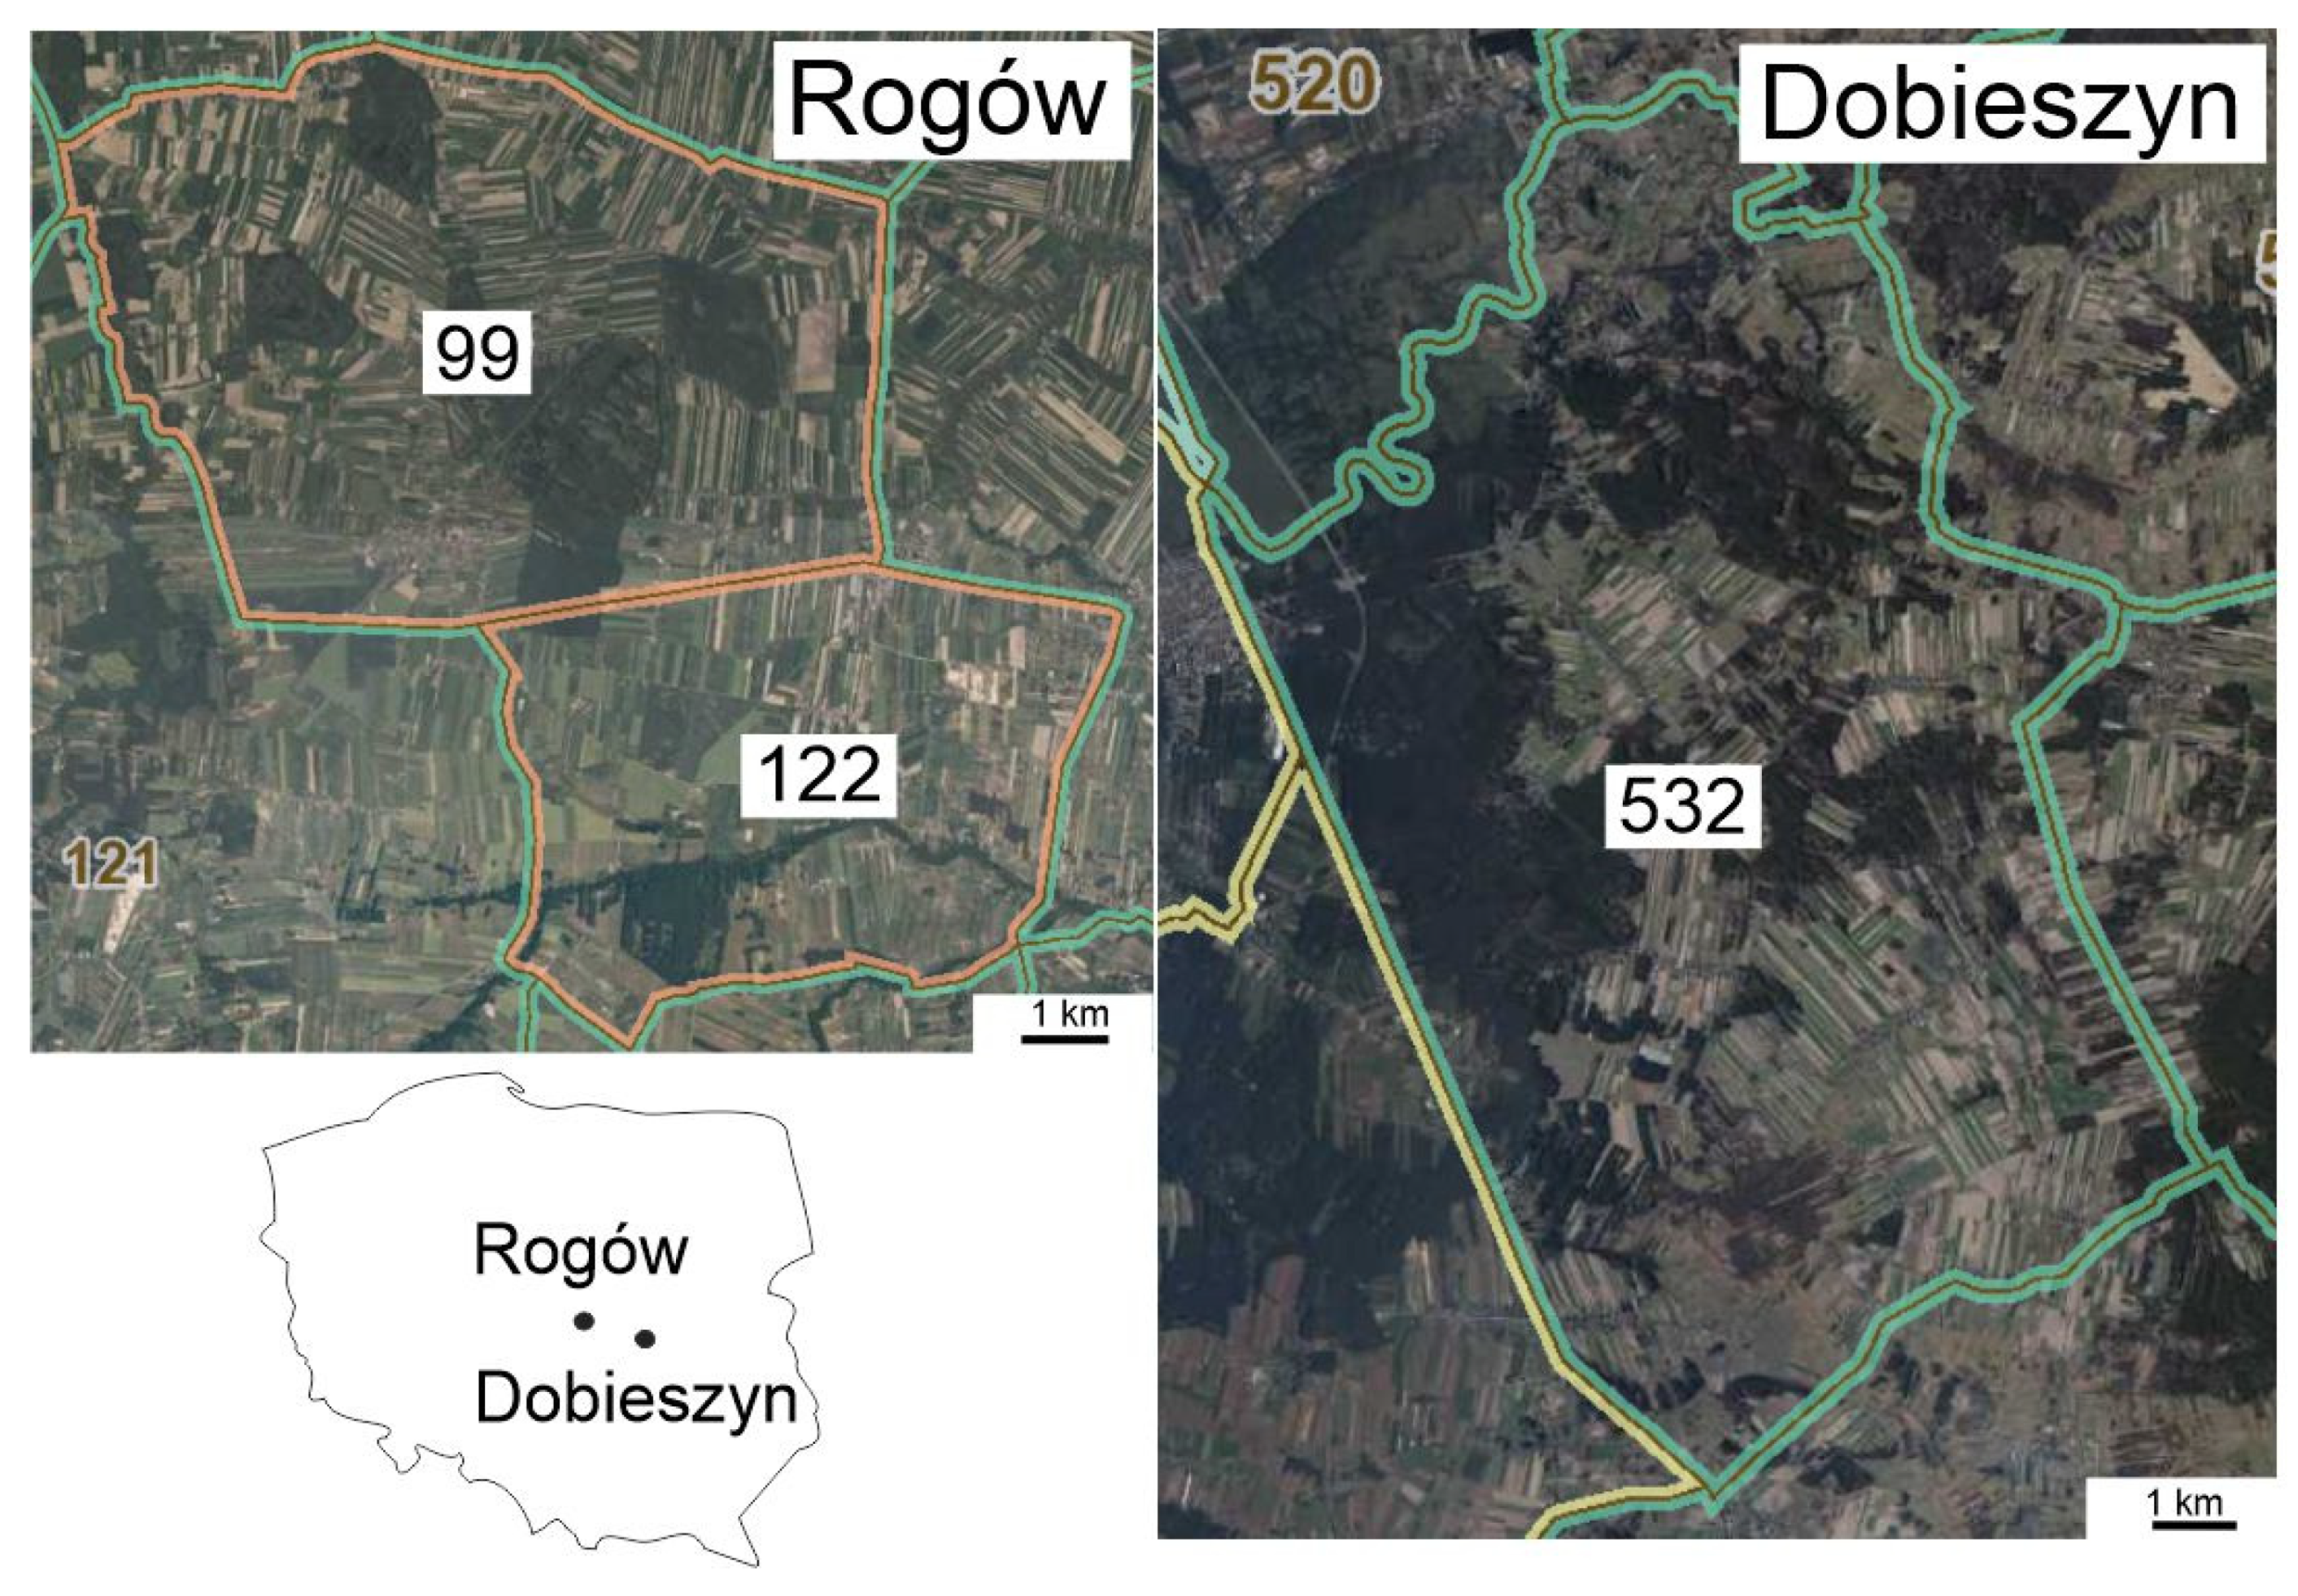
2.1. Study Area
2.2. Field Methods
2.2.1. Belt Assessment and Spotlight Counts
2.2.2. Hunting Bag Data
2.2.3. Driving Census
2.2.4. Snow Tracking
2.2.5. Pellet Group Counts
2.2.6. Red Fox Diet Analysis
2.3. Analysis
3. Results
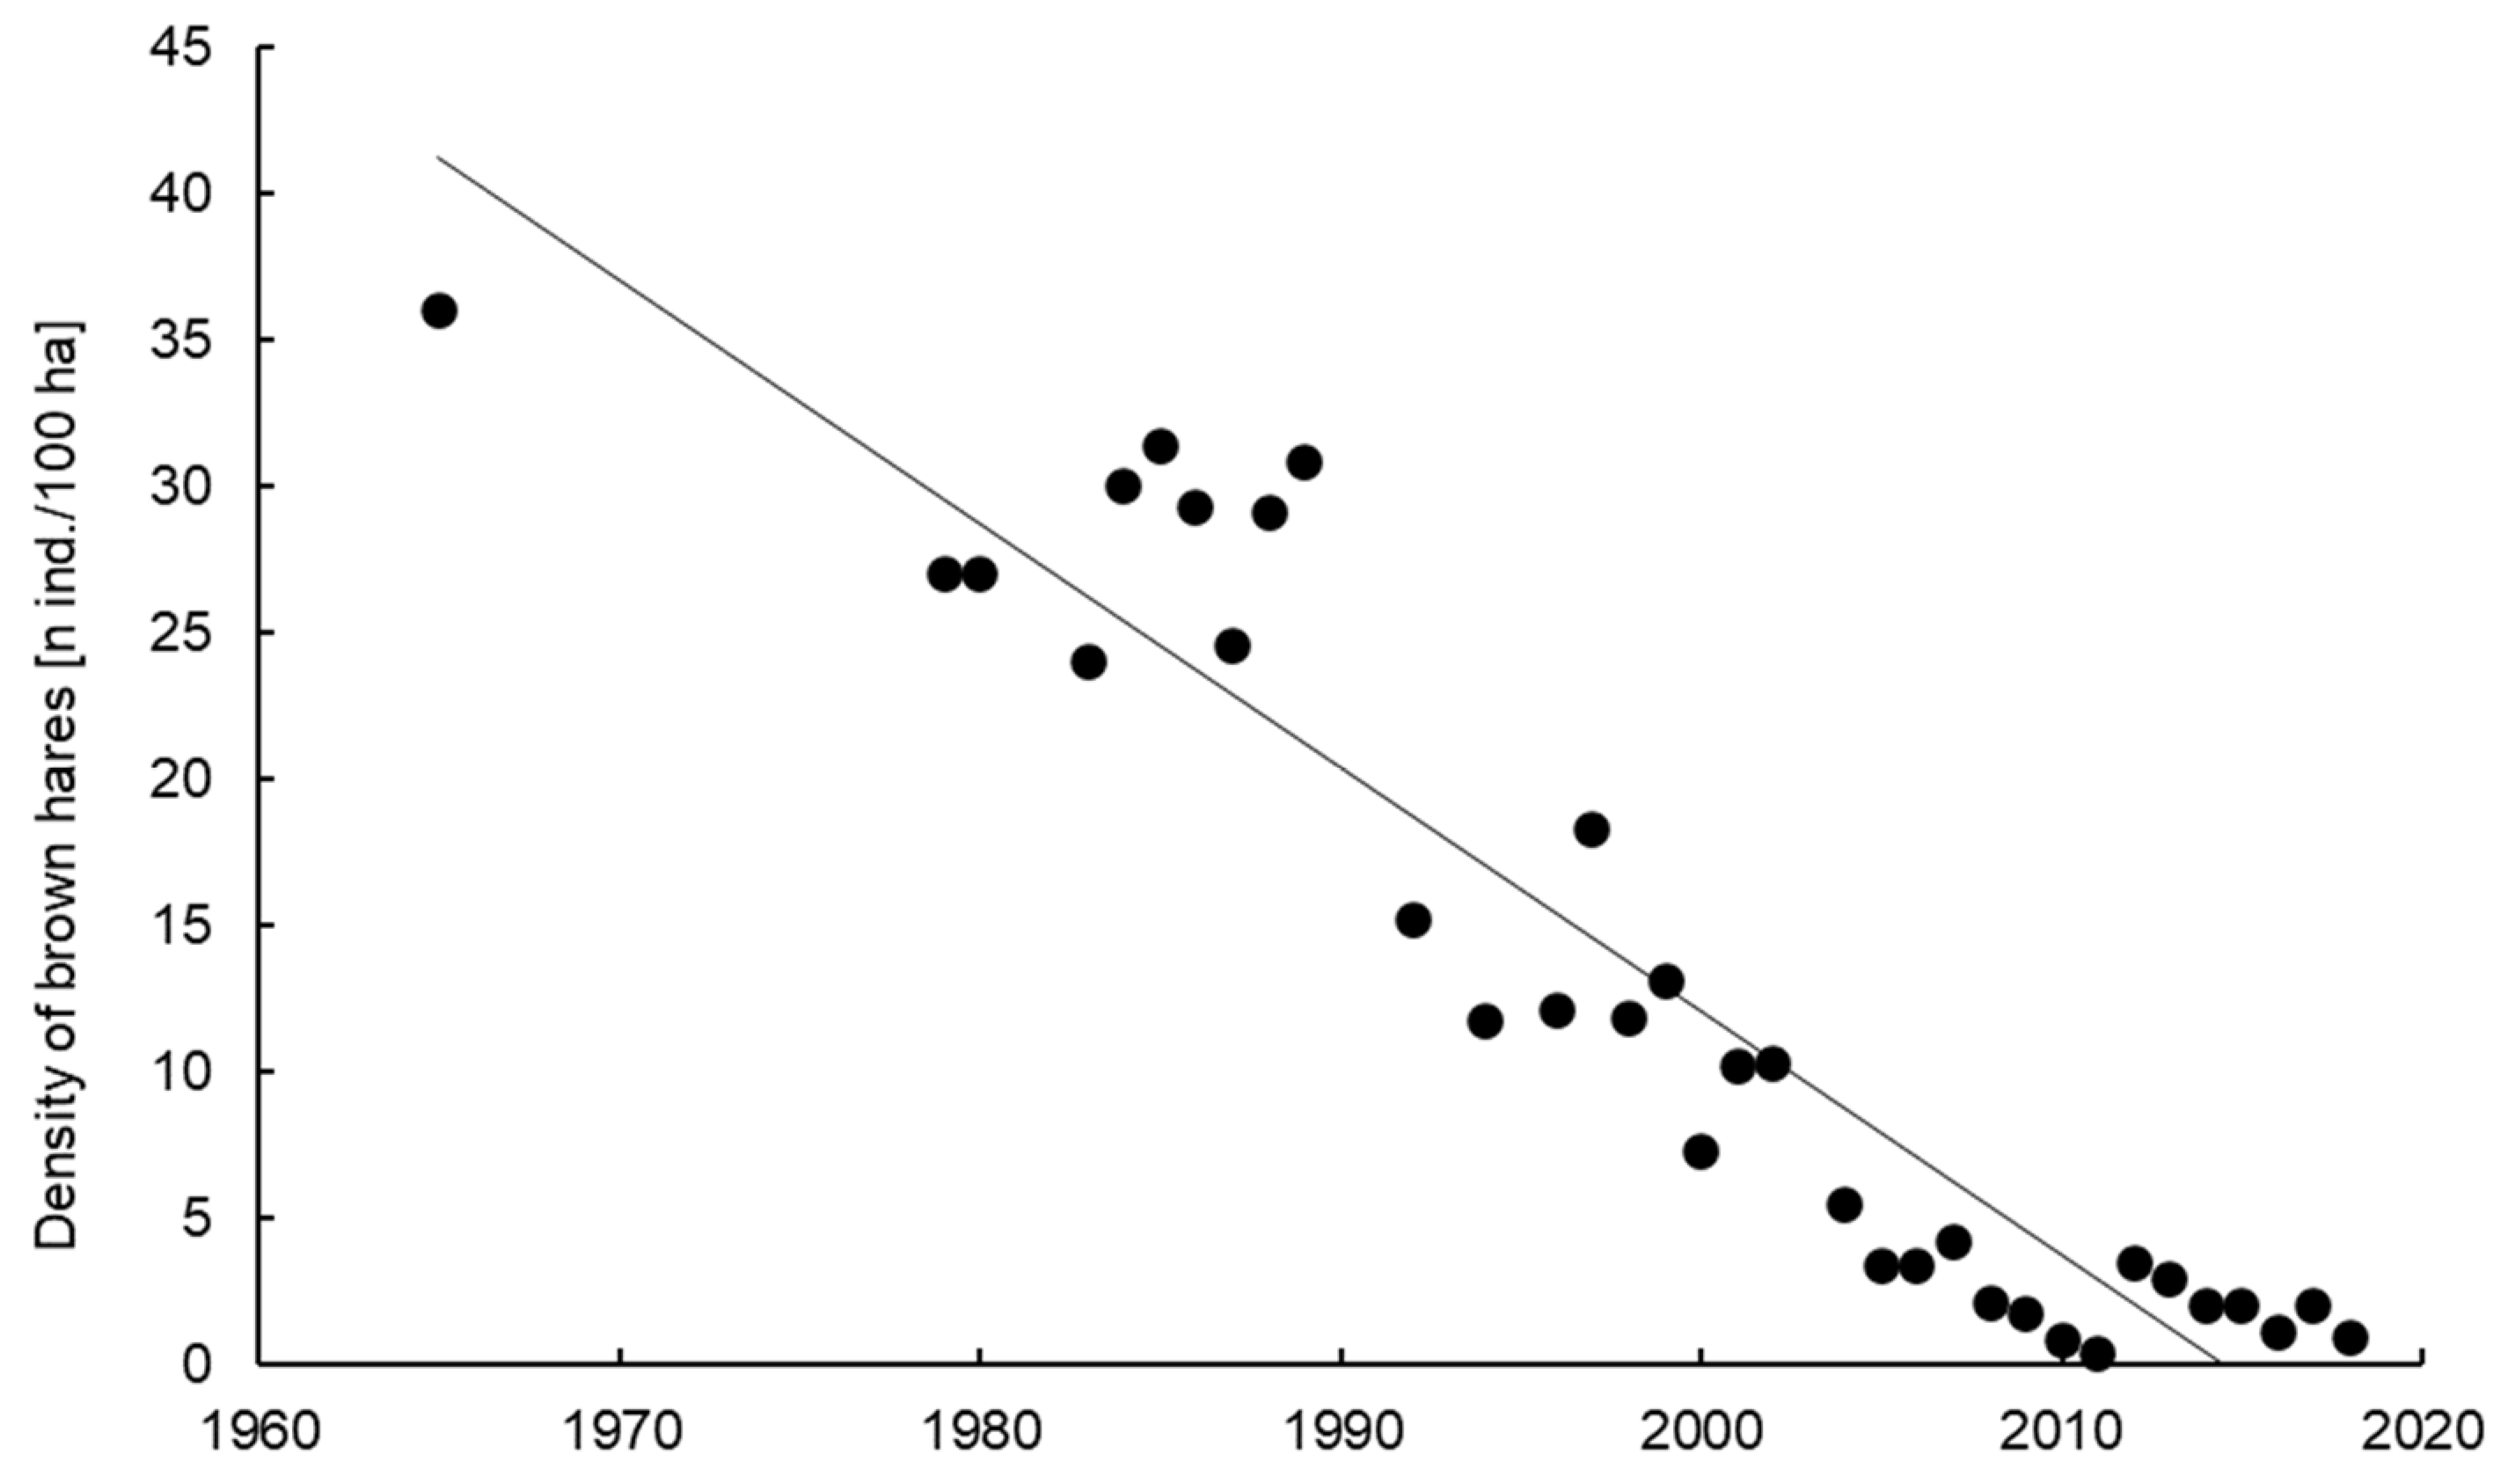
3.1. Trends in the Density and Hunting Bag of Brown Hares in Rogów
3.2. Changes in Brown Hare Densities in Spring vs. Autumn and Field vs. Forests, in Rogów, in Three Ten-Year Periods
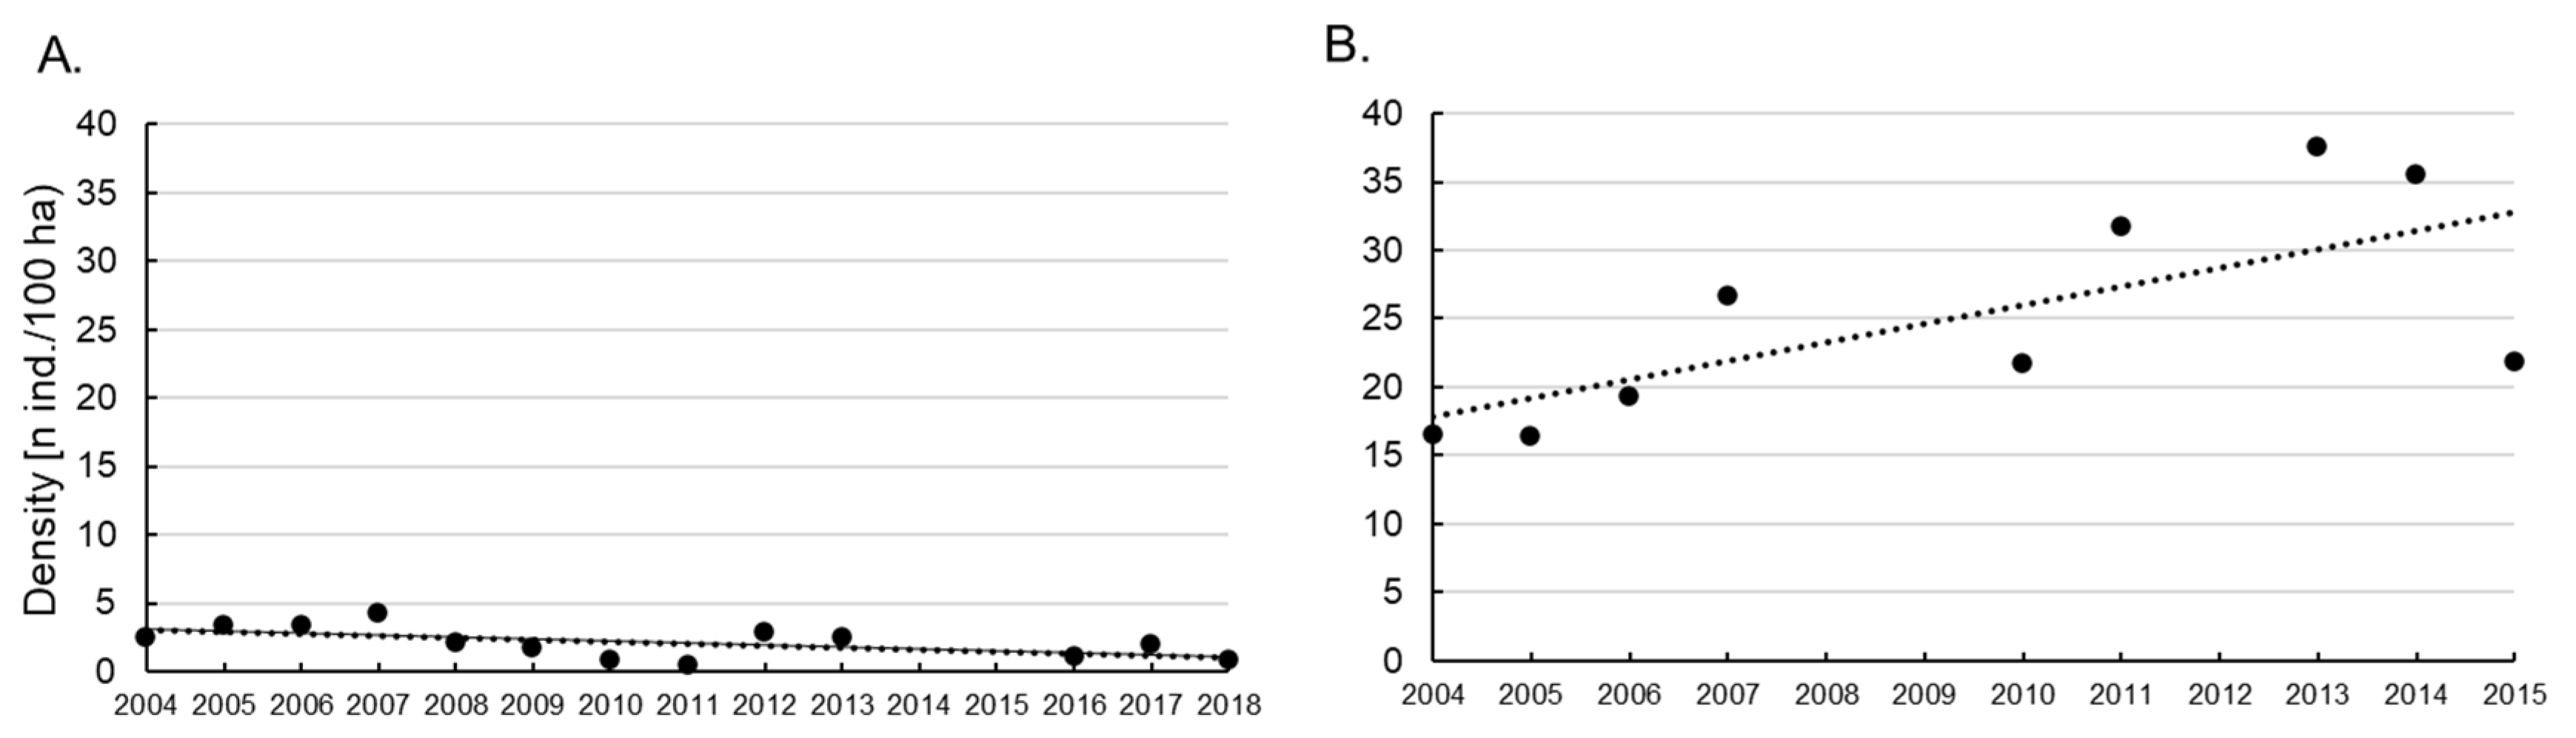
3.3. Brown Hare and Red Fox Densities in Rogów as Compared to a Reference Area (Dobieszyn) in the First Two Decades of the 20th Century
3.4. Red Fox Predation on Brown Hare in Rogów, Now and in the Past
4. Discussion
Supplementary Materials
Author Contributions
Funding
Institutional Review Board Statement
Informed Consent Statement
Data Availability Statement
Conflicts of Interest
References
- Smith, A.T.; Johnston, C.H. Lepus europaeus. The IUCN Red List of Threatened Species 2008: e.T41280A10430693. 2008. Available online: https://doi.org/10.2305/iucn.uk.2008.rlts.t41280a10430693.en (accessed on 28 March 2022).
- Schai-Braun, S.C.; Hackländer, K. Family Leporidae (hares and rabbits). In Handbook of the Mammals of the World, Volume 6, Lagomorphs and Rodents I; Wilson, D.E., Lacher, T.E.L., Jr., Mittermeier, R.A., Eds.; Lynx Edicions: Barcelona, Spain, 2016; pp. 62–148. [Google Scholar]
- Hackländer, K.; Schai-Braun, S. Lepus europaeus Pallas, 1778 European Hare. In Lagomorphs: Pikas, Rabbits, and Hares of the World; Smith, A.T., Johnston, C.H., Alves, P.C., Hackländer, K., Eds.; Johns Hopkins University Press: Baltimore, MD, USA, 2018; pp. 187–190. [Google Scholar]
- Frylestam, B. Agricultural land use effects on the winter diet of Brown Hares (Lepus europaeus Pallas) in southern Sweden. Mammal Rev. 1986, 16, 157–161. [Google Scholar] [CrossRef]
- Petrovan, S.O.; Ward, A.; Wheeler, P.M. Habitat selection guiding agri-environment schemes for a farmland specialist, the brown hare. Anim. Conserv. 2013, 16, 344–352. [Google Scholar] [CrossRef]
- Smith, R.; Jennings, N.; Robinson, A.; Harris, S. Conservation of European hares Lepus europaeus in Britain: Is increasing habitat heterogeneity in farmland the answer? J. Appl. Ecol. 2004, 41, 1092–1102. [Google Scholar] [CrossRef]
- Schmidt, N.M.; Asferg, T.; Forchhammer, M.C. Long-term patterns in European brown hare population dynamics in Denmark: Effects of agriculture, predation and climate. BMC Ecol. 2004, 4, 15. [Google Scholar] [CrossRef] [Green Version]
- Zellweger-Fischer, J.; Kéry, M.; Pasinelli, G. Population trends of brown hares in Switzerland: The role of land-use and ecological compensation areas. Biol. Conserv. 2011, 144, 1364–1373. [Google Scholar] [CrossRef]
- Sliwinski, K.; Ronnenberg, K.; Jung, K.; Egbert Strauß, E.; Siebert, U. Habitat requirements of the European brown hare (Lepus europaeus PALLAS 1778) in an intensively used agriculture region (Lower Saxony, Germany). BMC Ecol. 2019, 19, 31. [Google Scholar] [CrossRef] [Green Version]
- Goszczyński, J.; Wasilewski, M. Predation of foxes on a hare population in central Poland. Acta Theriol. 1992, 37, 329–338. [Google Scholar] [CrossRef] [Green Version]
- Panek, M.; Kamieniarz, R.; Bresiński, W. The effect of experimental removal of red foxes Vulpes vulpes on spring density of brown hares Lepus europaeus in western Poland. Acta Thériol. 2006, 51, 187–193. [Google Scholar] [CrossRef]
- Panek, M. Factors Affecting Predation of Red Foxes Vulpes vulpes on Brown Hares Lepus europaeus During the Breeding Season in Poland. Wildl. Biol. 2009, 15, 345–349. [Google Scholar] [CrossRef]
- Reynolds, J.C.; Stoate, C.; Brockless, M.H.; Aebischer, N.J.; Tapper, S.C. The consequences of predator control for brown hares (Lepus europaeus) on UK farmland. Eur. J. Wildl. Res. 2010, 56, 541–549. [Google Scholar] [CrossRef]
- Edwards, P.; Fletcher, M.; Berny, P. Review of the factors affecting the decline of the European brown hare, Lepus europaeus (Pallas, 1778) and the use of wildlife incident data to evaluate the significance of paraquat. Agric. Ecosyst. Environ. 2000, 79, 95–103. [Google Scholar] [CrossRef]
- Barnes, R.F.W.; Tapper, S.C. Consequences of the myxomatosis epidemic in Britain’s Rabbit (Oryctolagus cuniculus L.) population on the numbers of Brown Hares (Lepus europaeus Pallas). Mammal Rev. 1986, 16, 111–116. [Google Scholar] [CrossRef]
- Frölich, K.; Meyer, H.H.D.; Pielowski, Z.; Ronsholt, L.; Seck-Lanzendorf, S.V.; Stolte, M. European brown hare syndrome in free-ranging hares in poland. J. Wildl. Dis. 1996, 32, 280–285. [Google Scholar] [CrossRef] [PubMed] [Green Version]
- Lamarque, F.; Barrat, J.; Moutou, F. Principal diagnoses for determining causes of mortality in the European brown hare (Lepus europaeus) found dead in France between 1986 and 1994. Gibier Faune Sauvag. 1996, 13, 53–72. [Google Scholar]
- Posautz, A.; Loncaric, I.; Lundin, M.; Hoffmann, D.; Lavazza, A.; Kelemen, Z.; Beiglböck, C.; Walzer, C.; Kübber-Heiss, A. Health screening of free-ranging European brown hares (Lepus europaeus) on the German North-Sea island Pellworm. Acta Vet. Scand. 2015, 57, 43. [Google Scholar] [CrossRef] [Green Version]
- Misiorowska, M.; Wasilewski, M. Survival and causes of death among released brown hares (Lepus europaeus Pallas, 1778) in Central Poland. Acta Theriol. 2012, 54, 305–312. [Google Scholar] [CrossRef] [Green Version]
- Roedenbeck, I.A.; Voser, P. Effects of roads on spatial distribution, abundance and mortality of brown hare (Lepus europaeus) in Switzerland. Eur. J. Wildl. Res. 2008, 54, 425–437. [Google Scholar] [CrossRef]
- Fickel, J.; Schmidt, A.; Putze, M.; Spittler, H.; Ludwig, A.; Streich, W.J.; Pitra, C. Genetic structure of populations of European brown hare: Implications for management. J. Wildl. Manag. 2005, 69, 760–770. [Google Scholar] [CrossRef]
- Langhammer, M.; Grimm, V.; Pütz, S.; Topping, C.J. A modelling approach to evaluating the effectiveness of Ecological Focus Areas: The case of the European brown hare. Land Use Policy 2017, 61, 63–79. [Google Scholar] [CrossRef]
- Smith, R.K.; Vaughan Jennings, N.; Harris, S.A. A quantitative analysis of the abundance and demography of European hares Lepus europaeus in relation to habitat type, intensity of agriculture and climate. Mammal Rev. 2005, 35, 1–24. [Google Scholar] [CrossRef]
- Kamieniarz, R.; Voigt, U.; Panek, M.; Strauss, E.; Niewęgłowski, H. The effect of landscape structure on the distribution of brown hare Lepus europaeus in farmlands of Germany and Poland. Acta Theriol. 2013, 58, 39–46. [Google Scholar] [CrossRef] [PubMed] [Green Version]
- Hackländer, K.; Tataruch, F.; Ruf, T. The Effect of Dietary Fat Content on Lactation Energetics in the European Hare (Lepus europaeus). Physiol. Biochem. Zoöl. Ecol. Evol. Approaches 2002, 75, 19–28. [Google Scholar] [CrossRef] [PubMed]
- Panek, M.; Kamieniarz, R. Relationship between density of brown hare Lepus europaeus and landscape structure in Poland in the years 1981–1995. Acta Theriol. 1999, 44, 67–75. [Google Scholar] [CrossRef] [Green Version]
- Pavliska, P.L.; Riegert, J.; Grill, S.; Šálek, M. The effect of landscape heterogeneity on population density and habitat preferences of the European hare (Lepus europaeus) in contrasting farmlands. Mamm. Biol. 2018, 88, 8–15. [Google Scholar] [CrossRef]
- Rühe, F.; Hohmann, U. Seasonal locomotion and home-range characteristics of European hares (Lepus europaeus) in an arable region in central Germany. Eur. J. Wildl. Res. 2004, 50, 101–111. [Google Scholar] [CrossRef]
- Tapper, S.; Hobson, D. Conserving the Brown Hare; The Game Conservancy Trust: Fordingbridge, UK, 2002. [Google Scholar]
- Gryz, J.; Krauze-Gryz, D. Food niche overlap of avian predators (Falconiformes, Strigiformes) in a field and forest mosaic in central Poland. Animals 2021, 11, 479. [Google Scholar] [CrossRef]
- Krauze-Gryz, D.; Gryz, J.; Goszczyński, J. Predation by domestic cats in rural areas of central Poland: An assessment based on two methods. J. Zool. 2012, 288, 260–266. [Google Scholar] [CrossRef]
- Krauze-Gryz, D.; Gryz, J. Free-Ranging Domestic Dogs (Canis familiaris) in Central Poland: Density, Penetration Range and Diet Composition. Pol. J. Ecol. 2014, 62, 183–193. [Google Scholar] [CrossRef]
- Reynolds, J.C.; Tapper, S.C. Predation by foxes Vulpes vulpes on brown hare Lepus europaeus in central southern England, and its potential impact on annual population growth. Wildl. Biol. 1995, 1, 145–158. [Google Scholar] [CrossRef]
- Knauer, F.; Küchenhoff, H.; Pilz, S. A statistical analysis of the relationship between red fox Vulpes vulpes and its prey species (grey partridge Perdix perdix, brown hare Lepus europaeus and rabbit Oryctolagus cuniculus) in Western Germany from 1958 to 1998. Wildl. Biol. 2010, 16, 56–65. [Google Scholar] [CrossRef] [Green Version]
- Panek, M. Long-term changes in the feeding pattern of red foxes Vulpes vulpes and their predation on brown hares Lepus europaeus in western Poland. Eur. J. Wildl. Res. 2013, 59, 581–586. [Google Scholar] [CrossRef]
- Panek, M. Habitat factors associated with the decline in brown hare abundance in Poland in the beginning of the 21st century. Ecol. Indic. 2018, 85, 915–920. [Google Scholar] [CrossRef]
- Weber, D.; Weber, D.; Roth, T.; Roth, T.; Kohli, L.; Kohli, L. Increasing brown hare (Lepus europaeus) densities in farmland without predator culling: Results of a field experiment in Switzerland. Eur. J. Wildl. Res. 2019, 65, 75. [Google Scholar] [CrossRef]
- Statistics Poland. Statistical Yearbook of Forestry; Statistics Poland: Warsaw, Poland, 2021. [Google Scholar]
- Dziedzic, R.; Kamieniarz, R.; Wójcik, M.; Beeger, S.; Flis, M.; Olszak, K.; Żontała, M. Przyczyny Spadku Populacji Zająca Szaraka w Polsce; Raport wykonany na zlecenie Ministra Środowiska; Inwestdom S.A.: Lublin, Poland, 2000. [Google Scholar]
- Lundström-Gilliéron, C.; Schlaepfer, R. Hare abundance as an indicator for urbanisation and intensification of agriculture in Western Europe. Ecol. Model. 2003, 168, 283–301. [Google Scholar] [CrossRef]
- Forest Data Bank—Map of Hunting. Available online: https://www.bdl.lasy.gov.pl/portal/en (accessed on 8 June 2022).
- Krauze, D. Biocenotical Role of Domestic Cat Felis Silvestris Catus in Different Types of Field and Forest Mosaic. Ph.D. Thesis, Forest Faculty, Warsaw University of Life Sciences, Warsaw, Poland, 2008. [Google Scholar]
- Gryz, J.; Krauze-Gryz, D.; Lesiński, G. Mammals in the vicinity of Rogów (central Poland). Fragm. Faun. 2011, 54, 183–197. [Google Scholar] [CrossRef] [Green Version]
- Krauze-Gryz, D.; Gryz, J.B.; Goszczyński, J.; Chylarecki, P.; Żmihorski, M. The good, the bad, and the ugly: Space use and intraguild interactions among three opportunistic predators–cat (Felis catus), dog (Canis lapus familiaris), and red fox (Vulpes vulpes)–under human pressure. Can. J. Zool. 2012, 90, 1402–1413. [Google Scholar] [CrossRef] [Green Version]
- Chylarecki, P.; Chodkiewicz, T.; Neubauer, G.; Sikora, A.; Meissner, W.; Woźniak, B.; Wylegała, P.; Ławicki, Ł.; Marchowski, D.; Betleja, J.; et al. Trendy Liczebności Ptaków w Polsce; Główny Inspektorat Ochrony Środowiska: Warszawa, Poland, 2018. [Google Scholar]
- Gryz, J.; Krauze-Gryz, D. Density dynamics, diet composition and productivity of sparrowhawk Accipiter nisus L. population in central Poland. For. Res. Pap. 2018, 79, 245–251. [Google Scholar] [CrossRef] [Green Version]
- Gryz, J.; Krauze-Gryz, D. The common buzzard Buteo buteo population in a changing environment, central Poland as a case study. Diversity 2019, 11, 35. [Google Scholar] [CrossRef] [Green Version]
- Gryz, J.; Krauze-Gryz, D. Pigeon and poultry breeders, friends or enemies of the northern goshawk Accipiter gentilis? A long- term study of a population in central Poland. Animals 2019, 9, 141. [Google Scholar] [CrossRef] [Green Version]
- Langbein, J.; Hutchings, M.; Harris, S.; Stoate, C.; Tapper, S.C.; Wray, S. Techniques for assessing the abundance of Brown Hares. Mammal Rev. 1999, 29, 93–116. [Google Scholar] [CrossRef]
- Meichtry-Stier, K.S.; Jenny, M.; Zellweger-Fischer, J.; Birrer, S. Impact of landscape improvement by agri-environment scheme options on densities of characteristic farmland bird species and brown hare (Lepus europaeus). Agric. Ecosyst. Environ. 2014, 189, 101–109. [Google Scholar] [CrossRef]
- Barnes, R.F.W.; Tapper, S.C. A method for counting hares by spotlight. J. Zoöl. 1985, 206, 273–276. [Google Scholar] [CrossRef]
- Goszczyński, J.; Krauze, D.; Gryz, J. Activity and exploration range of house cats in rural areas of central Poland. Folia Zool. 2009, 58, 363–371. [Google Scholar]
- Priklonskij, S.G. Peresčetnyje koefificienty dlja obrabotki dannych zimnego maršrutnogo učeta promyslowych zverej sladem. Bjull. Mosk. O Ispyt. Prir. Otd. Biol. 1965, 70, 5–12. [Google Scholar]
- Goszczyński, J. Spatial distribution of red foxes Vulpes vulpes in winter. Acta Theriol. 1989, 34, 141–154. [Google Scholar] [CrossRef]
- Goszczyński, J. Red Fox; Oikos: Warszawa, Poland, 1995. [Google Scholar]
- Juszko, S. Impact of Red Fox Predation on Mortality of Brown Hare in Central Poland. Ph.D. Thesis, Forest Faculty, Warsaw University of Life Science, Warsaw, Poland, 2006. [Google Scholar]
- Hammer, O.; Harper, D.A.T.; Ryan, P.D. PAST: Paleontological Statistics Software Package for Education and Data Analysis. Palaeontol. Electron. 2001, 4, 9. [Google Scholar]
- Freschi, P.; Fascetti, S.; Musto, M.; Cosentino, C.; Paolino, R.; Valentini, V. Seasonal variation in food habits of the Italian hare in a south Apennine semi-natural landscape. Ethol. Ecol. Evol. 2016, 28, 148–162. [Google Scholar] [CrossRef]
- Rizzardini, G.; Fascetti, S.; Pietri, C.; Riga, F.; Cosentino, C.; Freschi, P. Feeding preferences in dry season of the Italian hare (Lepus corsicanus) in two sites of Corsica. Eur. J. Wildl. Res. 2019, 65, 43. [Google Scholar] [CrossRef]
- Mayer, M.; Duan, X.; Sunde, P.; Topping, C.J. European hares do not avoid newly pesticide-sprayed fields: Overspray as unnoticed pathway of pesticide exposure. Sci. Total Environ. 2020, 715, 136977. [Google Scholar] [CrossRef]
- Martinez-Haro, M.; Chinchilla, J.M.; Camarero, P.R.; Viñuelas, J.A.; Crespo, M.J.; Mateo, R. Determination of glyphosate exposure in the Iberian hare: A potential focal species associated to agrosystems. Sci. Total Environ. 2022, 823, 153677. [Google Scholar] [CrossRef]
- Pawlak, M. Przyrost Zrealizowany Populacji Zajęcy w Obwodach Łowieckich SGGW-AR 59 I 72. Master’s Thesis, Forestry Faculty, Warsaw University of Life Science, Warsaw, Poland, 1985. [Google Scholar]
- Karp, D.; Gehr, B. Bad hare day: Very low survival rate in brown hare leverets. Wildl. Biol. 2020, wlb.0064. [Google Scholar] [CrossRef]
- Wasilewski, M. Studies on the European hare. 42. Population dynamics of the European hare Lepus europaeus Pallas, 1778 in Central Poland. Acta Theriol. 1991, 36, 267–274. [Google Scholar] [CrossRef] [Green Version]
- Jansson, G.; Pehrson, Å. The recent expansion of the brown hare (Lepus europaeus) in Sweden with possible implications to the mountain hare (L. timidus). Eur. J. Wildl. Res. 2007, 53, 125–130. [Google Scholar] [CrossRef]
- Johann, F.; Arnold, J. Scattered woody vegetation promotes European brown hare population. Basic Appl. Ecol. 2021, 56, 322–334. [Google Scholar] [CrossRef]
- Tapper, S.C.; Barnes, R.F.W. Influence of Farming Practice on the Ecology of the Brown Hare (Lepus europaeus). J. Appl. Ecol. 1986, 23, 39. [Google Scholar] [CrossRef]
- Wasilewski, M. Habitat Use by roe Deer (Capreolus capreolus Linnaeus, 1785) in a Field and Forest Landscape Mosaic. Treatises and Monographs; Publications of Warsaw Agricultural University: Warsaw, Poland, 2001. [Google Scholar]
- Goszczyński, J.; Misiorowska, M.; Juszko, S. Changes in the density and spatial distribution of red fox dens and cub numbers in central Poland following rabies vaccination. Acta Theriol. 2008, 53, 121–127. [Google Scholar] [CrossRef]
- Goszczyński, J.; Jędrzejewska, B.; Jędrzejewski, W. Diet composition of badgers (Meles meles) in pristine forest and rural habitats of Poland compared to other European populations. J. Zool. 2000, 250, 495–505. [Google Scholar]
- Krauze, D.; Gryz, J.; Goszczyński, J. Food composition of the goshawk (Accipiter gentilis L. 1758) during the nesting season in the Rogów Forest (central Poland). Folia For. Pol. Ser. A For. 2005, 47, 45–53. [Google Scholar]
- Posłuszny, M.; Pilot, M.; Goszczyński, J.; Gralak, B. Diet of sympatric pine marten (Martes martes) and stone marten (Martes foina) identified by genotyping of DNA from faeces. Ann. Zool. Fenn. 2007, 44, 269–284. [Google Scholar]
- Gryz, J.; Krauze-Gryz, D. Influence of season and availability of forest rodents on diet composition of tawny owl Strix aluco inhabiting field-forest mosaic in central Poland. Sylwan 2016, 160, 57–63. [Google Scholar]
- Gryz, J.; Krauze-Gryz, D. Indirect influence of African swine fever outbreak on the raven (Corvus corax) population. Animals 2019, 9, 41. [Google Scholar] [CrossRef] [PubMed] [Green Version]
- Goszczyński, J. The Effect of Structural Differentiation of Ecological Landscape on the Predator-Prey Interactions; Treatises and Monographs, Publications of Warsaw Agricultural University SGGW-AR: Warsaw, Poland, 1985. [Google Scholar]
- Goszczyński, J. Connection between predatory birds, mammals and their prey. Acta Theriol. 1977, 22, 399–430. [Google Scholar] [CrossRef] [Green Version]
- Ligór, W. Characteristics of Infestation Of Hunting Units with Coccidia. Master’s Thesis, Department of Forest Zoology and Wildlife Management, Warsaw University of Life Sciences, Warsaw, Poland, 1992. [Google Scholar]
- Kowalski, A.; Markowski, J. Brown Hare’s (Lepus europaeus) Histone H1 Variant H1.2 as an Indicator of Anthropogenic Stress. Arch. Environ. Contam. Toxicol. 2018, 75, 576–584. [Google Scholar] [CrossRef] [PubMed] [Green Version]
- Hartl, G.B.; Markowski, J.; Świątecki, A.; Janiszewski, T.; Willing, R. Genetic diversity in the Polish brown hare Lepus europaeus Pallas, 1778: Implications for conservation and management. Acta Theriol. 1992, 37, 15–25. [Google Scholar] [CrossRef] [Green Version]


| Mode of Estimation | Density Index | Study Area | H | p | |
|---|---|---|---|---|---|
| Rogów | Dobieszyn | ||||
| Spotlight counts | n ind./100 ha | 2.2 | 24.0 | 34.04 | <0.001 |
| Snow tracking | n tracks/1 km/24 h | 7.8 | 23.5 | 11.95 | <0.001 |
| Pellet group counts | n pellet groups/km | 0.1 | 13.9 | 29.06 | <0.001 |
| Mode of Estimation | Density Index | Study Area | H | p | |
|---|---|---|---|---|---|
| Rogów | Dobieszyn | ||||
| Spotlight counts | n ind./100 ha | 0.7 | 0.8 | 0.00 | >0.05 |
| Snow tracking | n tracks/1 km/24 h | 9.2 | 8.5 | 0.47 | >0.05 |
| Food Type | Period | p | ||
|---|---|---|---|---|
| 1978–1991 | 1999–2002 | 2011–2021 | ||
| Domestic birds | 58.3 | 38.3 | 37.6 | <0.001 |
| Pheasant, grey partridge | 4.5 | 4.1 | 0.6 | <0.001 |
| Carrion | 5.0 | 14.8 | 20.1 | <0.001 |
| Brown hare | 12.7 | 4.1 | 0.1 | <0.001 |
| Human refuse | - | 2.6 | 9.2 | <0.001 |
| Total number of items | 606 | 196 | 959 | <0.001 |
Publisher’s Note: MDPI stays neutral with regard to jurisdictional claims in published maps and institutional affiliations. |
© 2022 by the authors. Licensee MDPI, Basel, Switzerland. This article is an open access article distributed under the terms and conditions of the Creative Commons Attribution (CC BY) license (https://creativecommons.org/licenses/by/4.0/).
Share and Cite
Gryz, J.; Krauze-Gryz, D. Why Did Brown Hare Lepus europaeus Disappear from Some Areas in Central Poland? Diversity 2022, 14, 465. https://doi.org/10.3390/d14060465
Gryz J, Krauze-Gryz D. Why Did Brown Hare Lepus europaeus Disappear from Some Areas in Central Poland? Diversity. 2022; 14(6):465. https://doi.org/10.3390/d14060465
Chicago/Turabian StyleGryz, Jakub, and Dagny Krauze-Gryz. 2022. "Why Did Brown Hare Lepus europaeus Disappear from Some Areas in Central Poland?" Diversity 14, no. 6: 465. https://doi.org/10.3390/d14060465
APA StyleGryz, J., & Krauze-Gryz, D. (2022). Why Did Brown Hare Lepus europaeus Disappear from Some Areas in Central Poland? Diversity, 14(6), 465. https://doi.org/10.3390/d14060465