
Effects of Population Density on Revegetation of Artemisia sphaerocephala and Soil Traits in a Desert Ecosystem


Abstract
:1. Introduction
2. Materials and Methods
2.1. Site Description
2.2. Treatments and Plant Growth Characteristics
2.3. Soil Sampling and Analysis
2.4. Statistical Analysis
3. Results
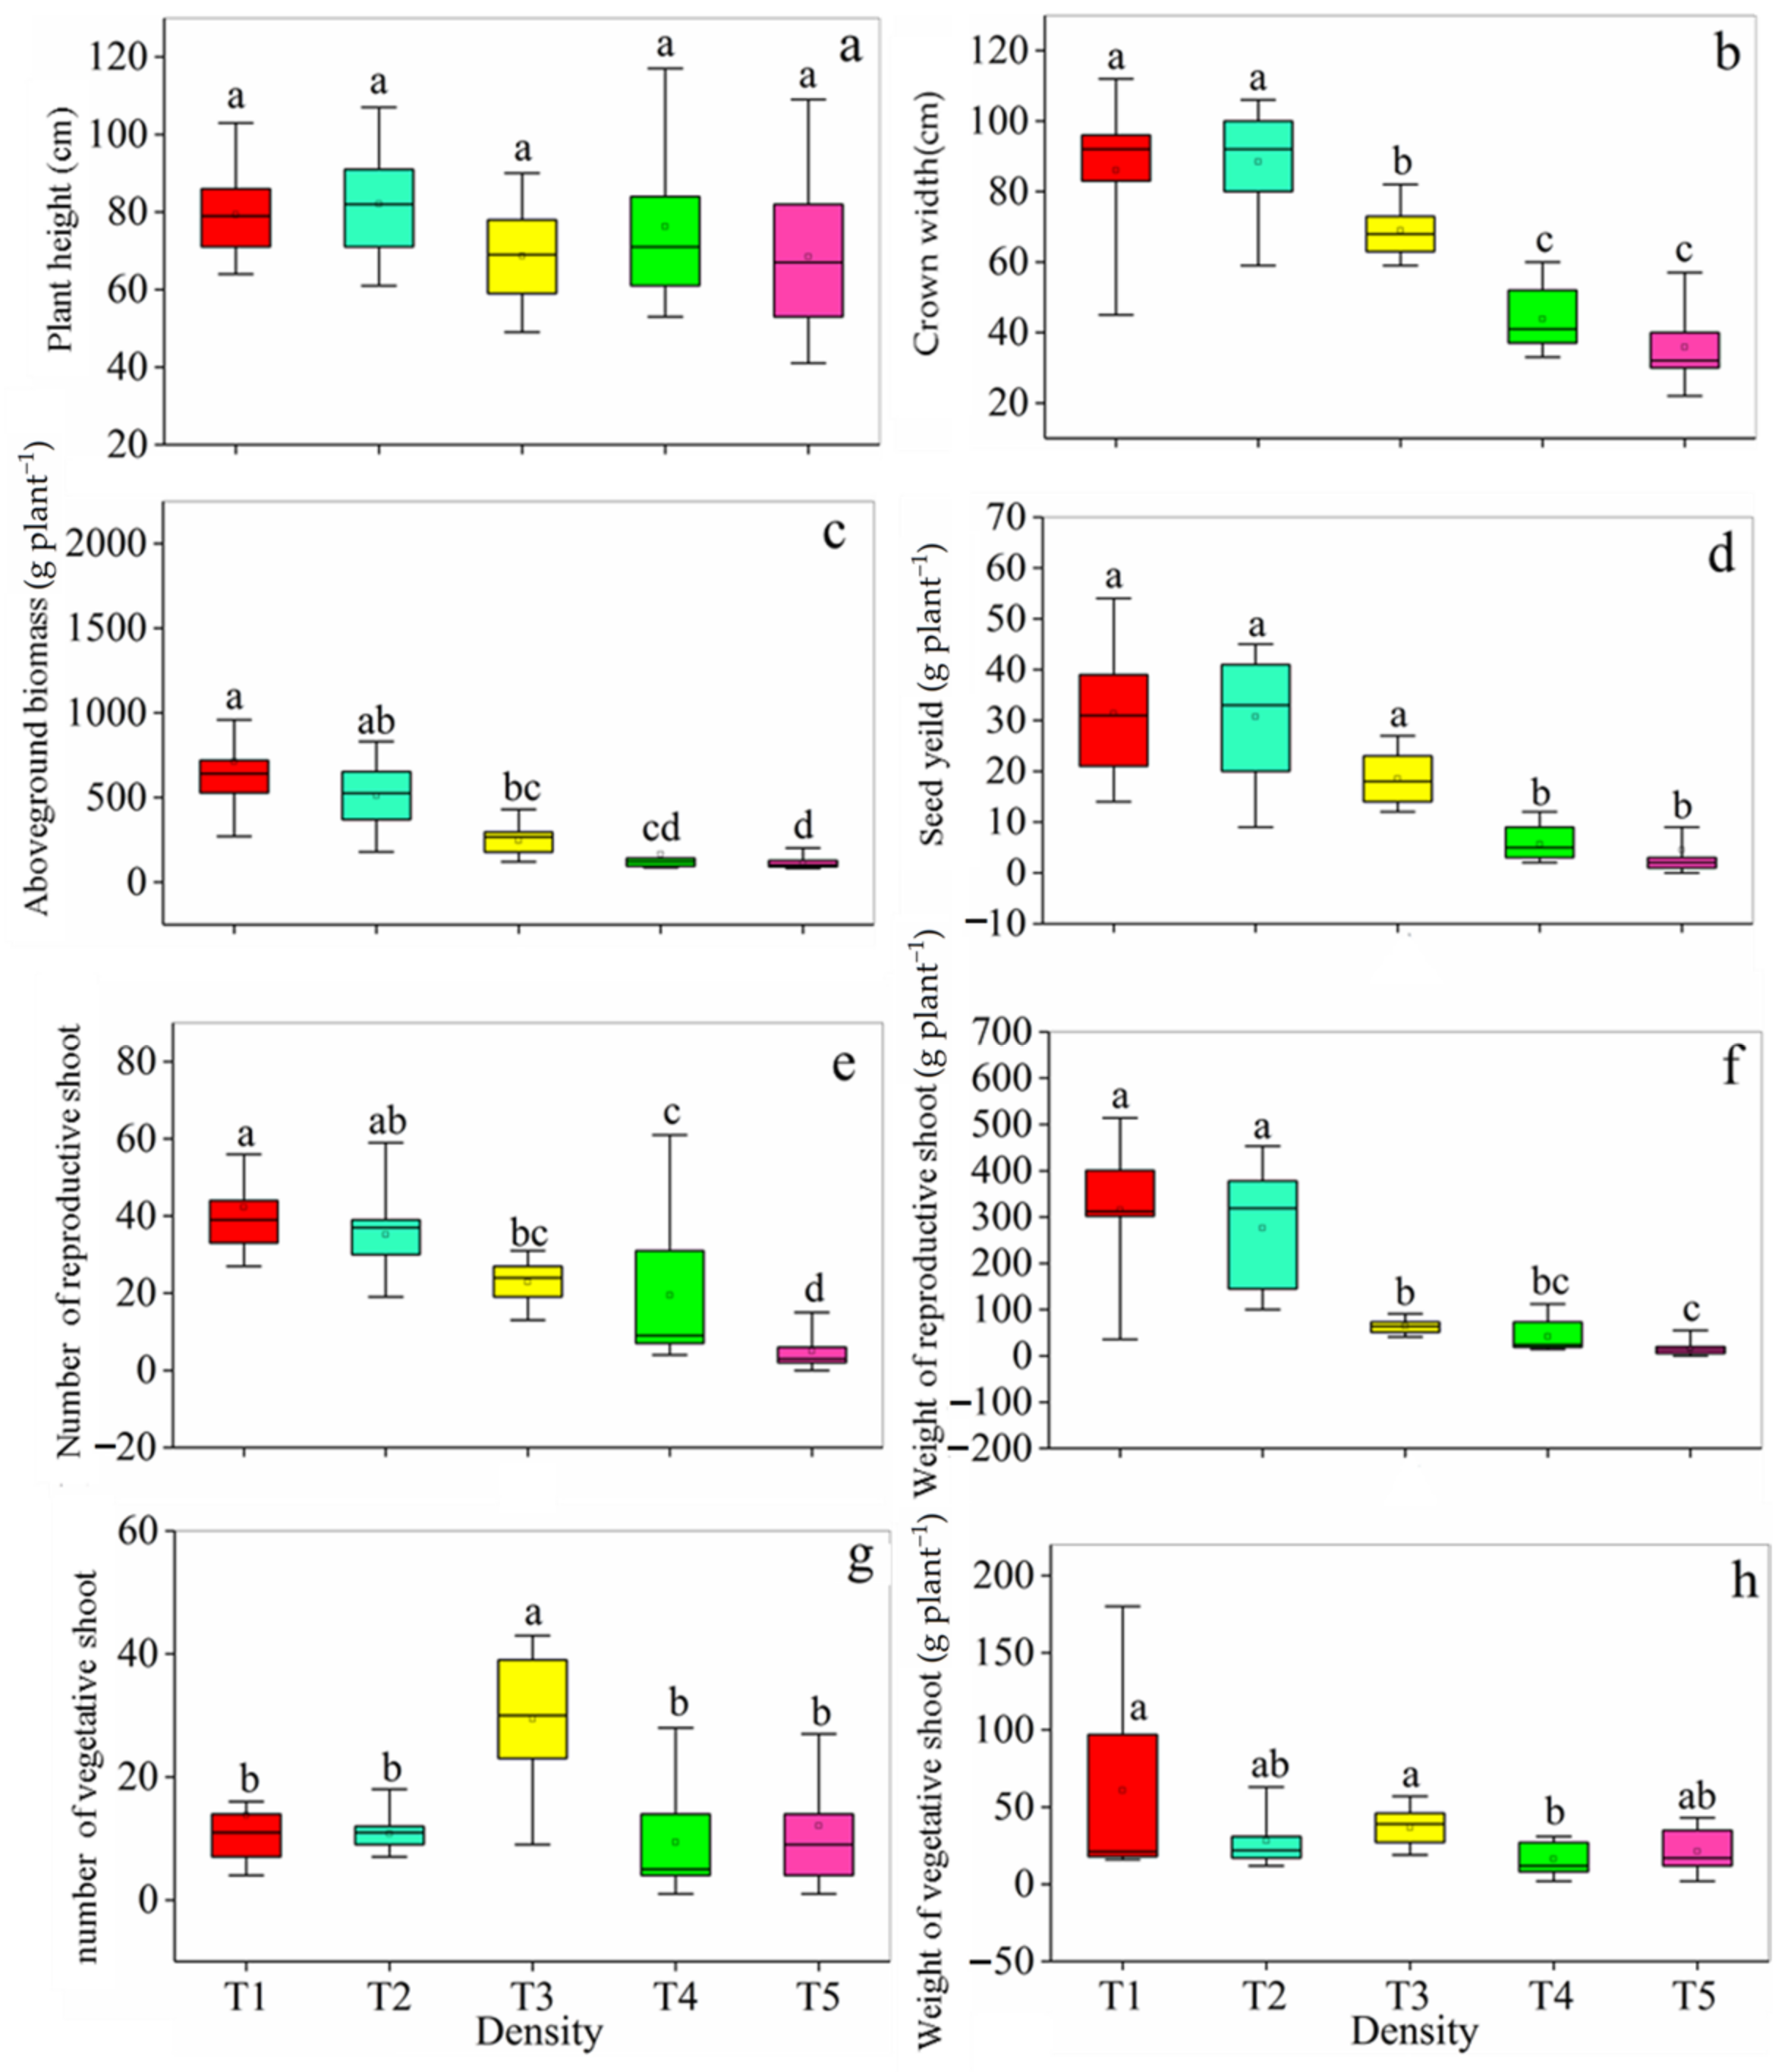
3.1. Plant Growth
3.2. Soil Properties
3.3. Soil Fractal Dimensions
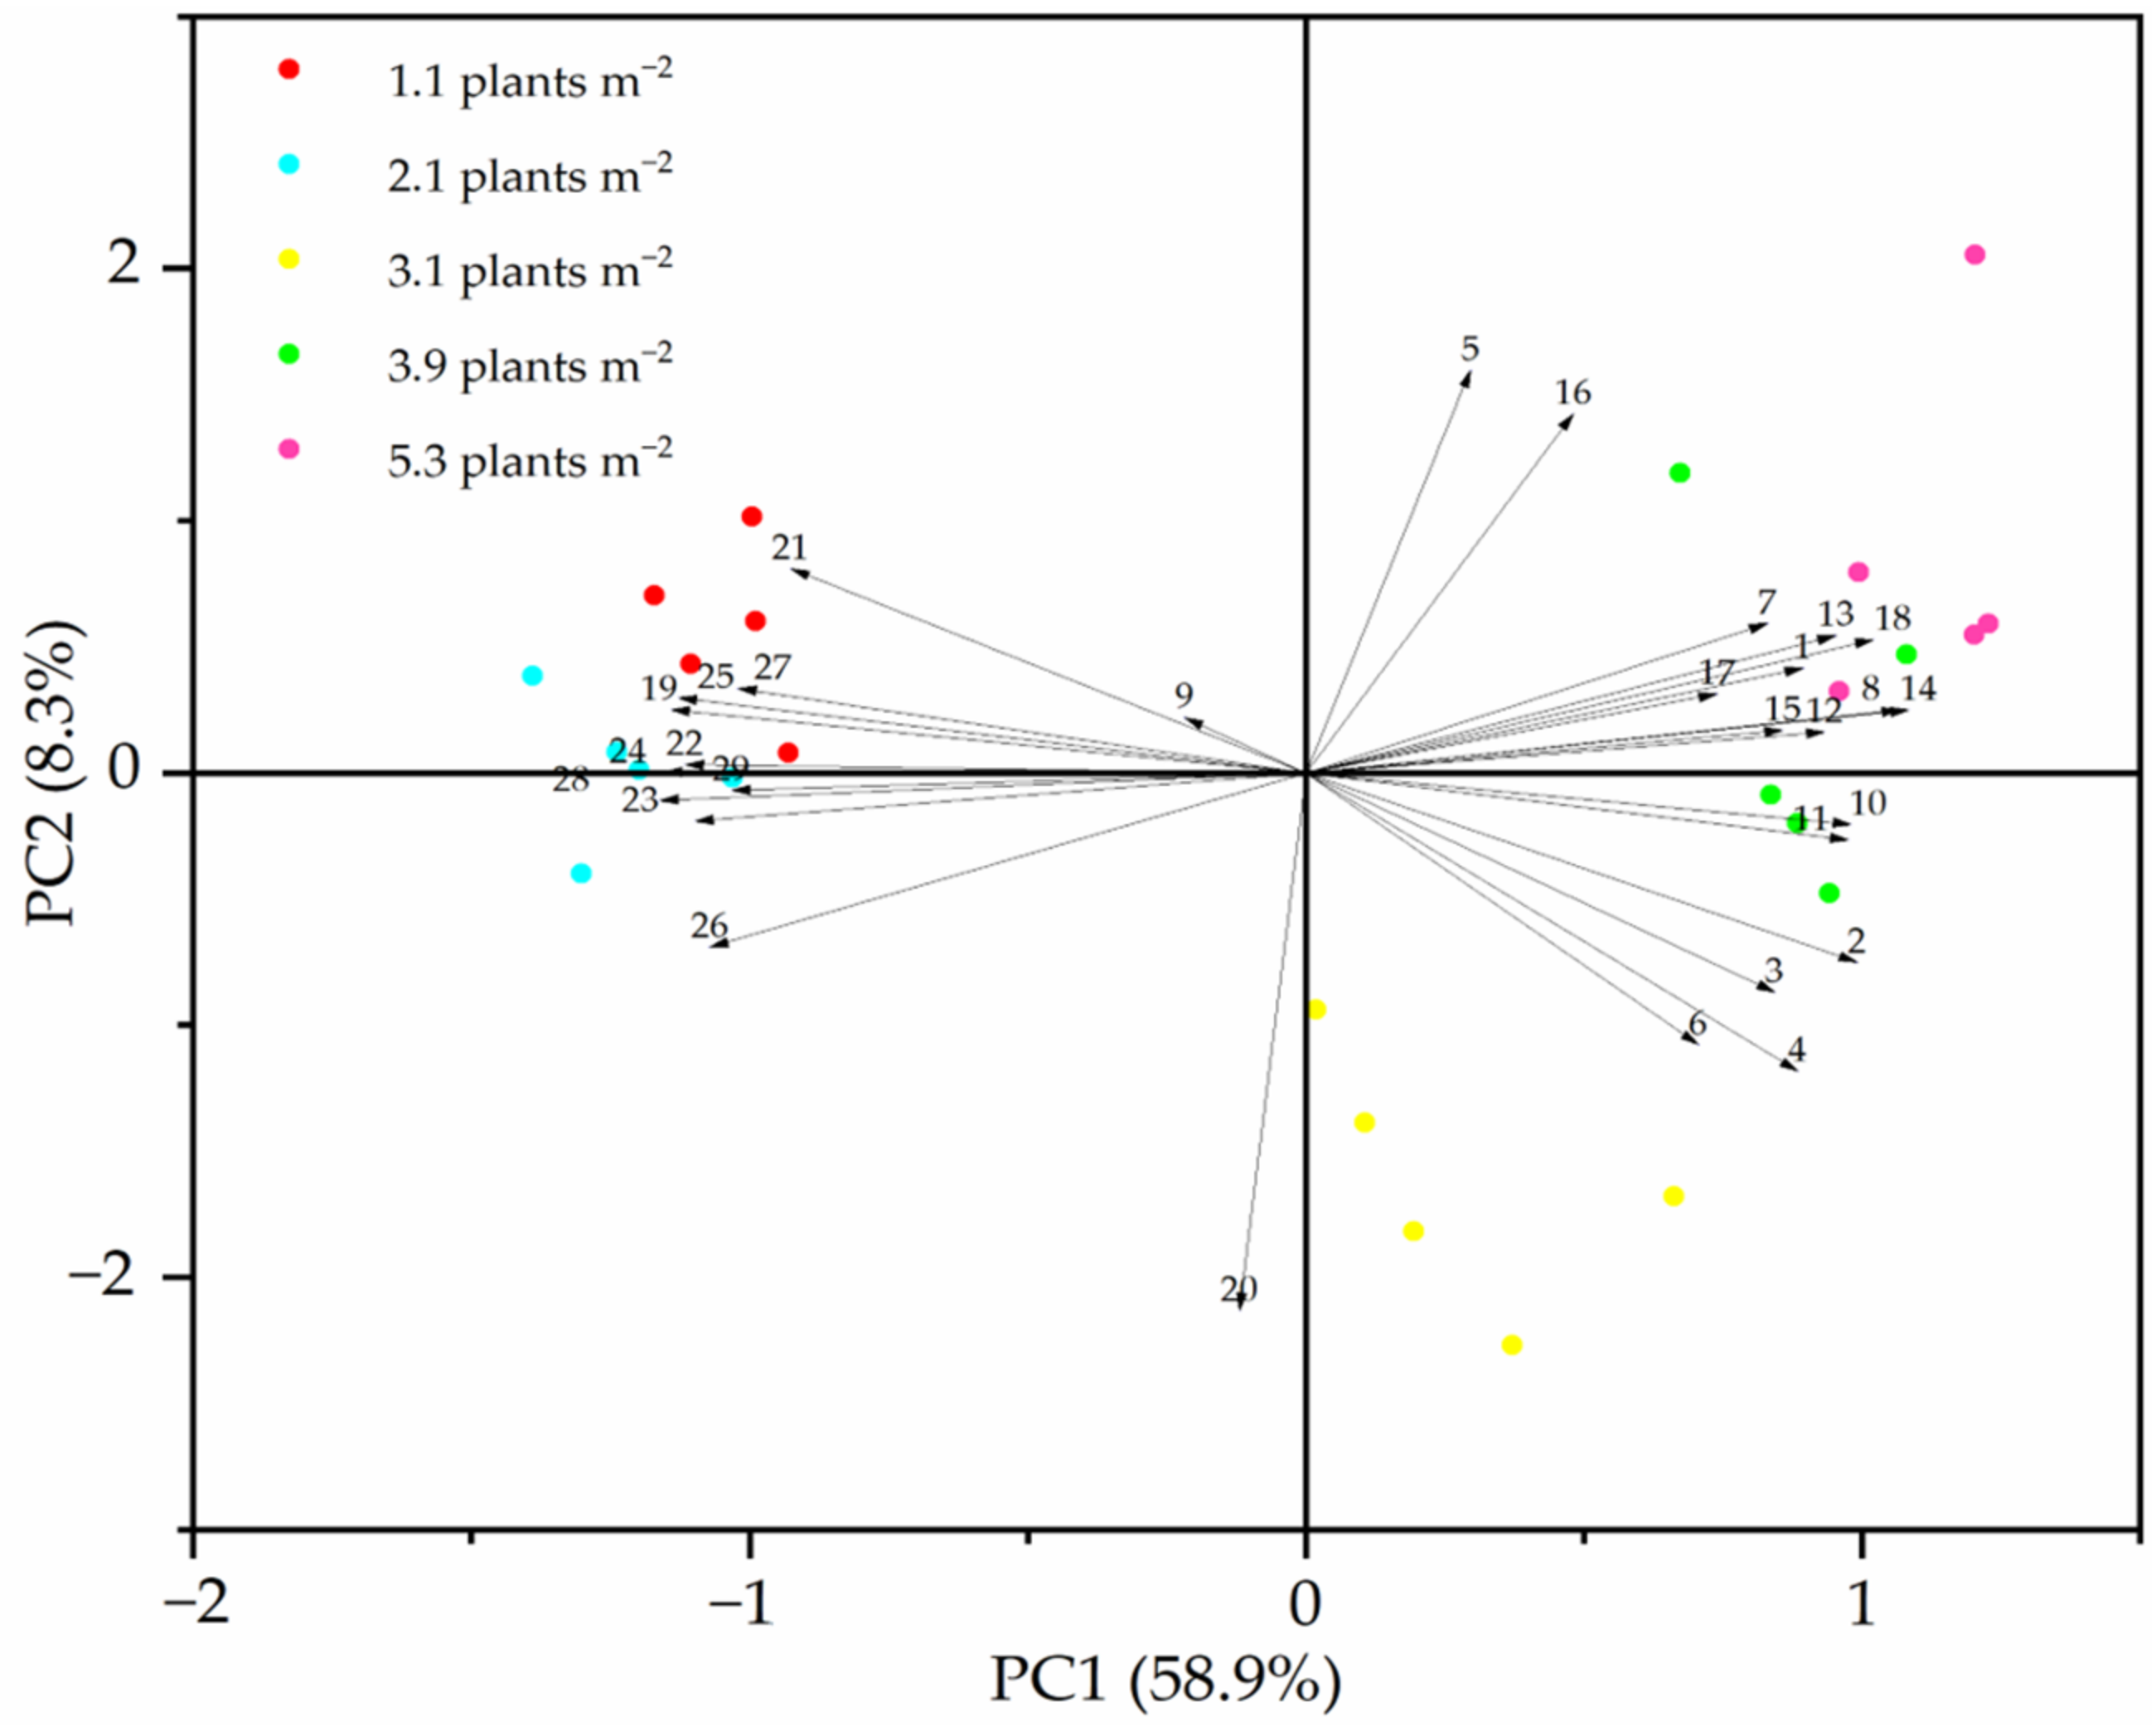
3.4. Soil Parameters Affect Plant Growth
4. Discussion
5. Conclusions
Author Contributions
Funding
Institutional Review Board Statement
Informed Consent Statement
Data Availability Statement
Acknowledgments
Conflicts of Interest
References
- Duan, H.; Wang, T.; Xue, X.; Yan, C. Dynamic monitoring of aeolian desertification based on multiple indicators in Horqin Sandy Land, China. Sci. Total Environ. 2019, 650, 2374–2388. [Google Scholar] [CrossRef] [PubMed]
- Wang, X.W.; Luo, N.; Shan, H.J.; Wang, X.F. Responses characteristics of 4 desert shrubs in Minqin under drought stress. Arid Land Geogr. 2016, 39, 1025–1035. [Google Scholar]
- Zhang, Y.-F.; Wang, X.-P.; Pan, Y.-X.; Hu, R. Variations of Nutrients in Gross Rainfall, Stemflow, and Throughfall Within Revegetated Desert Ecosystems. Water Air Soil Pollut. 2016, 227, 183. [Google Scholar] [CrossRef]
- Wei, Y.J.; Dang, X.H.; Wang, J.; Zhang, K.H.; Gao, Y.; Li, S.Z. Characterization of the soil ecological stoichiometry of Nitraria tangutorun nebk has during different succession stage. J. Soil Water Conserv. 2021, 35, 377–384. [Google Scholar]
- Sun, X.D.; Ning, Z.Y.; Yang, H.L.; Zhang, Z.Q.; Li, Y.L. The Stoichiometry of Carbon, Nitrogen and Phosphorus in Soil in Typical Desertified Regions, North China. J. Desert Res. 2018, 38, 1209–1218. [Google Scholar]
- Zeng, Q.C.; Liu, Y.; Fang, Y.; Ma, R.T.; Lal, R.; An, S.S.; Huang, Y.M. Impact of vegetation restoration on plants and soil C:N:P stoichiometry on the Yunwu Mountain Reserve of China. Ecol. Eng. 2017, 109, 92–100. [Google Scholar] [CrossRef]
- Jiang, J.Y.; Liu, R.T.; Zhang, A.N. Comparative analysis of soil fractal dimension and soil physical and chemical properties between Caragana korshinskii shrub plantations in arid and semi-arid desert stepp. Res. Soil Water Conserv. 2021, 28, 54–69. [Google Scholar]
- Zhao, Y.N.; Yu, L.; Zhou, Y.R.; Wang, H.M.; Ma, Q.H.; Lu, Q. Soil moisture dynamics and deficit of desert grassland with anthropogenic introduced shrub encroachment in the eastern Ningxia, China. Acta Ecol. Sin. 2020, 40, 1305–1315. [Google Scholar]
- Legates, D.R.; Mahmood, R.; Levia, D.F.; Deliberty, T.L.; Quiring, S.M.; Houser, C.; Nelson, F.E. Soil moisture: A central and unifying theme in physical geography. Prog. Phys. Geogr. Earth Environ. 2011, 35, 65–86. [Google Scholar] [CrossRef]
- Auken, O.W. Causes and consequences of woody plant encroachment into western North American grasslands. J. Environ. Manag. 2009, 90, 2931–2942. [Google Scholar] [CrossRef]
- Schlesinger, W.H.; Raikes, J.A.; Hartley, A.E.; Cross, A.F. On the spatial pattern of soil nutrients in desert ecosystems. Ecology 1996, 77, 364–374. [Google Scholar] [CrossRef] [Green Version]
- Li, P.X.; Wang, N.; He, W.M.; Krüsi, B.O.; Gao, S.Q.; Zhang, S.M.; Yu, F.H.; Dong, M. Fertile islands under Artemisia ordosica in inland dunes of northern China: Effects of habitats and plant developmental stages. J. Arid Environ. 2008, 72, 953–963. [Google Scholar] [CrossRef]
- Gao, Y.; Dang, X.H.; Yu, Y.; Wang, J.; Wang, S.; Yuan, W.J.; Zhang, X.W. Nabkha morphological characteristics and sand fixing capacity of Artemisia sphaerocphala in the southeastern edge of the Ulan Buh desert. J. Desert Res. 2015, 35, 1–7. [Google Scholar] [CrossRef]
- Zhou, Z.Y.; Li, F.R.; Chen, Y.M.; Wu, C.X.; Fu, H.; Li, X.R. Growth and reproduction and their relationships with soil moisture in artificial established Artemisia sphaerocephala populations of different densities in the Alxa desert. Acta Ecol. Sin. 2004, 24, 895–899. [Google Scholar]
- Zhang, J.; Ma, J.Y.; Yao, J.; Bai, Z.F.; Yang, Y.L.; Huang, A.L.; Du, J.H. Study on exploitation and utilization on wild Artemisia sphaerocephala. Pratacultural. Sci. 2002, 19, 10–13. [Google Scholar]
- Miao, X.M.; Zhang, L.J.; Chen, X.L.; Wu, S.J.; Niu, D.C.; Fu, H. The relationship of fatty acid composition and resistance of Artemisia sphaerocephala seedlings under water stress. Acta Prataculturae Sin. 2015, 24, 55–61. [Google Scholar]
- Liu, P.F.; Liu, J.; Zhu, H.H.; Zhang, X.; Zhang, G.; Li, Y.F.; Su, Y.; Wang, C.j. Difference of anti-fracture mechanical characteristics between lateral-root branches and adjacent upper straight roots of four plant species in vigorous growth period. Chin. J. Appl. Ecol. 2016, 27, 33–39. [Google Scholar]
- Du, J.R.; Surigega; Wang, T.J. Studies on population spatial distribution pattern of three Artemisia sand-fixing plants in Horqin sandy land. J. Inn. Mong. Norm. Univ. (Nat. Sci. Ed.) 2017, 46, 5543–5547. [Google Scholar]
- Ma, Y.T.; Zhang, L.J.; Du, M.X.; Zhou, Z.Y.; Niu, D.C.; Zhang, B.L. Effects of different ages Artemisia sphaerocephala on the content of nutrient elements in rhizosphere soil. Pratacultural. Sci. 2014, 31, 224–231. [Google Scholar]
- Fu, H.; Zhou, Z.Y.; Cheng, S.K. A study on relationship between vegetation density and soil water content of Artemisia sphaerocephala air-sown grassland in south-eastern edge of tengger desert, Inner Mongolia, China. J. Desert Res. 2001, 21, 265–270. [Google Scholar]
- Zhou, Y.Y.; Du, M.X.; Zhou, X.R.; Zhou, Z.Y.; Lu, X.; Tao, X.H.; Zhao, P.; Li, J.H.; Jin, Q. Characteristics of nitrogen content between rhizosphere and bulk soil of Amorpha fruticosa with different plant ages in southern edge of Mu Us desert. Pratacultural Sci. 2013, 30, 515–520. [Google Scholar]
- Bao, S.D. Soil Agrochemical Analysis; China Agricultural Press: Beijing, China, 2000. [Google Scholar]
- Huang, C.Y.; Xu, J.M. Soil Science, 3rd ed.; China Agricultural Press: Beijing, China, 2012. [Google Scholar]
- Zhou, Y.Y.; Zhou, X.R.; Zhou, Z.Y.; Jin, Q.; Li, J.H.; Song, X. Variations in the phenotypic character of Hedysarum mongolicum at different ages. Acta Prataculturae Sin. 2015, 24, 134–141. [Google Scholar] [CrossRef]
- Yang, J. Infraspecific variation in plant and the exploring methods. J. Wuhan Bot. Res. 1991, 9, 185–195. [Google Scholar]
- Meinzer, F.C. Functional convergence in plant responses to the environment. Oecologia 2003, 134, 1–11. [Google Scholar] [CrossRef]
- Shi, Y.L.; Wang, L.; Xia, Z. Current progress in the research of allometric scaling and resource limitations models. Sci. Technol. Engineering. 2014, 14, 159–166. [Google Scholar]
- Li, B.; Zhang, Y.Q.; Zhang, Z.T.; Yu, T.; Ding, G.D.; Qin, S.G.; Zhao, Y.Y.; Gao, G.L.; Lai, Z.R. Thoughts and suggestions on desertification combating in the sandy district of northern China. J. For. Grassl. Policy 2021, 1, 20–27. [Google Scholar] [CrossRef]
- James, J.; Tiller, R.; Richards, J. Multiple resources limit plant growth and function in a saline-alkaline desert community. J. Ecol. 2005, 93, 113–126. [Google Scholar] [CrossRef]
- Du, Z.Y.; An, H.; Wang, B.; Wen, Z.L.; Zhang, Y.R.; Wu, X.Z.; Li, Q.L. Effects of nutrient addition and precipitation manipulation on plant species diversity and biomass of in a desert grassland. Acta Agrestia Sin. 2020, 28, 1100–1110. [Google Scholar] [CrossRef]
- Zeng, Y.; Zhao, C.; Shi, F.; Schneider, M.; Lv, G.; Li, Y. Impact of groundwater depth and soil salinity on riparian plant diversity and distribution in an arid area of China. Sci. Rep. 2020, 10, 7272. [Google Scholar] [CrossRef] [PubMed]
- Zhang, X.; Guan, T.; Zhou, J.; Cai, W.; Gao, N.; Du, H.; Jiang, L.; Lai, L.; Zheng, Y. Community Characteristics and Leaf Stoichiometric Traits of Desert Ecosystems Regulated by Precipitation and Soil in an Arid Area of China. Int. J. Environ. Res. Public Health 2018, 15, 109. [Google Scholar] [CrossRef] [PubMed] [Green Version]
- McIntyre, G.I. Control of plant development by limiting factors: A nutritional perspective. Physiol. Plant. 2001, 113, 165–175. [Google Scholar] [CrossRef]
- Jobbágy, E.G.; Jackson, R.B. The distribution of soil nutrients with depth: Global patterns and the imprint of plants. Biogeochemistry 2001, 53, 51–77. [Google Scholar] [CrossRef]
- Su, Y.Z.; Zhang, T.H.; Li, Y.L.; Wang, F. Changes in soil properties after establishment of Artemisia halodendron and Caragana microphylla on shifting sand dunes in semiarid Horqin Sandy Land, northern China. Environ. Manag. 2005, 36, 272–281. [Google Scholar] [CrossRef]
- Schenk, H.J.; Jackson, R.B. The global biogeography of roots. Ecol. Monogr. 2002, 72, 311–328. [Google Scholar] [CrossRef]
- Schenk, H.J.; Jackson, R.B. Rooting depths, lateral root spreads and below-ground/above-ground allometries of plants in water-limited ecosystems. J. Ecol. 2002, 90, 480–494. [Google Scholar] [CrossRef] [Green Version]
- Wang, L.; Gan, Y.; Wiesmeier, M.; Zhao, G.; Zhang, R.; Han, G.; Siddique, K.H.M.; Hou, F. Grazing exclusion—An effective approach for naturally restoring degraded grasslands in Northern China. Land Degr. Dev. 2018, 29, 4439–4456. [Google Scholar] [CrossRef]
- Wang, X.; Gan, Y.; Hamel, C.; Lemke, R.; McDonald, C. Water use profiles across the rooting zones of various pulse crops. Field Crops Res. 2012, 134, 130–137. [Google Scholar] [CrossRef]
- Ma, X.X.; Yan, Y.; Lu, X.Y.; Wang, X.D. Dynamics of Belowground Biomass and Its Relationship with Soil Moisture in Alpine Grassland on the North Tibetan Plateau. Ecol. Environ. Sci. 2016, 25, 189–195. [Google Scholar] [CrossRef]
- Zhang, H.R.; Fu, G. Root biomass, carbon and nitrogen distribution pattern and correlation characteristics of alpine meadow in northern Tibet. Acta Ecol. Sin. 2021, 41, 3625–3633. [Google Scholar] [CrossRef]
- Schenk, H.J. Root competition: Beyond resource depletion. J. Ecol. 2006, 94, 725–739. [Google Scholar] [CrossRef]
- Craine, J.M. Reconciling plant strategy theories of Grime and Tilman. J. Ecol. 2005, 93, 1041–1052. [Google Scholar] [CrossRef]
- Grime, J.P. Plant strategy theories: A comment on Craine (2005). J. Ecol. 2007, 95, 227–230. [Google Scholar] [CrossRef]
- Robinson, D.; Hodge, A.; Fitter, A. Root Ecology; Springer: Berlin/Heidelberg, Germany, 2003. [Google Scholar] [CrossRef]
- Jansen, C.; van Kempen, M.M.; Bogemann, G.M.; Bouma, T.J.; de Kroon, H. Limited costs of wrong root placement in Rumex palustris in heterogeneous soils. New Phytol. 2006, 171, 117–126. [Google Scholar] [CrossRef]
- Zerihun, A.; Montagu, K.D. Belowground to aboveground biomass ratio and vertical root distribution responses of mature Pinus radiata stands to phosphorus fertilization at planting. Can. J. For. Res. 2004, 34, 1883–1894. [Google Scholar] [CrossRef]
- Cheng, X.; An, S.; Li, B.; Chen, J.; Lin, G.; Liu, Y.; Luo, Y.; Liu, S. Summer rain pulse size and rainwater uptake by three dominant desert plants in a desertified grassland ecosystem in northwestern China. Plant Ecol. 2005, 184, 1–12. [Google Scholar] [CrossRef]
- Hultine, K.; Koepke, D.; Pockman, W.; Fravolini, A.; Sperry, J.; Williams, D. Influence of soil texture on hydraulic properties and water relations of a dominant warm-desert phreatophyte. Tree Physiol. 2006, 26, 313–323. [Google Scholar] [CrossRef]
- Ryel, R.J.; Leffler, A.J.; Peek, M.S.; Ivans, C.Y.; Caldwell, M.M. Water conservation in Artemisia tridentata through redistribution of precipitation. Oecologia 2004, 141, 335–345. [Google Scholar] [CrossRef]


| Total N (%) | Available N (mg/kg) | Total P (%) | Available P (mg/kg) | Total K (%) | Organic Matter (%) | pH |
|---|---|---|---|---|---|---|
| 0.010 ± 0.008 | 80.28 ± 1.37 | 0.017 ± 0.001 | 2.18 ± 0.10 | 1.912 ± 0.032 | 0.058 ± 0.006 | 8.97 ± 0.19 |
Publisher’s Note: MDPI stays neutral with regard to jurisdictional claims in published maps and institutional affiliations. |
© 2022 by the authors. Licensee MDPI, Basel, Switzerland. This article is an open access article distributed under the terms and conditions of the Creative Commons Attribution (CC BY) license (https://creativecommons.org/licenses/by/4.0/).
Share and Cite
Zhou, X.; Ju, Z.; Liang, G.; Yang, L.; Zhou, Z.; Zhao, G. Effects of Population Density on Revegetation of Artemisia sphaerocephala and Soil Traits in a Desert Ecosystem. Diversity 2022, 14, 621. https://doi.org/10.3390/d14080621
Zhou X, Ju Z, Liang G, Yang L, Zhou Z, Zhao G. Effects of Population Density on Revegetation of Artemisia sphaerocephala and Soil Traits in a Desert Ecosystem. Diversity. 2022; 14(8):621. https://doi.org/10.3390/d14080621
Chicago/Turabian StyleZhou, Xiangrui, Zeliang Ju, Guoling Liang, Li Yang, Zhiyu Zhou, and Guiqin Zhao. 2022. "Effects of Population Density on Revegetation of Artemisia sphaerocephala and Soil Traits in a Desert Ecosystem" Diversity 14, no. 8: 621. https://doi.org/10.3390/d14080621
APA StyleZhou, X., Ju, Z., Liang, G., Yang, L., Zhou, Z., & Zhao, G. (2022). Effects of Population Density on Revegetation of Artemisia sphaerocephala and Soil Traits in a Desert Ecosystem. Diversity, 14(8), 621. https://doi.org/10.3390/d14080621