Abstract
Plecia nearctica Hardy, commonly referred to as lovebugs, is a species of march fly with a subtropical American distribution. The northern range limits of P. nearctica could alter due to climate change, which is a worldwide issue. It has been reported that flowers utilized by P. nearctica are not visited by pollinators, which may negatively impact foraging activity particularly when resources are limited. This study used 933 occurrence records of P. nearctica in the USA to predict its potential range expansion by 2050. To predict potential habitat change we applied well-established modeling procedures using both MaxEnt and geographical information system (GIS). Six environmental variables, two climate models, and two Shared Socio-economic Pathways (SSP126 and SSP585) were used in the analysis. The model performance was excellent with a high True Skilled Statistic (=0.75) value. The predicted potential distribution and range expansion of P. nearctica in 2050 includes the Gulf Coast and the Southeastern and Western regions of the USA. However, results suggest that most of the Central and Northern USA are unlikely to provide suitable habitat for this pest and have no reason for concern about interactions between pollinators and P. nearctica.
1. Introduction
The western honey bee (Apis mellifera L.) provides significant pollination services for many agricultural crops and wild plants around the world [1,2,3,4,5]. Honey bees have been intentionally transported by humans to every continent (with the exception of Antarctica) to provide pollination services [6]. As a result, they are now cosmopolitan in most landscapes and often move into agricultural areas when plants are in bloom to augment existing communities of pollinators. Recent estimates suggest that within the USA alone, pollinator-dependent crops are valued at more than $50 billion dollars/year [7,8].
Interspecies interactions among floral visitors is known to alter pollinator behavior, though there is a stark lack of information about the influence of community composition on pollination services [3]. Studies indicate that interactions between honey bees and wild or native bees are synergistic, leading to an overall increase in pollination services in some crops [9]. Other studies suggest that interspecies interactions could be antagonistic, with pollination services interrupted by the presence of other insects on flowers [10,11]. Anecdotal reports from beekeepers suggest that honey bees do not visit flowers with lovebugs (Plecia nearctica Hardy, Diptera: Bibionidae) on them [12], suggesting that this antagonistic interspecies interaction likely negatively affects pollination and should be further investigated.
Lovebugs are native to Central America and are considered an invasive pest in the Southeastern United States. The geographical distribution of P. nearctica in the USA is currently limited to the Southeastern states from Texas and Arkansas east to South Carolina [12,13], although this distribution could be expanded by future climate changes allowing invasion of other regions within the country. Lovebugs are attracted to floral and aromatic volatiles including phenylacetaldehyde, anethole, and anisealdehyde [14,15,16]. In most of their current range, lovebugs are bivoltine with a third smaller generation in parts of Florida, with peak activity generally observed from April–May and August–September [17,18].
Climate change can influence the distribution of species through both direct and indirect methods. Several recent studies have been conducted to predict changes in habitat suitability for pests that threaten humans, farm animals, agriculture, and apiculture [19,20,21,22,23,24,25,26]. These studies were performed by analyzing occurrence records from available online sources followed by utilizing specific modeling software, such as MaxEnt [20,25,26,27,28,29,30]. Additional analysis depends on the use of the geographical information system (GIS) to perform additional steps on the model [20,23,24,31,32,33].
Environmental variables from ecological datasets are used in modeling to predict future changes in habitat suitability [26]. In particular, temperature and humidity can provide good predictions of potential habitat change for agricultural pests. Unfortunately, changes in agricultural crops and landscape are not available in future climate models; therefore, they are not being incorporated in the modeling studies [25]. Additionally, changes in climate can cause invasion of some pests to new regions. Such invasive species could cause problems to beneficiary pollinators, especially bees [34]. For example, Small Hive Beetle (SHB), Aethina tumida Murray, is usually considered a benign pest in Africa but has become a widespread species causing damage to apiculture industry outside of its native range, with its range expanding due to climate change [35,36,37].
Ecological modeling is a standard method that has been applied by scientists from different disciplines and can predict the habitat suitability of organisms facing climate change. This study was performed to predict the potential habitat suitability for P. nearctica and its future distribution in the USA. The results of this study can help to predict the potential distribution and range change of P. nearctica until 2050. Additionally, we provide suggestions for further investigations regarding the potential impacts of P. nearctica on insect pollinators, especially honey bees.
2. Materials and Methods
2.1. Occurrence Data
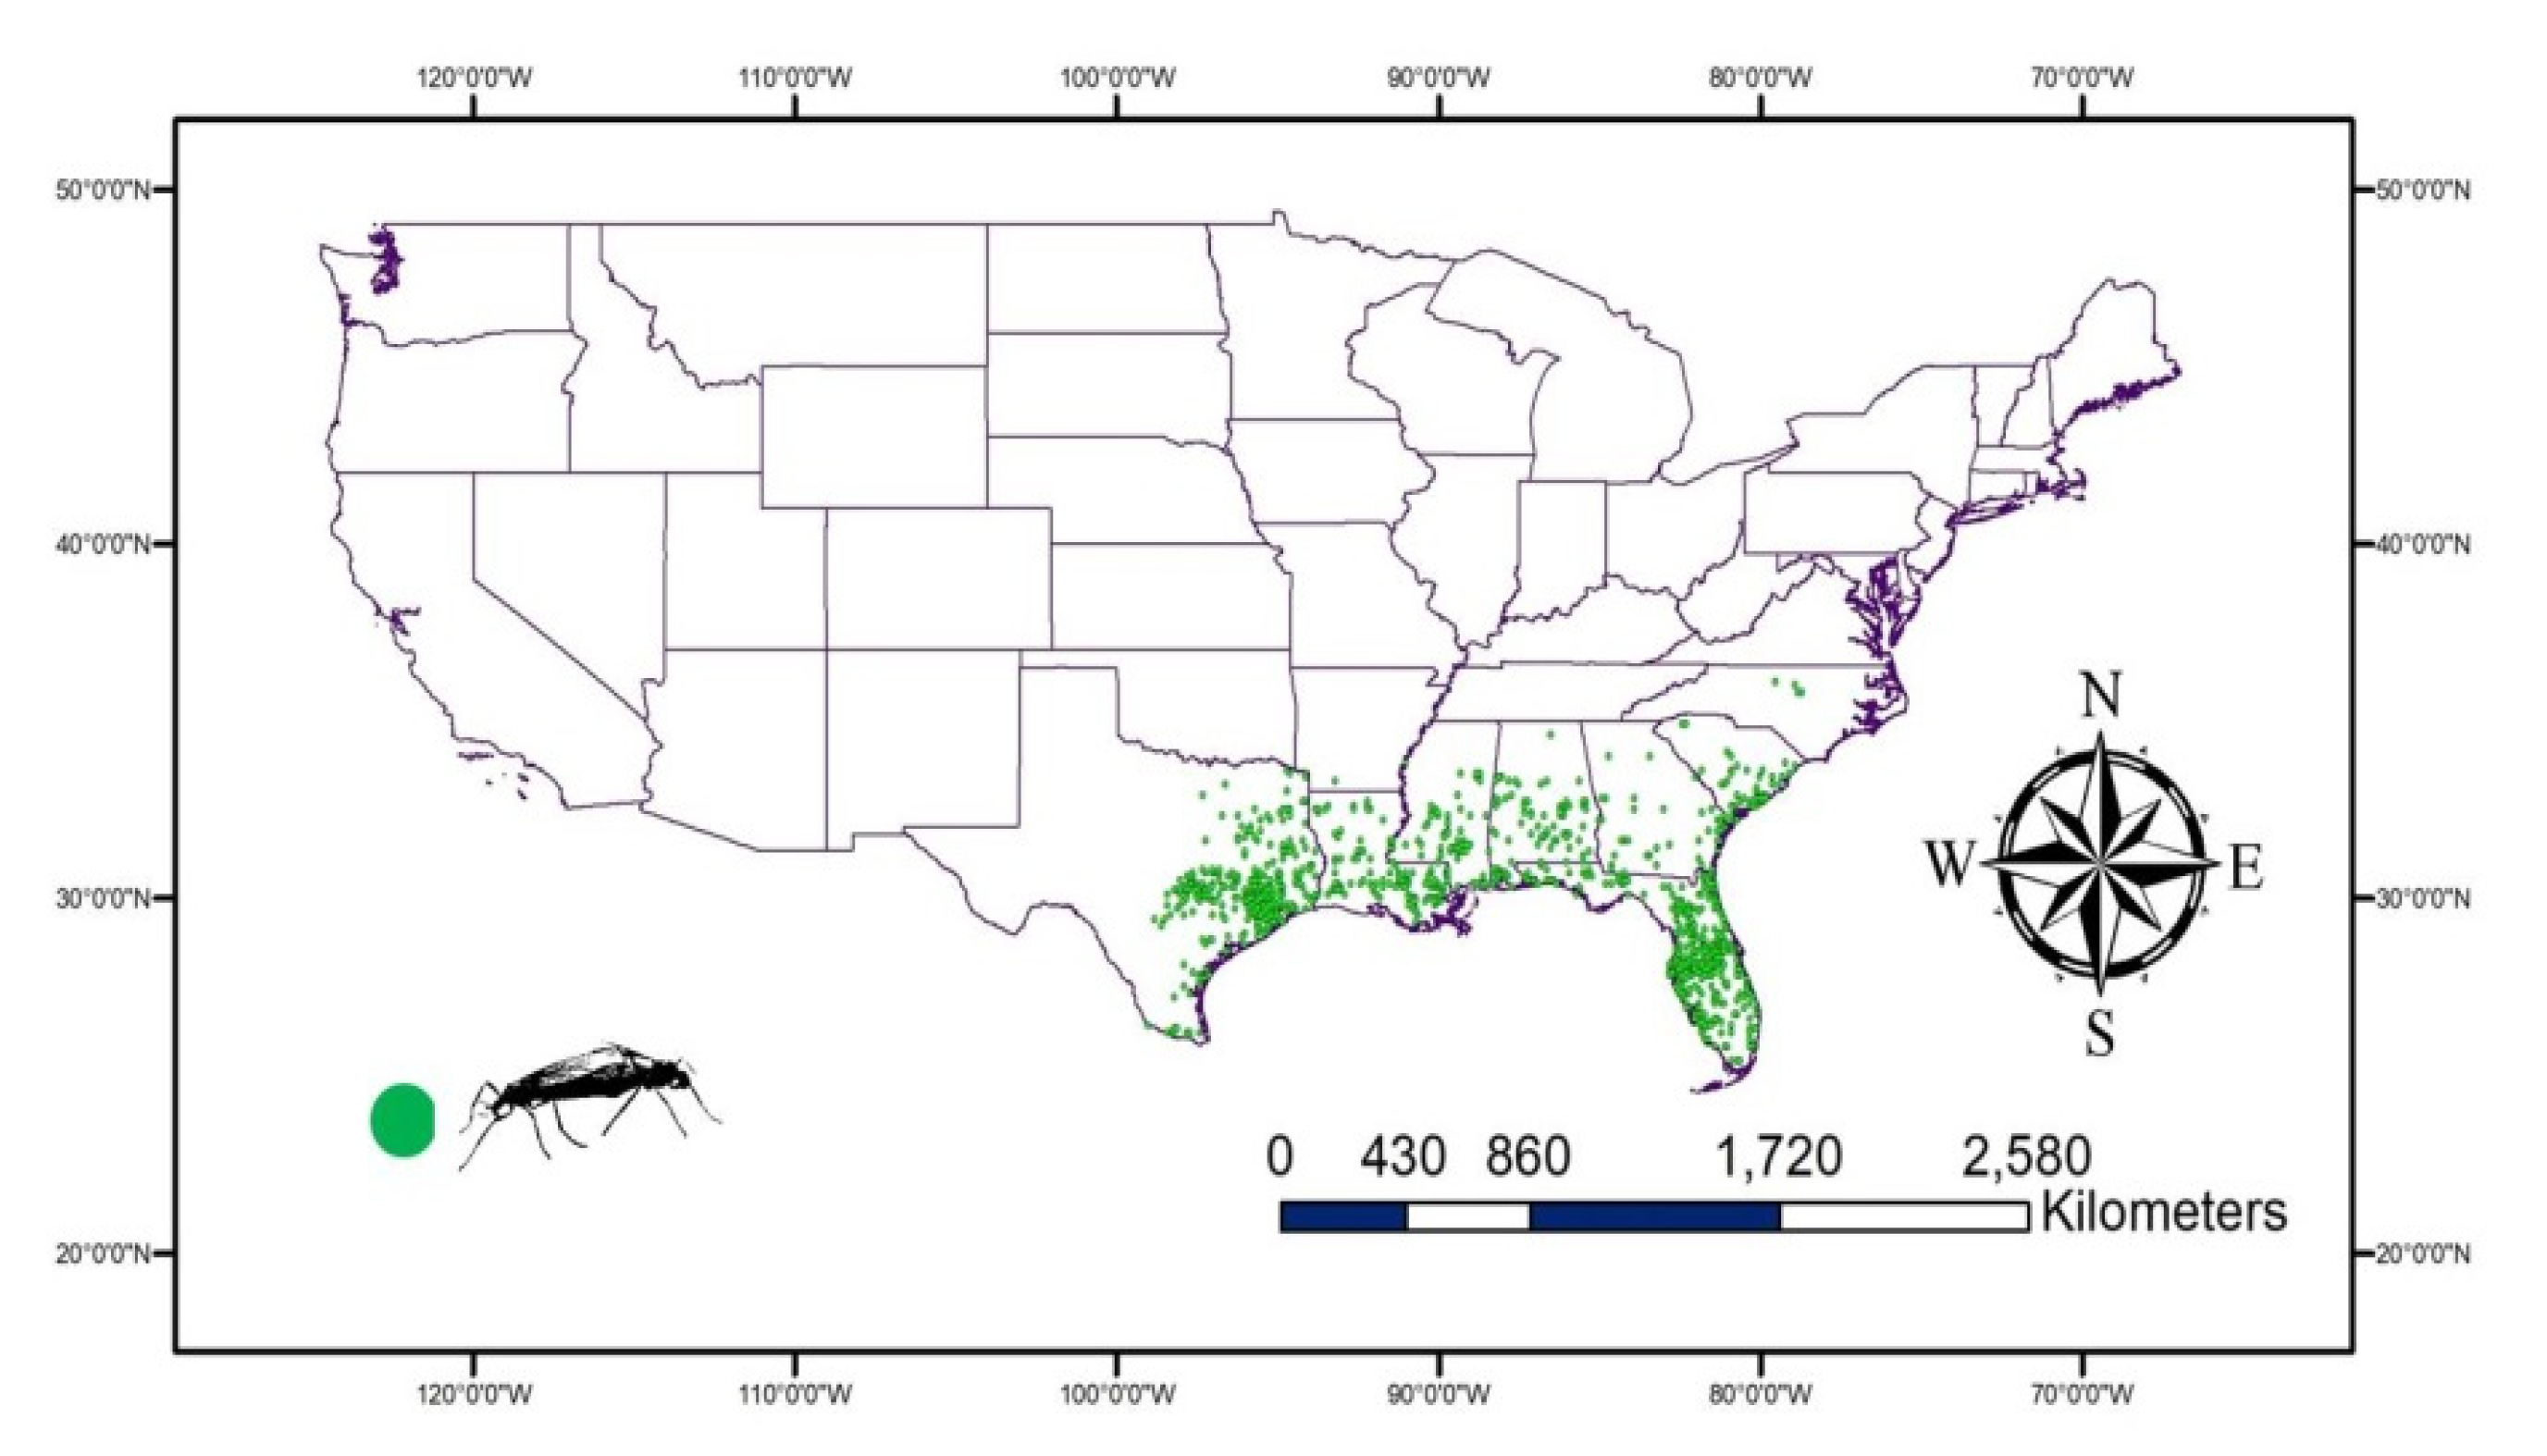
The available records for lovebugs, Plecia nearctica, in the USA were downloaded from Global Biodiversity Information Facility (GBIF) (GBIF.org on 14 December 2021, https://doi.org/10.15468/dl.rnrndb). A total of 933 records (2010–2021) were used in the study and were mainly from the Southern USA. These records were visualized using DIVA-GIS 7.5.0 (https://www.diva-gis.org accessed on 14 December 2021) to remove any repeated or incorrect records (Figure 1).
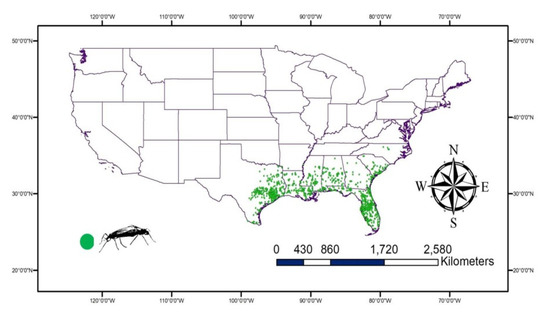
Figure 1.
The occurrence of Plecia nearctica recorded Global Biodiversity Information Facility (GBIF) reveal the distribution of lovebugs in the Southern USA.
2.2. Environmental Variables
The commonly used source for environmental variables is worldclim.org, which we used (WorldClim version 2.1) to obtain the available 19 variables at 5 km2 spatial resolution [38], representing a 30-year period (1970–2000). These variables were used to understand the historic/current distribution of P. nearctica within the study area. Two analyses were performed to select the most important variables [23,25]: (1) the jackknife test was performed using MaxEnt v 3.4.1 [39] and the 19 variables to determine the most important variables with regularized training gain more than 1 (Supplementary Material Figure S1), (2) Species Distribution Modeling (SDM) was used to remove highly correlated variables in ArcGIS 10.8 with correlation threshold of 0.8. Finally, six variables were selected to perform the analysis (Table 1).

Table 1.
Environmental variables used in the study.
The same six variables for future conditions during 2050 (2041–2060) were obtained from the Coupled Model Intercomparison Project Phase 6 (CMIP6) [40] for two climate models (Table 2). The low and the high levels of Shared Socio-economic Pathways (SSP126 and SSP585) were selected from each model to perform the future predictions. More details about the models and their websites are available in the Supplementary Materials (Supplementary Information: Figures S1 and S2).

Table 2.
The two future models used in the study.
2.3. Habitat Suitability Modeling Using MaxEnt
Environmental variables were prepared to cover the current USA using the shape extraction tool in ArcGIS 10.8 (Environmental Systems Research Institute, Inc., Redlands, CA, USA). The variables were then analyzed using MaxEnt v 3.4.1 [39]. Specific parameters were selected to run the modeling analysis according to previous studies [26] (Table 3).

Table 3.
The selected parameters used to run the maximum entropy modeling in MaxEnt.
2.4. GIS Analysis
The model outputs from the MaxEnt were visualized using ArcGIS 10.8 [24,25,26]. The maps from the modeling study were classified in the GIS into four suitability classes [26] as rarely, moderately, highly, and very highly suitable for the prevalence of P. nearctica in the study area. Two spatial analysis tools (Raster calculator and Reclassify) were used in the GIS to obtain the final maps: a map for historic/current conditions, another map for SSP126, and a map for SSP585. The averages of the two future models (BCC-CSM2-MR and MRI-ESM2-0) were calculated to obtain future maps of SSP126 and SSP585. In addition, we represent the overall average of SSP126 and SSP585, using the GIS of the future habitat suitability for P. nearctica. The gain/loss map was also established to show the variations between current and future habitat suitability for P. nearctica.
2.5. Contribution Percentages and Model Performance
The outcomes from the ecological model (MaxEnt results) were used to evaluate its performance [24,25,26]. First, the contribution of each variable in the model was presented to highlight the most effective variable. Then, the following parameters were used to judge the performance of the model: area under the curve (AUC) of the receiver operating characteristics (ROC), rates of omission/commission, and jackknife test values for the variables contributed to the analysis. The accuracy of the used model was tested using a common test of the True Skilled Statistic (TSS).
3. Results
3.1. Contribution Percentages and Model Performance
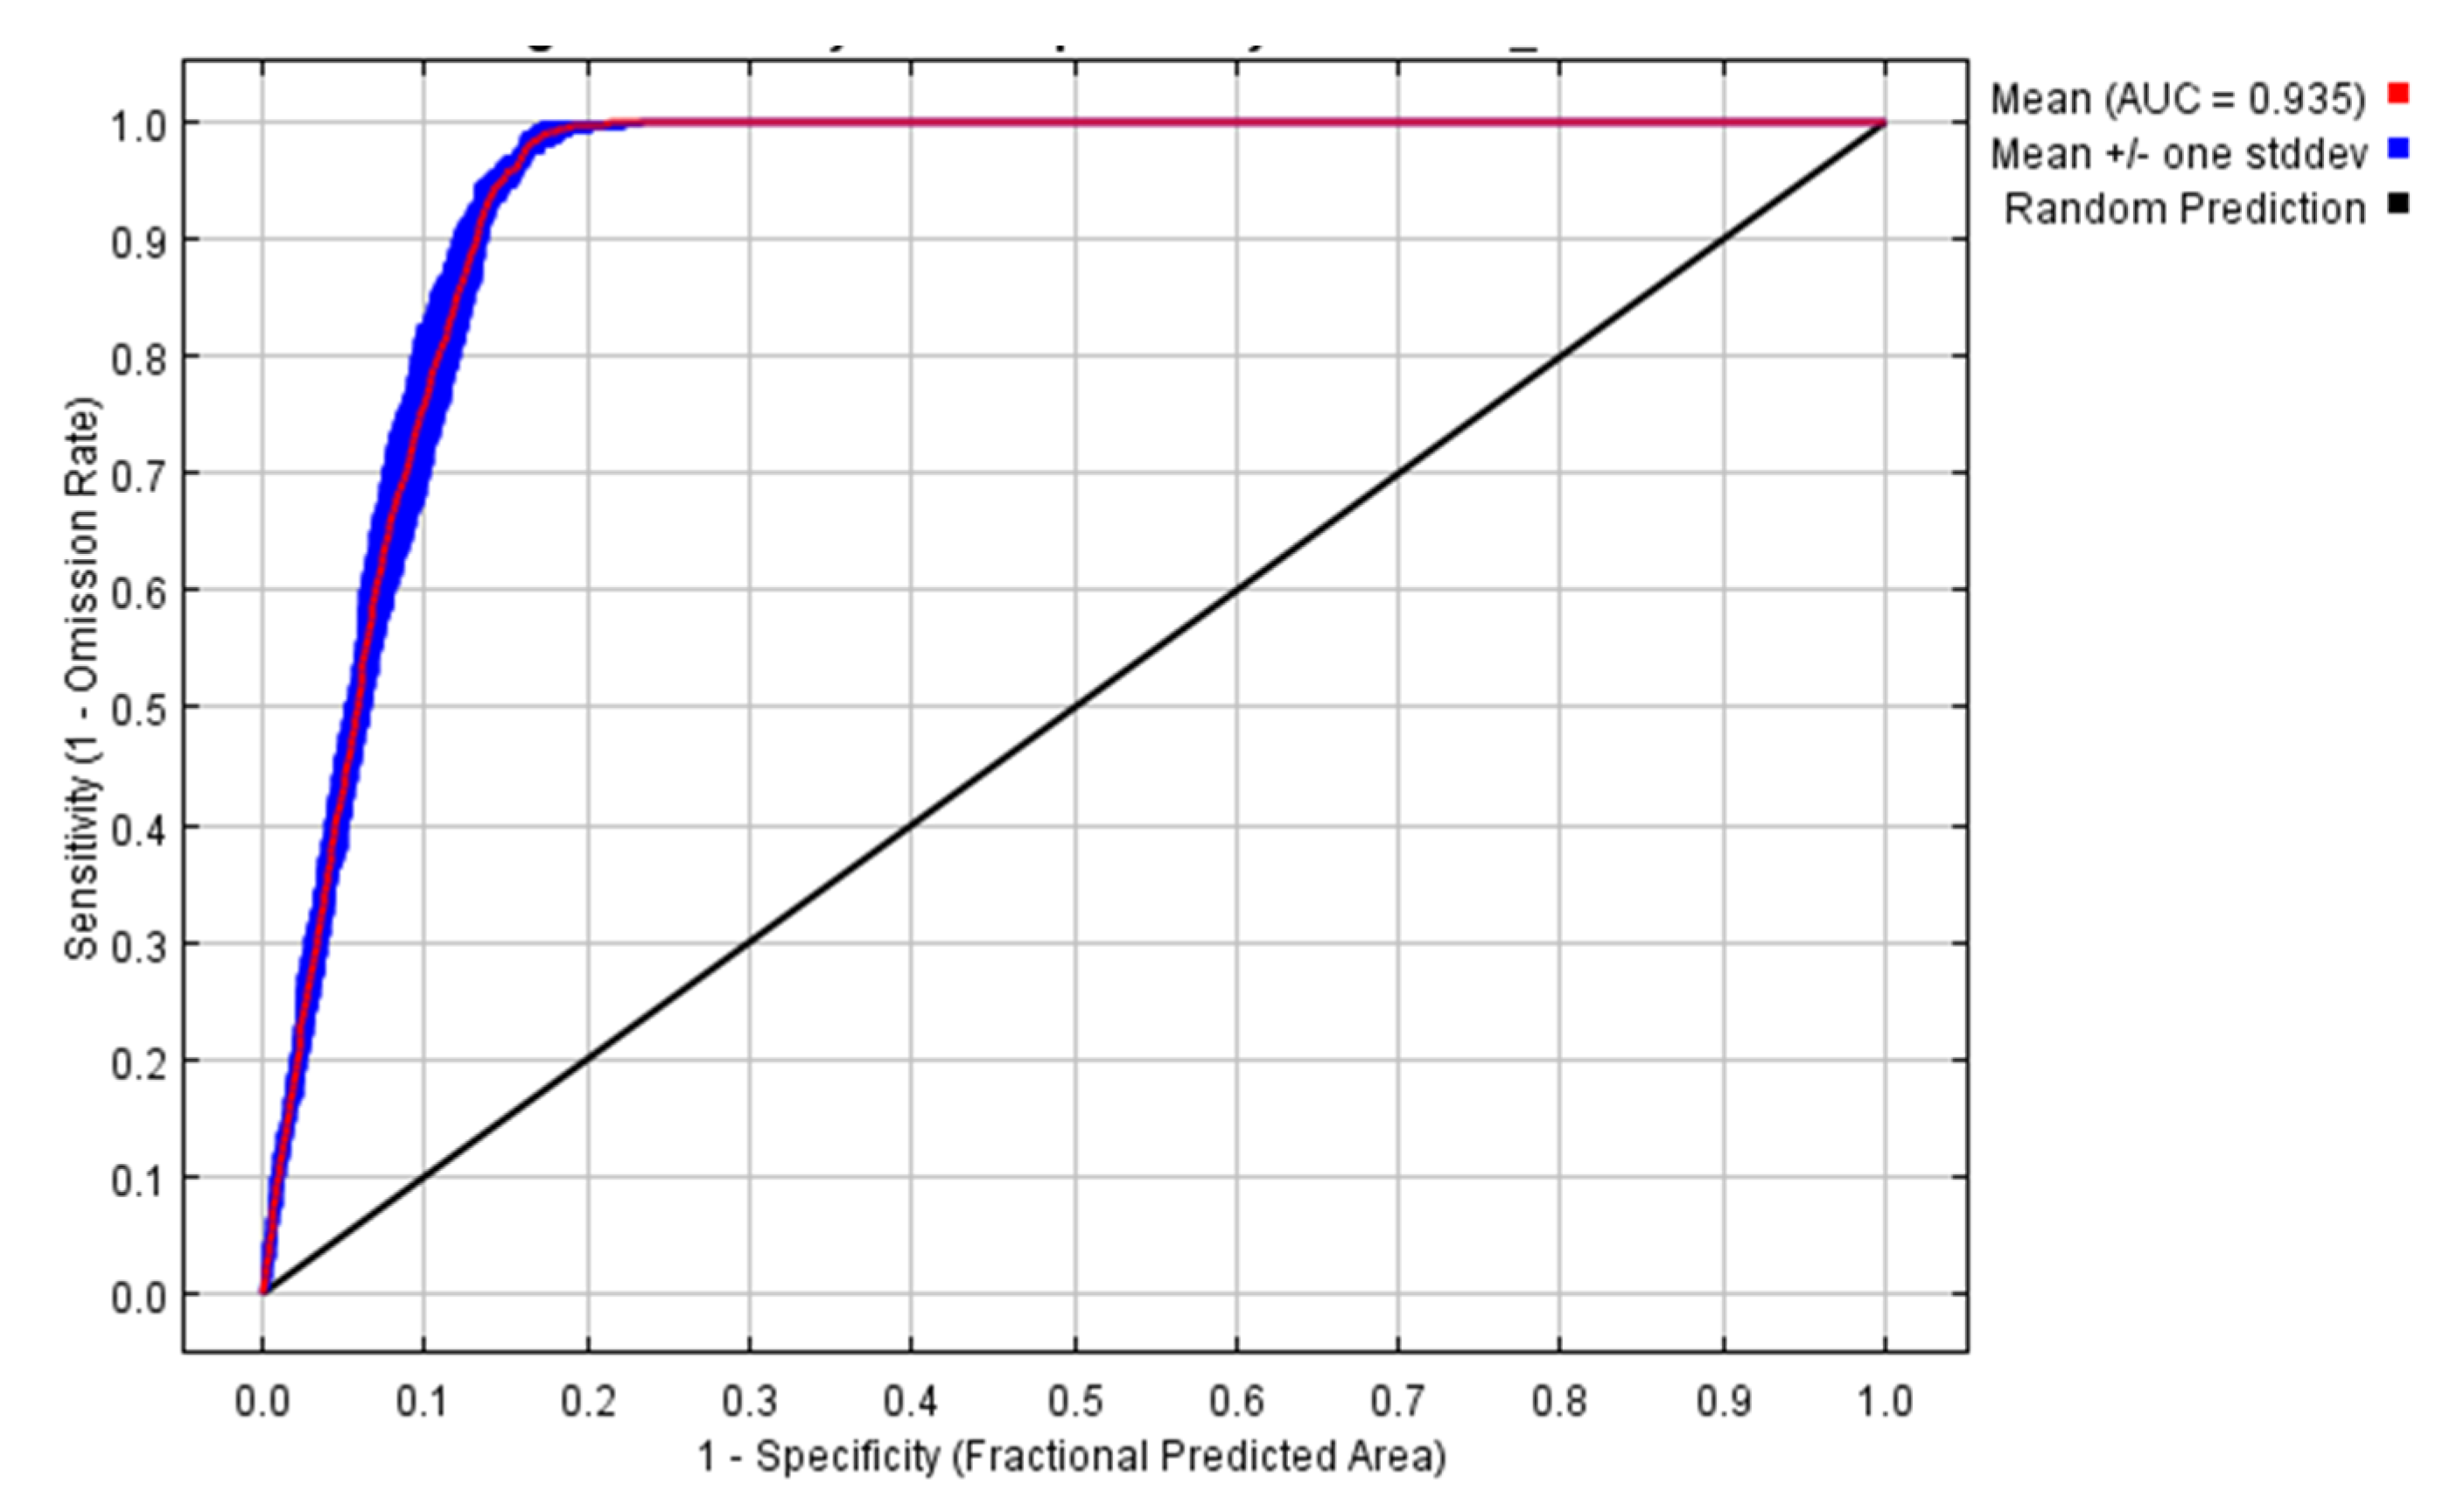
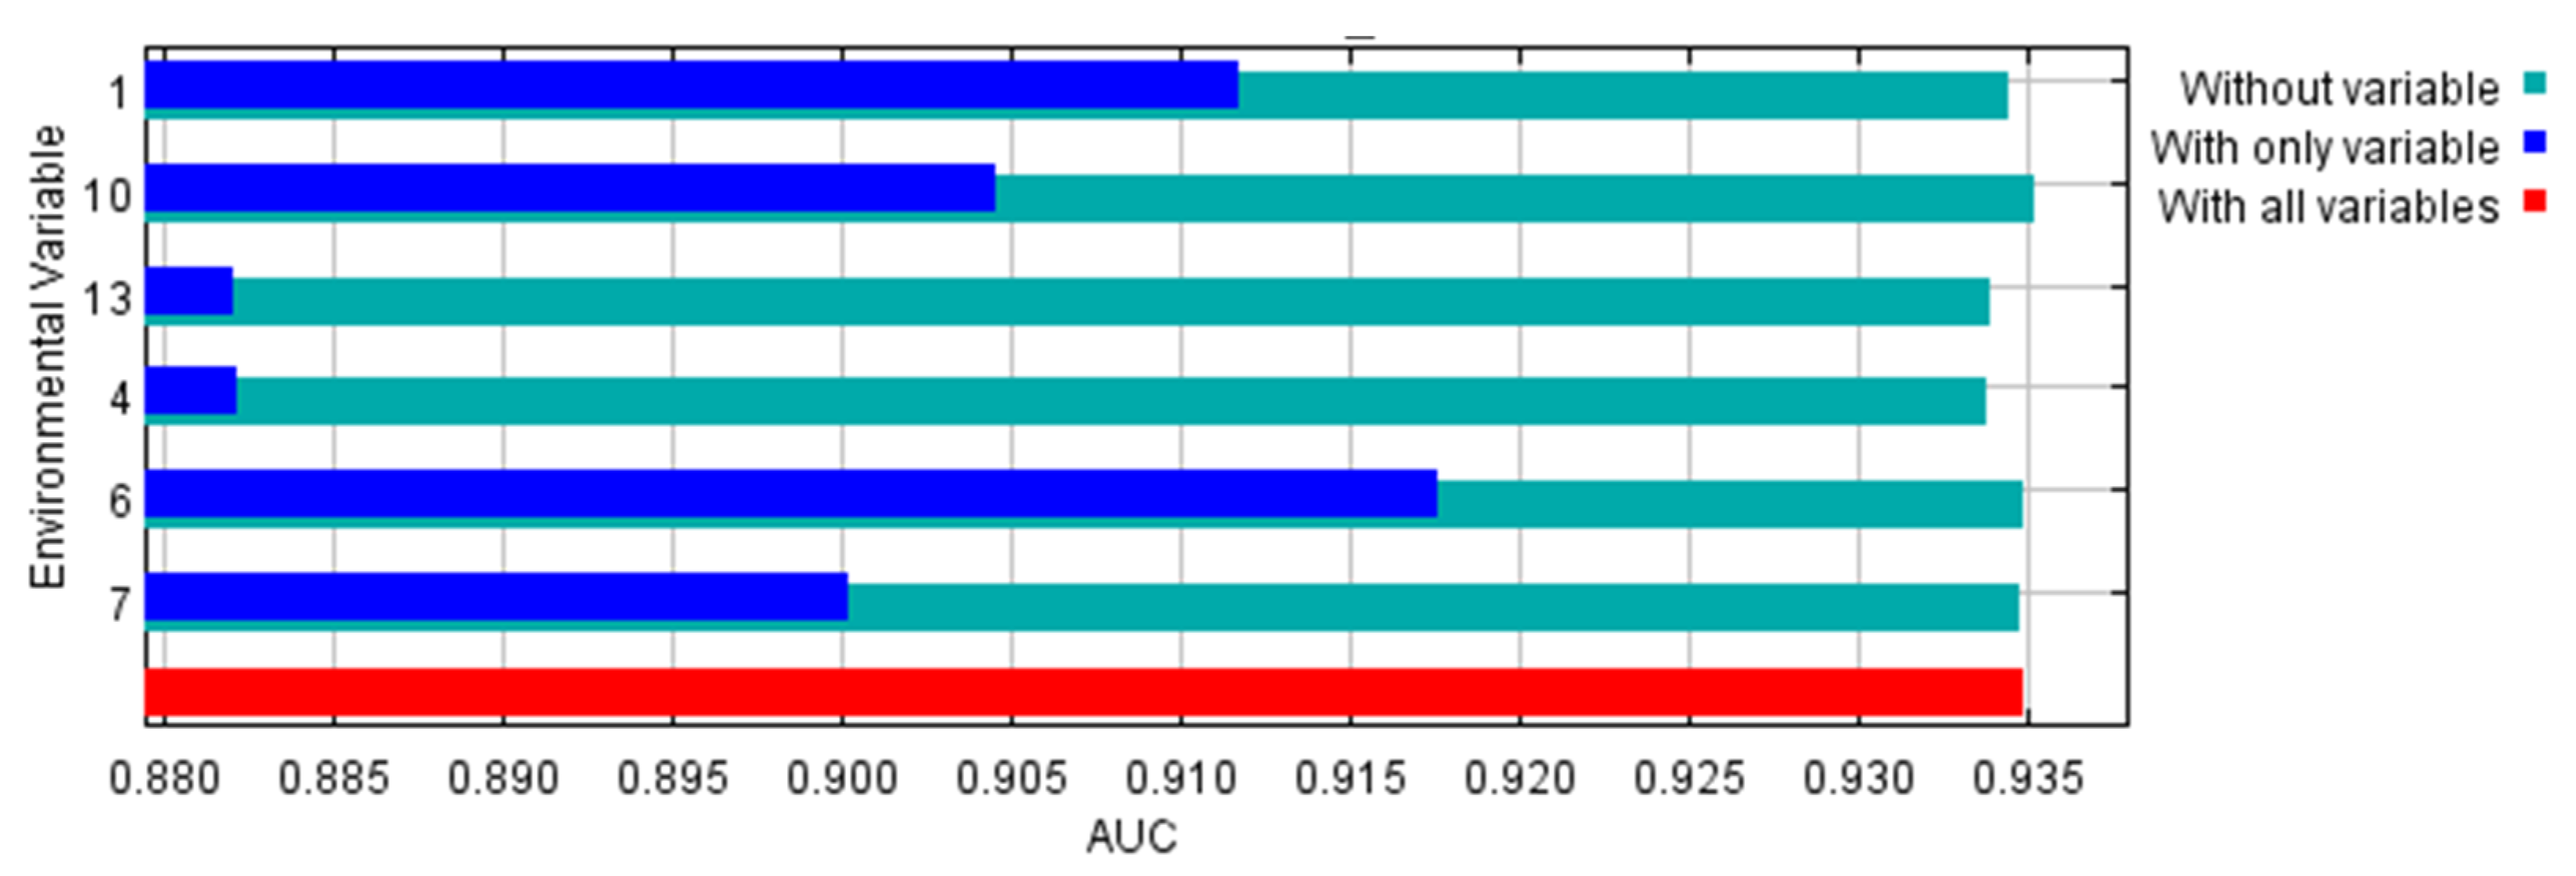
The environmental variables bio1, bio13, bio6, bio7, bio4, and bio10 contributed to the model by 52.4, 21.1, 18.9, 6.3, 0.7, and 0.6%, respectively. So, the highest contribution was to annual mean temperature followed by precipitation of the wettest month. Temperature variables contributed to the model by 70.9%, while the precipitation variable contributed 21.1%. The area under the curve (AUC) for the used model was high (0.935 ± 0.006), as shown in Figure 2. In addition, the AUC for each of the used variables were higher than 0.88 (Figure 3). The other outputs from the model are presented in the Supplementary Materials (Figures S2–S10). From these figures, the omission rate was close to the predicted omission (Figure S2), and the jackknife values for the regularized gain (Figure S3) and test gain (Figure S4) were high (>1.1). The response curves for variables that were used in the analysis showed that the ideal range for each variable was approximately 20–25 °C for bio1 (Figure S5), 400–500 for bio4 (Figure S6), 10–13 °C for bio6 (Figure S7), 22–25 °C for bio7 (Figure S8), 27–28 °C for bio10 (Figure S9), and 195–205 mm for bio13 (Figure S10). The true skilled statistic (TSS) was equal to 0.75.
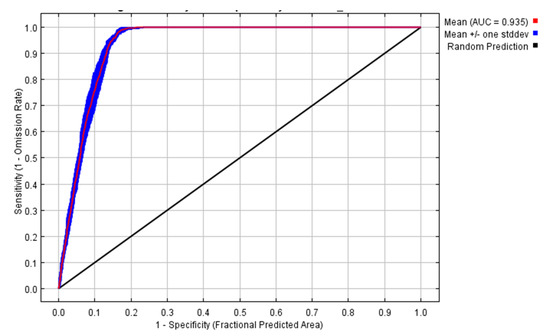
Figure 2.
The receiver operating characteristic (ROC) curve for the data used in the model for 10 replicates.
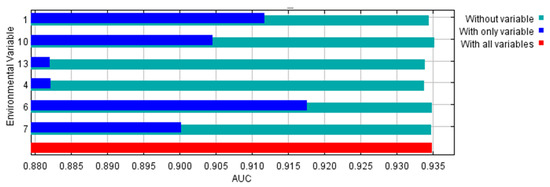
Figure 3.
Jackknife test using area under the curve (AUC) on test data for the used environmental variables. 1: Annual mean temperature, 4: Temperature seasonality, 6: Minimum temperature of coldest month, 7: Temperature annual range, 10: Mean temperature of warmest quarter, and 13: Precipitation of wettest month.
3.2. Historic/Current Distribution of Plecia nearctica
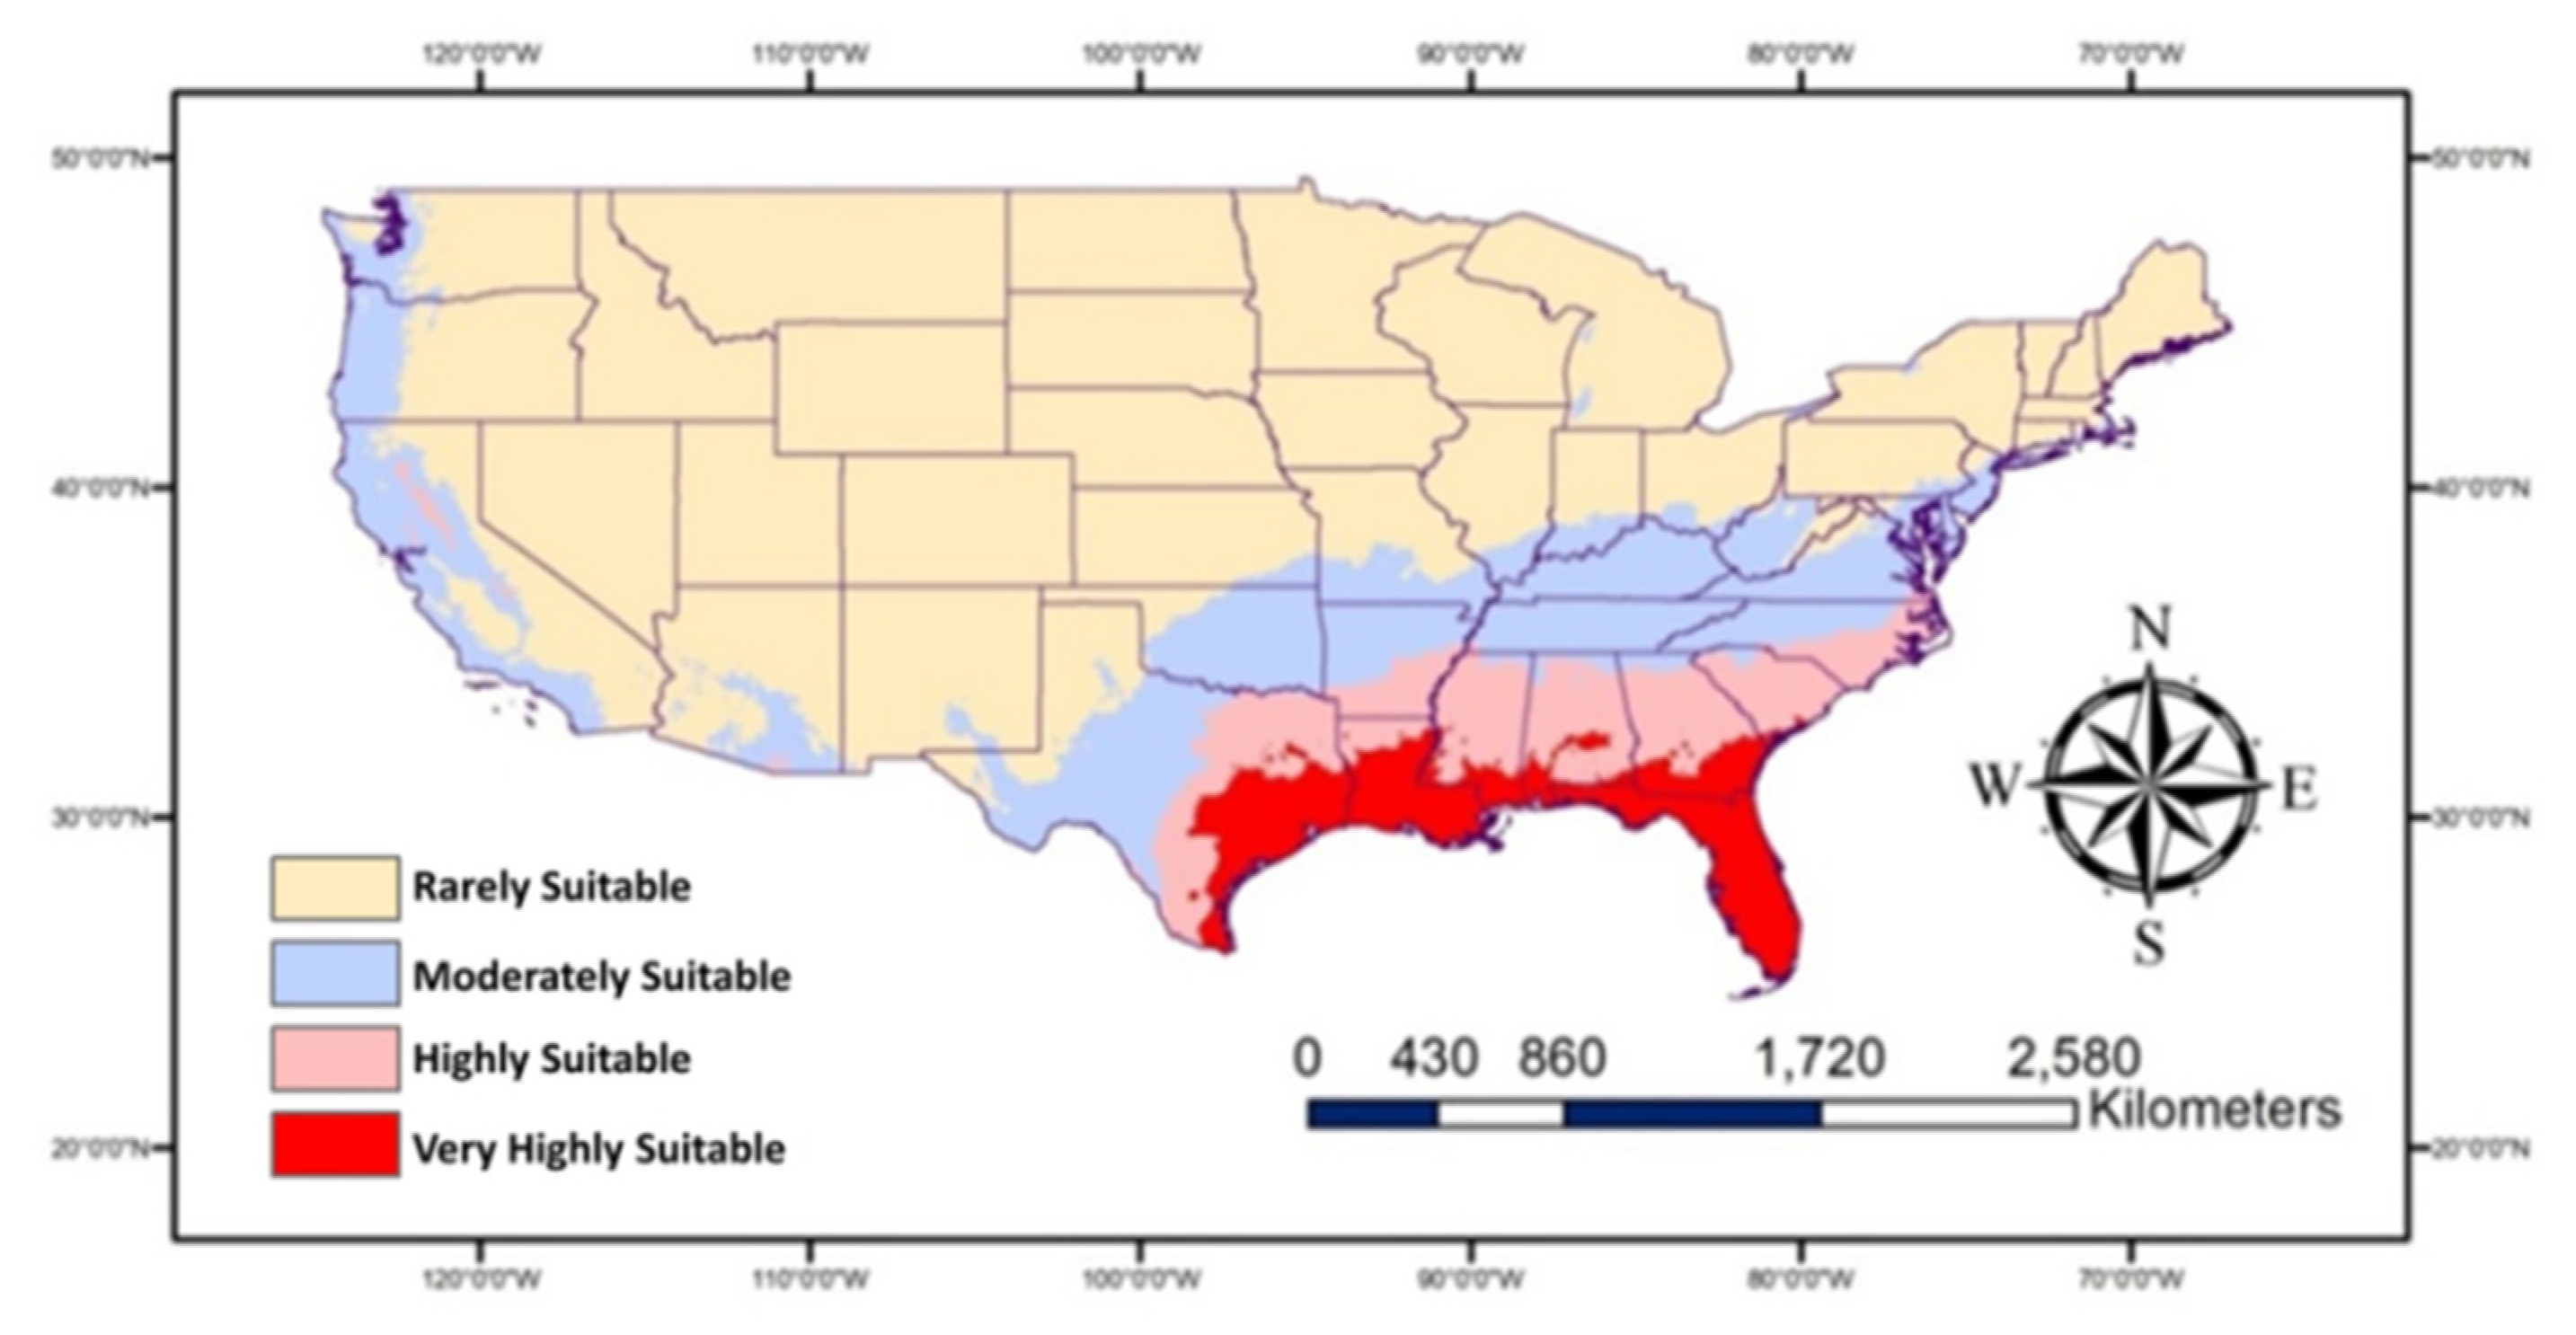
The map (Figure 4) shows the “very highly suitable” Southern states, in particular all of Florida and some parts of Georgia, Alabama, Mississippi, Louisiana, and Texas for P. nearctica. These states in addition to South Carolina and some parts of North Carolina are highly suitable for the occurrence of this pest. The moderately suitable areas occur in some states including North Carolina, Virginia, West Virginia, Kentucky, Tennessee, Missouri, Arkansas, Oklahoma, and Texas in the east and some areas in Arizona, California, Oregon, and Washington in the west. The rest of the USA is not likely to be highly suitable for P. nearctica. It seems that warm conditions are perfect for the prevalence of P. nearctica.
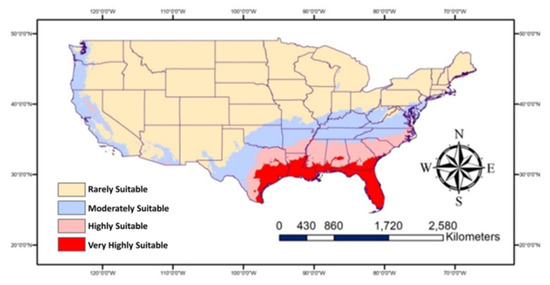
Figure 4.
Map showing historic/current habitat suitable for Plecia nearctica in the USA.
3.3. Prediction about Future Suitable Habitat for Plecia nearctica
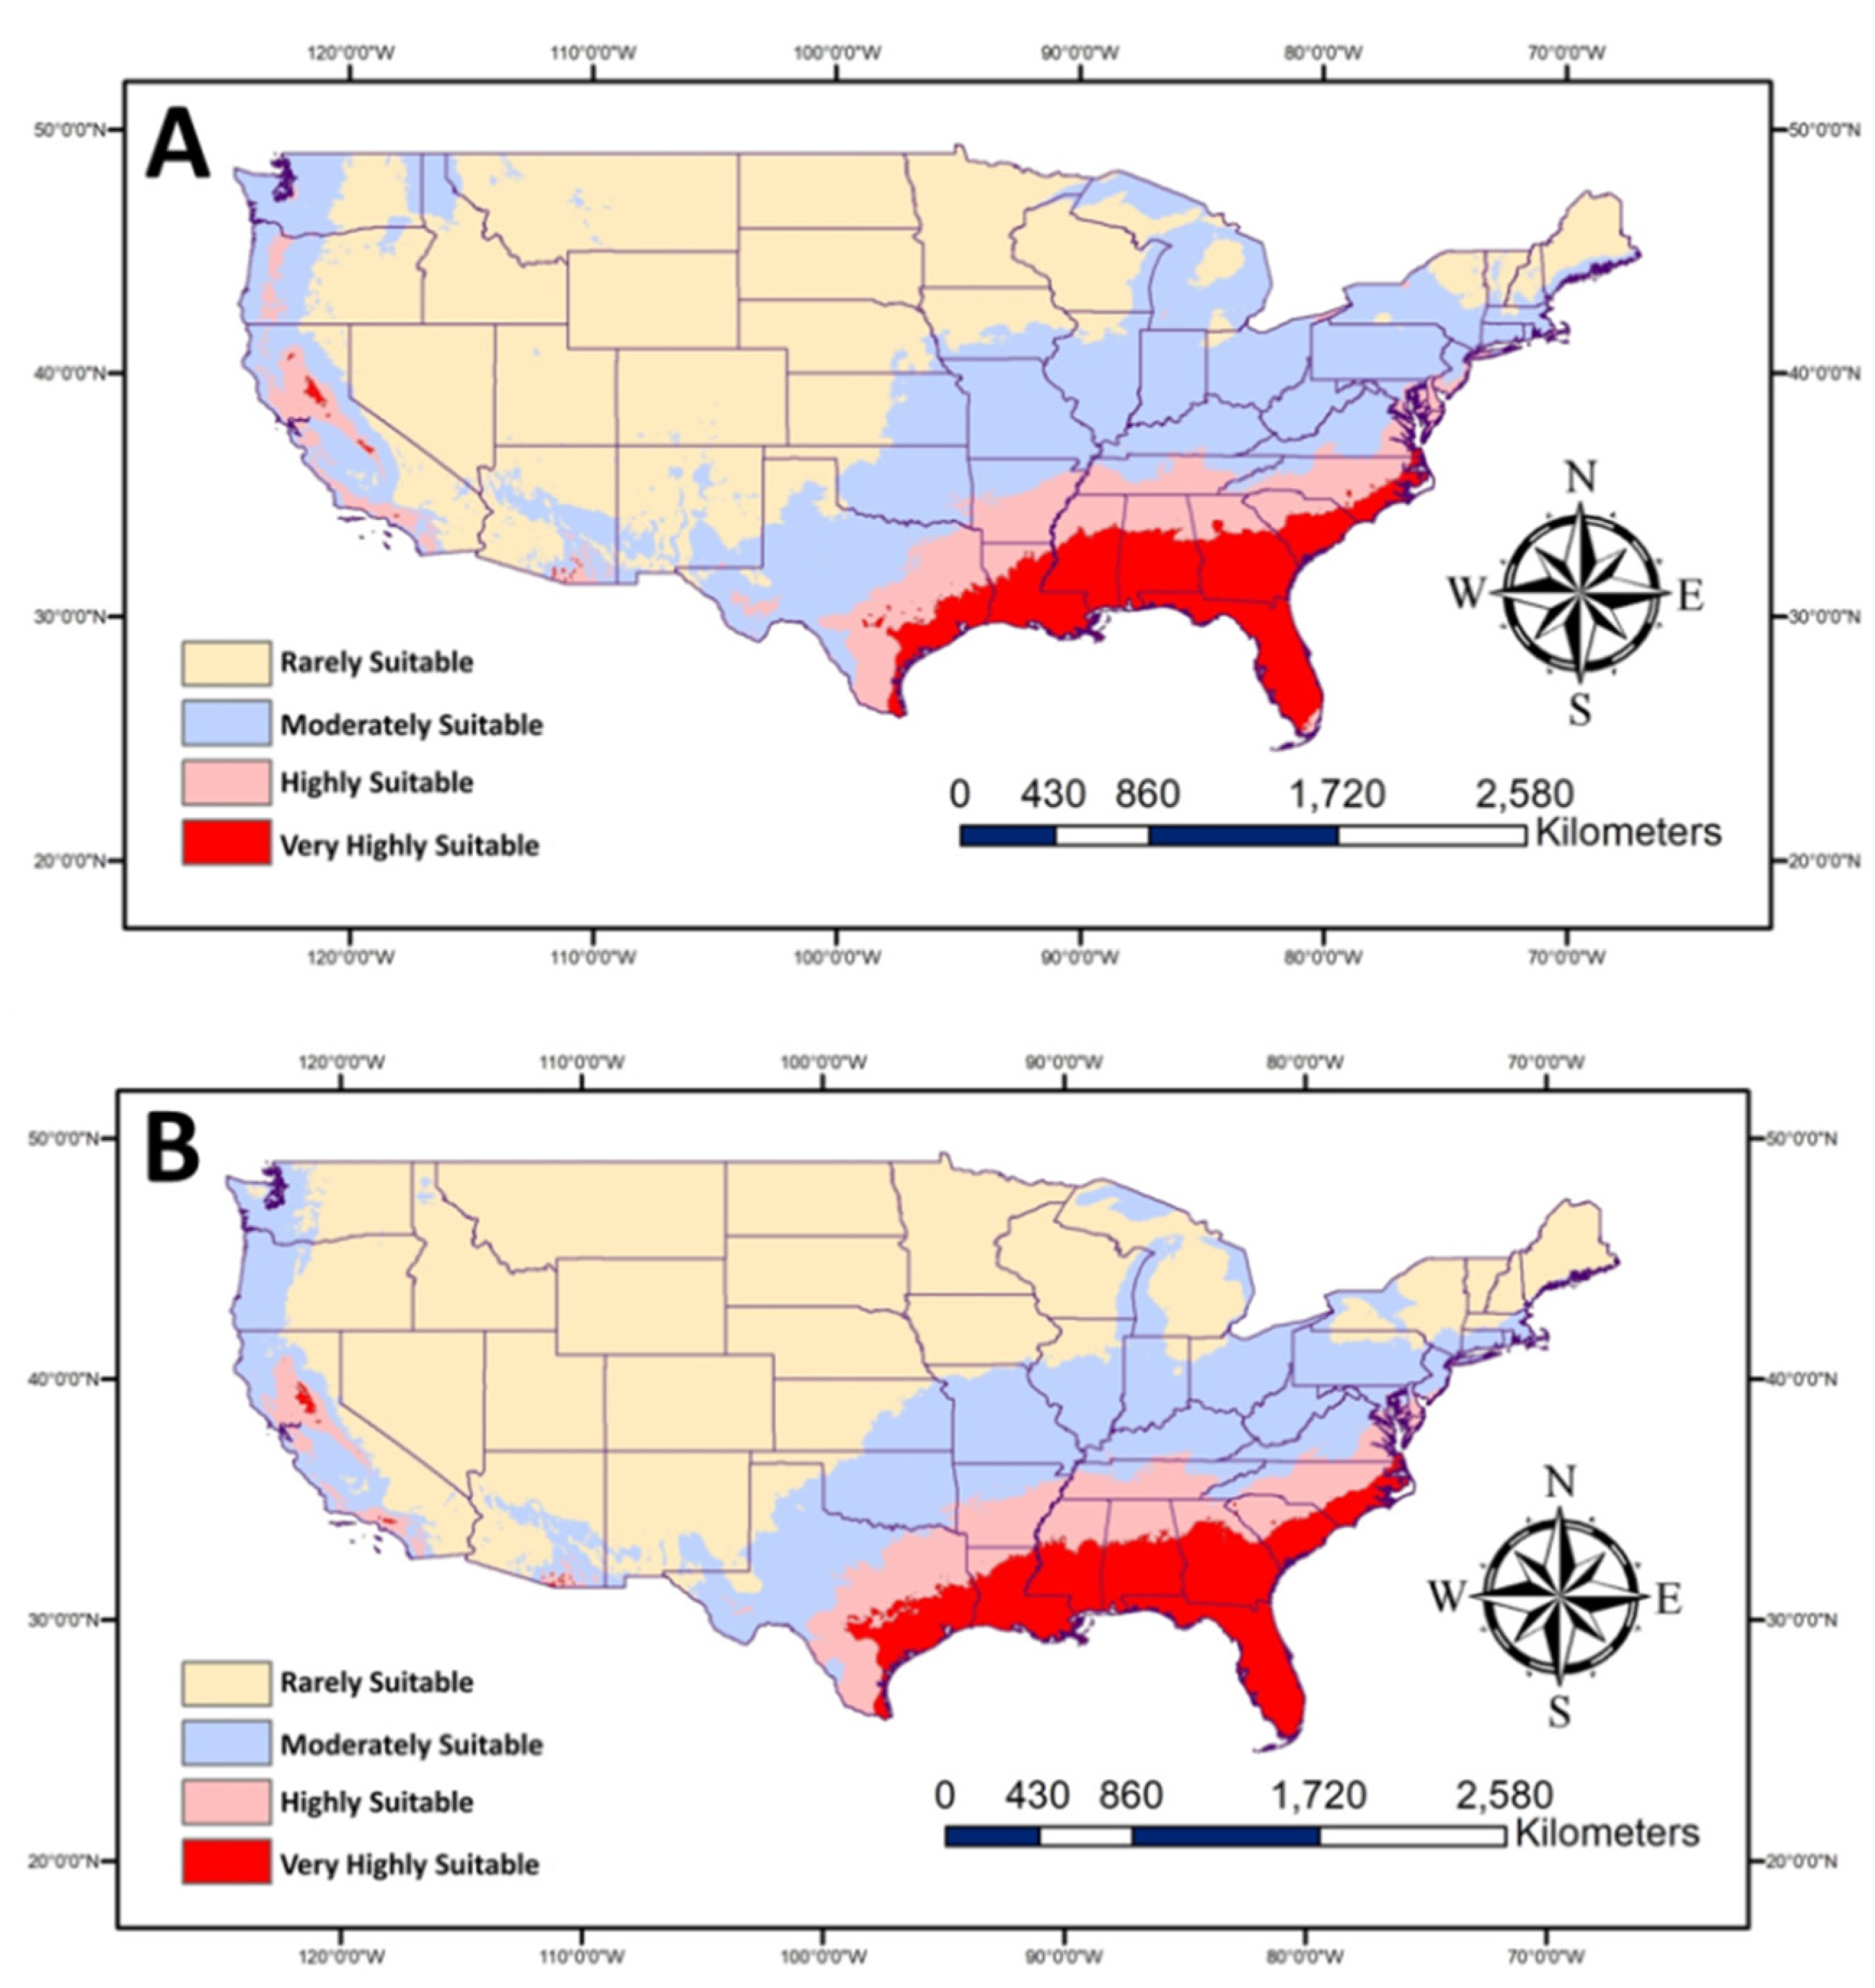
The two future scenarios using two climate models and two levels of SSP (Figure 5) show more areas in the South, especially Eastern states, will be highly suitable for P. nearctica. No huge changes in the high suitable areas are expected than current conditions based on SPP 126 and 585. The noticeable variations between the two levels of SPPs are in the moderately suitable areas. More areas are expected to be moderately suitable in case of SPP 126, which covers parts of the Northern USA, such as Michigan and Idaho, unlike SPP 585.
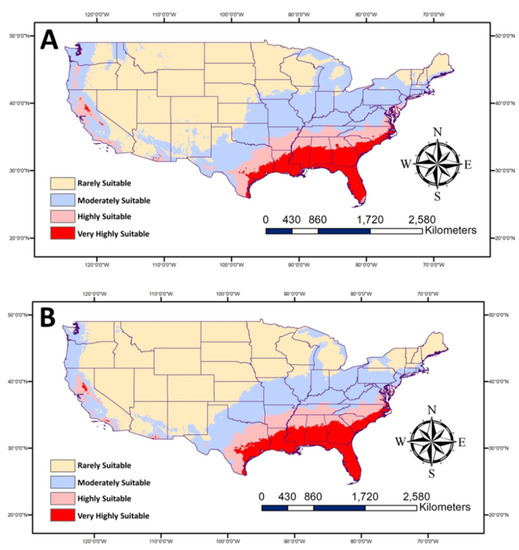
Figure 5.
Map showing future habitat suitable for Plecia nearctica in the USA during 2050. The average of two future models (BCC-CSM2-MR and MRI-ESM2-0) for (A): SSP 126 and (B): SSP 585.
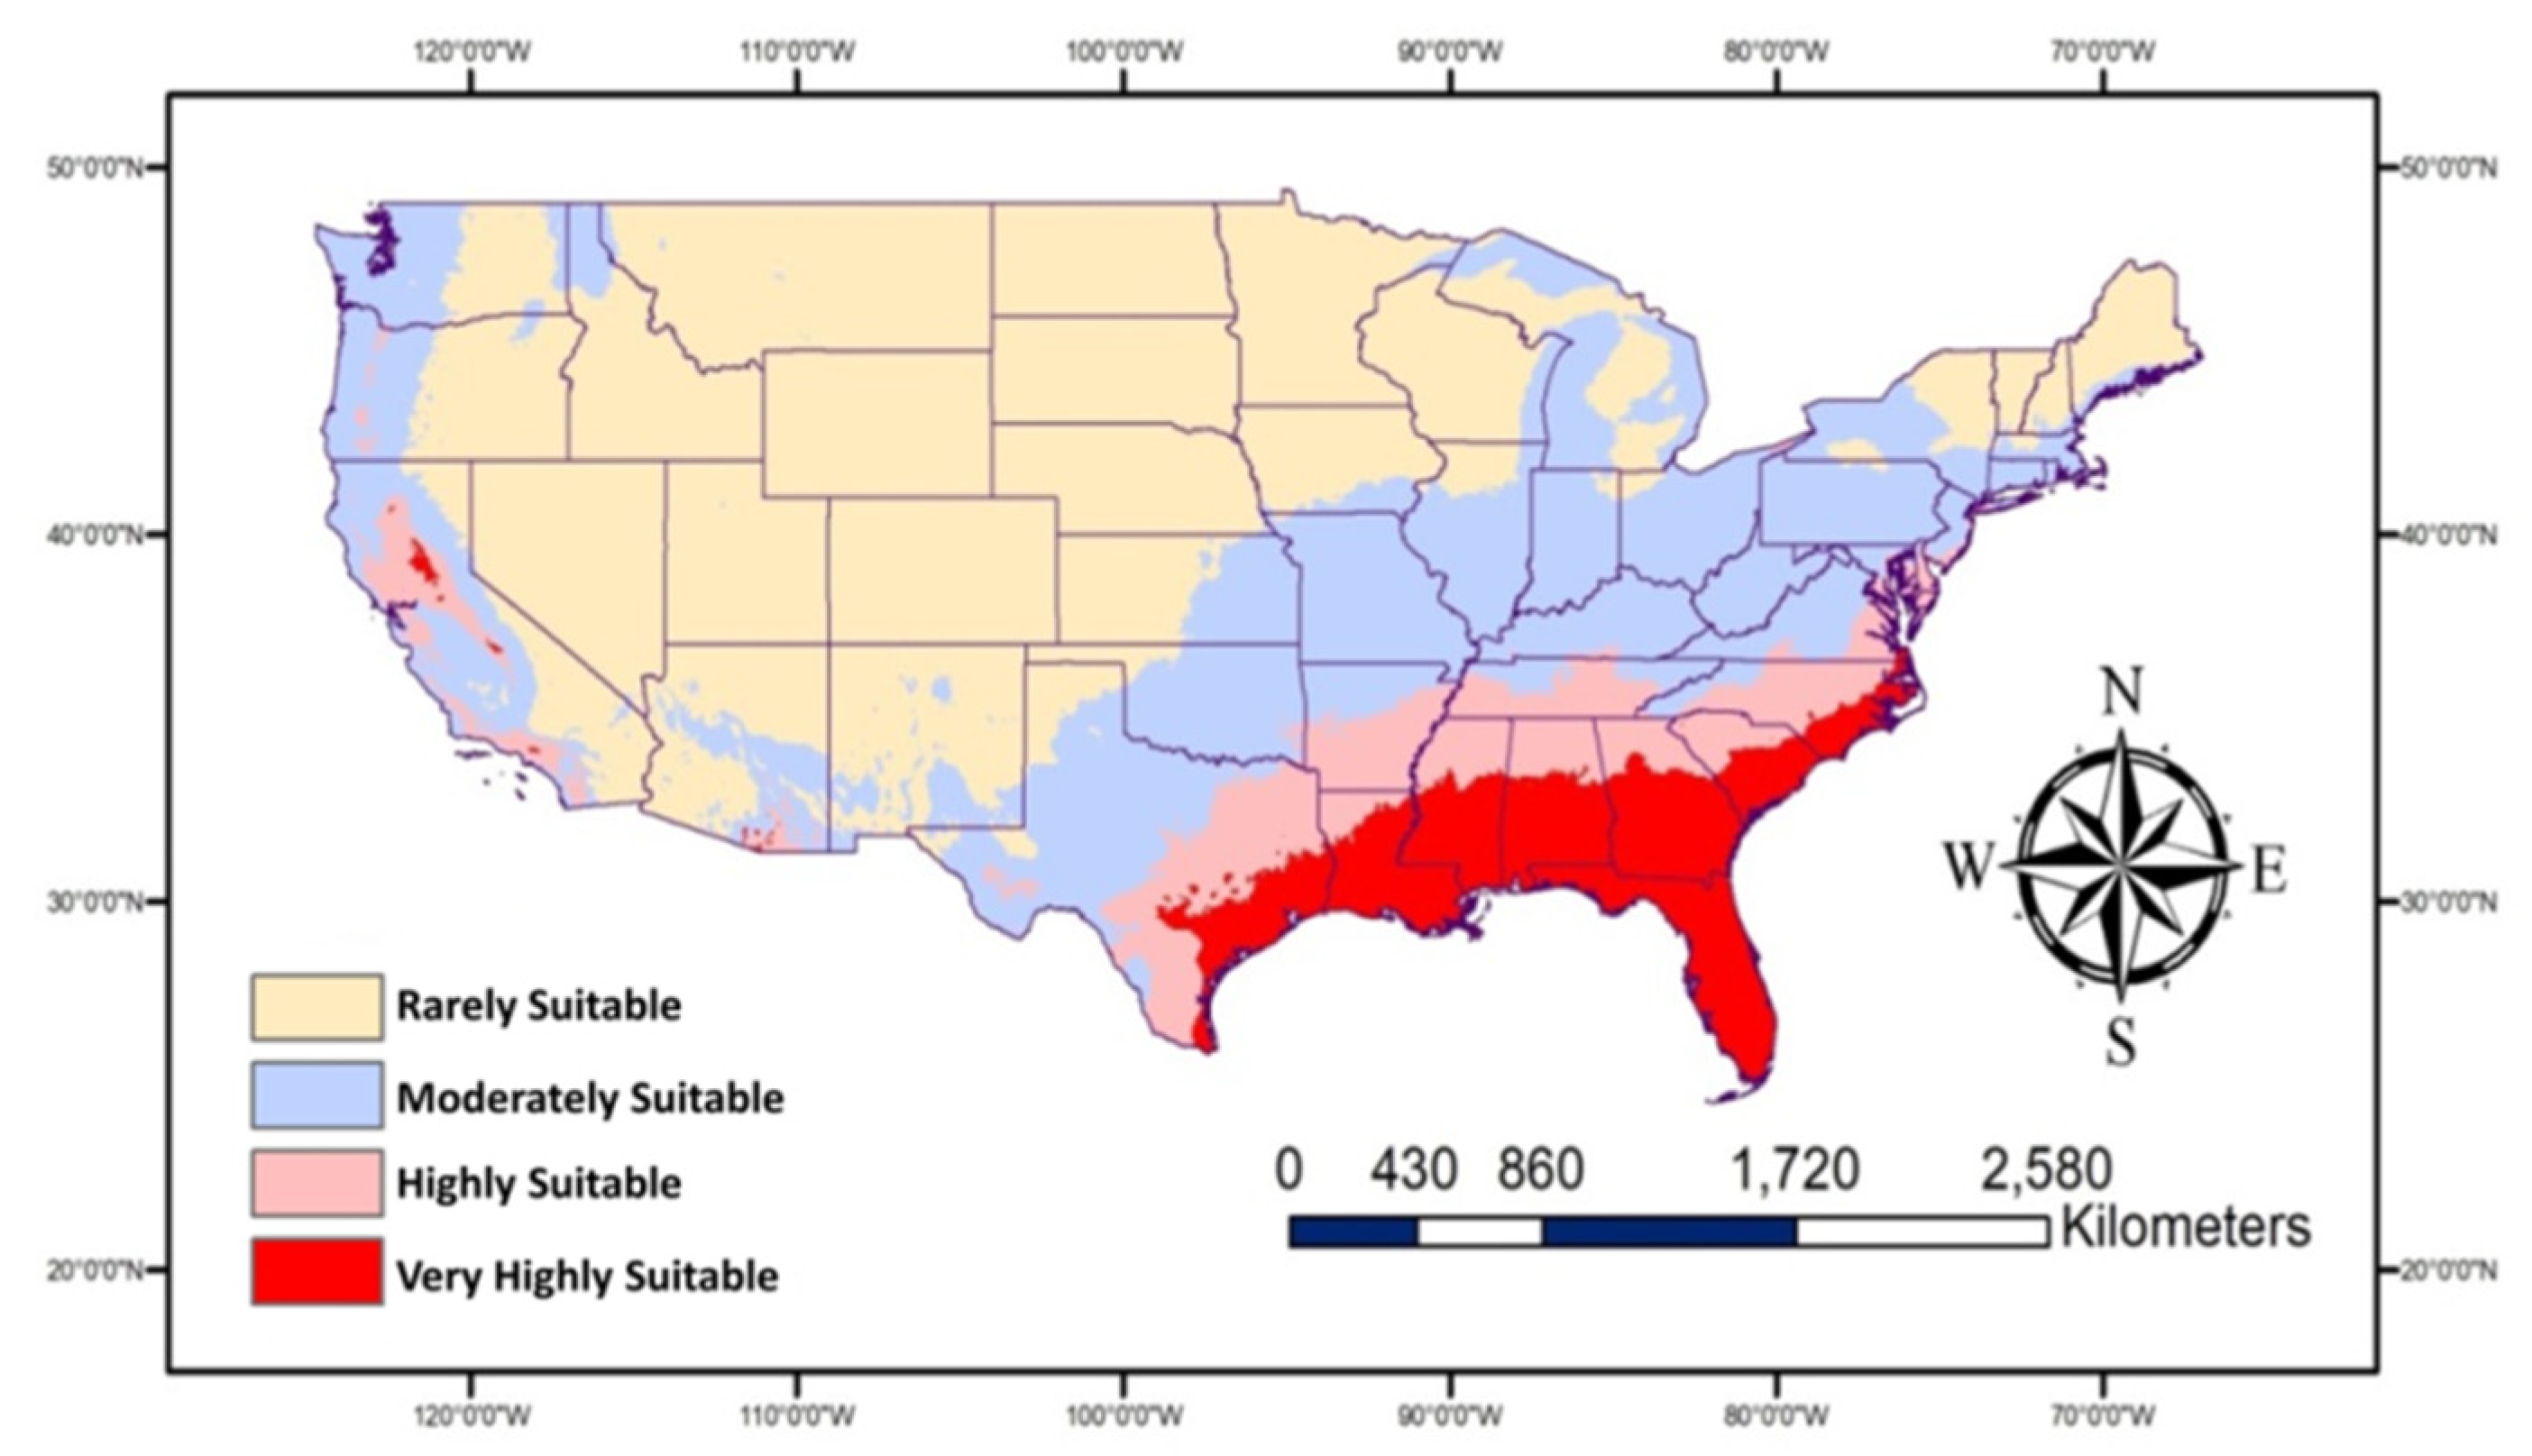
The overall average of the two climate models and the two levels of SPP are presented in one map (Figure 6). This map represents the predicated future habitat suitable for P. nearctica in the USA based on the used models and parameters. According to this map, the very highly suitable and highly suitable areas will cover most parts of the Southeastern states in addition to some parts of California. The moderately suitable areas will contain more areas than current conditions. The Northern and Central USA are expected to remain less suitable for the prevalence of this pest.
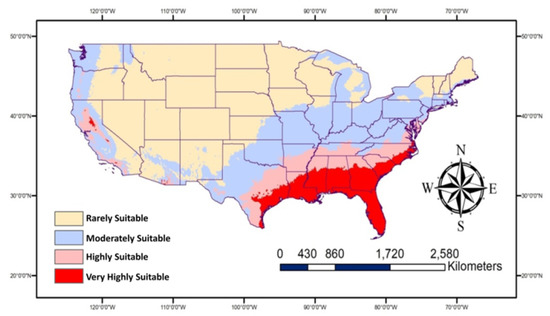
Figure 6.
Map showing future habitat suitable for Plecia nearctica in the USA during 2050. This map represents the overall average for two future models (BCC-CSM2-MR and MRI-ESM2-0) and for two SSP (126 and 585).
3.4. Gain/Loss Due to Climate Change
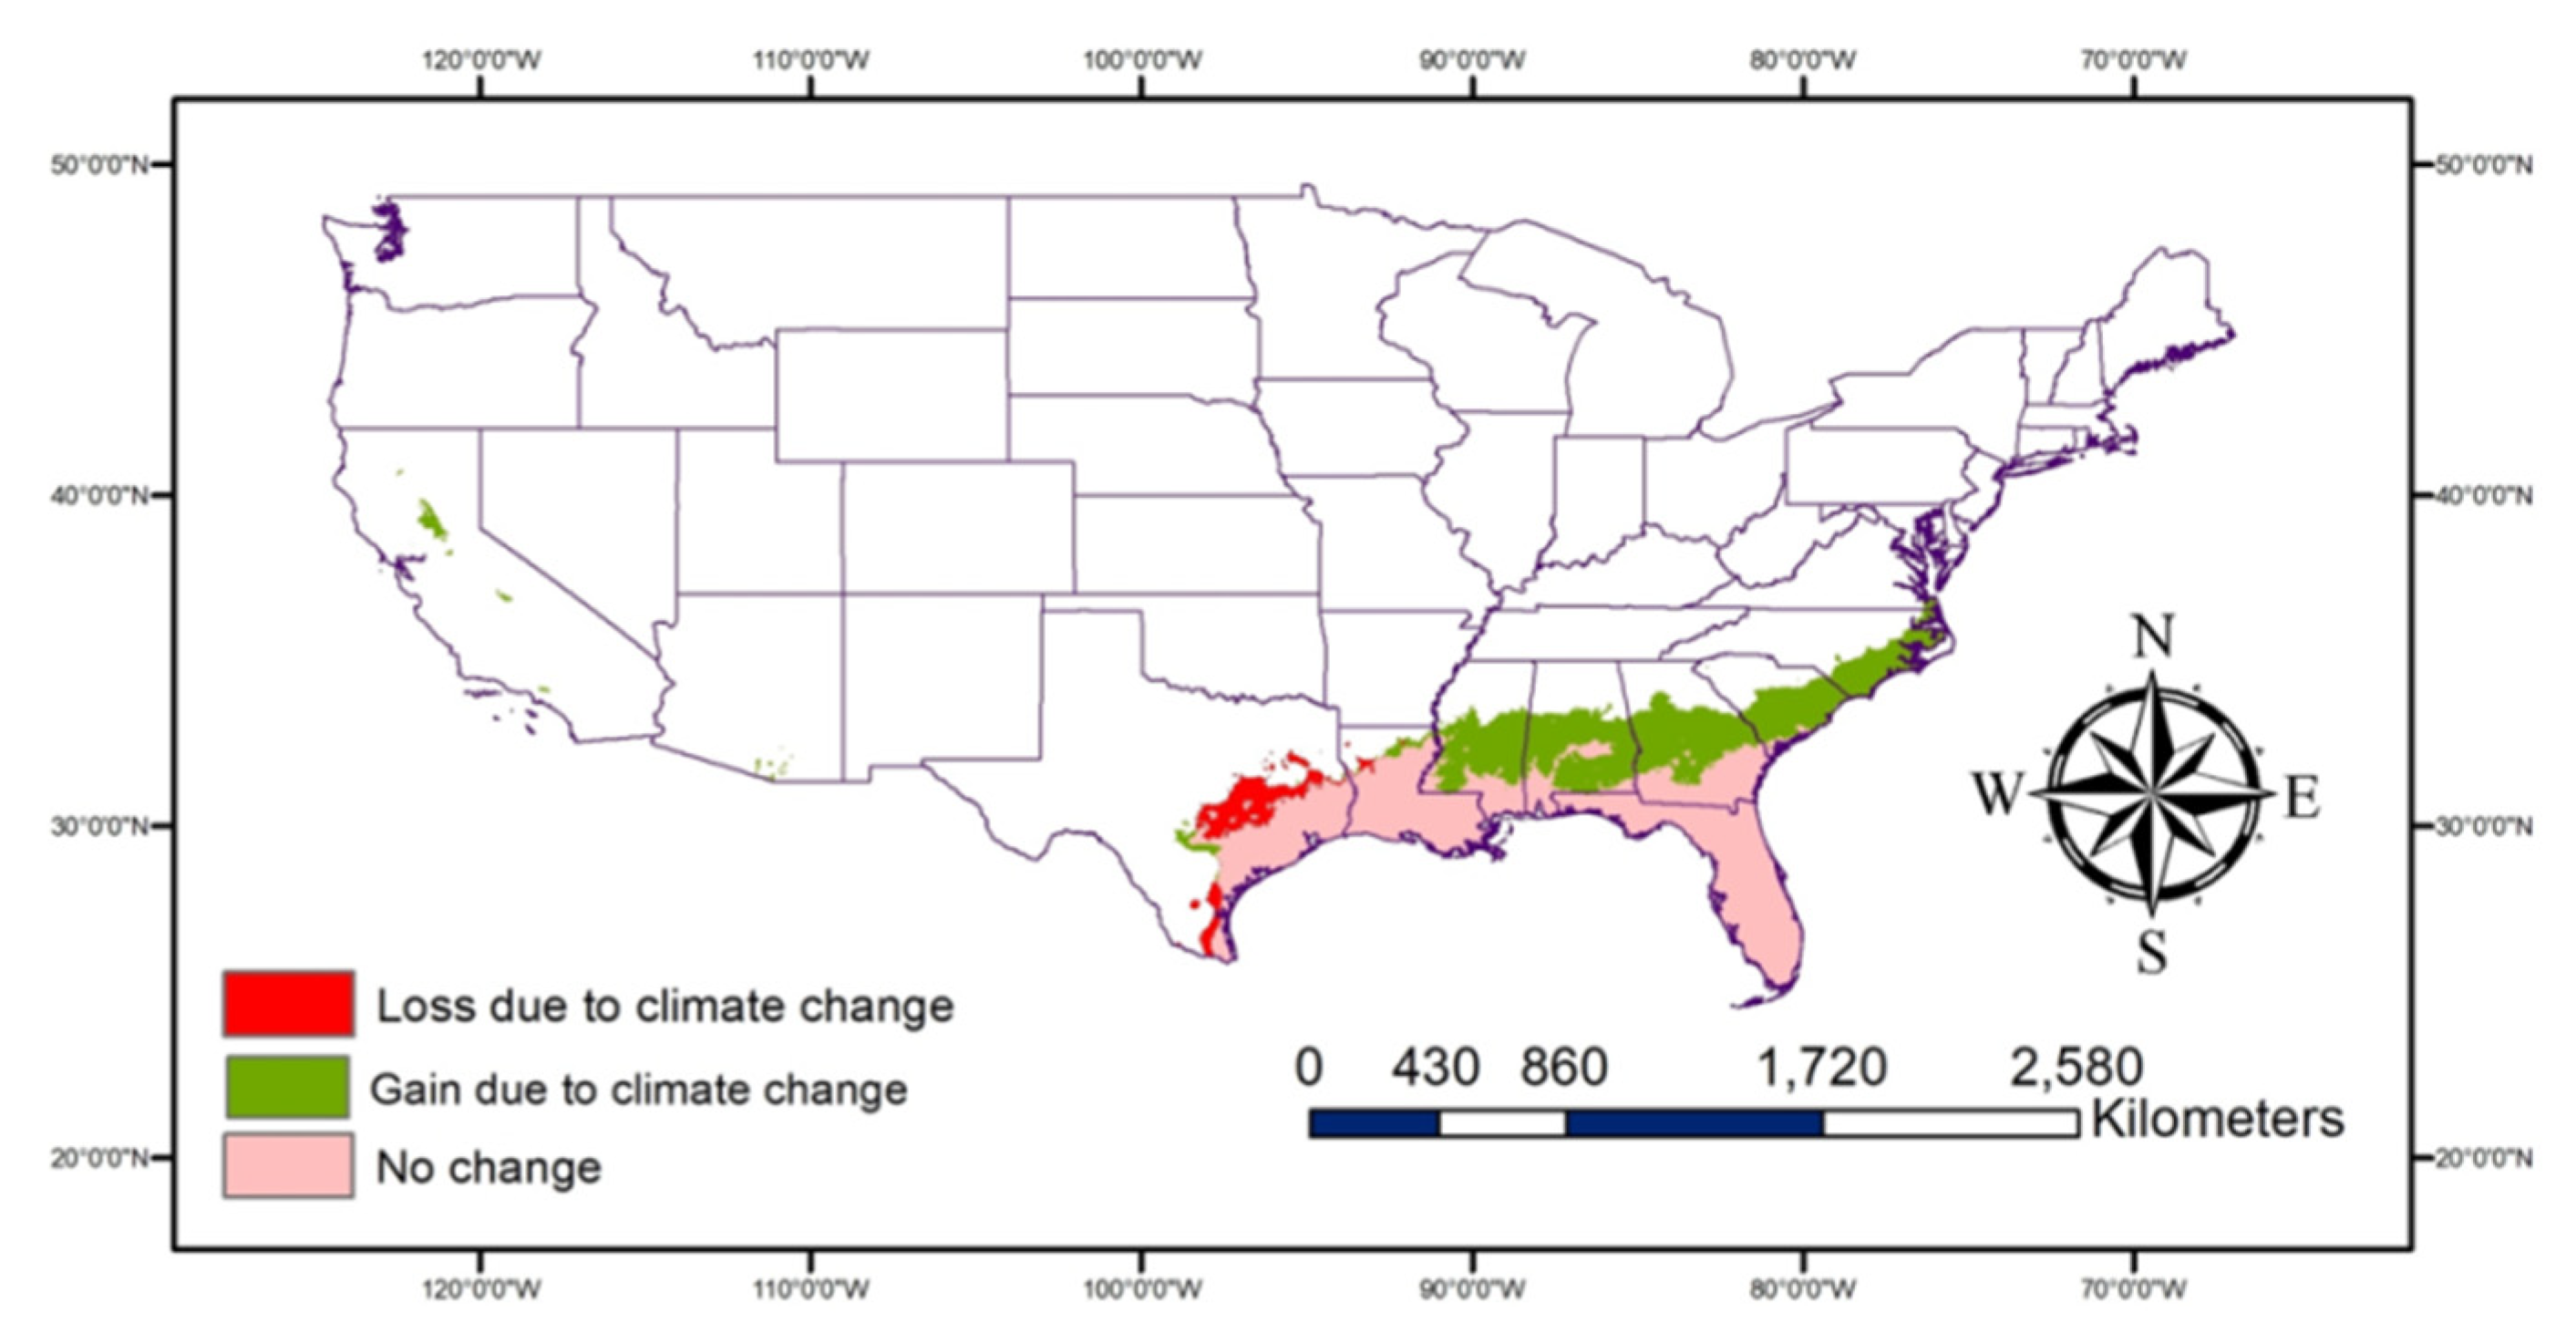
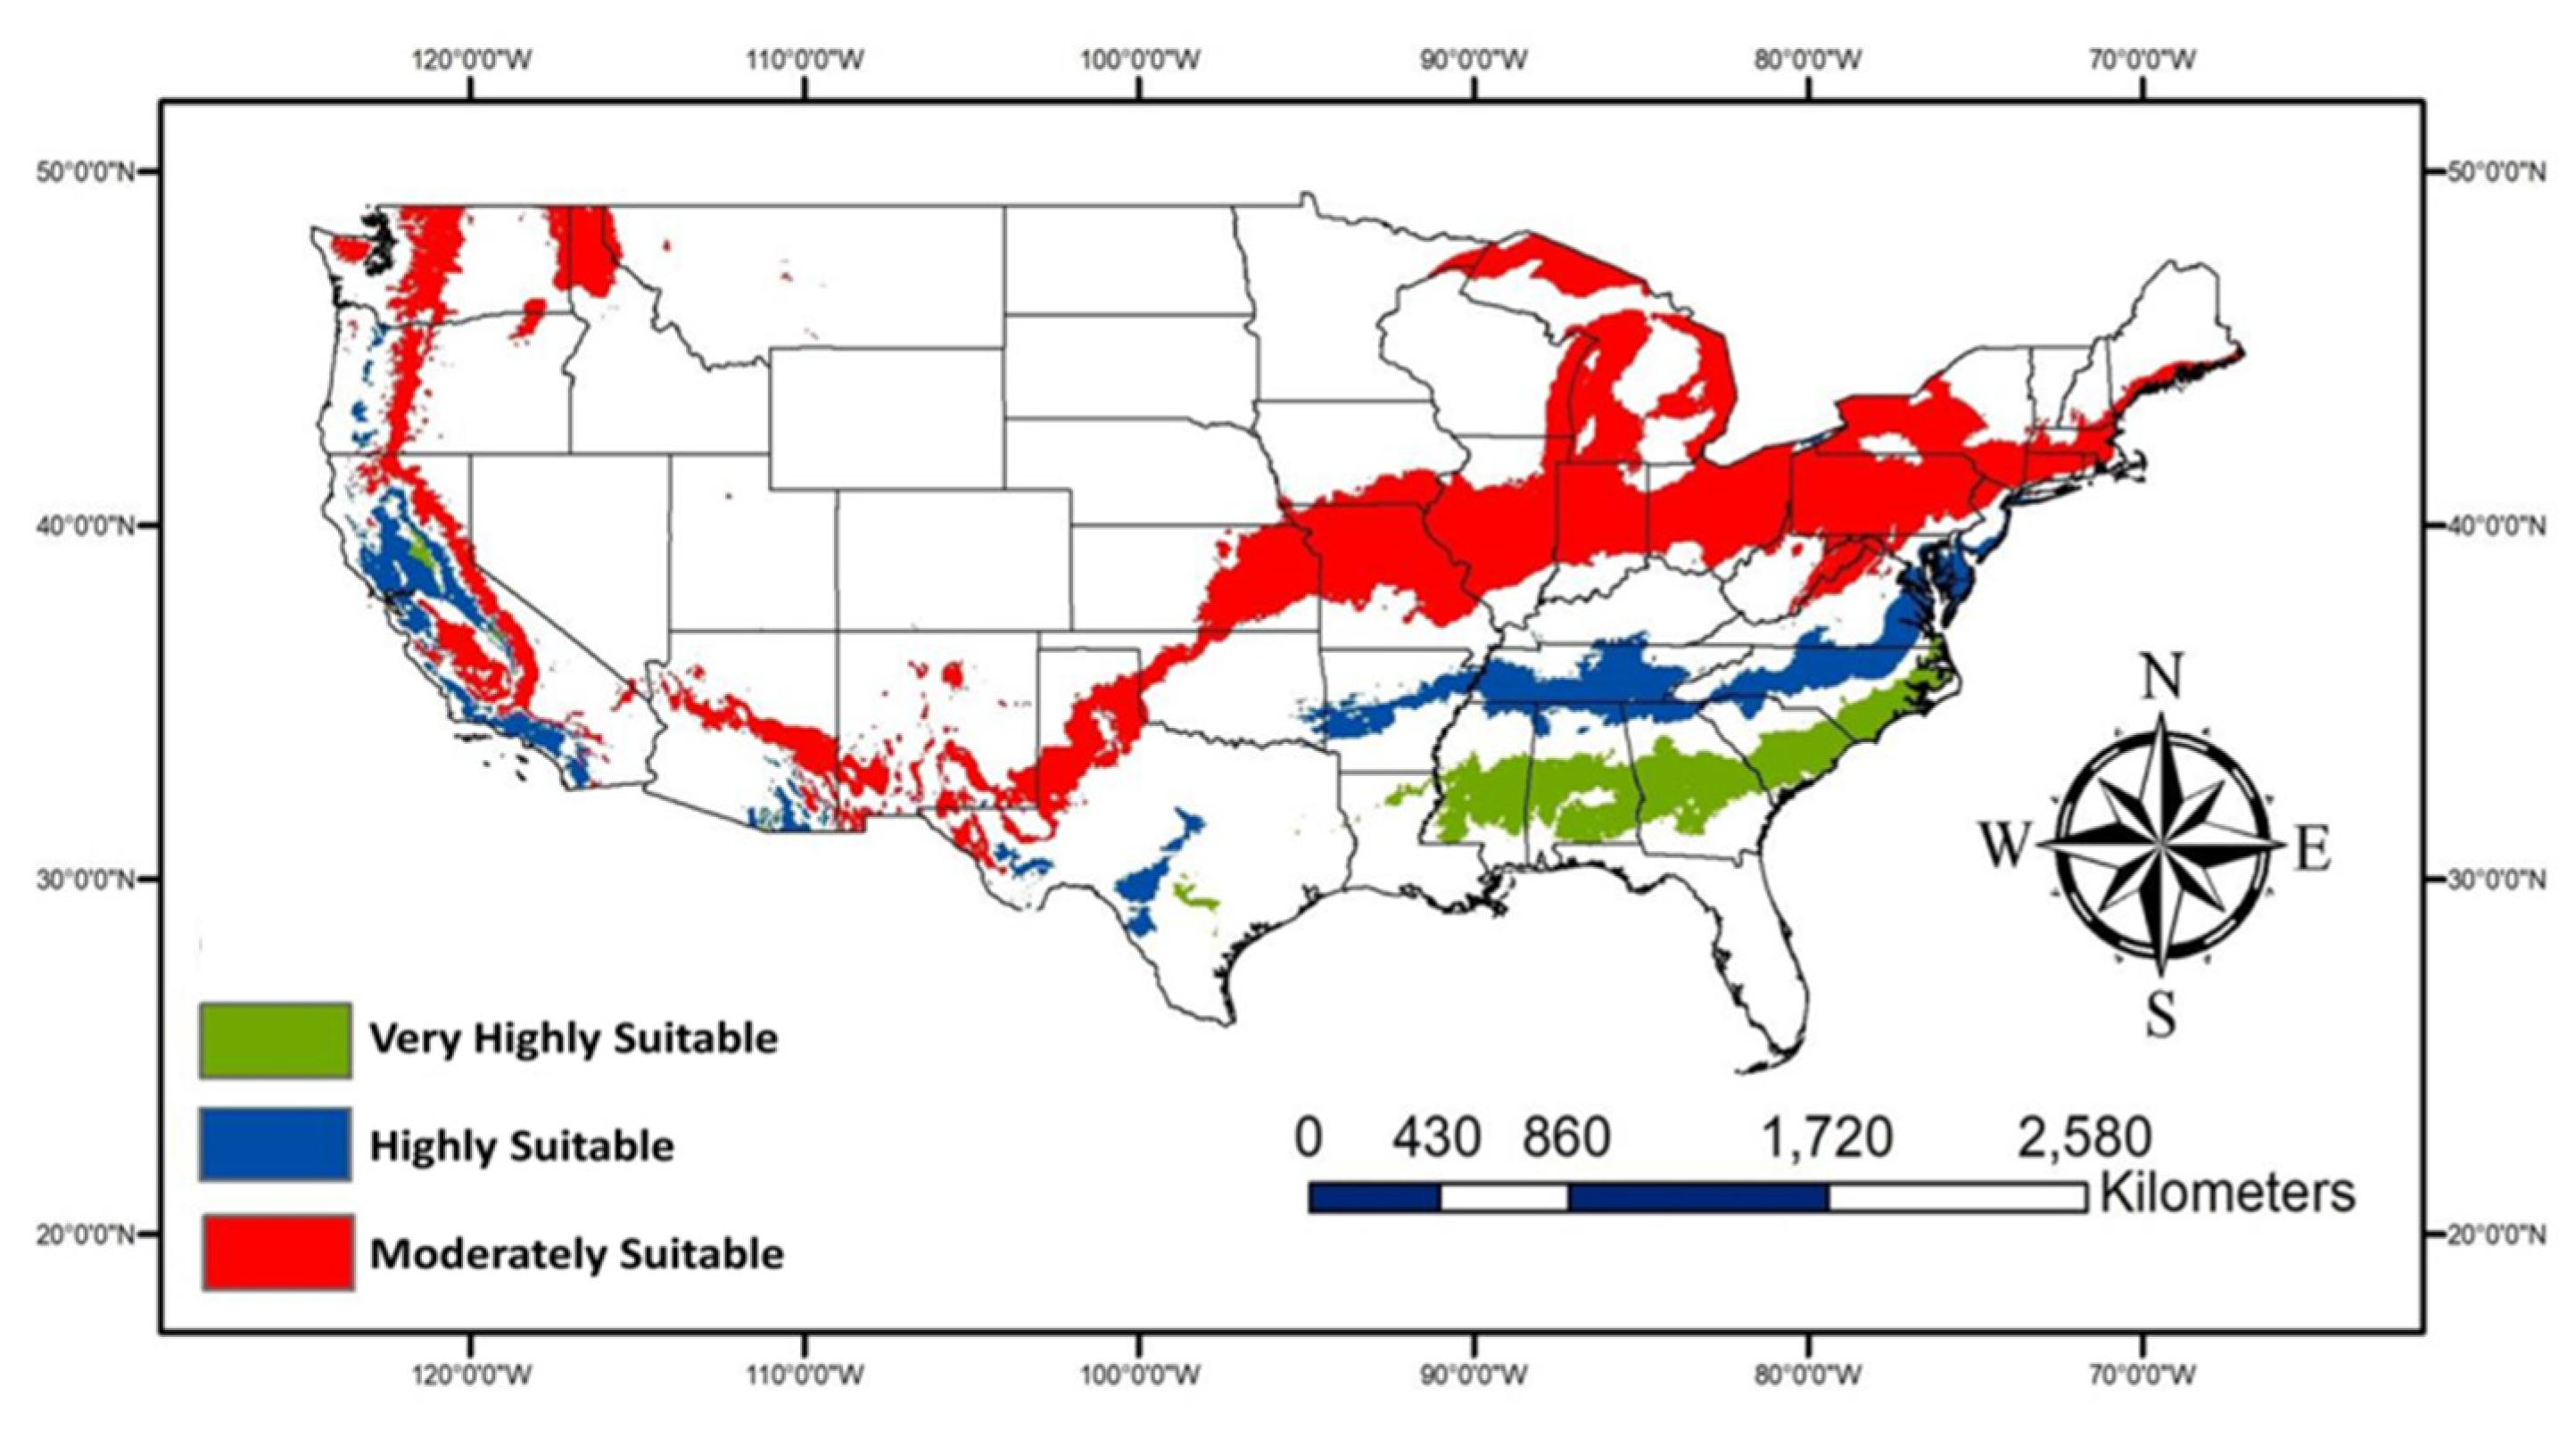
The very highly suitable areas (Figure 7) are expected to increase due to climate change especially, some parts of Georgia, Alabama, Mississippi, Louisiana, Texas, and South and North Carolina in addition to areas of Central California. The potential habitat loss due to climate change would primarily be observed in South and Central Texas. More areas are expected to be moderately suitable for P. nearctica (Figure 8) due to climate change than very highly or highly suitable areas.
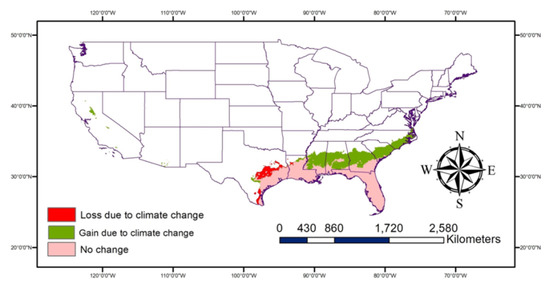
Figure 7.
Map showing changes in the very highly suitable areas due to climate change.
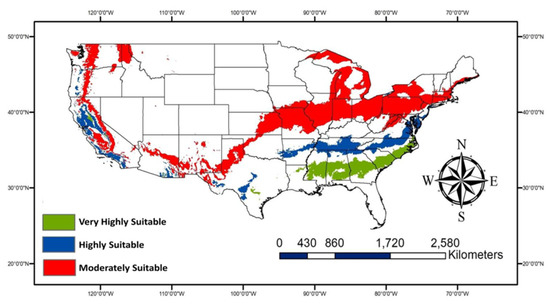
Figure 8.
Map showing gain areas due to climate change for three suitability classes.
4. Discussion
The most important variables for the prevalence of P. nearctica in the study area were temperature related. This was clear from the high contribution of specific variables in the model, especially annual mean temperature, which contributed to the overall fit of the model by 52.4%. The suitable range of temperature across all variables ranged from 10–28 °C. High precipitation is also important for the prevalence of this pest. This explains the presence of this pest primarily in the Southern USA, where high temperature and moderate to high relative humidity levels exist. The model showed high performance with a very good fit based on the values of AUC, which was higher than 0.75 [21,24,25,26,41]. In addition, the TSS value was high which indicates the excellent performance of the model as values equal or above 0.5 are acceptable [25]. In addition, the omission rate was close to the predicted omission, supporting the high performance of the used model.
The map for historic/current distribution is typically fit with the distribution of used occurrence records in the USA. Another map (Figure S11) shows the density of occurrence records (dots per area), which supports the high suitability of the Southeastern areas of USA to this pest, indicating the accuracy of the. The model also predicts the suitability of other areas in addition to the current range, including South Carolina and some parts of North Carolina. Moderate suitable areas are expected to be inhabited by this pest at any time but with less prevalence than the other areas (those that are highly and very highly suitable). Such expectation is in line with previous studies on other insects, such as small hive beetles [26], large hive beetles [23], the facultative parasitoid Megaselia scalaris [20,24], and Asian hornets [19]. It seems that warm and humid conditions found in coastal subtropical areas are more suitable for this pest than other areas.
Two scenarios presented that look forward support the potential spread of P. nearctica to new areas and an expansion in geographic range. However, the Central USA is not expected to have high invasions/populations of this pest due to the less suitable environmental conditions. This model predicts a limited expansion of the very high and highly suitable areas for this pest, while the moderate suitable areas will be expanding the most. The Gulf-South and Southeastern coastal regions are expected to be the regions most infested with this pest. The two SSPs used in the model were similar in their results except in regard to the moderately suitable areas.
Lovebugs are well known as a public nuisance due to acidic body chemistry and their enormous numbers near highways in particular [12,18]. Studies on this insect are surprisingly limited but include works on their biology [18], flight behavior [42], reproductive biology [43], sexual selection [44,45], and attraction to floral lures [14]. Its larvae feed on decaying vegetation [18] and can be associated with turfgrass [46]. Mature larvae pupate in the soil for between 7 and 9 days, emerging into adults, wherein the males then compete for females [43]. Adult lovebugs are present in large numbers between May and September [17,47], when pollinators are also frequently active. If present, any potential negative effects on foraging behavior of bees would be anticipated during this period. Due to the tendency of lovebugs to occupy flowers for long periods of time and prevent other pollinators from collecting nectar or pollen [18], there may be a resulting shortage of food resources for pollinators, particularly in areas where there are limited floral resources. However, there is no existing data to measure the damage cause by range expansion of P. nearctica, or widescale complaints from beekeepers other than anecdotal reports. It is possible that this potentially negative interaction occurs regularly and remains undocumented in the literature. Future work should examine potential interactions between honey bees and this pest in the Gulf-South and Southeastern USA, regions known to have high populations of lovebugs. In areas where P. nearctica may become problematic for pollinators, there are potential control options available, including the use of natural enemies [48] and pathogenic fungi (Tolypocladium cylindrosporum, Metarhizium anisopliae, Beauveria bassiana) [49]. Additionally, mechanical traps have been developed to be used to control their population [50]. An ecologically sensitive and bee-friendly integrated pest management plan for control would help in reducing populations of this pest with minimal impact on pollinators.
5. Conclusions
In this modeling study, the potential spread of P. nearctica in the USA at two time points utilizing two climate change scenarios was explored. The model performed well considering the environmental variables and evaluation parameters. The results for habitat suitability for current conditions fit the existing distribution of P. nearctica quite well. On the other hand, results for future distribution showed a limited range expansion and spread of P. nearctica toward Central and Northern regions of the USA. Generally, the Southern USA is expected to be the hot spot for P. nearctica. In the future, more studies should be pursued on the inter-species interactions between P. nearctica and insect pollinators, including honey bees. In addition, these interactions between P. nearctica and bees should be explored to determine whether they are synergistic or antagonistic.
Supplementary Materials
The following supporting information can be downloaded at: https://www.mdpi.com/article/10.3390/d14080690/s1, Supplementary Informations S1–S2. Supplementary Figures S1 to S11). Figure S1. The jackknife test of regularized training gain considering 19 environmental variables, Figure S2. Average omission and predicated area for Plecia nearctica, Figure S3. The jackknife of regularized gain for Plecia nearctica. 1: Annual mean temperature, 4: Temperature seasonality, 6: Minimum temperature of coldest month, 7: Temperature annual range, 10: Mean temperature of warmest quarter, and 13: Precipitation of wettest month, Figure S4. The jackknife test of gain for Plecia nearctica. 1: Annual mean temperature, 4: Temperature seasonality, 6: Minimum temperature of coldest month, 7: Temperature annual range, 10: Mean temperature of warmest quarter, and 13: Precipitation of wettest month, Figure S5. Response curve for Annual Mean Temperature (bio1), Figure S6. Response curve for Temperature Seasonality (bio4) (=standard deviation × 100), Figure S7. Response curve for Min Temperature of Coldest Month (bio6), Figure S8. Response curve for Temperature Annual Range (bio7), Figure S9. Response curve for Mean Temperature of Warmest Quarter (bio10), Figure S10. Response curve for Precipitation of Wettest Month (bio13), and Figure S11. Density of the occurrence records (point density) in the study area. Point density reflects the number of points per area.
Author Contributions
Conceptualization, H.F.A.-S., K.A.P. and E.A.; methodology, H.F.A.-S.; formal analysis, H.F.A.-S.; data curation, H.F.A.-S.; writing—original draft preparation, H.F.A.-S., K.A.P. and E.A.; writing—review and editing, H.F.A.-S., K.A.P. and E.A.; funding acquisition, K.A.P. and E.A. All authors have read and agreed to the published version of the manuscript.
Funding
This project was completed while H.F.A.-S. and E.A. were supported by the USDA ARS through Cooperative Agreement 58-6066-9-045.
Institutional Review Board Statement
Not applicable.
Data Availability Statement
All data are included in text or Supplementary Materials.
Acknowledgments
Thanks are given to the world climate research program and the climate modeling groups for making environmental variables and ecological models available for research purposes. Additionally, thanks to the multiple funding agencies who support CMIP6 and the Earth System Grid Federation (ESGF). The authors would like to thank Jeffrey Gore for his unlimited support to complete this project. This research was partially supported by the U.S. Department of Agriculture, Agricultural Research Service (USDA ARS). Mention of trade names or commercial products in this publication is solely for the purpose of providing specific information and does not imply recommendation or endorsement by the USDA. USDA is an equal opportunity provider and employer.
Conflicts of Interest
The authors declare no conflict of interest.
References
- Hung, K.-L.J.; Kingston, J.M.; Albrecht, M.; Holway, D.A.; Kohn, J.R. The worldwide importance of honey bees as pollinators in natural habitats. Proc. R. Soc. B Biol. Sci. 2018, 285, 20172140. [Google Scholar] [CrossRef] [PubMed] [Green Version]
- Winfree, R.; Gross, B.J.; Kremen, C. Valuing pollination services to agriculture. Ecol. Econ. 2011, 71, 80–88. [Google Scholar] [CrossRef]
- Brittain, C.; Williams, N.; Kremen, C.; Klein, A.-M. Synergistic effects of non-Apis bees and honey bees for pollination services. Proc. R. Soc. B Biol. Sci. 2013, 280, 20122767. [Google Scholar] [CrossRef] [PubMed] [Green Version]
- Breeze, T.D.; Bailey, A.P.; Balcombe, K.G.; Potts, S.G. Pollination services in the UK: How important are honeybees? Agric. Ecosyst. Environ. 2011, 142, 137–143. [Google Scholar] [CrossRef] [Green Version]
- Hanley, N.; Breeze, T.D.; Ellis, C.; Goulson, D. Measuring the economic value of pollination services: Principles, evidence and knowledge gaps. Ecosyst. Serv. 2015, 14, 124–132. [Google Scholar] [CrossRef] [Green Version]
- Carpenter, M.H.; Harpur, B.A. Genetic past, present, and future of the honey bee (Apis mellifera) in the United States of America. Apidologie 2021, 52, 63–79. [Google Scholar] [CrossRef]
- Bauer, D.M.; Sue Wing, I. The macroeconomic cost of catastrophic pollinator declines. Ecol. Econ. 2016, 126, 1–13. [Google Scholar] [CrossRef]
- Calderone, N.W. Insect pollinated crops, insect pollinators and US agriculture: Trend analysis of aggregate aata for the period 1992–2009. PLoS ONE 2012, 7, e37235. [Google Scholar] [CrossRef] [Green Version]
- Greenleaf, S.S.; Kremen, C. Wild bees enhance honey bees’ pollination of hybrid sunflower. Proc. Natl. Acad. Sci. USA 2006, 103, 13890–13895. [Google Scholar] [CrossRef] [Green Version]
- Abou-Shaara, H.F. The foraging behaviour of honey bees, Apis mellifera: A review. Vet. Med. 2014, 59, 1–10. [Google Scholar] [CrossRef] [Green Version]
- Kirk, W.D.J.; Ali, M.; Breadmore, K.N. The effects of pollen beetles on the foraging behaviour of honey bees. J. Apic. Res. 1995, 34, 15–22. [Google Scholar] [CrossRef]
- Leppla, N.C. Living With Lovebugs; University of Florida IFAS Extension Publication #ENY-840; Department of Entomology and Nematology: Gainesville, FL, USA, 2018; pp. 1–7. Available online: https://edis.ifas.ufl.edu/publication/IN694 (accessed on 10 December 2018).
- Tumlison, C.R.; Robison, H.W. New records and notes on the natural history of selected invertebrates from southern Arkansas. J. Ark. Acad. Sci. 2010, 64, 141–144. [Google Scholar]
- Arthurs, S.P.; Tofangsazi, N.; Meagher, R.L.; Cherry, R. Attraction of Plecia nearctica (Diptera: Bibionidae) to floral lures containing phenylacetaldehyde. Fla. Entomol. 2012, 95, 199–201. [Google Scholar] [CrossRef]
- Cherry, R. Attraction of the lovebug, Plecia nearctica (Diptera: Bibionidae) to anethole. Fla. Entomol. 1998, 81, 559–562. [Google Scholar] [CrossRef]
- Arthurs, S.P.; Tofangsazi, N.; Cherry, R. Attraction of lovebugs (Diptera: Bibionidae) to visual and olfactory stimuli. J. Entomol. Sci. 2016, 48, 291–298. [Google Scholar] [CrossRef]
- Cherry, R.; Raid, R. Seasonal flight of Plecia nearctica (Diptera: Bibionidae) in Southern Florida. Fla. Entomol. 2000, 83, 94–96. [Google Scholar] [CrossRef]
- Hetrick, L.A. Biology of the “Love-Bug”, Plecia Nearctica (Diptera: Bibionidae). Fla. Entomol. 1970, 53, 23–26. [Google Scholar] [CrossRef]
- Abou-Shaara, H.F.; Al-Khalaf, A.A. Using maximum entropy algorithm to analyze current and future distribution of the Asian hornet, Vespa velutina, in Europe and North Africa under climate change conditions. J. Entomol. Res. Soc. 2022, 24, 07–21. [Google Scholar] [CrossRef]
- Alkhalaf, A.A. Utilizing ecological modeling to follow the potential spread of honey bee pest (Megaselia scalaris) from nearby countries towards Saudi Arabia under climate change conditions. Diversity 2022, 14, 261. [Google Scholar] [CrossRef]
- Mulieri, P.R.; Patitucci, L.D. Using ecological niche models to describe the geographical distribution of the myiasis-causing Cochliomyia hominivorax (Diptera: Calliphoridae) in southern South America. Parasitol. Res. 2019, 118, 1077–1086. [Google Scholar] [CrossRef]
- Villemant, C.; Barbet-Massin, M.; Perrard, A.; Muller, F.; Gargominy, O.; Jiguet, F.; Rome, Q. Predicting the invasion risk by the alien bee-hawking Yellow-legged hornet Vespa velutina nigrithorax across Europe and other continents with niche models. Biol. Conserv. 2011, 144, 2142–2150. [Google Scholar] [CrossRef]
- Abou-Shaara, H.; Alashaal, S.A.; Hosni, E.M.; Nasser, M.G.; Ansari, M.J.; Alharbi, S.A. Modeling the invasion of the Large Hive Beetle, Oplostomus fuligineus, into North Africa and South Europe under a changing climate. Insects 2021, 12, 275. [Google Scholar] [CrossRef] [PubMed]
- Abou-Shaara, H.F.; Darwish, A.A.E. Expected prevalence of the facultative parasitoid Megaselia scalaris of honey bees in Africa and the Mediterranean region under climate change conditions. Int. J. Trop. Insect Sci. 2021, 41, 3137–3145. [Google Scholar] [CrossRef]
- Hosni, E.M.; Nasser, M.G.; Al-Ashaal, S.A.; Rady, M.H.; Kenawy, M.A. Modeling current and future global distribution of Chrysomya bezziana under changing climate. Sci. Rep. 2020, 10, 4947. [Google Scholar] [CrossRef]
- Jamal, Z.A.; Abou-Shaara, H.F.; Qamer, S.; Alhumaidi Alotaibi, M.; Ali Khan, K.; Fiaz Khan, M.; Amjad Bashir, M.; Hannan, A.; Al-Kahtani, S.N.; Taha, E.-K.A.; et al. Future expansion of small hive beetles, Aethina tumida, towards North Africa and South Europe based on temperature factors using maximum entropy algorithm. J. King Saud. Univ. Sci. 2021, 33, 101242. [Google Scholar] [CrossRef]
- Guisan, A.; Thuiller, W. Predicting species distribution: Offering more than simple habitat models. Ecol. Lett. 2005, 8, 993–1009. [Google Scholar] [CrossRef] [PubMed]
- Phillips, S.J.; Anderson, R.P.; Schapire, R.E. Maximum entropy modeling of species geographic distributions. Ecol. Model. 2006, 190, 231–259. [Google Scholar] [CrossRef] [Green Version]
- Wei, B.; Wang, R.; Hou, K.; Wang, X.; Wu, W. Predicting the current and future cultivation regions of Carthamus tinctorius L. using MaxEnt model under climate change in China. Glob. Ecol. Conserv. 2018, 16, e00477. [Google Scholar] [CrossRef]
- Chen, W.; Wei, J.; Zhu, K.; Lu, Y.; Cai, Y.; Wu, Q.; Huang, Z.; Wang, Y. Predicting potential distribution of Emmenopterys henryi in Southwest China based on the Maxent model and influencing factors. Trop. Ecol. 2022, 1–12. [Google Scholar] [CrossRef]
- Brito, J.C.; Acosta, A.L.; Álvares, F.; Cuzin, F. Biogeography and conservation of taxa from remote regions: An application of ecological-niche based models and GIS to North-African canids. Biol. Conserv. 2009, 142, 3020–3029. [Google Scholar] [CrossRef]
- Kalboussi, M.; Achour, H. Modelling the spatial distribution of snake species in northwestern Tunisia using maximum entropy (Maxent) and Geographic Information System (GIS). J. For. Res. 2018, 29, 233–245. [Google Scholar] [CrossRef]
- Leanza, P.M.; Valenti, F.; D’Urso, P.R.; Arcidiacono, C. A combined MaxEnt and GIS-based methodology to estimate cactus pear biomass distribution: Application to an area of southern Italy. Biofuels Bioprod. Biorefining 2022, 16, 54–67. [Google Scholar] [CrossRef]
- Le Conte, Y.; Navajas, M. Climate change: Impact on honey bee populations and diseases. Rev. Sci. Tech. 2008, 27, 499–510. [Google Scholar]
- Neumann, P.; Elzen, P.J. The biology of the small hive beetle (Aethina tumida, Coleoptera: Nitidulidae): Gaps in our knowledge of an invasive species. Apidologie 2004, 35, 229–247. [Google Scholar] [CrossRef] [Green Version]
- Neumann, P.; Pettis, J.S.; Schäfer, M.O. Quo vadis Aethina tumida? Biology and control of small hive beetles. Apidologie 2016, 47, 427–466. [Google Scholar] [CrossRef] [Green Version]
- Cornelissen, B.; Neumann, P.; Schweiger, O. Global warming promotes biological invasion of a honey bee pest. Global Change Biol. 2019, 25, 3642–3655. [Google Scholar] [CrossRef] [Green Version]
- Fick, S.E.; Hijmans, R.J. WorldClim 2: New 1-km spatial resolution climate surfaces for global land areas. Int. J. Climatol. 2017, 37, 4302–4315. [Google Scholar] [CrossRef]
- Phillips, S.J.; Dudík, M.; Schapire, R.E. Maxent Software for Modeling Species Niches and Distributions (Version 3.4.1). Available online: http://biodiversityinformatics.amnh.org/open_source/maxent/ (accessed on 25 July 2021).
- Eyring, V.; Bony, S.; Meehl, G.A.; Senior, C.A.; Stevens, B.; Stouffer, R.J.; Taylor, K.E. Overview of the Coupled Model Intercomparison Project Phase 6 (CMIP6) experimental design and organization. Geosci. Model Dev. 2016, 9, 1937–1958. [Google Scholar] [CrossRef] [Green Version]
- Swets, J.A. Measuring the accuracy of diagnostic systems. Science 1988, 240, 1285–1293. [Google Scholar] [CrossRef] [Green Version]
- Sharp, J.L.; Leppla, N.C.; Bennett, D.R.; Turner, W.K.; Hamilton, E.W. Flight Ability of Plecia nearctica in the Laboratory. Ann. Entomol. Soc. Am. 1974, 67, 735–738. [Google Scholar] [CrossRef]
- Thornhill, R. Reproductive behavior of the lovebug, Plecia nearctica (Diptera: Bibionidae). Ann. Entomol. Soc. Am. 1976, 69, 843–847. [Google Scholar] [CrossRef]
- Thornhill, R. Sexual selection within mating swarms of the lovebug, Plecia nearctica (Diptera: Bibionidae). Anim. Behav. 1980, 28, 405–412. [Google Scholar] [CrossRef]
- Hieber, C.S.; Cohen, J.A. Sexual selection in the lovebug, Plecia Nearctica: The role of male choice. Evolution 1983, 37, 987–992. [Google Scholar] [CrossRef]
- Held, D.W.; Gelhaus, J.K. Damage in centipede sod associated with crane fly and March fly larvae (Diptera: Tipulidae, Bibionidae) in Mississippi. Fla. Entomol. 2006, 89, 89–90. [Google Scholar] [CrossRef]
- Buschman, L.L. Invasion of Florida by the ”lovebug” Plecia nearctica (Diptera: Bibionidae). Fla. Entomol. 1976, 59, 191–194. [Google Scholar] [CrossRef]
- D’Arcy-Burt, S.; Blackshaw, R.P. Bibionids (Diptera: Bibionidae) in agricultural land: A review of damage, benefits, natural enemies and control. Ann. Appl. Biol. 1991, 118, 695–708. [Google Scholar] [CrossRef]
- Kish, L.P.; Terry, I.; Allen, G.E. Three fungi tested against the lovebug, Plecia nearctica, in Florida. Fla. Entomol. 1977, 60, 291–295. [Google Scholar] [CrossRef]
- Arthurs, S.P.; Morales-Reyes, C.; Cherry, R.H. Trap design for lovebugs, Plecia nearctica (Diptera: Bibionidae). Fla. Entomol. 2015, 98, 892–898. [Google Scholar] [CrossRef]
Publisher’s Note: MDPI stays neutral with regard to jurisdictional claims in published maps and institutional affiliations. |
© 2022 by the authors. Licensee MDPI, Basel, Switzerland. This article is an open access article distributed under the terms and conditions of the Creative Commons Attribution (CC BY) license (https://creativecommons.org/licenses/by/4.0/).

