Article

After Wildfires and Rewetting: Results of 15+ Years’ Monitoring of Vegetation and Environmental Factors in Cutover Peatland

1
Meshchera National Park, ul. Internacionalnaya, 111, 601501 Gus-Khrustalny, Russia
2
Institute of Biology, Karelian Research Center, Russian Academy of Sciences, ul. Pushkinskaya, 11, 185910 Petrozavodsk, Russia
3
Peatland Protection and Restoration Center, Institute of Forest Science, Russian Academy of Sciences, ul. Sovetskaya, 21, 143030 Uspenskoye, Russia
*
Author to whom correspondence should be addressed.
Diversity 2023, 15(1), 3; https://doi.org/10.3390/d15010003
Submission received: 12 November 2022 / Revised: 10 December 2022 / Accepted: 13 December 2022 / Published: 20 December 2022
(This article belongs to the Special Issue Peatland Ecosystems under Climate Change)

Abstract

:
On examples of n × 100 m2 permanent plots laid in 2005 on peatlands disturbed by quarrying and milling peat extraction in Meshchera National Park (central European Russia), changes in vegetation cover and environmental factors during self-revegetation, the impact of wildfire, and rewetting are considered. Peat extraction pits are overgrown with floating mats, on which mire, predominantly mesotrophic, vegetation is formed. Cofferdams with retained original mire vegetation contribute to the formation of a spatially diverse mire landscape, but they can also be prone to natural fires. The environmental conditions at the abandoned milled peat extraction sites do not favour natural overgrowth. The driest areas can remain with bare peat perennially. Such peatlands are the most frequent targets of wildfires, which have a severely negative impact and interrupt revegetation processes. Alien plant species emerge and disappear over time. To prevent wildfires and create conditions favourable for the restoration of mire vegetation, rewetting is required. With an average ground water level (GWL) during the growing season of −5 to +15 cm, mire vegetation can actively re-establish. Communities with near-aquatic and aquatic plants can form on flooded areas with GWL of +30. This generally contributes to both fire prevention and wetland diversity.

1. Introduction

Peatlands are important ecosystems with high value for biodiversity conservation, climate regulation, and human welfare [1]. They form a specific environment and play a significant part in the regulation of climate due to their participation in the water and carbon cycles [2]. Mires are characterised by specific biological diversity on the genetic, species, ecosystem, and landscape levels [3]. In this paper, we follow the established approach of using the term “peatland” in relation to an area with or without vegetation with a naturally accumulated peat layer at the surface, and term “mire” to refer to a peatland in which peat is currently being formed [4]. At the very least, it is assumed that the mire has vegetation that can form peat and the excess moisture that this can provide.
However, large areas of peatlands have been drained or degraded as a result of agricultural, forestry, mining and other human activities [5]. Drained peatlands, especially when unused and abandoned, become extremely fire prone [6]. The most effective way to reduce the environmental hazards of disturbed and abandoned peatlands is their rewetting [1]. The IPCC Special Report “Climate Change and Land” [5] notes that peatland restoration targets the most carbon-rich lands and thus involves less area and less impact on land-use when considering climate change mitigation and adaptation measures. Restoring peatlands through rewetting may significantly reduce GHG emissions [7]—even in the case of increased CH4 emissions [8]—reduce peat fires [9,10], and help restore biodiversity [11], hydrological [12], and other peatland ecosystem functions [13].
Russia has the largest extent of peatlands worldwide [14], occupying more than 8%, and together with shallow peatlands (peat <30 cm), more than 20% of the Russian territory [15]. The peatland coverage of the European part of Russia is about 6%, and taking into account the shallow peatlands, about 17%, with almost 40% of Europe’s peatlands located here [16]. Most peatlands in Russia are preserved in their natural state, but over 8 million hectares have been drained for agriculture, forestry and peat extraction [17]. Drained peatlands are mainly located in the European part of the country [18], and this territory is approaching the degree of disturbance of peatlands found in other European countries [19].
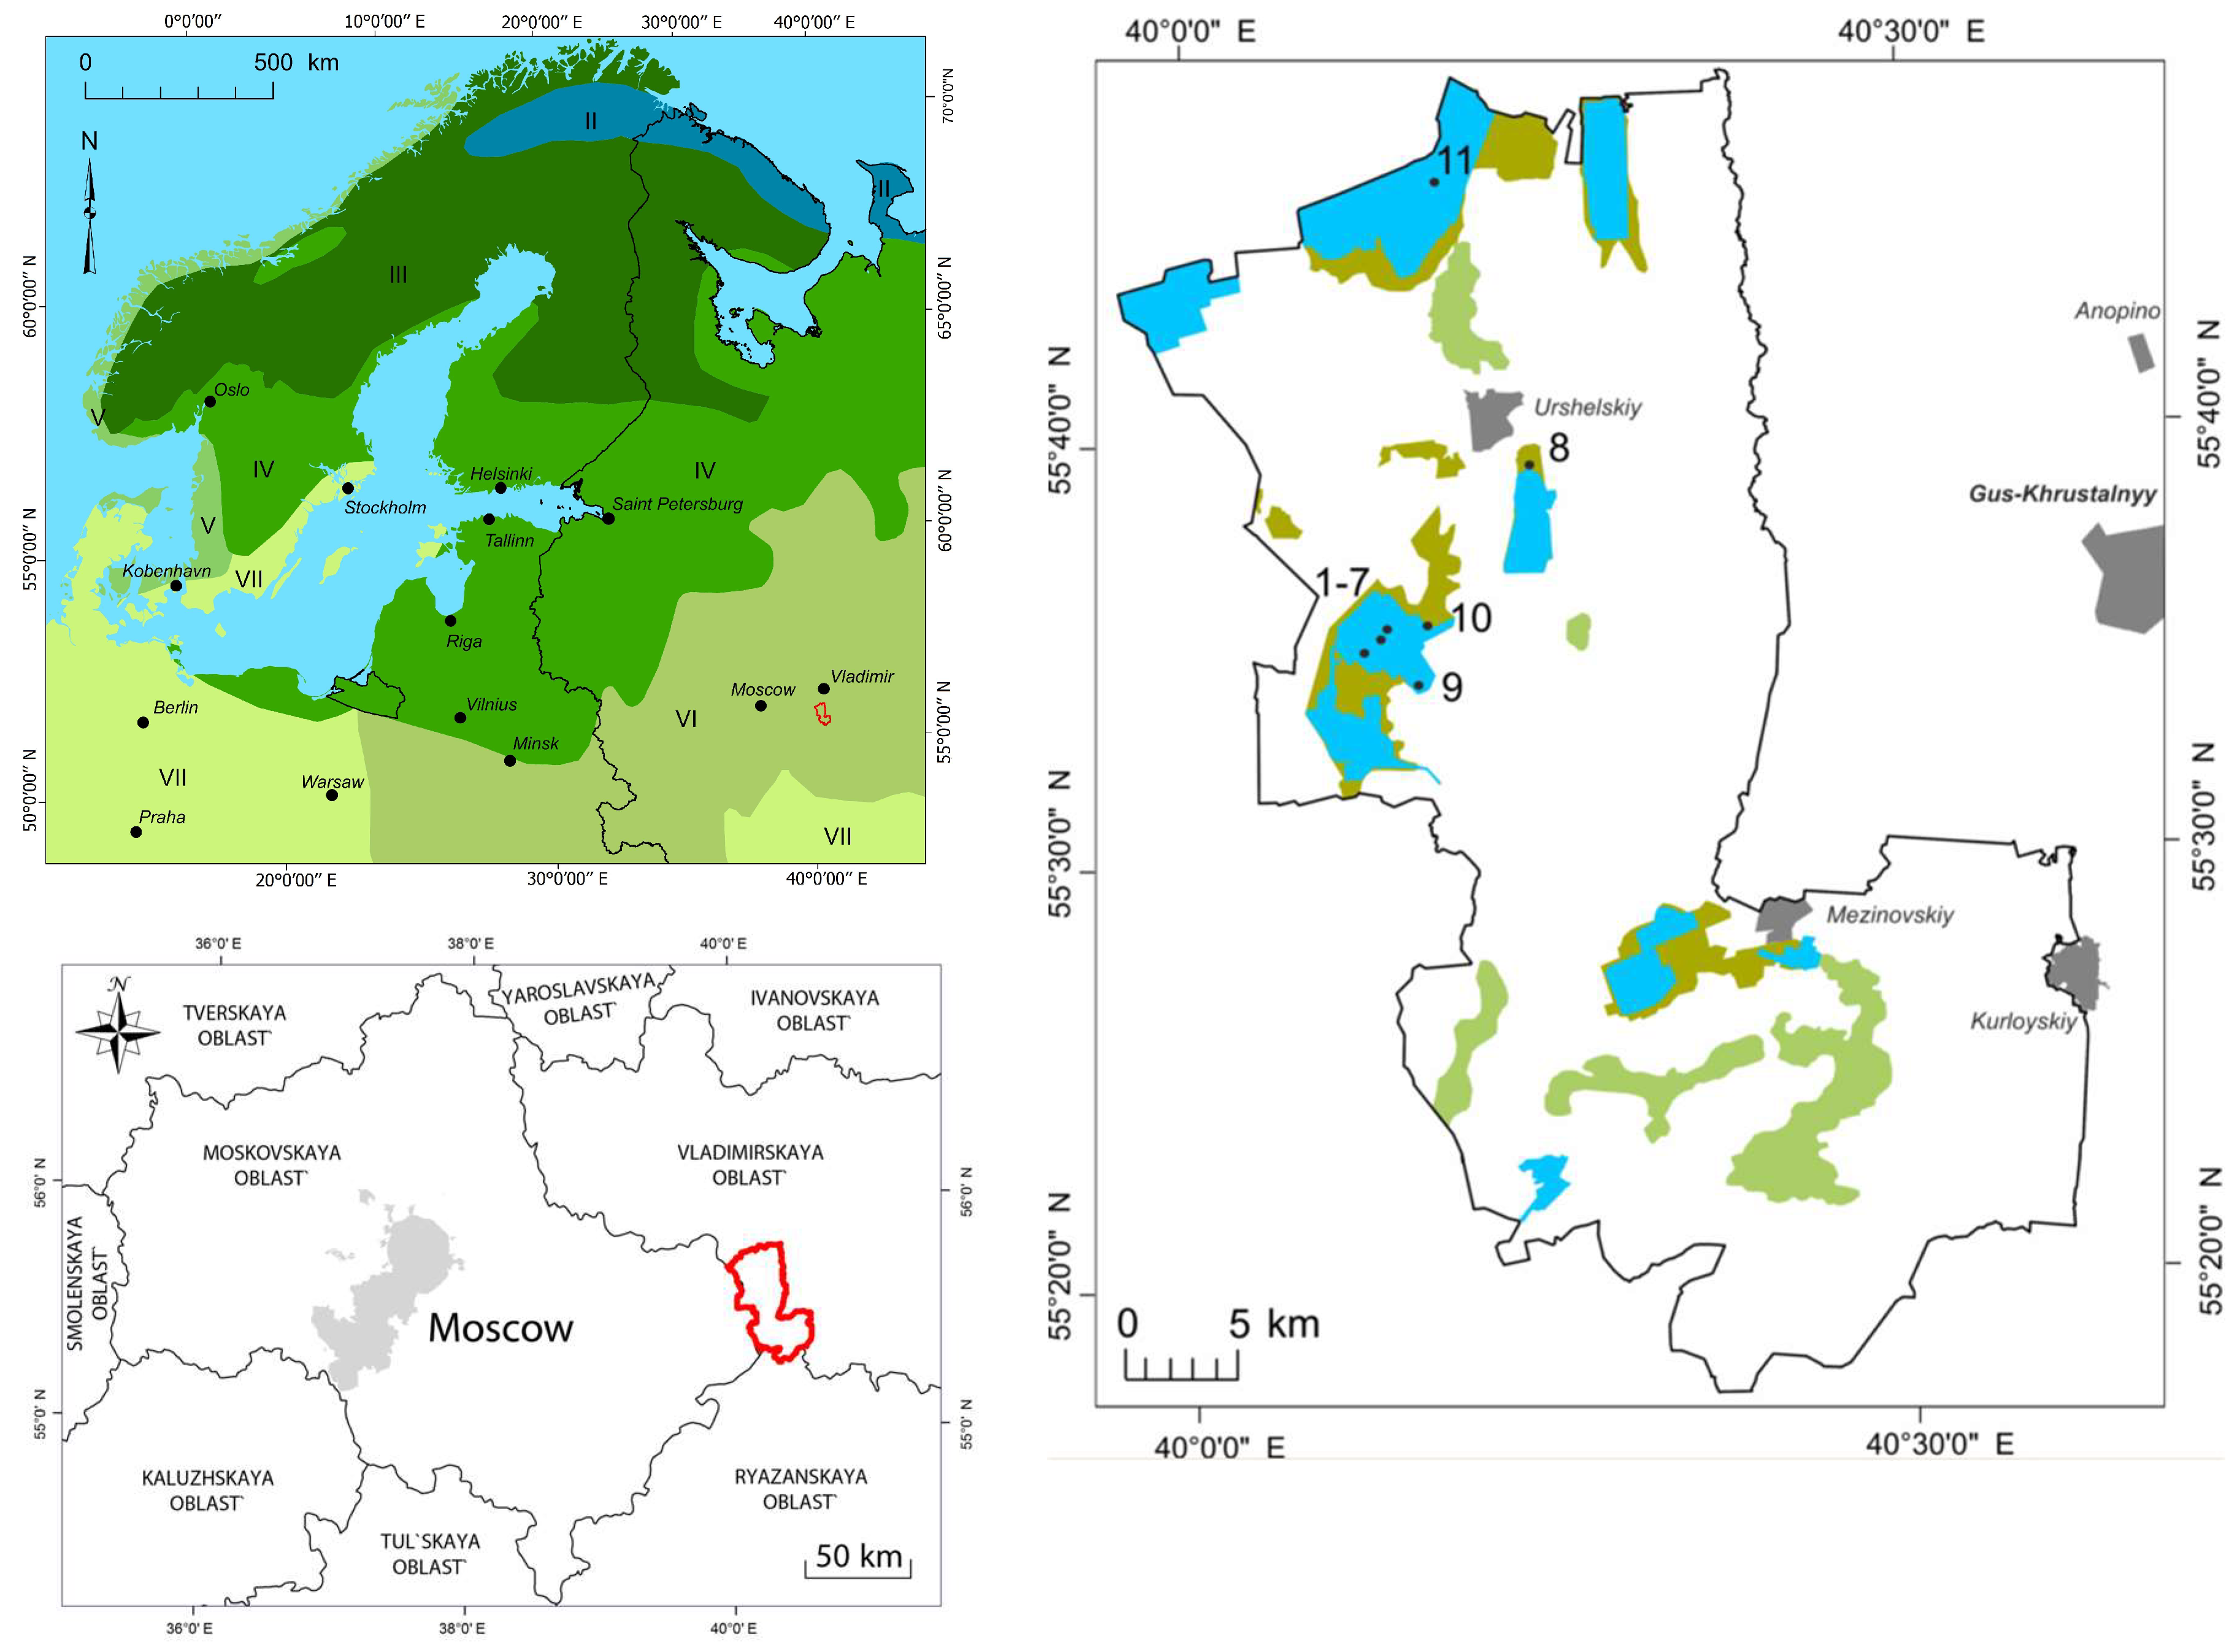
Peat extraction, which most severely destroys peatlands, has been carried out in different regions of European Russia, but most extensively in the center: in the east of the Moscow Region and in the neighboring parts of the Vladimir Region, including the highly paludified Meshchera outwash lowland (Figure 1). The extraction of fuel peat here was of key importance for the country during the Civil War and Foreign Intervention in the 1920s and during the period of industrialization and in the years of preceding and during the Second World War. After peat extraction ended, the peatlands gradually swamped themselves, especially by so-called “wet” methods that did not require intensive drainage (hydropeat, quarry, etc.). After the 1940s, the introduction of milling, the most widely used industrial peat extraction method in many countries, which involves intensive drainage, demanded the reclamation of mined out deposits. This was carried out, however with a delay, and the crisis of the peat industry in the 1990s dramatically increased the area of abandoned milled peat fields, subsequently contributing to the large-scale peat fires of 2002 [6] and especially 2010, having disastrous consequences for the environment, economy and human health [20].
The pioneer of large-scale rewetting of fire-prone peatlands in Russia was the Meshchera National Park. When organized, the park included both natural peatlands and those disturbed by various methods of peat extraction. Work started in 2003 and confirmed the effectiveness of rewetting in the reduction of the number and the areal extent of peat fires [6]. After the 2010 fires, the most large-scale rewetting project in the northern hemisphere was implemented on more than 73,000 ha in 2010–2013 in the Moscow region [10]. Ongoing monitoring has shown a decrease in the number and area of fires [10], and a reduction in greenhouse gas emissions [21]. The main trends in vegetation development after rewetting and elimination of fire danger were determined [10]. Monitoring methods based on satellite data with ground verification were used, the development of which began on the example of peatlands in Meshchera National Park [22,23,24].
Revegetation of peatlands has been the subject of a large number of publications. The vegetation of peatlands previously used for so-called “wet” peat extraction has been studied in various countries, including Russia [25,26,27,28,29,30]. Surveys were predominantly carried out many years after the cessation of mining and generally indicate the formation of mire vegetation, the structure of which depends primarily on the water and hydrochemical regime of the sites. Due to technological heterogeneities (borrow pits, excavations, remains of initial surface, etc.) a mosaic of different mire/wetland habitats is often formed after mining has ceased. Many studies, mainly up to the 2000s, have investigated self-revegetation of cutover milled peat fields and the influence of environmental factors on these processes [31,32,33,34]. Such intensively drained areas are poorly self-revegetated and dry sites can remain bare for more than 15 years [35], as confirmed by remote monitoring data [10,24]. These are the most frequent sites of peat fires [6,36], although post-fire vegetation changes specifically in the burnt areas of abandoned peat mining fields are not frequent research subjects. The main studies of vegetation dynamics in abandoned peat extraction fields are related to their rewetting [37,38,39,40,41,42]. The pathways and dynamics of vegetation formation after peat extraction may vary considerably, but in any case, they require long-term observation [43,44].
In this paper, we have tried to examine the main changes in vegetation in the mined peatlands of Meshchera National Park (Central European Russia) on the basis of long-term observations on permanent plots. We sought to compare the vegetation of milled peat extraction sites and those on quarried peat fields, the intervention of occasional fires and the deliberate impact of rewetting. The focus was on the plant communities and their spatial distribution at the study plots.

2. Materials and Methods

2.1. Study Region

Meshchera National Park is located in the center of European Russia, about 120 km east of Moscow (Figure 2), in the west of the Vladimir Region, and adjoins the eastern border of the Moscow Region. The area belongs to the boreo-nemoral (mixed coniferous broad-leaved) forest zone [45]. The climate is temperate continental. The National Park lies in the centre of the Meshchera lowland, mostly composed of outwash sands which, due to poor drainage and excessive moisture, have been intensively waterlogged.
According to the European mire zonation, this area belongs to the “continental fen and bog region” [46]. When the park was created in 1992, the lands of five former peat mining enterprises were included in its territory: Baksheevsky, Tasin-Borsky, Orlovsky, Gusevsky, and Mezinovsky. Peat is still extracted in the buffer zone of the park. The area occupied by disturbed peatlands is 14,900 ha, 7600 ha of which were drained for milled peat extraction. Initially there were peatbog massifs of different types and positions in the landscape. Peat extraction was finished or stopped 40 to 25 years ago, and since 2002, the National Park has been working on peatland rewetting to prevent peat fires and support wetland restoration [6]. In total, more than 9000 ha were rewetted by 2022, making the park a pioneer in large-scale rewetting of disturbed peatlands in Russia.

2.2. Study Objects and Sites

Monitoring of disturbed peatlands was organized in Meshchera National Park in June 2005 for scientific support of rewetting [47]. Permanent test plots, hereafter referred to as “plots” (Table 1), were laid in the peatlands: Ostrovsky (area 11,943 ha), Tasinsky Bor (3594 ha), and Garinsky (1604 ha) (Figure 1). Areas 1–7, 9, 10 are located in the Tasinovsky peatland, which, before peat extraction, was a complex mire system consisting of oligotrophic sphagnum and mesotrophic grass–sphagnum mires. The depth of the peat deposit averaged 2 m. About 80 years ago, various methods of sod peat extraction were used here (excavator, machine-forming), after which were left pits filled with water, separated by cofferdams. In the 1970s and 1980s the northern part of the peatland was mined by milling peat, after which some areas were reclaimed for the creation of forest cultures and agricultural use. In the 1990s, when mining activities ceased completely, the abandoned drained peatland became a part of the National Park, at which point it constituted a fire hazard, burning heavily in 1998, 2002 and 2006.
Plot No. 8 is located in the Garinsky peatland, which, before drainage and extraction of milled peat, was a system of mesotrophic and meso-etrophic grass–sphagnum mires. It burned frequently, especially in 2002, with the residual peat deposit burning out almost completely in some places. Plot No. 11 is located in the Ostrovsky peatland, which, before drainage, was a large system of oligotrophic sphagnum ridge-hollow raised bogs. The deposit of the peatland is a raised bog peat, 4–6 m deep. In the 1980s, it was prepared for milled peat extraction, but was never used, after which it burned frequently, especially strongly in 2002 and 2010.
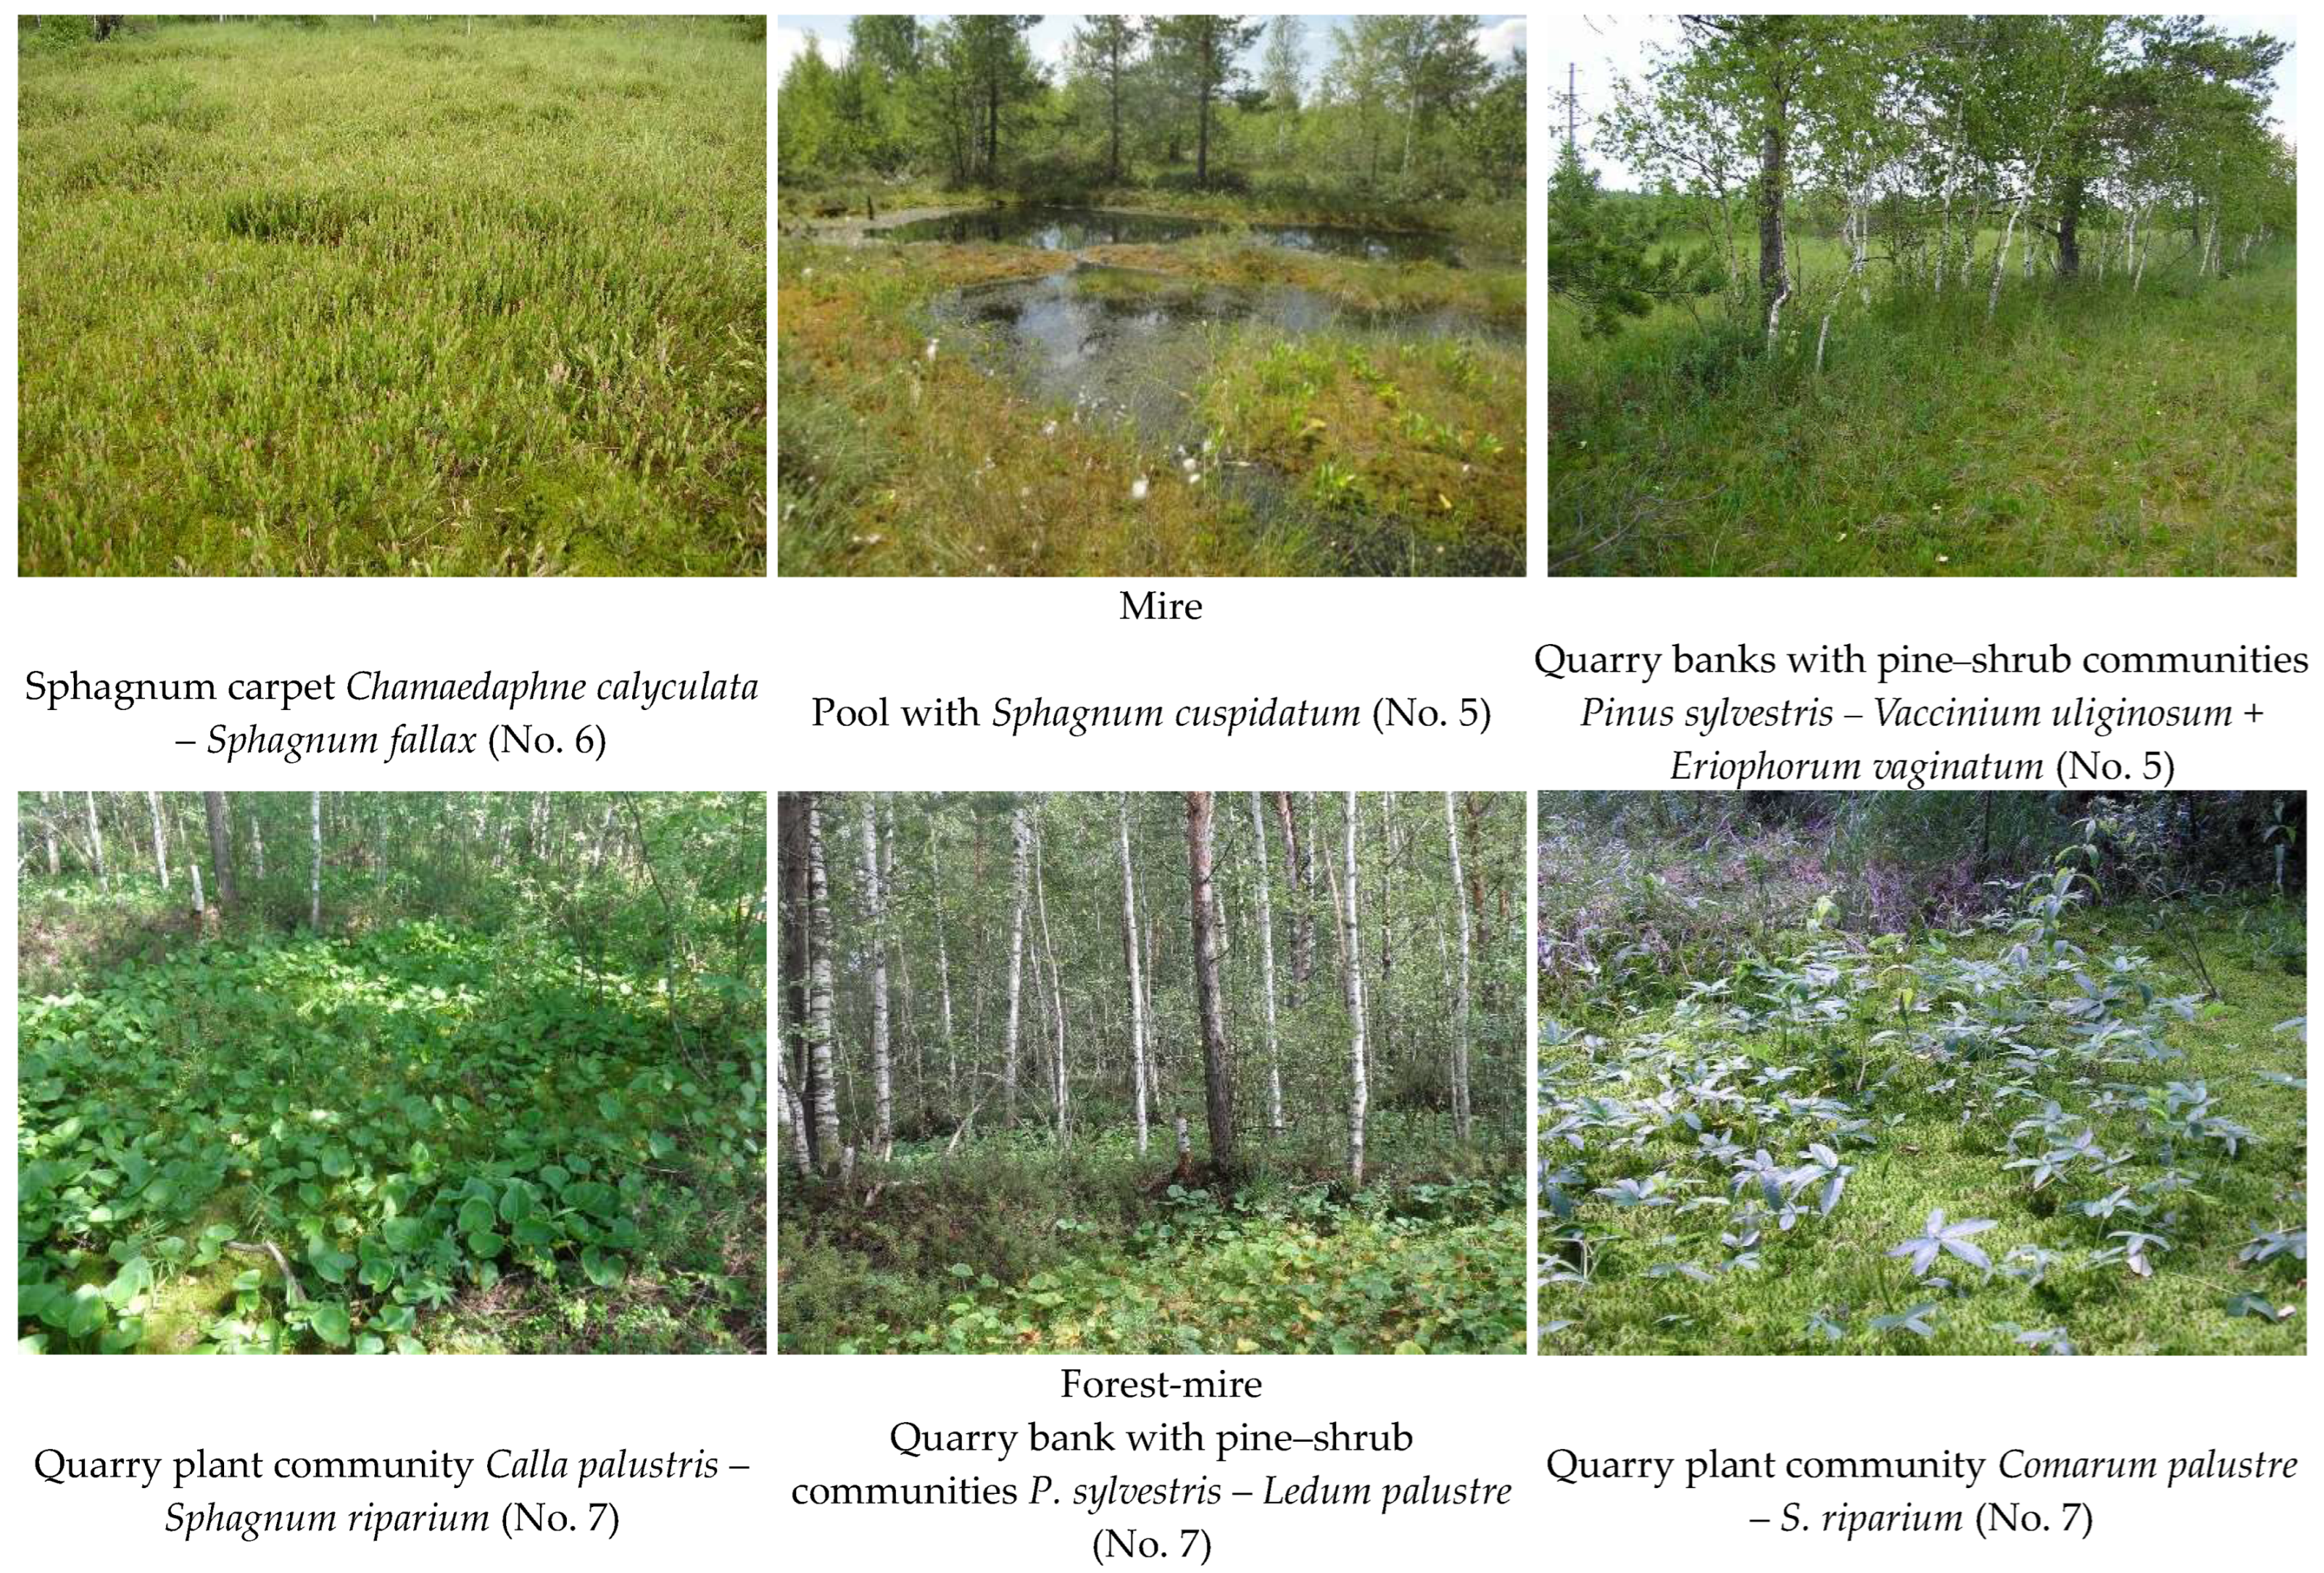
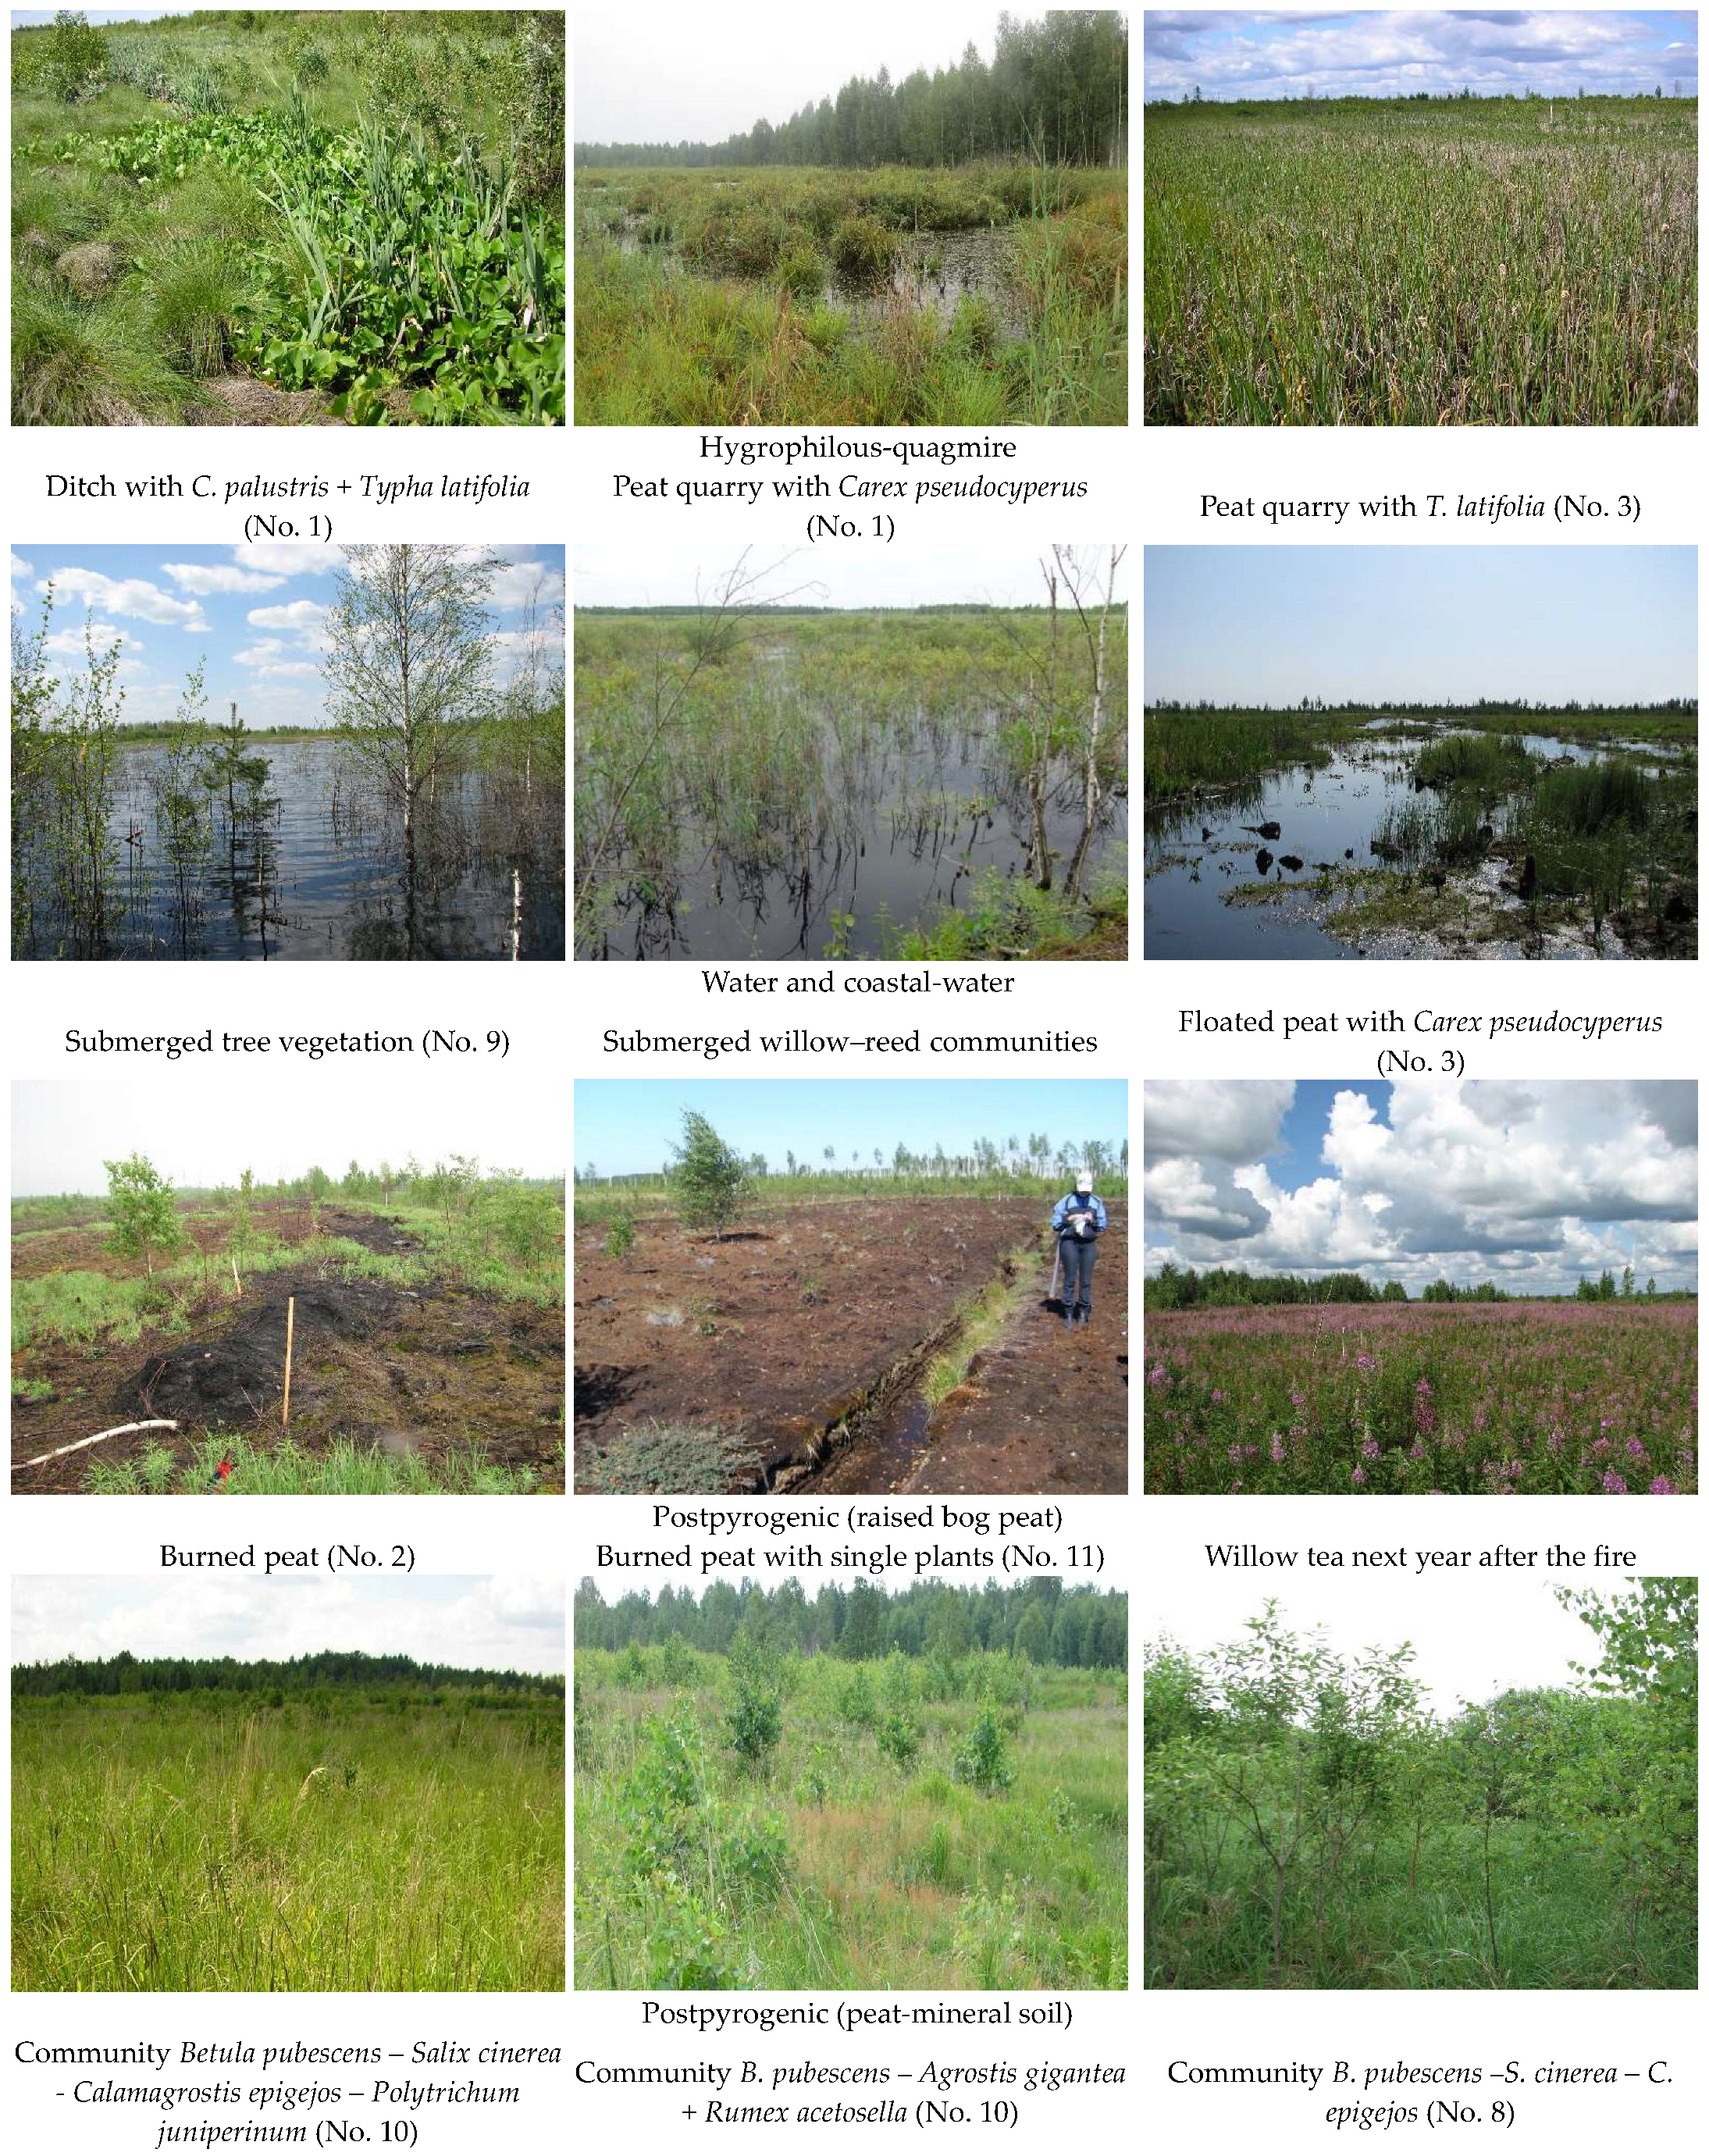
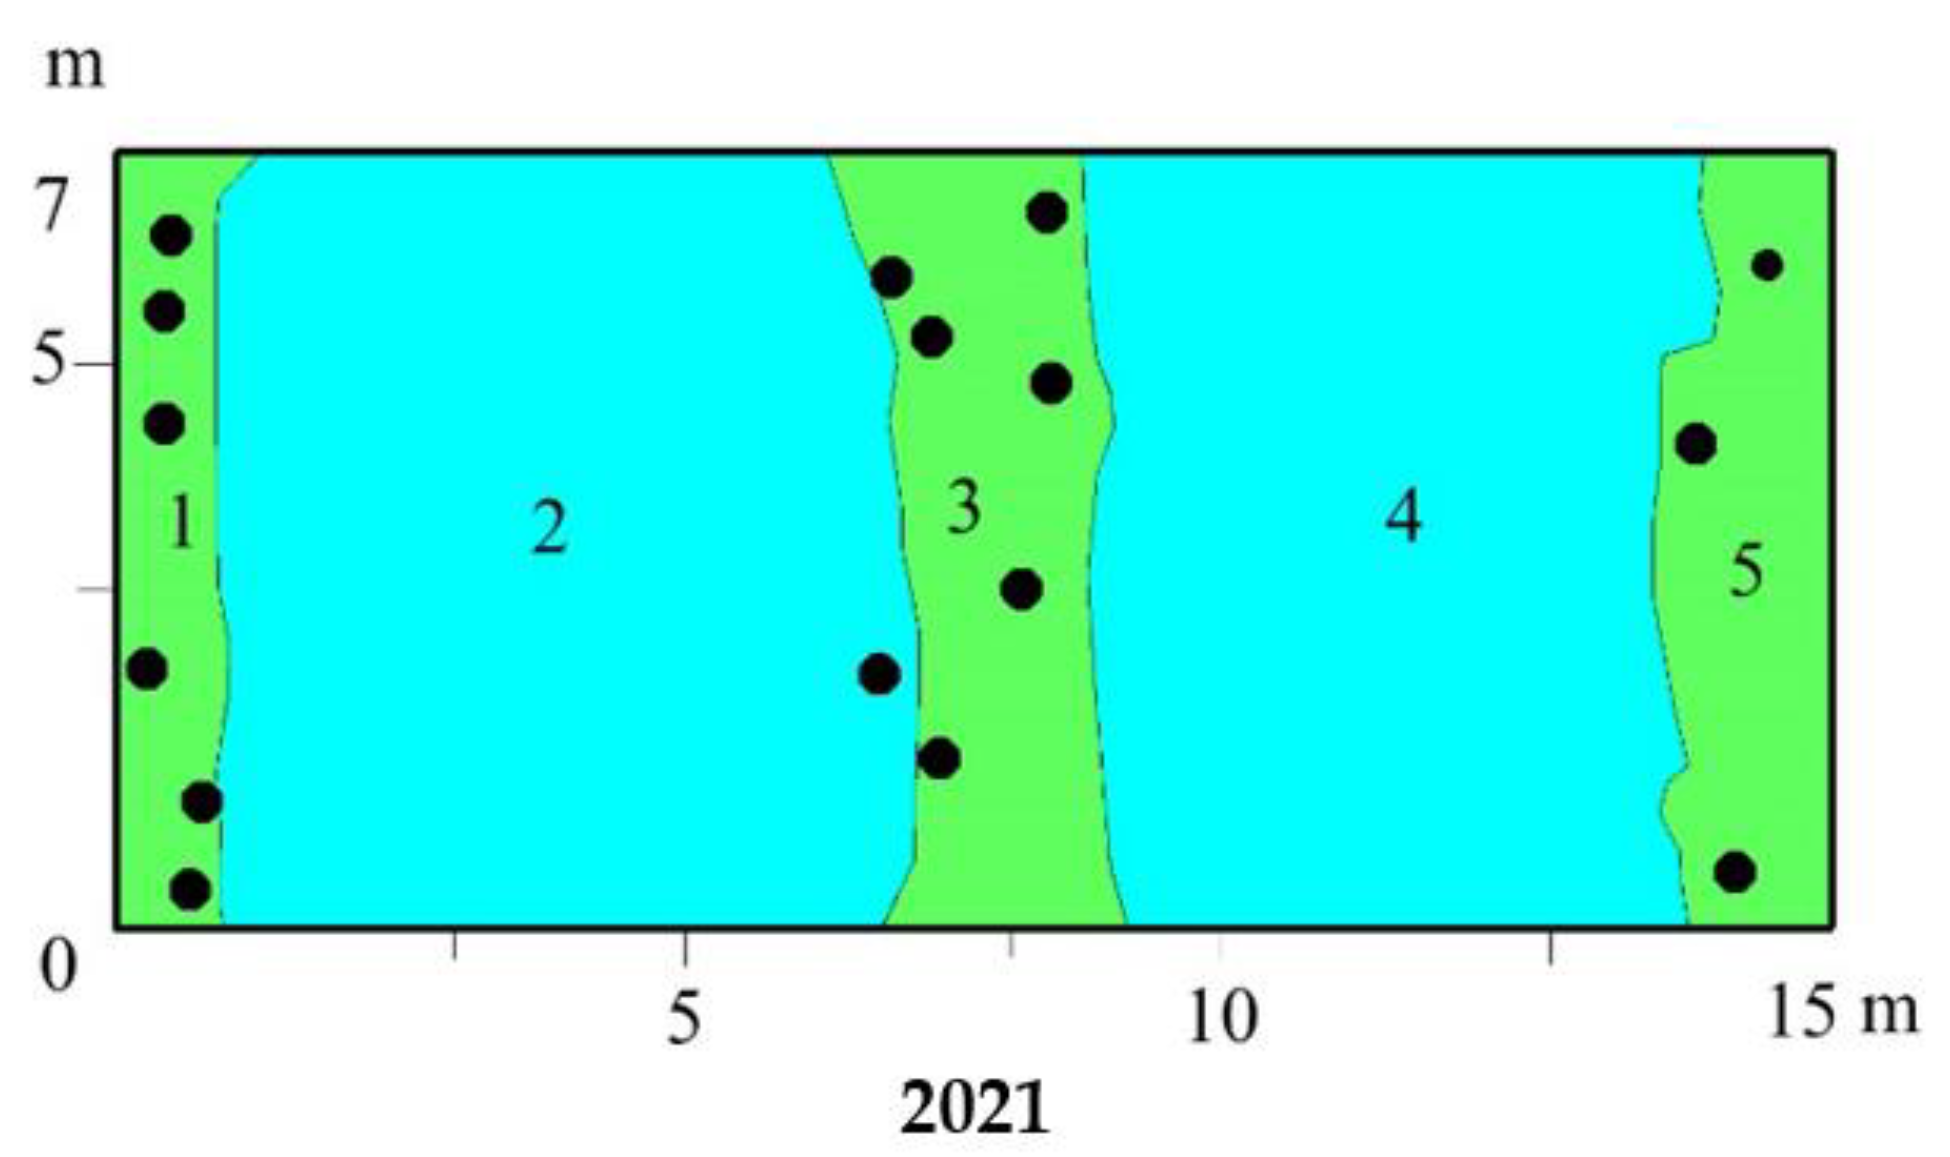
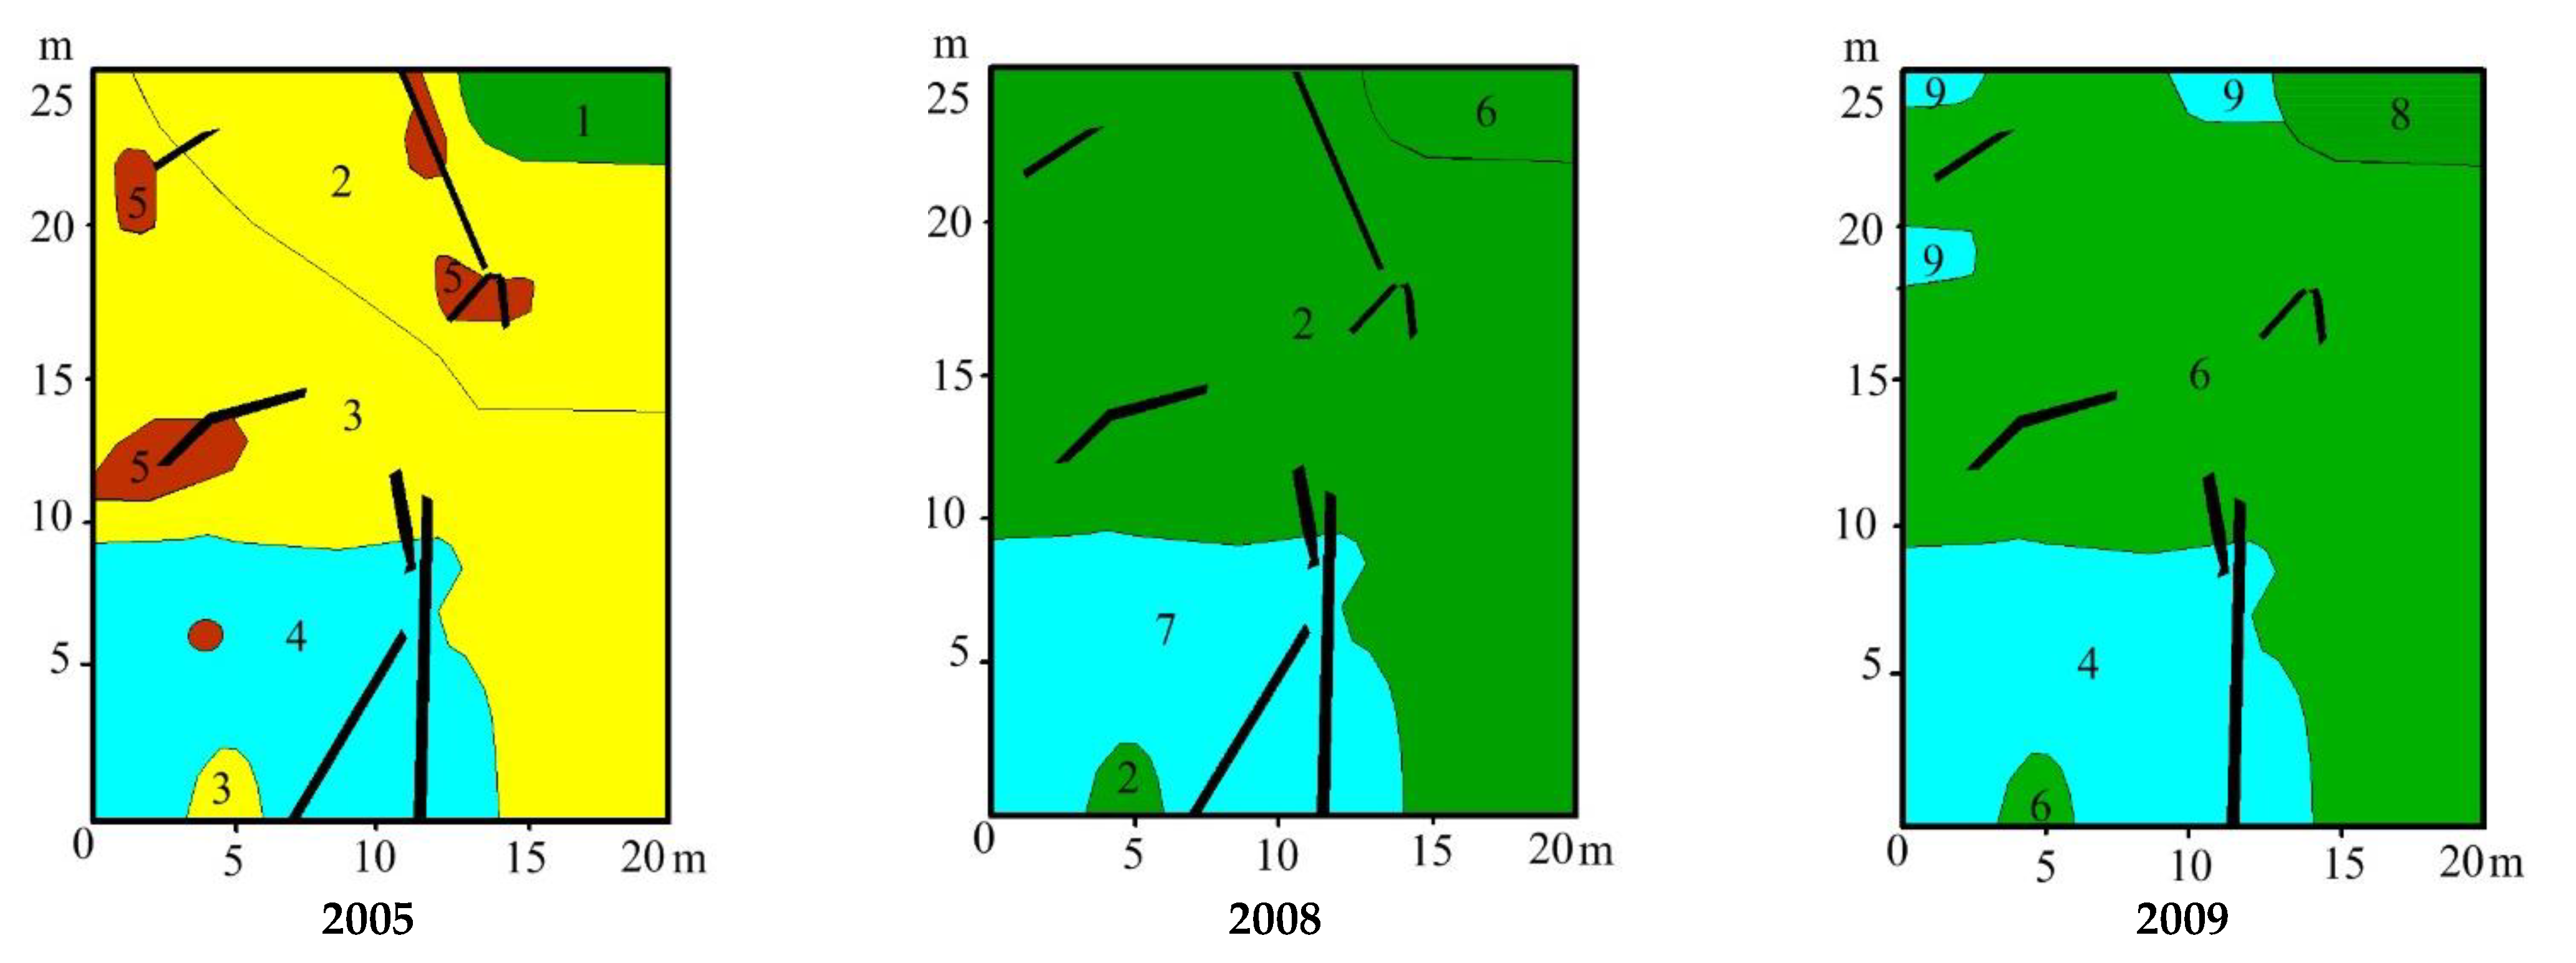
The selected plots reflect the characteristic impacts of peat extraction (Table 2) and, at the time of selection in 2005, represented different types of ecological-vegetation complexes representing stages of vegetation regeneration succession [47] with a wide range of plant communities (Figure 3). Swamp complexes were formed in waterlogged peat pits, where sod peat extraction was completed 50–60 years ago, and represent various types of sphagnum communities, occupying more than 50% of the area of the pits. Forest-mire complexes are characteristic of quarries developed more than 80 years ago by hand-cut peat extraction. The centres of the quarries were occupied by swamp grass–sphagnum and grass communities, and the high sides by forest vegetation. Hygrophilous-quagmire complexes are formed in the rewetted areas of milled fields, where groundwater levels (GWL) can fluctuate from +20 above to −40 cm below the surface due to its unevenness. Lakes and coastal-water ecological-vegetation complexes occupy rewetted areas of milling fields. Pools are located in the central part of the fields with coastal-water complexes on the edges of the pools. When the GWL increases, the pools may merge with each other and form a large body of water.
Post-pyrogenic complexes are formed on burnt areas after severe fires, with the vegetation cover completely destroyed. Depending on the condition of the peat deposit, it was possible to distinguish post-pyrogenic complexes on peat-mineral and peat soil. The first ones develop in the areas of milled fields and production territories, where insignificant peat layers, less than 0.5 m in thickness, are preserved. As a rule, they are formed by low-mire peats with significant mineral inclusions. The latter are formed on heavily burnt areas of milled fields with peat thickness over 0.5 m.

2.3. Climatic Data

For the analysis of climatic conditions for the study period (2007–2021), meteorological data were used according to the site [48] for the nearest weather station to the Meshchera National Park, located in the town of Gus-Khrustalny. Average values for Gus-Khrustalny for the period 1981–2010 were taken from the site of the Hydrometeorological Research Center of Russian Federation (Hydrometcenter of Russia) [49].

2.4. Environment Monitoring

Monitoring of the ground-water levels (GWL) was organized in 2007. Perforated plastic tubes with a diameter of 6 cm were installed in the peat and ground. Two wells (1.1 and 1.2) were installed on plot No. 1 for the monitoring of GWL due to the unevenness of the terrain. The measurements were carried out year-round, once every 2 weeks. In parallel with GWL measurements, water has been sampled every 2 weeks since 2009 to measure temperature, pH, and conductivity. A Hanna HI 98130 COMBO portable pH meter/conductometer/thermometer is used. Since 2014, the iron content of the peat pore water has been determined once per quarter. A Hanna HI 96721 portable photometer is used for the measurement, made in the laboratory on the day of sampling. Since 2008, annual measurements of water storage in snow before snow melt in late February-early March have been performed on the plots.

2.5. Vegetation Studies

The vegetation cover of the plots was described by common geobotanical methods [50,51,52]. The spatial structure of the vegetation cover was presented using the traditional Russian large-scale vegetation mapping ecological-phytocoenotic (dominant) approach [53]. The research data were entered into the electronic passport of the plots. Plant species were identified using regional handbooks [54,55,56].

2.6. Sites Characteristics

The thickness of the peat deposit was determined with the Russian Peat Sampler. Peat samples were taken to determine the botanical composition and degree of decomposition in the sample areas prior to monitoring.

3. Results

3.1. Climatic Conditions over Study Period

Analysis of mean annual temperatures for the observation period (2006–2020) shows increases relative to 30-year averages (1981–2010) (Table 3). The warmest years were 2020, 2008, 2015, and 2019. Monthly average temperatures increased for the summer months, May and September, and partly for April and October. At the same time, most of the years were characterised by lower average monthly temperatures in winter and part of March.
There are years with relatively lower amounts of precipitation—2020 (487.7 mm, 73.6% of the norm), 2018 (522 mm, 78.8% of the norm), and 2011 (556 mm, 83.0% of the norm) (Table 4). There were also slightly wetter ones: 2008 (824.9 mm, 124.6% of the norm), 2006 (760 mm, 114.8% of the norm), and 2009 (715 mm, 108% of the norm). Warm seasons (April-October) account for 2/3 of precipitation on average. In dry years with minimum average annual precipitation, its reduction is mainly due to reduction of precipitation falling out in the warm season, which often leads to droughts and, as a consequence, to wildfires.
Climatic conditions of the observation years were different. Winter 2006/2007 was relatively warm (tmean −4.9 °C), with mean precipitation (191 mm); spring came early, with low precipitation (94.5 mm); and summer was relatively warm (tmean +18.8 °C), predominantly sunny, with low precipitation (122 mm). The winter of 2007/2008 was warm, with most precipitation in February (104 mm); spring came early with heavy precipitation (225 mm); and summer was warm, with precipitation of 283 mm. The winter of 2008/2009 was warm, with little precipitation (114 mm); spring arrived at an average time during the year, precipitation was 94 mm; and summer was average in rainfall (247 mm). In July–August 2010, due to the extensive anticyclone air temperatures in the European part of Russia, the temperature reached up to record values [57]. The average July temperature was above the long-term average by 4 °C, and August by 4.5 °C, while the maximum temperatures were 36.7 °C in July and 37.7 °C in August. Precipitation was the lowest in the study period, 97.4 mm, representing 45% of the norm. The winter of 2010–2011 was one of the coldest (tmean −10.4 °C) and snowiest, with 171 mm of precipitation compared with 141 mm of the norm. Spring 2011 arrived late and was cool (tmean +5.6 °C), with average precipitation (102 mm). The summer of 2011 was hot and dry, with average temperatures 6.3 °C above normal, and total precipitation was 125.9 mm (58.5% of the norm).
The winter of 2011/2012 was cold and snowy (tmean −7.6 °C, with an average precipitation of 144 mm), spring was very late and rapid in the first half with high precipitation (172.8 mm), and summer was not as hot and dry as in 2010 and 2011. The winter of 2012/2013 was relatively warm, with several thaws, and average precipitation (116.1 mm). Spring was very late and short-lived, with significant precipitation of 229.6 mm (147% of normal). June was hot with many “dry” thunderstorms; the first half of July was dry and hot, and the second half experienced high precipitation and relatively low temperatures, and August was relatively warm with little precipitation. The winter of 2013/2014 was warm with little precipitation (107 mm—75.8% of normal). Spring was early, warm, and sunny, with very little precipitation (67.4 mm). Summer was warm, sunny and dry (224.1 mm). Winter 2014/2015 was quite warm and snowy, with frequent thaws and with average levels of precipitation. The summer was sunny and warm (tmean +17.4 °C, precipitation 222.7 mm, 132% of normal). Winter 2015/2016 had high precipitation (194 mm, tmean −4.6 °C), with regular above-zero temperatures in December and February. Spring arrived on time with average precipitation and temperature (107.8 mm, tmean +6.8 °C). Summer was warm with regular and abundant precipitation, especially in the first two months (185 mm, tmean +19.1 °C).
The winter of 2016–2017 was relatively warm (tmean −7.4 °C), with little precipitation (106.2 mm). Spring had high precipitation (134 mm) in March and May. Summer was cool and rainy (214.1 mm, tmean +16.6 °C). The first half of winter 2017/2018 was warm, with lots of precipitation; the second half was frosty with little precipitation (104.3 mm, tmean −5.9 °C). Spring was very late and prolonged, with little precipitation and an average background temperature (138.3 mm, tmean +14.7 °C), while summer was quite warm and dry (152.8 mm, tmean +18.5 °C). Winter 2018/2019 was warm with average precipitation (104.3 mm, tmean −6.5 °C). Spring was early, the first half with precipitation, the second half sunny and warm (121.9 mm, tmean +7.4 °C). Summer was quite warm, with average precipitation (218.7 mm, tmean +16.8 °C). Winter 2019/2020 was very warm, with constant thaws and little precipitation (104.1 mm, tmean −1.4 °C). Spring was early, with high precipitation (155.7 mm, tmean +6.2 °C). Summer was cold and rainy at the beginning, warm in the middle and end, with average precipitation (162.3 mm, tmean +17.9 °C). Winter 2020/2021 was relatively warm (153.3 mm, tmean −9.3 °C). Spring was average in timing, with average precipitation (200 mm, tmean +6.1 °C). Summer was very warm, with average precipitation and a dry July.

3.2. Study Sites Environmental Conditions

Water storage in snow affects the moisture content in the soil during the spring period; the conditions of plant development in the initial vegetation period; to a certain extent, the development of fires, especially in case of their occurrence; conditions of burial in the soil; and transition of grass wildfires into peat fires. According to measurements, water storage in snow before snowmelt was highest in 2012 and 2021 (Figure 4). The minimum values were observed in 2008, 2009, and 2018, although some plots vary from the general trend. While precipitation in the form of snow is generally the same for the entire study area, its transport by wind and loss by evaporation during the winter may differ significantly. This is related to the difference in storage between different plots in the same year.
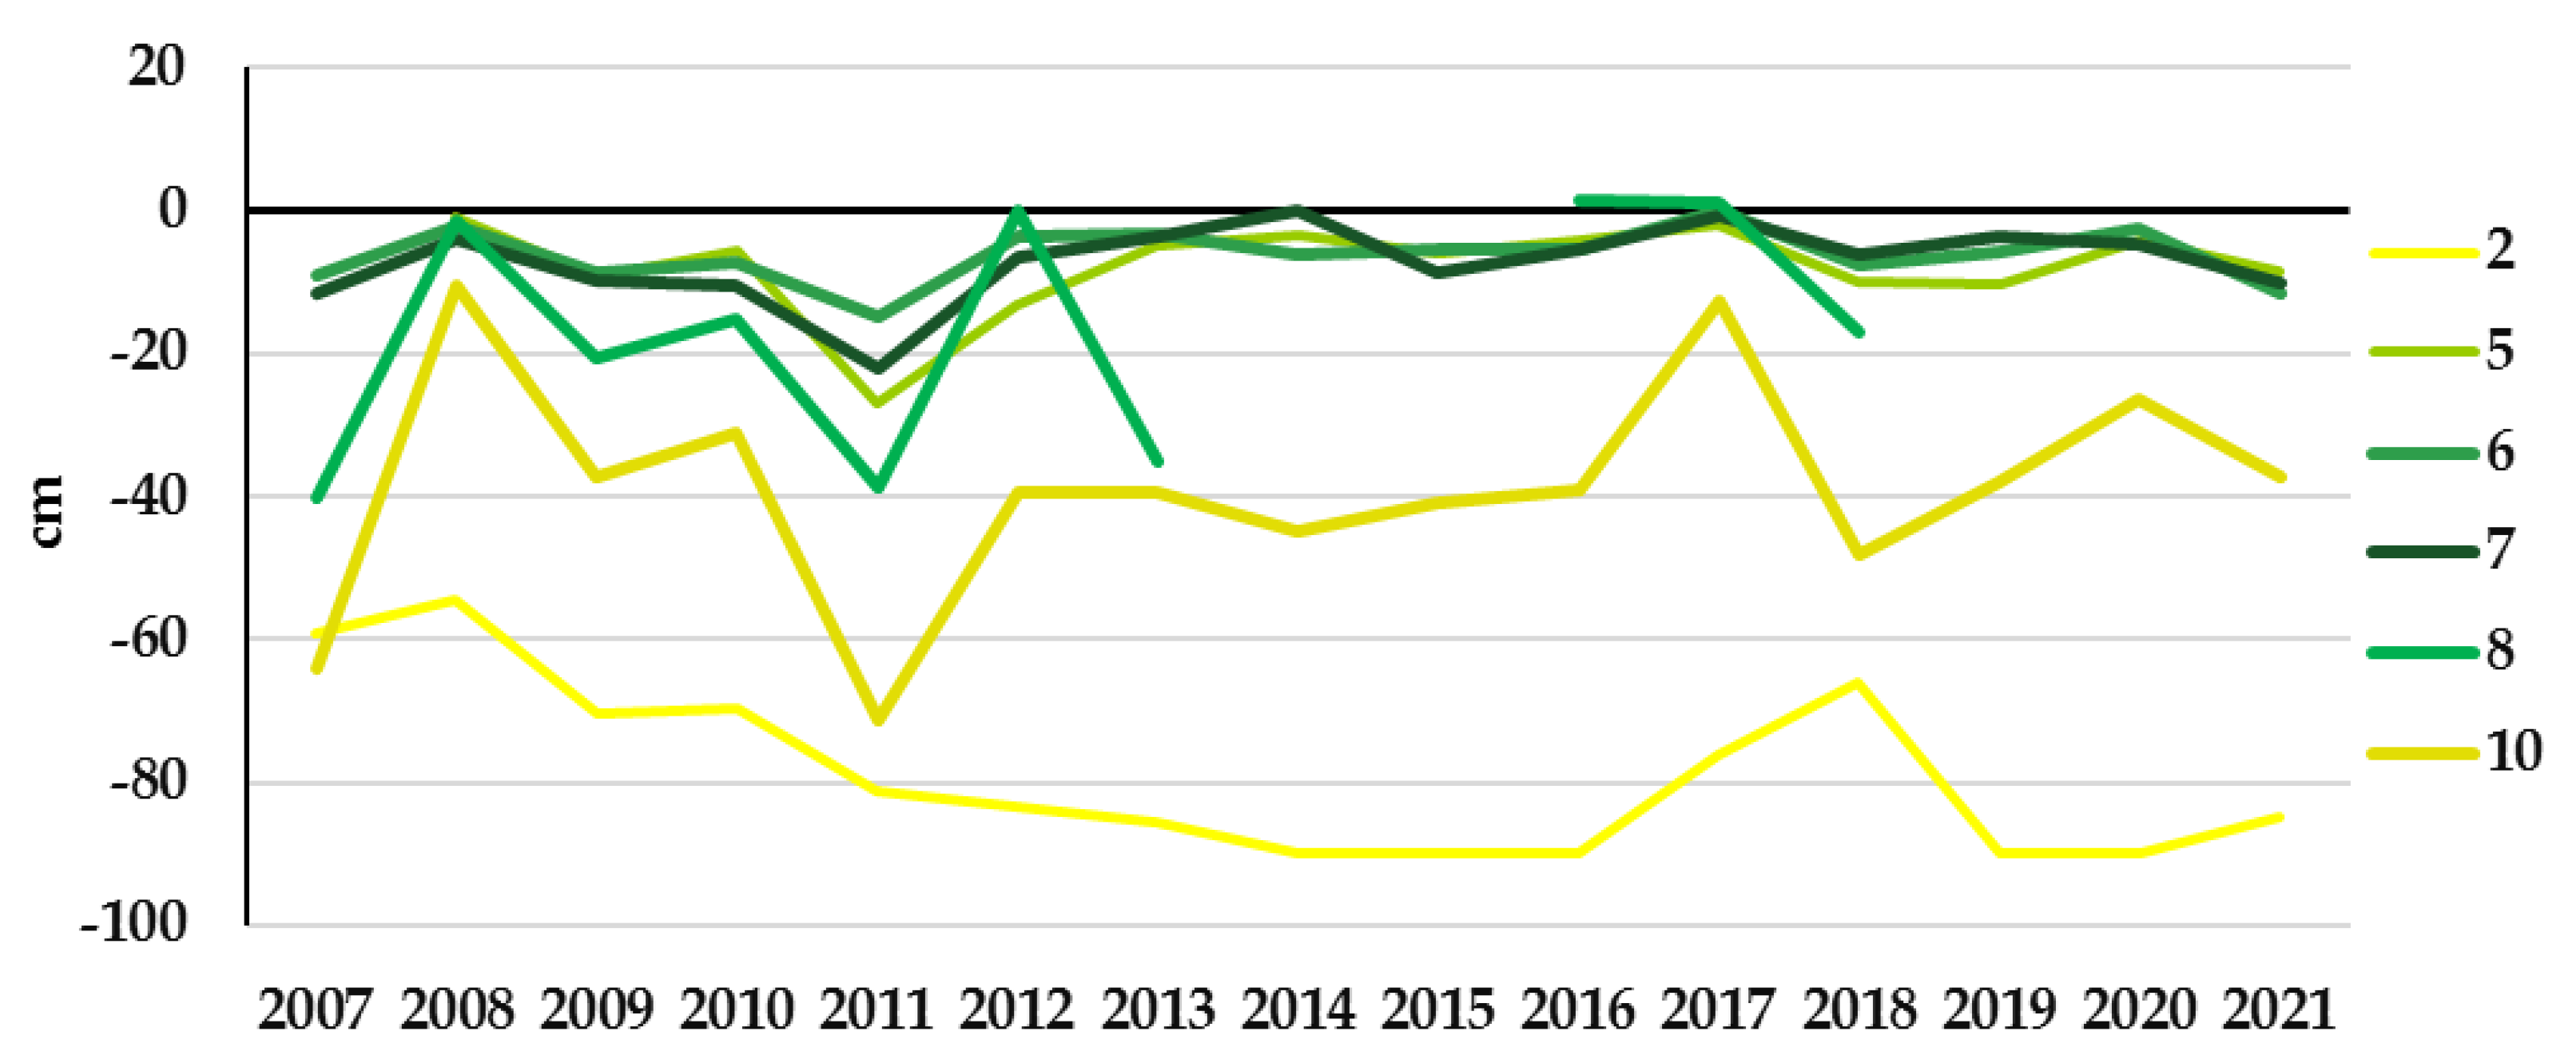
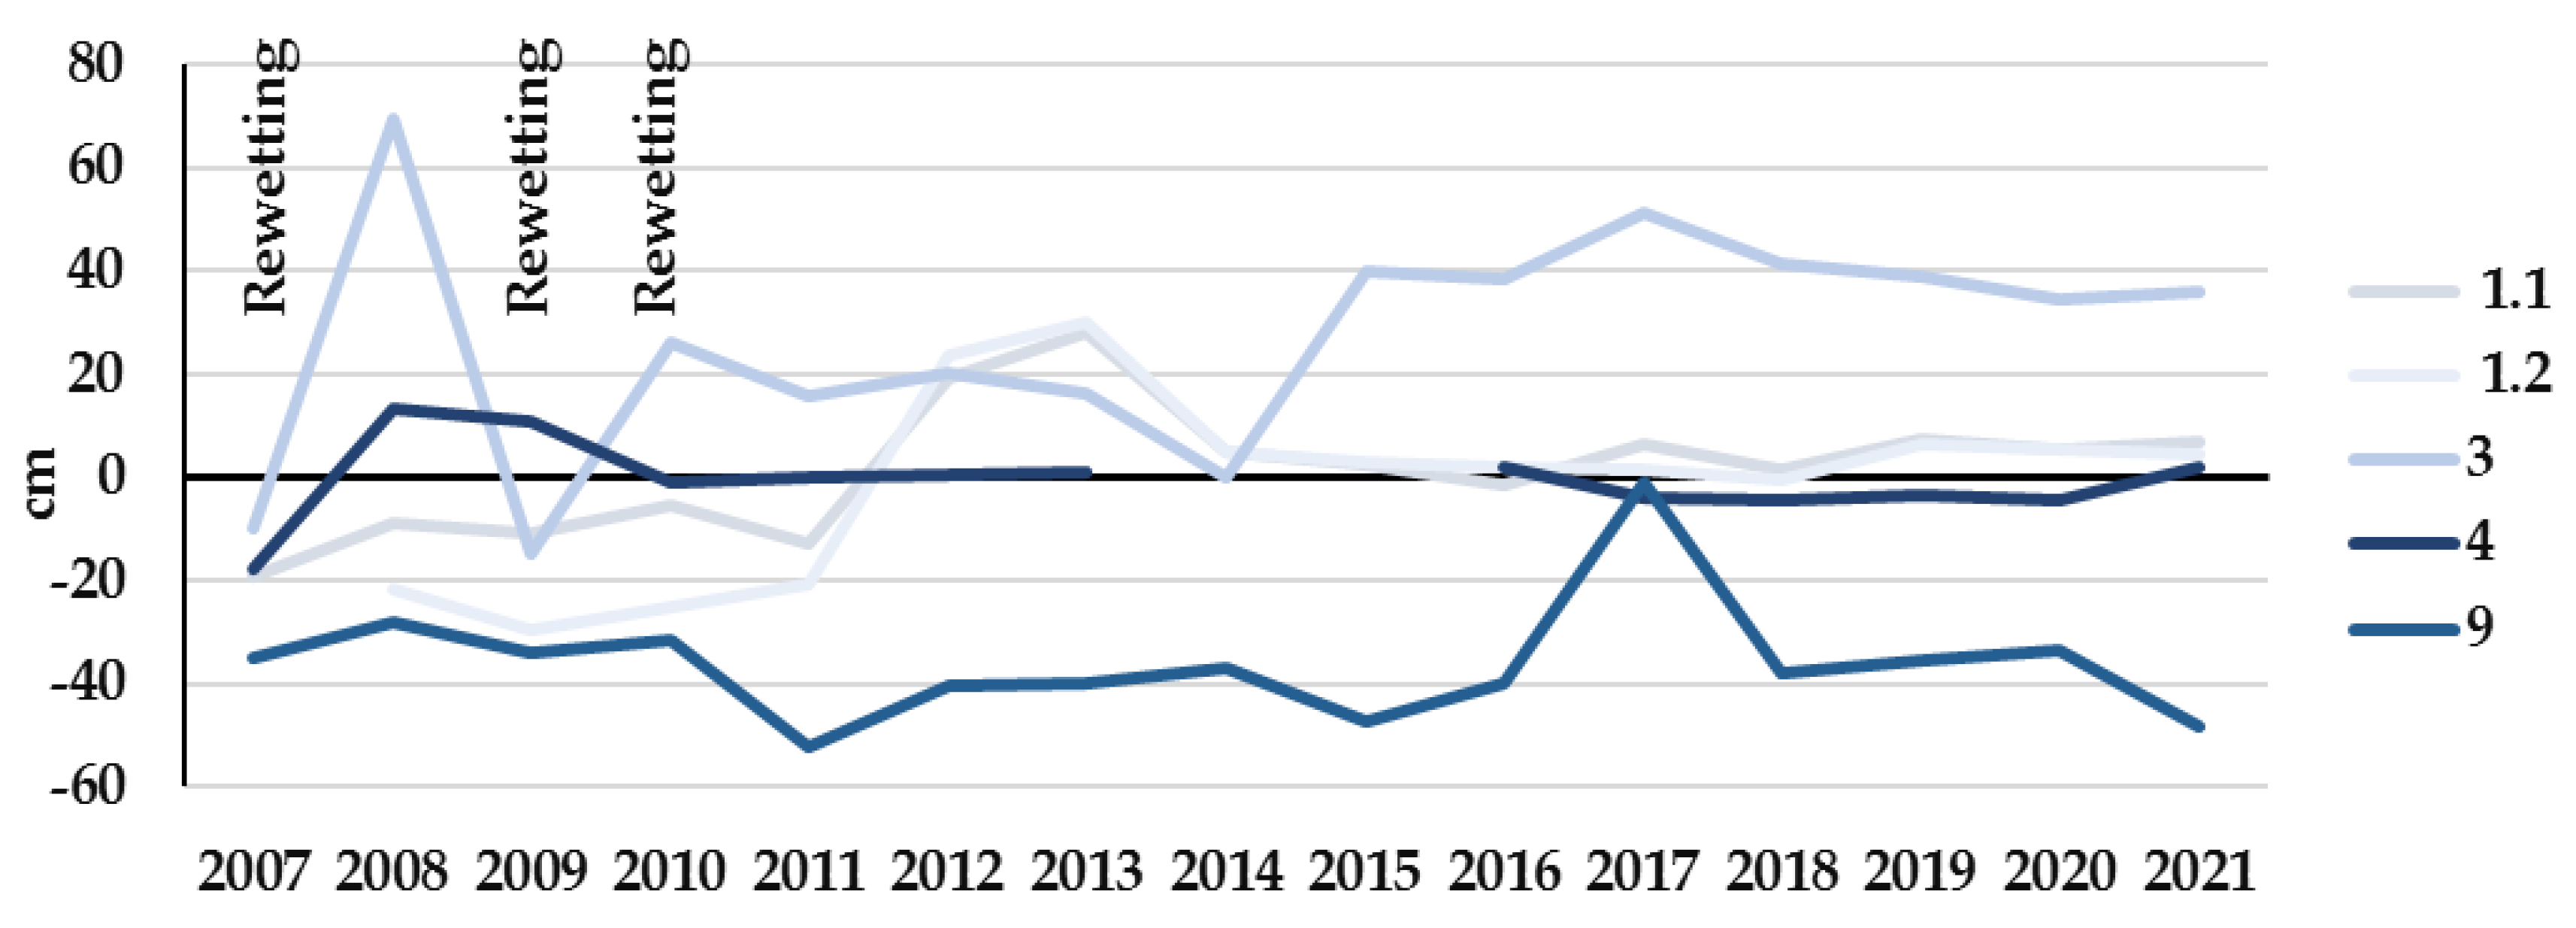
GWLs determine the moisture content of the root zone, conditions of vegetation development, and the level of fire hazard. A significant increase in GWLs during the growing season of 2008 was due to the large amount of precipitation in the spring and summer period (Figure 5). A sharp increase in GWLs at plot No. 3 (Figure 6) occurred after rewetting activities were conducted. In 2009, all plots showed a decrease in the GWLs during the growing season, which is explained by scarce precipitation and low water storage in snow. 2010 was marked by abnormally high summer temperatures and catastrophic fires in July and August, although GWLs were quite high in early summer due to spring and early summer precipitation (194 mm and 65 mm, respectively). Additionally, rewetting activities were carried out on the Tasinsky peatland, which contributed to the rise in GWLs on plots No. 1, 3, 4, and 9. During the hot, dry summer of 2011, a significant decrease in the GWLs was observed everywhere. In 2012, GWLs increased, except for plot No. 2. Water storage in snow was at the maximum for the whole period of observation, also, precipitation in spring and summer was higher than the norm.
In 2013, there were no clear trends in GWL changes. In 2014, the GWLs decreased for rewetted plots, while there were no particular changes at other plots. This was also the case in the following years: 2015, 2016, and 2017. In 2018, there were decreases in GWLs across all plots, which is attributed to minimal water storage in snow and low precipitation in the first two summer months. However, for flooded plots No. 5, 6, and 7, whose GWLs were close to natural, this decline was smoother. In 2019, there were slight increases in GWLs for most plots (exception No. 3), and there were no apparent changes in 2020 and 2021.
For the plots related to the rewetted areas (No. 1, 3, 4), the GWLs in the growing season during the years of observation were almost always higher than the soil surface and did not fall below −5 cm. Plots No. 5–7 belong to the quarry sites. Their vegetation cover is close to the natural one. Here, the GWLs did not fall below −10 cm, which corresponds to the GWLs in natural mires. The exception was the anomalous year of 2010. The minimum values of GWLs were on plots No. 2, 8, 9 and 10. For these plots, sharper fluctuations of the GWLs depending on external factors (water storage in snow, precipitation) are typical. Plot No. 9 was also in the rewetted area, but the well was installed 15 m to the south, and we installed an additional well in 2020.
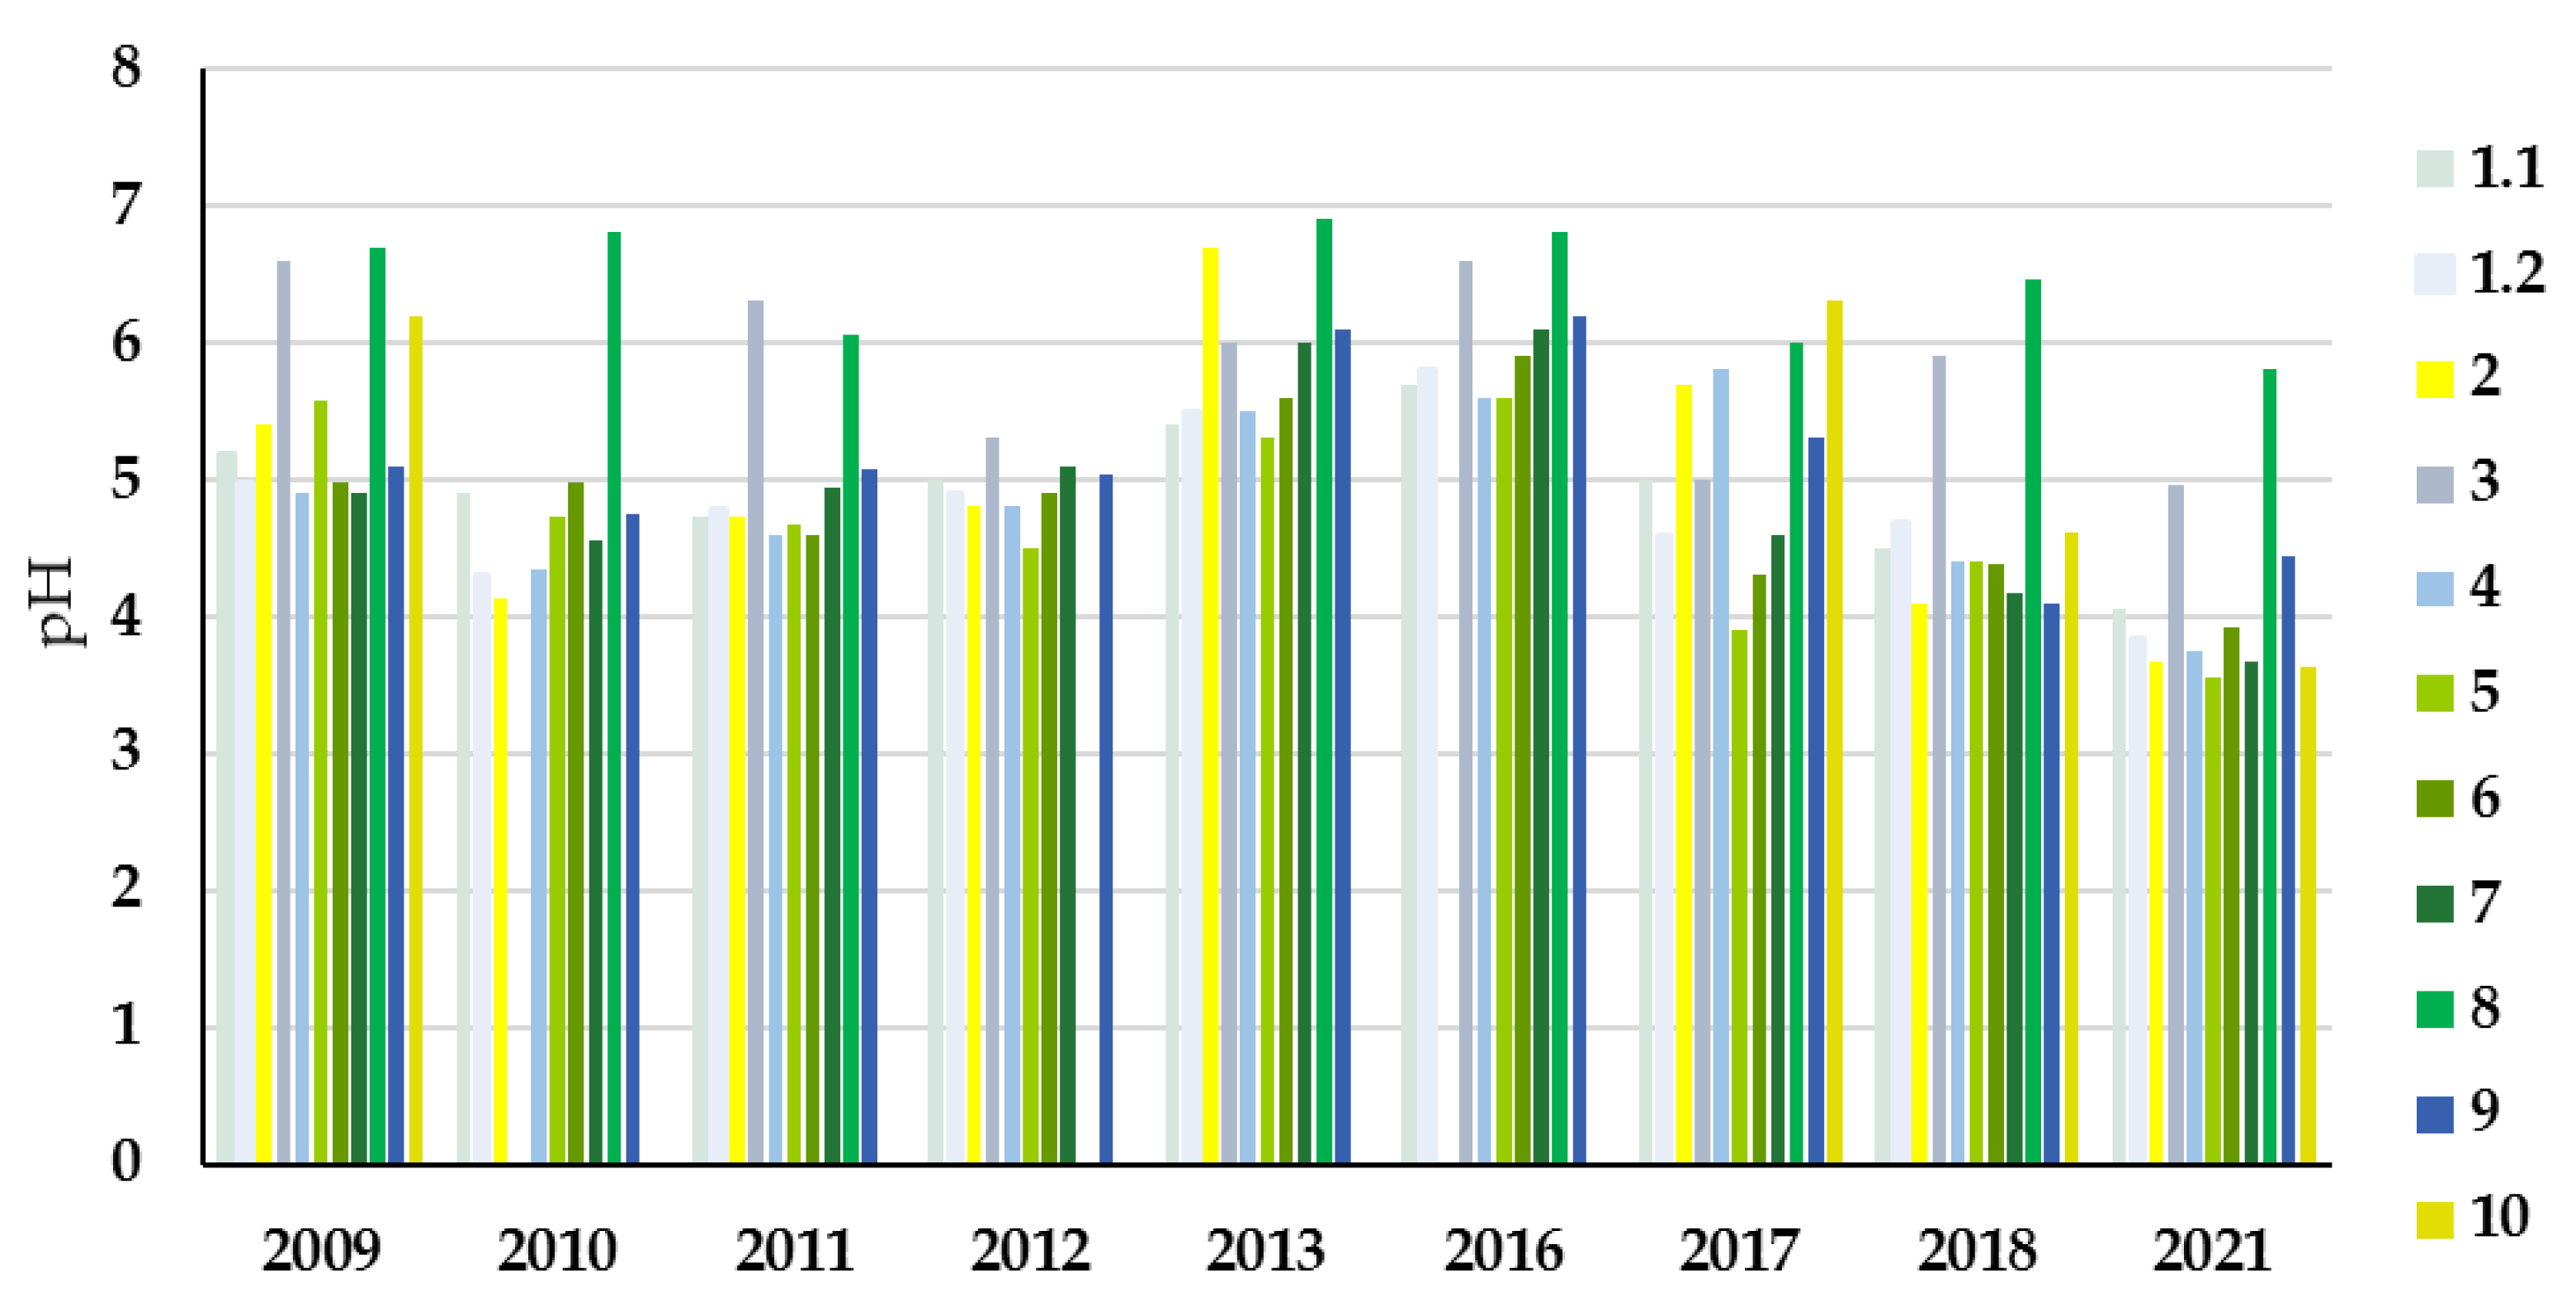
The average pH values during the growing season at the monitoring plots ranged from 6.8 to 3.56 (Figure 7). At the peat quarrying sites (No. 5–7), where the wells were installed in sphagnum moss communities, the average pH values were 4.69–4.9. The maximum (neutral) pH values were on the plots where there was no peat: No. 8 was fully worked, and No. 10 is located on the edge of the peatland where no peat was extracted, but where only machinery was based. Neutral pH values (6.6–5) were also present at No. 3 (an open pool without sphagnum mosses). The other sites in the rewetted area had lower pH values, which, in our opinion, can be explained by the presence of sphagnum mosses (No. 1 and 4).
Changes in pH values from year to year are traced. On the majority of plots there was a sharp decrease in pH values in 2010, a slight increase in 2011 and 2013, a sharp increase in 2013, and then again in 2016. 2017 saw a shape decrease, followed by a slight increase in 2018, and finally a decrease in pH in 2021. These trends relate to the amount of precipitation: the less precipitation fell during the growing season, the lower pH values, and vice versa; in the case of abundant precipitation, the average pH values increase.
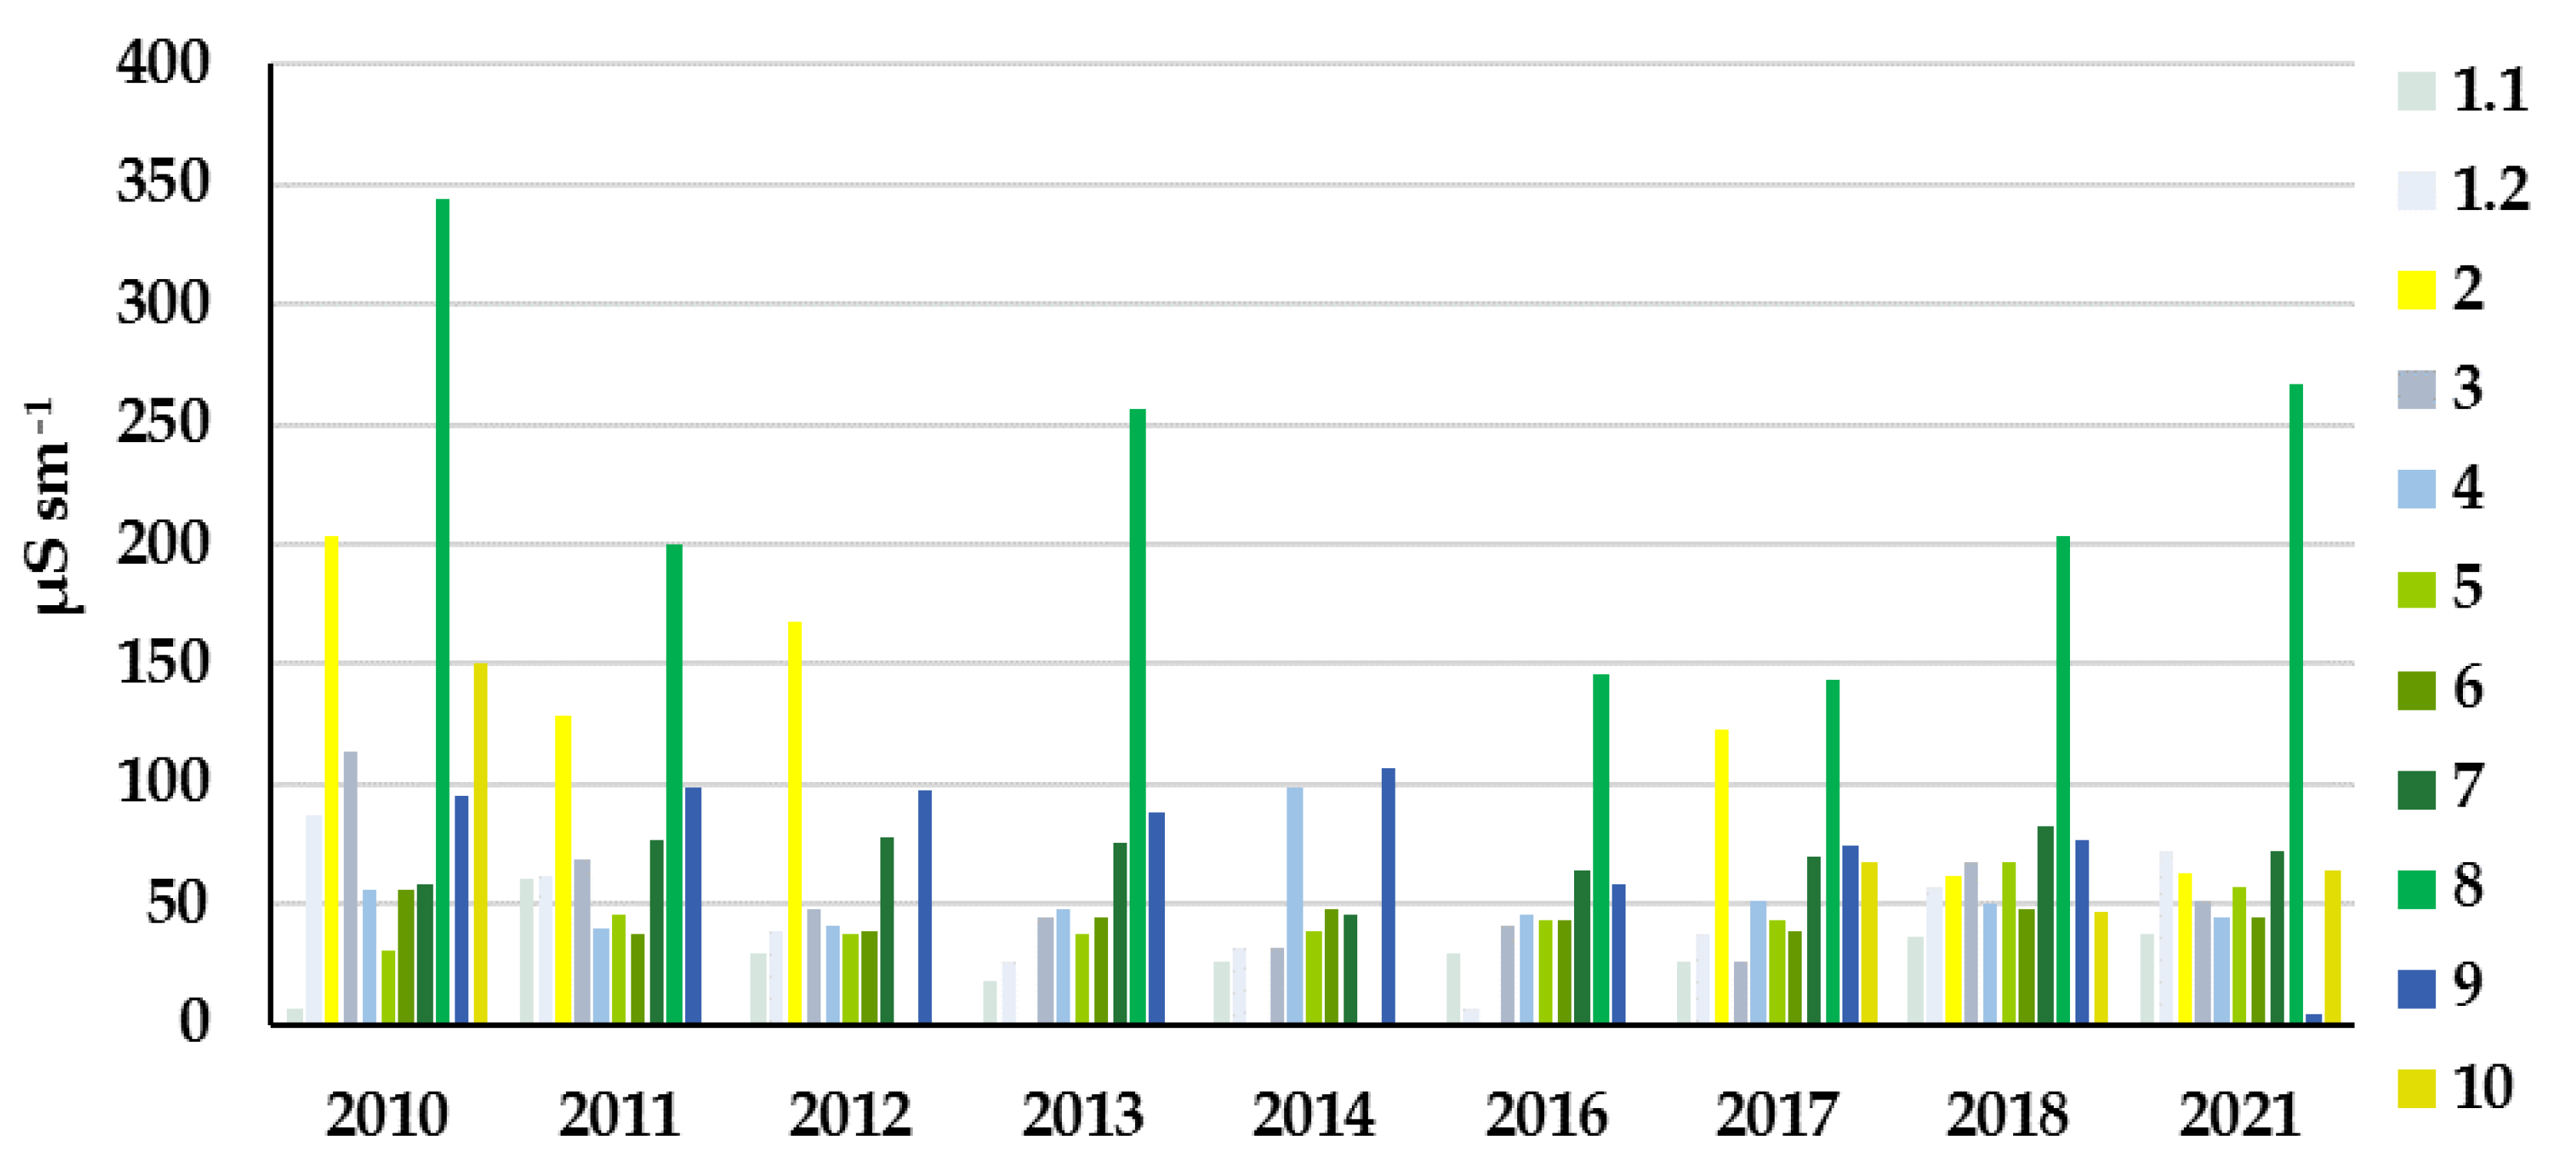
The average values of electrical conductivity during the growing season on the monitoring plots varied generally within a wide range from 4 to 344 µS cm−1 (Figure 8). The maximum values were observed at plots No. 2, 8 and 10. These were the plots with the lowest values of GWL during the vegetation period. It is relevant to note that forest communities are forming at these sites. Sites with the lowest values of conductivity were plots No. 1, 5 and 6. At plot No. 1, where two wells for GWL monitoring were installed due to relief irregularities, electrical conductivity values within one site (wells 1.1. and 1.2) differ significantly. Electrical conductivity values of ≥50 µS cm−1 and ≤40–50 µS cm−1 can serve to divide peatlands into “rich” and “poor” [58] and are used in particular by the IPCC for rewetted peatlands [59].
The change in the average electrical conductivity values over the observation period manifested differently. In 2011 there was a decrease in values at all plots, except for No. 1.1, 7 and 9. In 2012 there was a decrease in values at plots No. 1 and 3. In 2013 there was a decrease at plots No. 1, 3 and 9. In 2014, at plots No. 9 and 4, electrical conductivity values increased significantly, reaching their maximum values for the entire observation period. In 2016, sites 4, 9, and 1.1 showed a decrease in electrical conductivity. In other periods, no obvious changes were observed.

3.3. Vegetation Changes

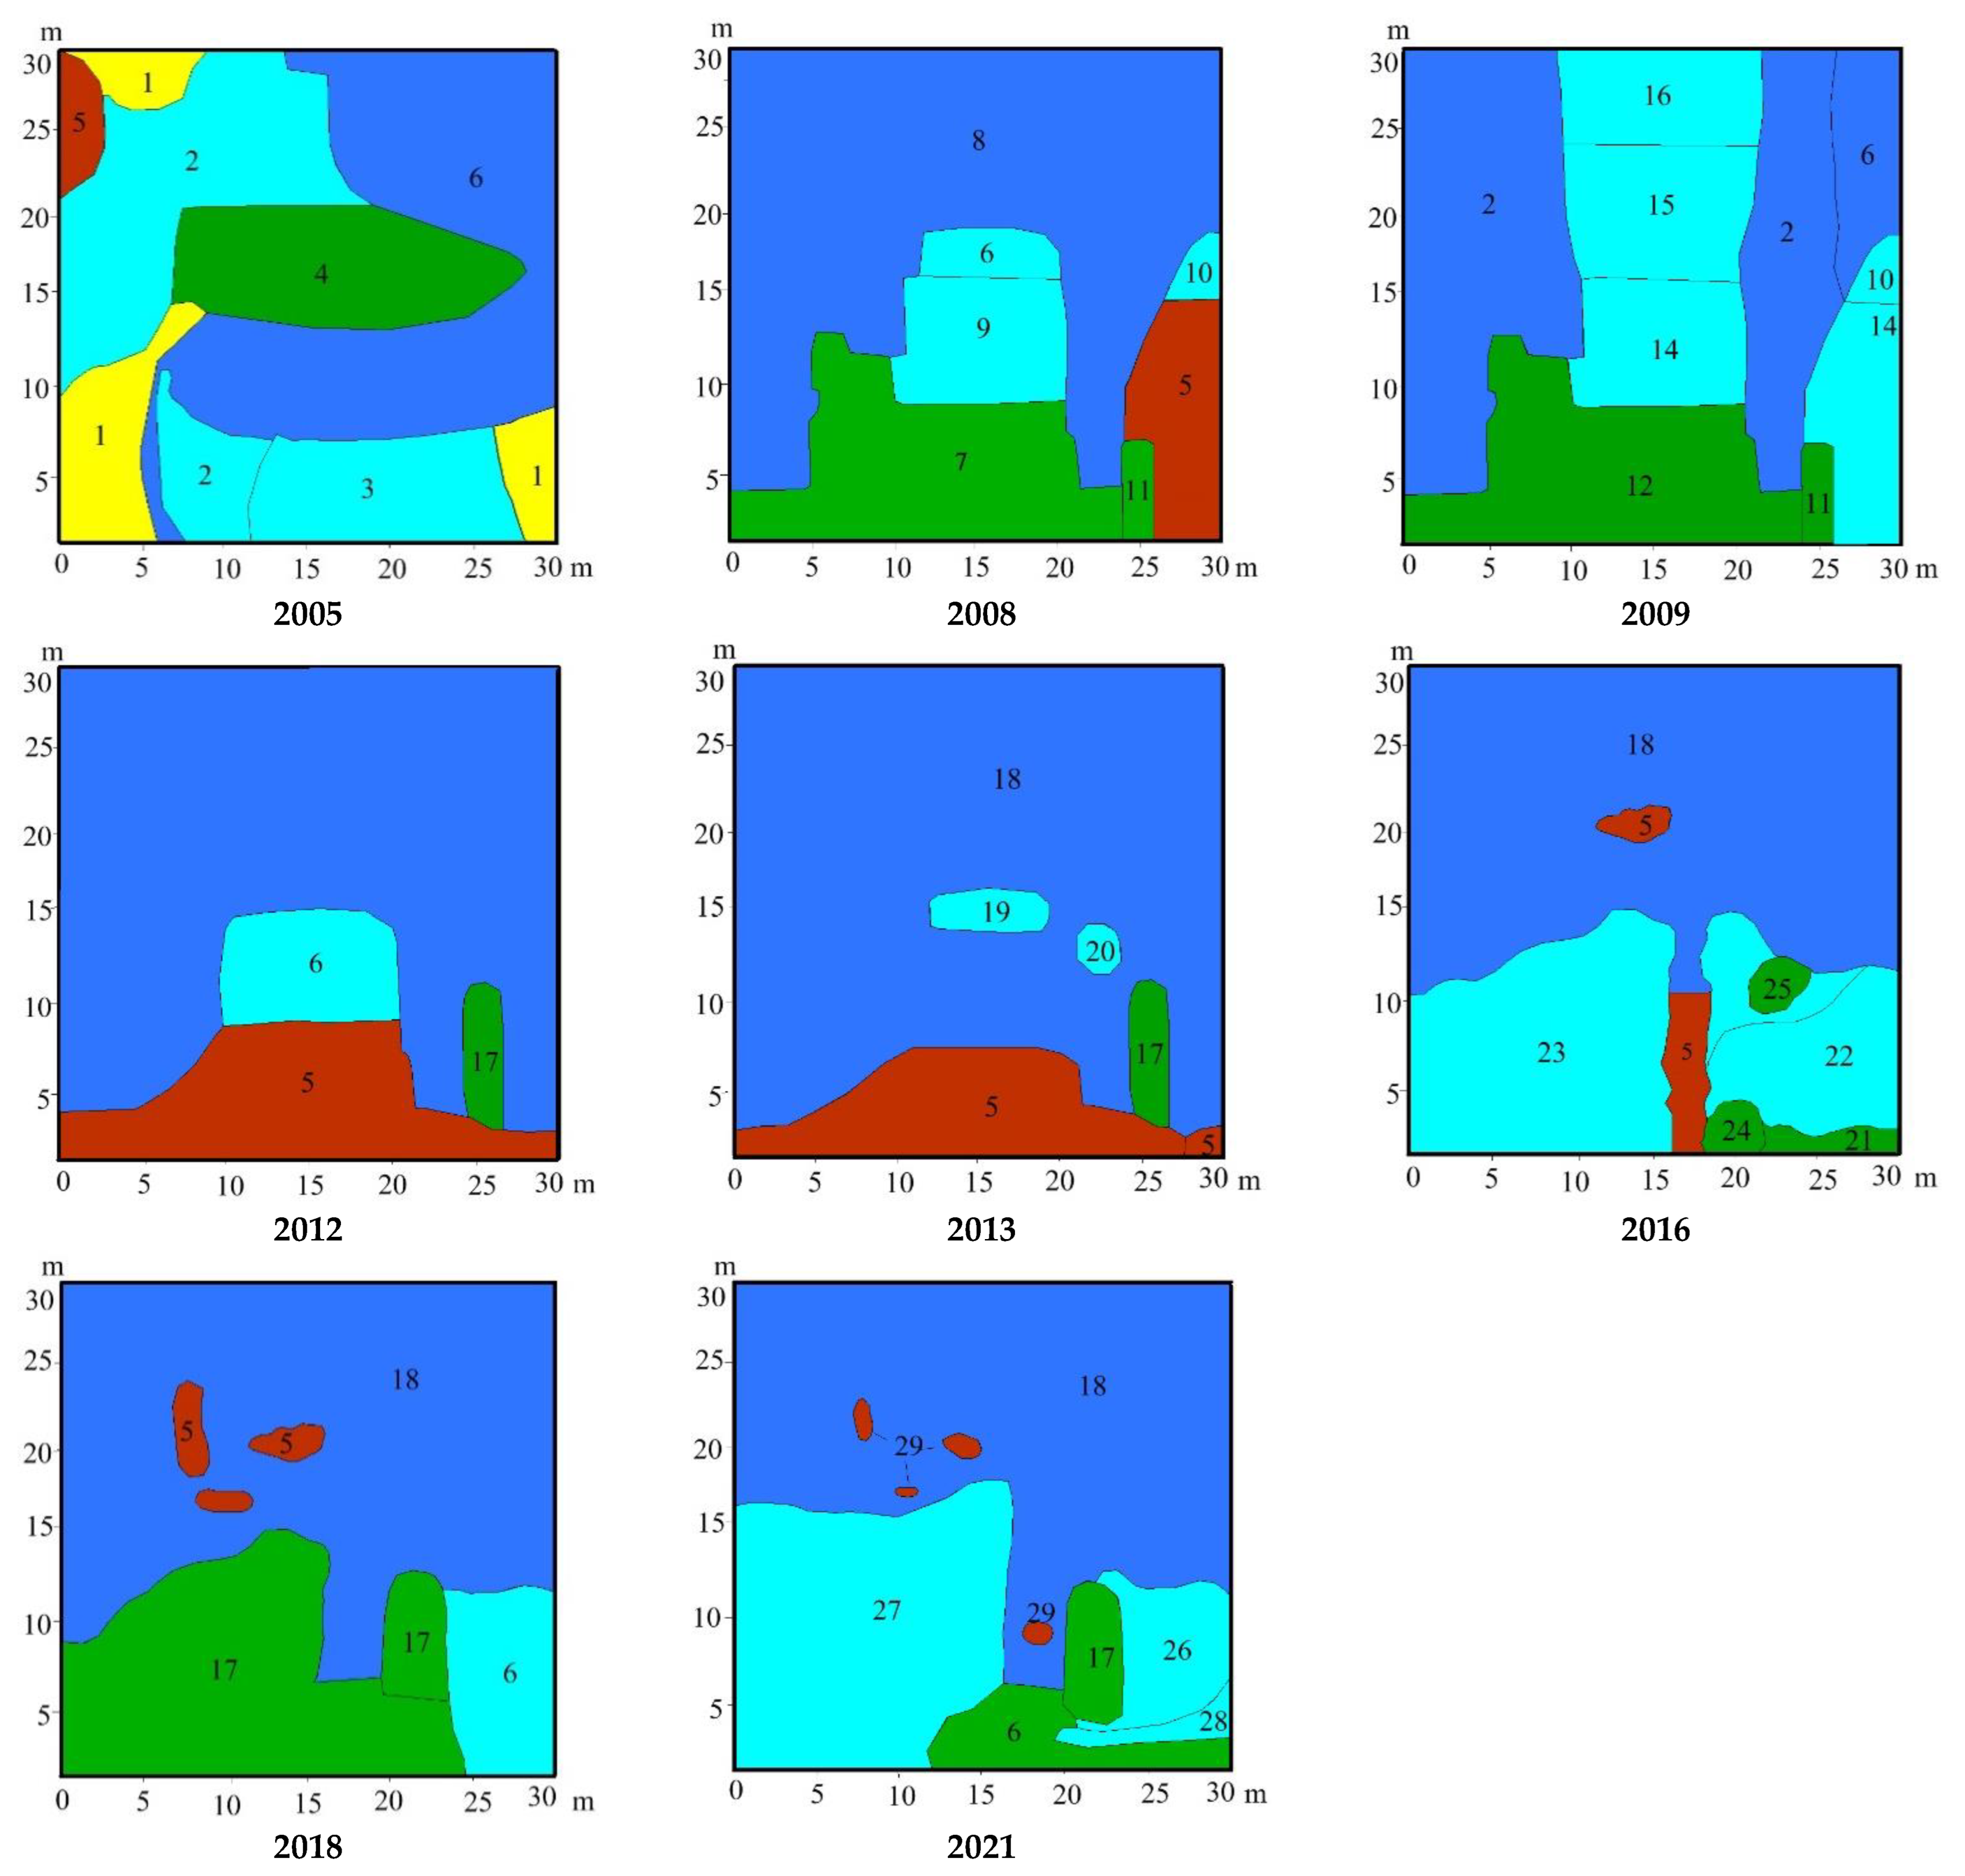
Depending on the method of peat extraction, all plots were divided into quarry and milling sites. Plots No. 5–7 belong to the areas of peat extraction by the machine-forming method. This method of quarrying is one of the gentlest. Peat was extracted in this manner from the peat bogs within the National Park’s boundaries until 1954, and by the beginning of our research the process of restoring the mire vegetation, had lasted for 50 years or more. We observed the final stage of natural restoration of mire communities. During the study period, all sites changed insignificantly, which indicates the final stage of succession. On plots No. 6 and 7, no significant changes in vegetation cover were observed during the study period. The maintenance of a favorable moisture regime contributes to the development of sphagnum moss communities (Figure 9 and Figure 10).View of the monitoring plots from different years of observation (Figure S1).
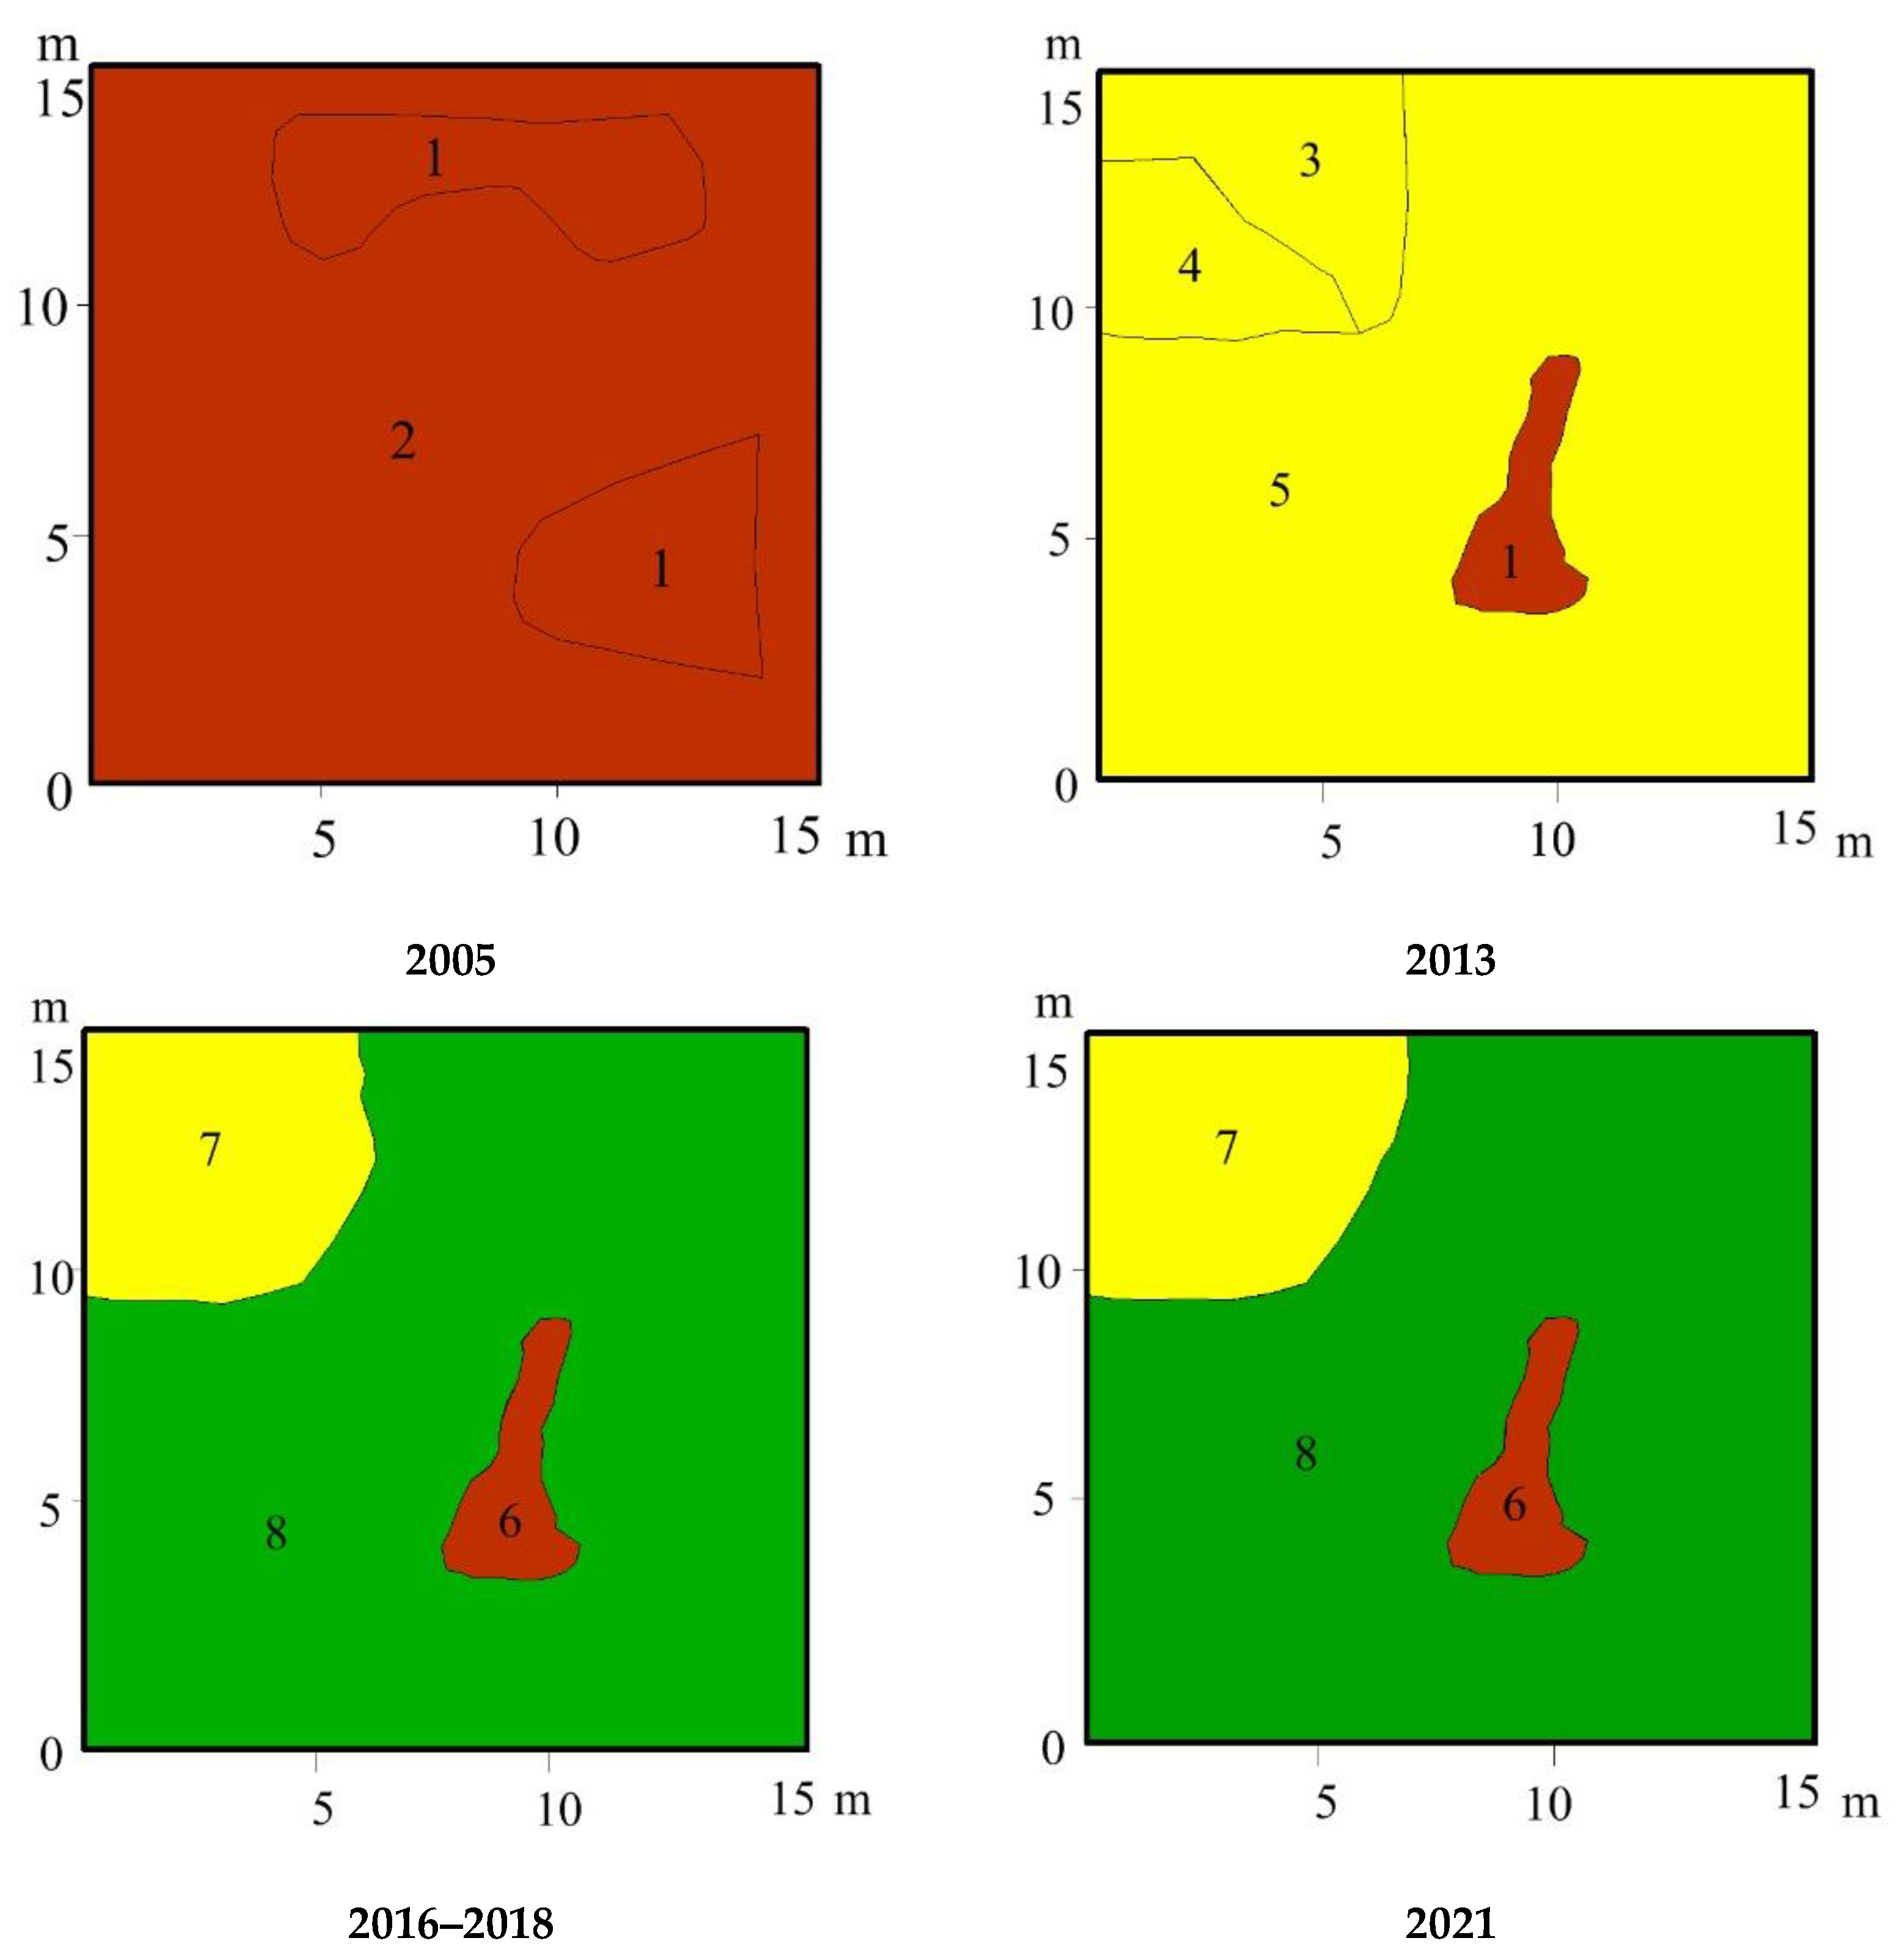
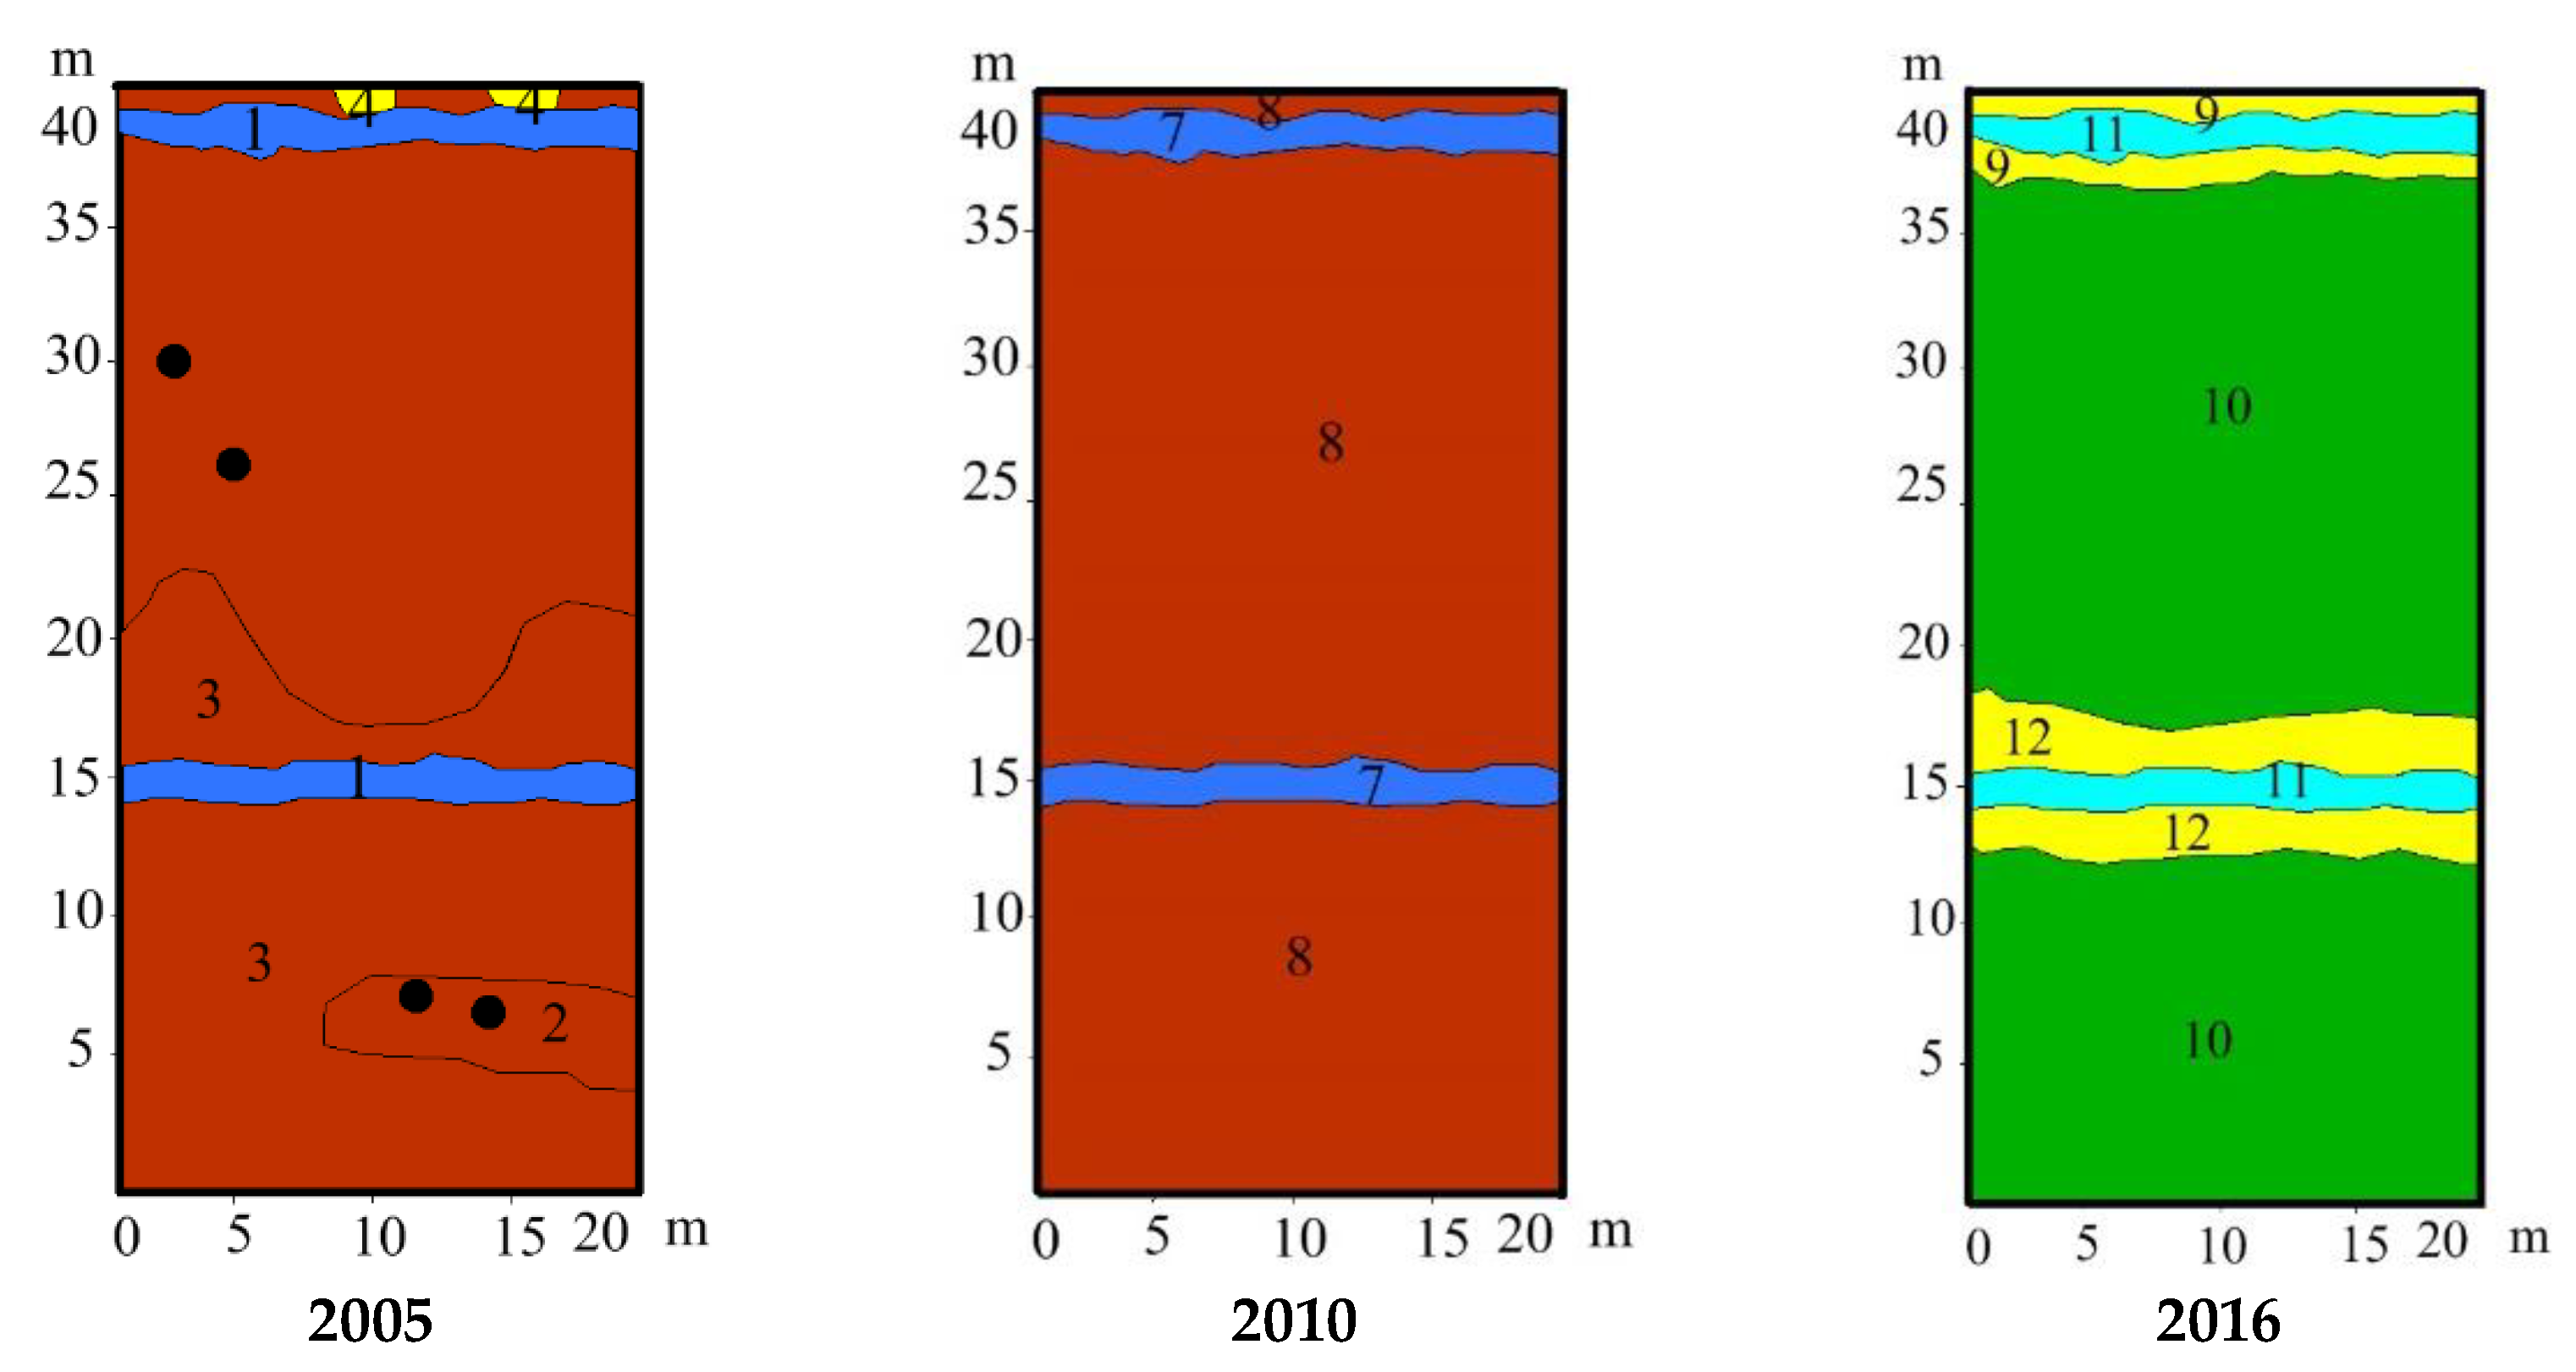
Plot No. 5 was significantly impacted by a 2007 fire that burned the vegetation of the central berm. In 2008, the vegetation of the berm began to recover (Figure 11). Green mosses and introduced species Chamenerion angustifolium and Marchantia polymorpha appeared and disappeared over time (5 and 7 years, respectively). In 2008–2013, the growth of Betula pubescens, Vaccinium uliginosum, and Andromeda polifolia was observed. Nine years after the fire, the vegetation of the berm has completely recovered, except for Pinus sylvestris. Now the vegetation of the berm is represented by the community Betula pubescensVaccinium uliginosumSphagnum fallax. During the study period, overgrowth of the pool iwas observed through the growth of the floating mats–its area decreased from 42% to 18.6% (from 119 m2 to 52.7 m2). Vegetation of the raveline is represented by communities Calla palustrisSphagnum fallax, Carex rostrataSphagnum fallax, and Eriophorum vaginatumSphagnum fallax.
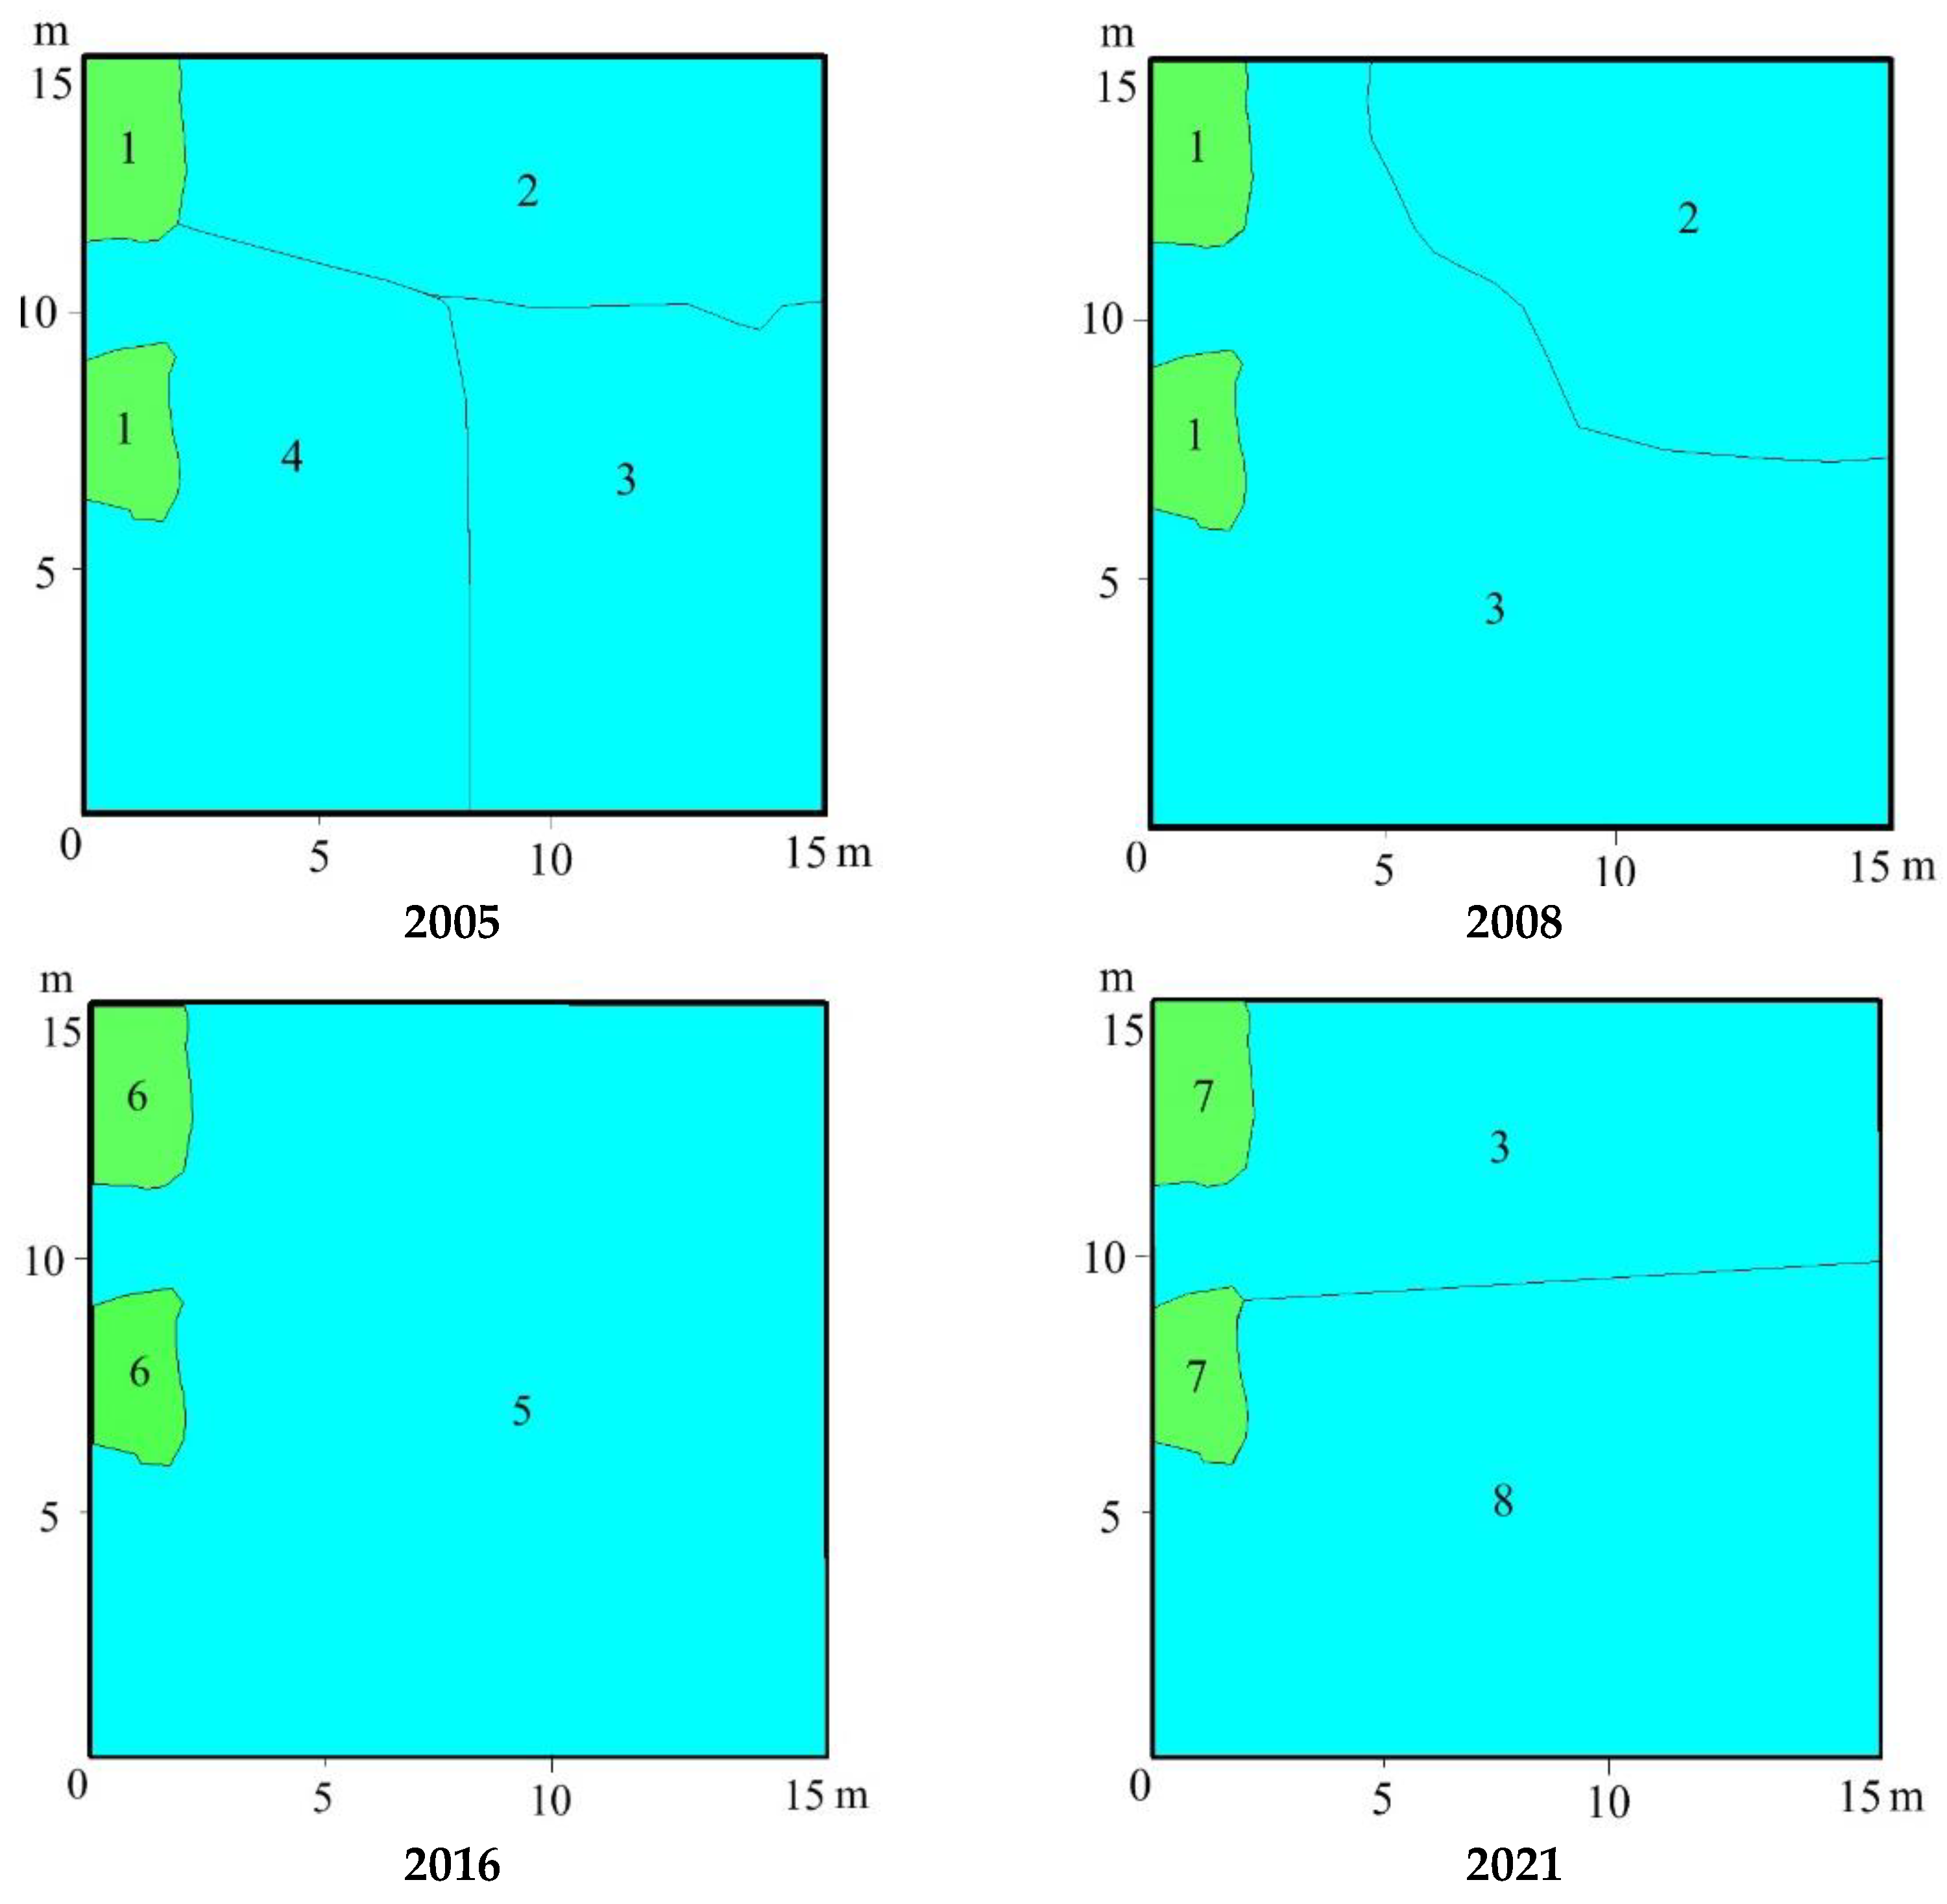
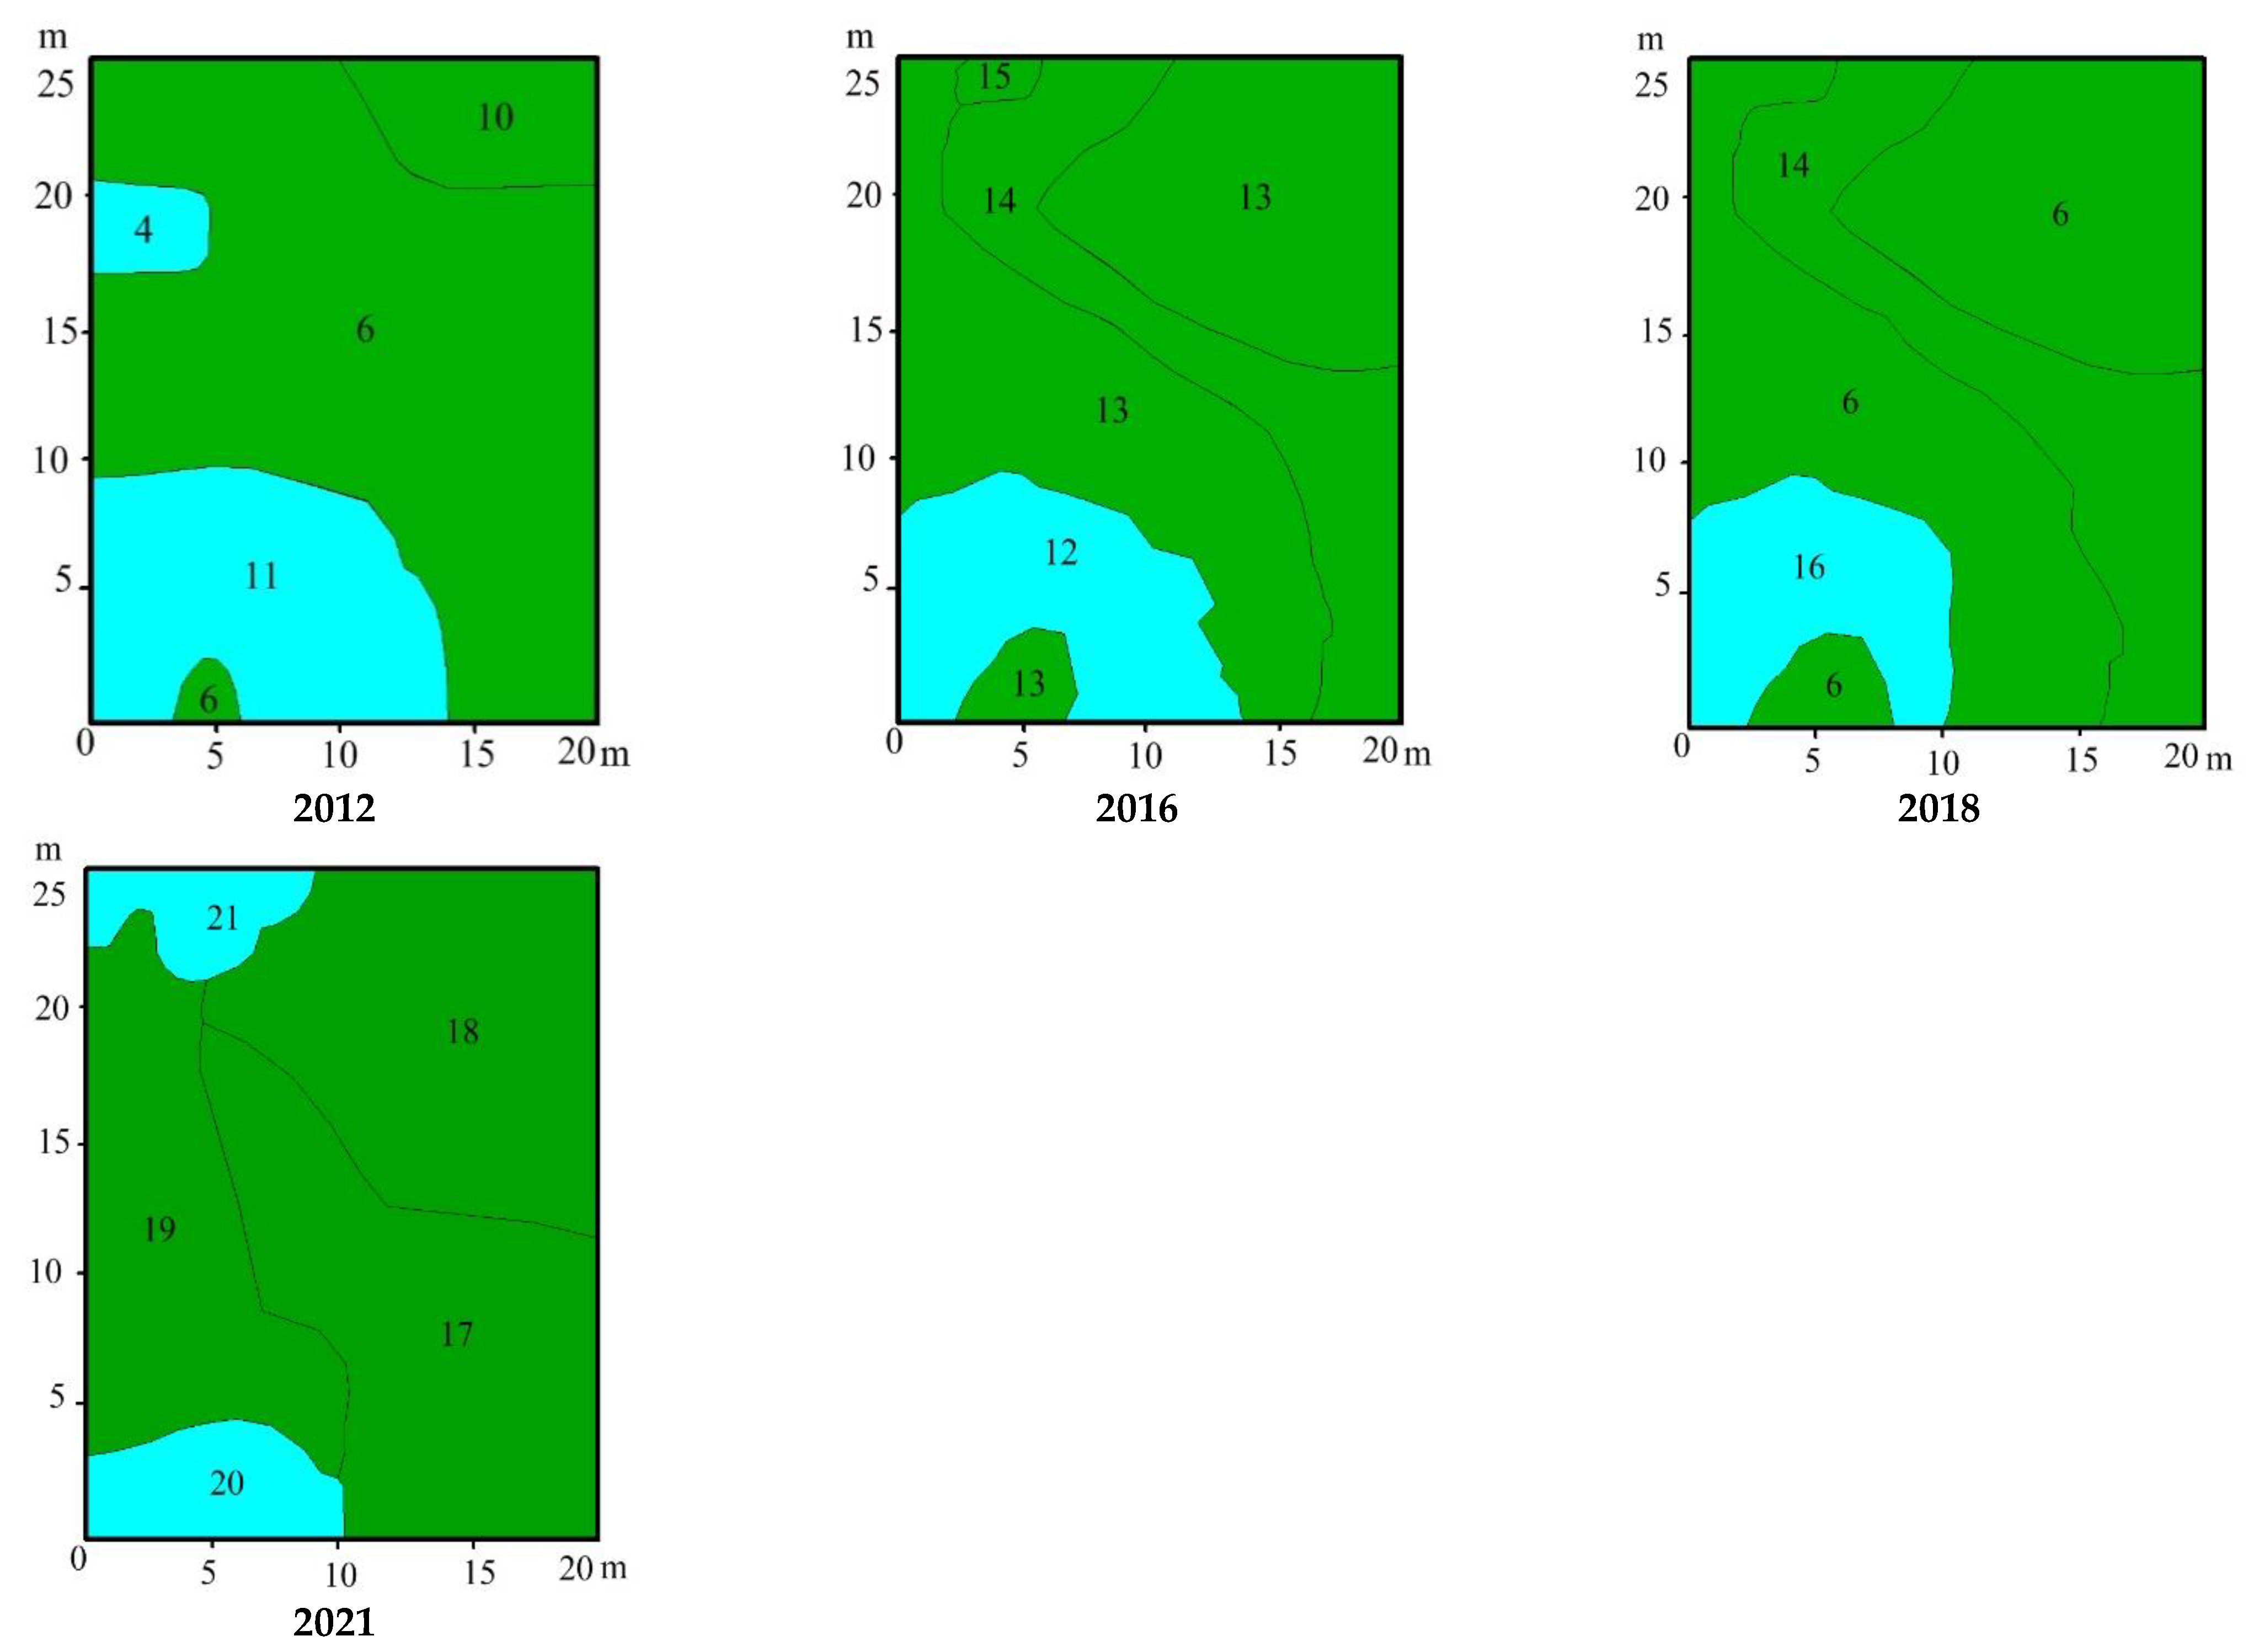
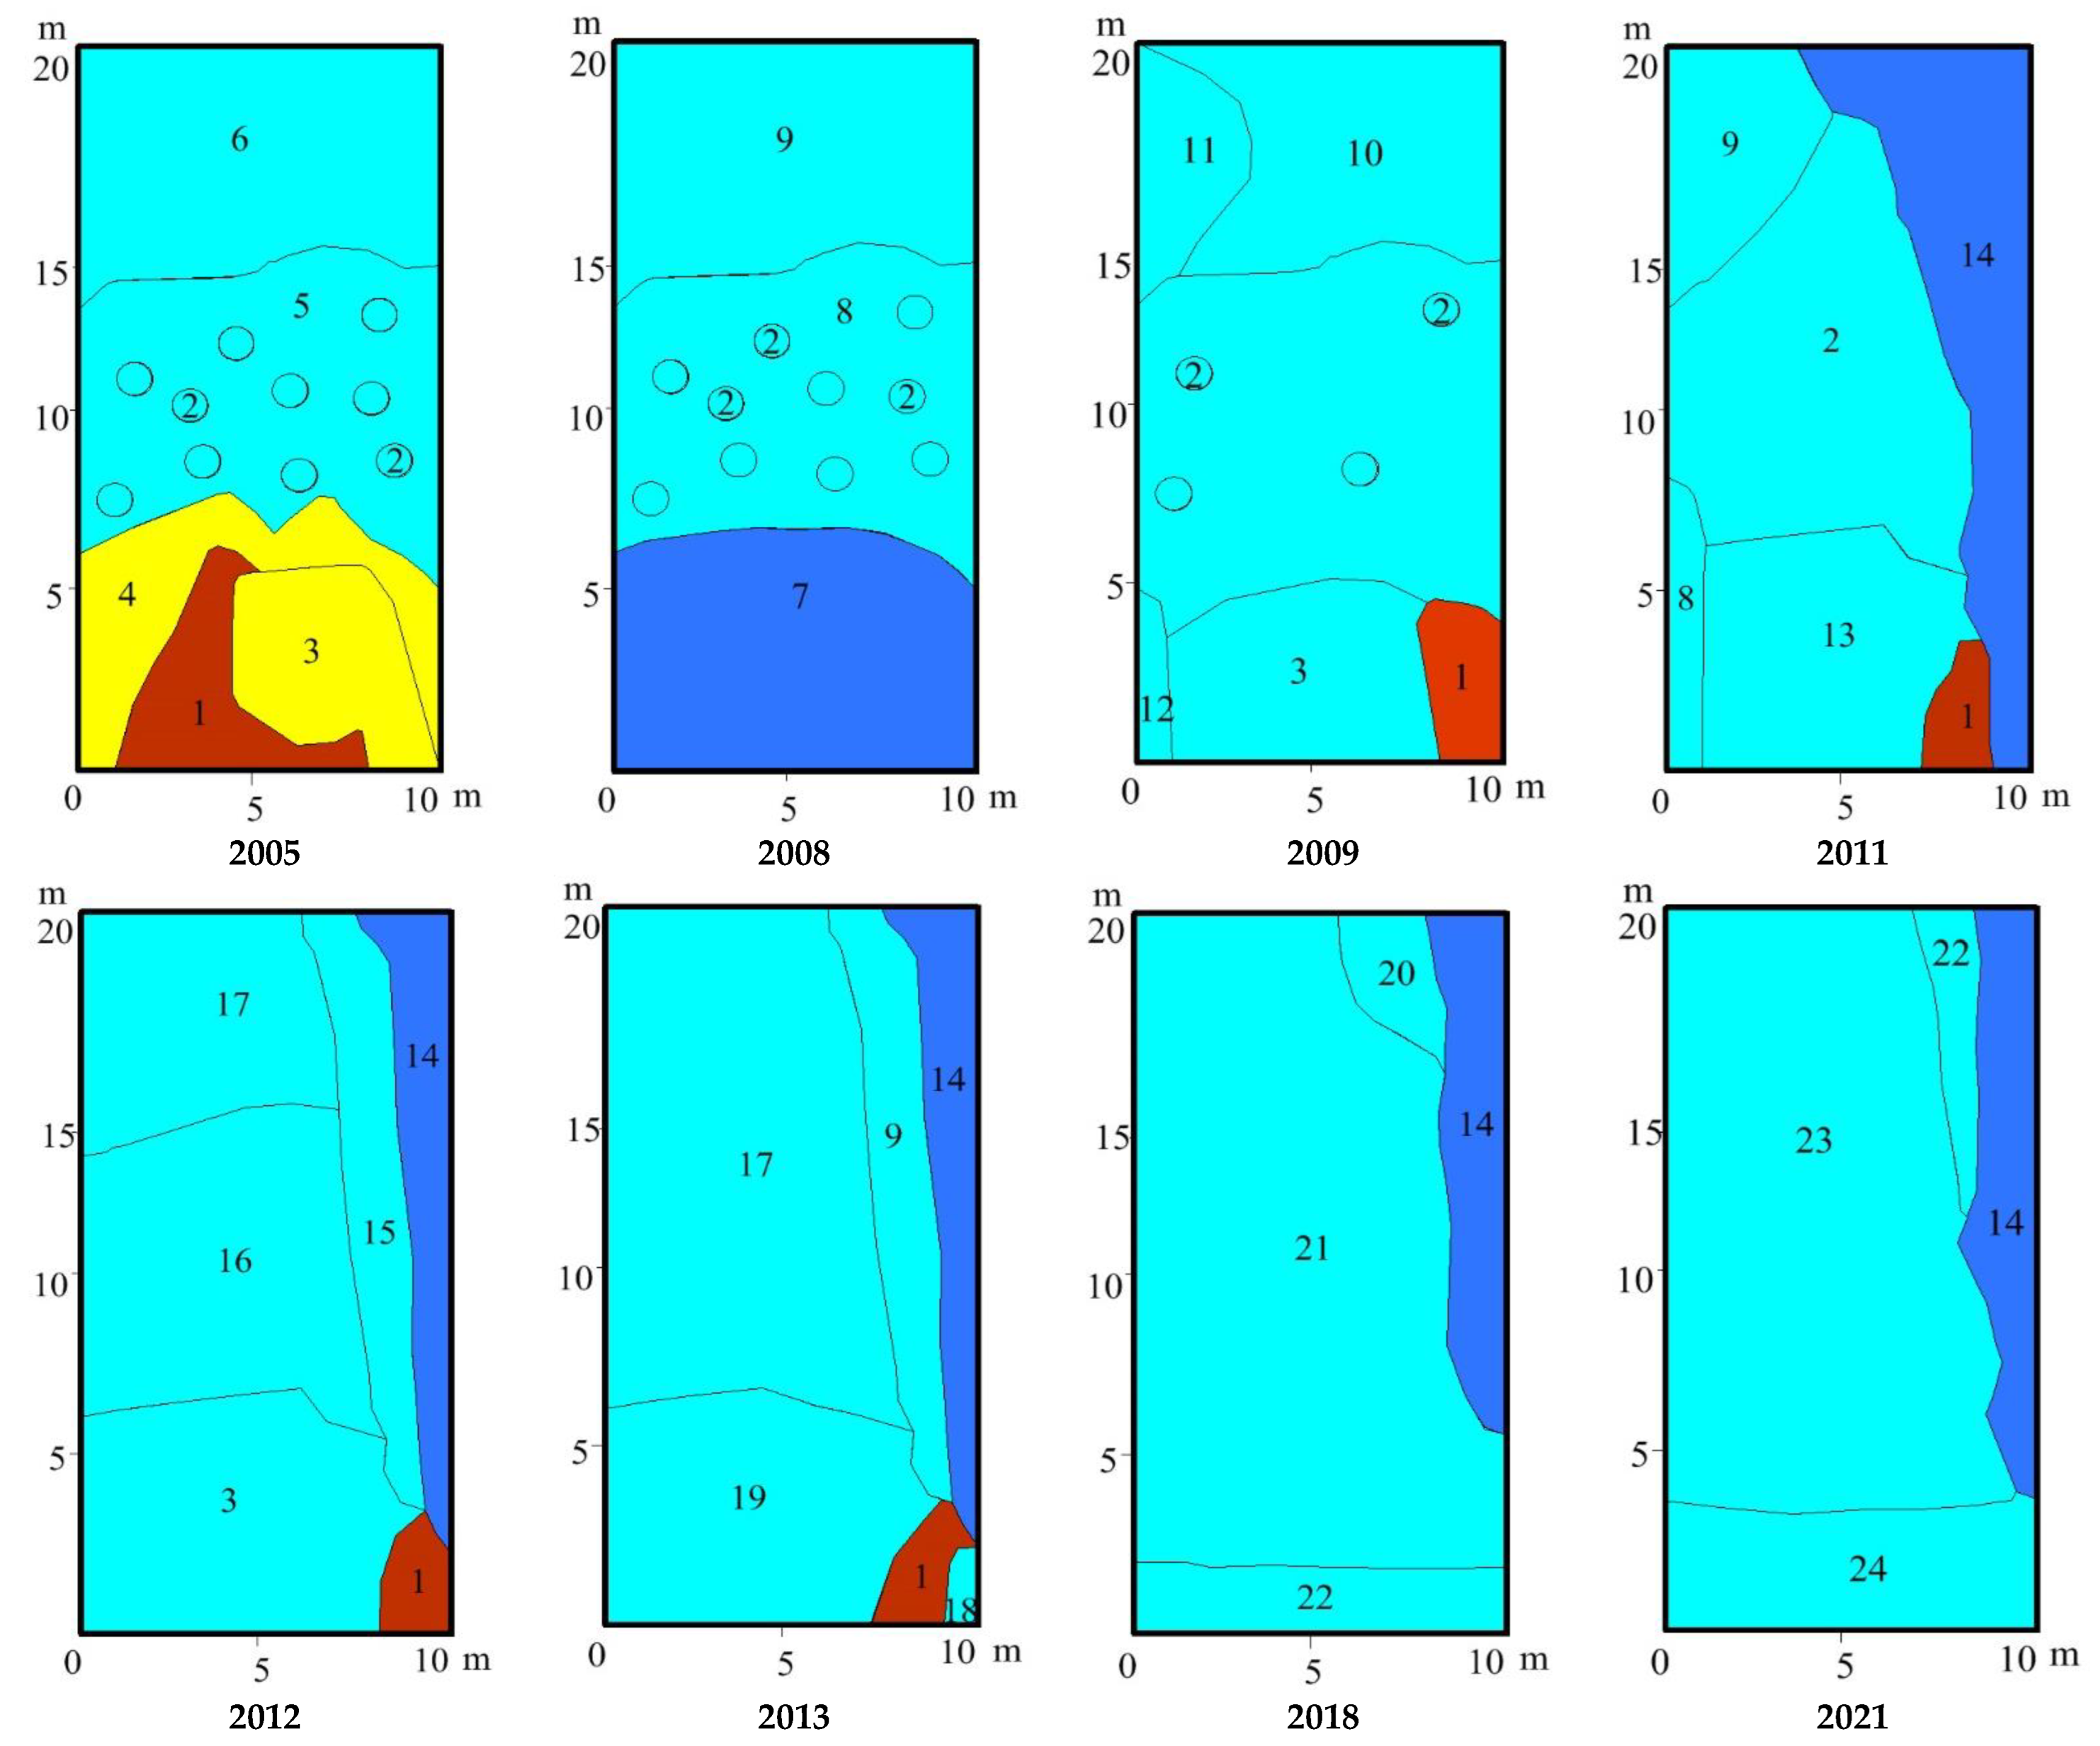
The vegetation of the former milling fields is diverse and is associated with the residual thickness of the peat deposit, site use, and GWLs. The former milling peat extraction sites are represented at plots No. 1–4, 8, 9, and 11. At plot No. 2 (Figure 12), vegetation and the surface peat layer were completely burned in 2007. In 2008 a pioneer community Chamaenerion angustifolium + Calamagrostis epigejosCeratodon purpureus appeared. Six alien species Erigeron acris, Gnaphalium sylvaticum, Hieracium umbellatum, Lactuca serriola, Pilosella officinarum, and Taraxacum officinale, в 2009 – Cirsium vulgare were noted. In 2009–2015 the share of Chamaenerion angustifolium and Marchantia polymorpha gradually decreased. Chamaenerion angustifolium was replaced by Calamagrostis epigejos, and Marchantia polymorpha was replaced by Polytrichum juniperinum. There was a growth of woody plants Betula pubescens, Populus tremula, and shrub Salix aurita. In 2021 an increase in the proportion of green mosses and the appearance of Sciuro-hypnum oedipodium was noted. Now 80% of the site is occupied by young birch–aspen forest, and out of eight alien species, three remained by 2018.
At plot No. 10 (Figure 13), Pinus sylvestris and Frangula alnus were observed to grow in 2008, and the growth of Betula pubescens and Salix cinerea was noted. In the spring of 2009, the vegetation of the canal zone and the main surface area suffered from fire. The number of Betula pubescens and Salix cinerea decreased in the vegetation cover of the near ditch and of the main surface. Species new to the site, such as Gnaphalium sylvaticum, and Molinia caerulea, were noted in the canal area. On the main surface, the projective cover of Chamaenerion angustifolium and Marchantia polymorpha increased. Vegetation of the watered canal changed to Carex rostrata + Comarum palustre, and the new species Carex diandra, C. juncella, Ranunculus repens, and Scirpus radicans were noted in 2012. The slope was populated by xerophilous species of forest edges Nardus stricta, Potentilla erecta, Achillea millefolium, Carex juncella, Deschampsia cespitosa, Luzula multiflora, Luzula pallescens, etc. Leontodon autumnalis and Viola canina appeared in the near ditch community. Sorbus aucuparia, Hieracium umbellatum, Cerastium holosteoides, Ranunculus acris, Potentilla erecta, and Agrostis capillaris appeared on the main surface. The growth of trees was noted. Epilobium montanum, Juncus conglomeratus, Juncus filiformis, Polygonum persicaria, P. lapathifolium, Potentilla norvegica, Taraxacum officinale, Tussilago farfara, Gnaphalium sylvaticum, Urtica dioca, and Festuca rubra disappeared from the vegetation cover. Three years after the fire, Marchantia polymorpha disappeared. In 2013, Juncus conglomeratus, Lythrum salicaria, Luzula multiflora, Platanthera bifolia, and Thyselium palustre appeared in the near ditch community.
Between 2014 and 2016, there was observed growth of young trees Betula pubescens, and Populus tremula, and shrubs Salix cinerea, while the proportion of Deschampsia cespitosa increased, Vaccinium myrtillus, Vaccinium uliginosum, Agrostis canina, Agrostis tenuis, Campanula patula, Carex canescens, C. diandra, C. juncella, C. leporina, Epilobium adenocaulon, Epilobium palustre, Eriophorum angustifolium, Juncus effusus, Leontodon autumnalis, Luzula pallescens, Lupinus polyphyllus, Molinia caerulea, Nardus stricta, Platanthera bifolia, Ranunculus repens, Rumex acetosella, Scirpus radicans, Thyselium palustre, Tussilago tarfara, Veronica officinalis, Veronica scutellata, and Viola canina disappeared. Conversely, Agrostis gigantea, Carex lasiocarpa, Carex nigra, Carex rostrata, Cirsium setosum, Dactylorhiza maculata, Elytrigia repens, Epilobium montanum, Galium mollugo, Persicaria lapathifolia, Potentilla intermedia, Potentilla norvegica, Scirpus sylvaticum, Urtica dioica, and Viola epipsila appeared. In 2017–2018 the proportion of reed grass on the main surface decreased, Carex diandra was noted in the ditch, Melampyrum pratense, Pilosella officinarum, and Trientalis europaea on the main surface, and Carex lasiocarpa, Cirsium setosum, Elytrigia repens, Galium mollugo, Persicaria lapathifolia, and Urtica dioica disappeared. In 2021 such grass species as Achillea millefolium, Agrostis gigantea, Epilobium montanum, Lycopus europaeus, Poa pratensis, and Taraxacum officinale disappeared from the vegetation cover. Most of the species that appeared and disappeared on the plot during the study period were alien species (forest edges, roadsides, clearcuts) represented by single plants. A young birch–aspen forest has formed on the plot, while there has been no recovery of mire vegetation.
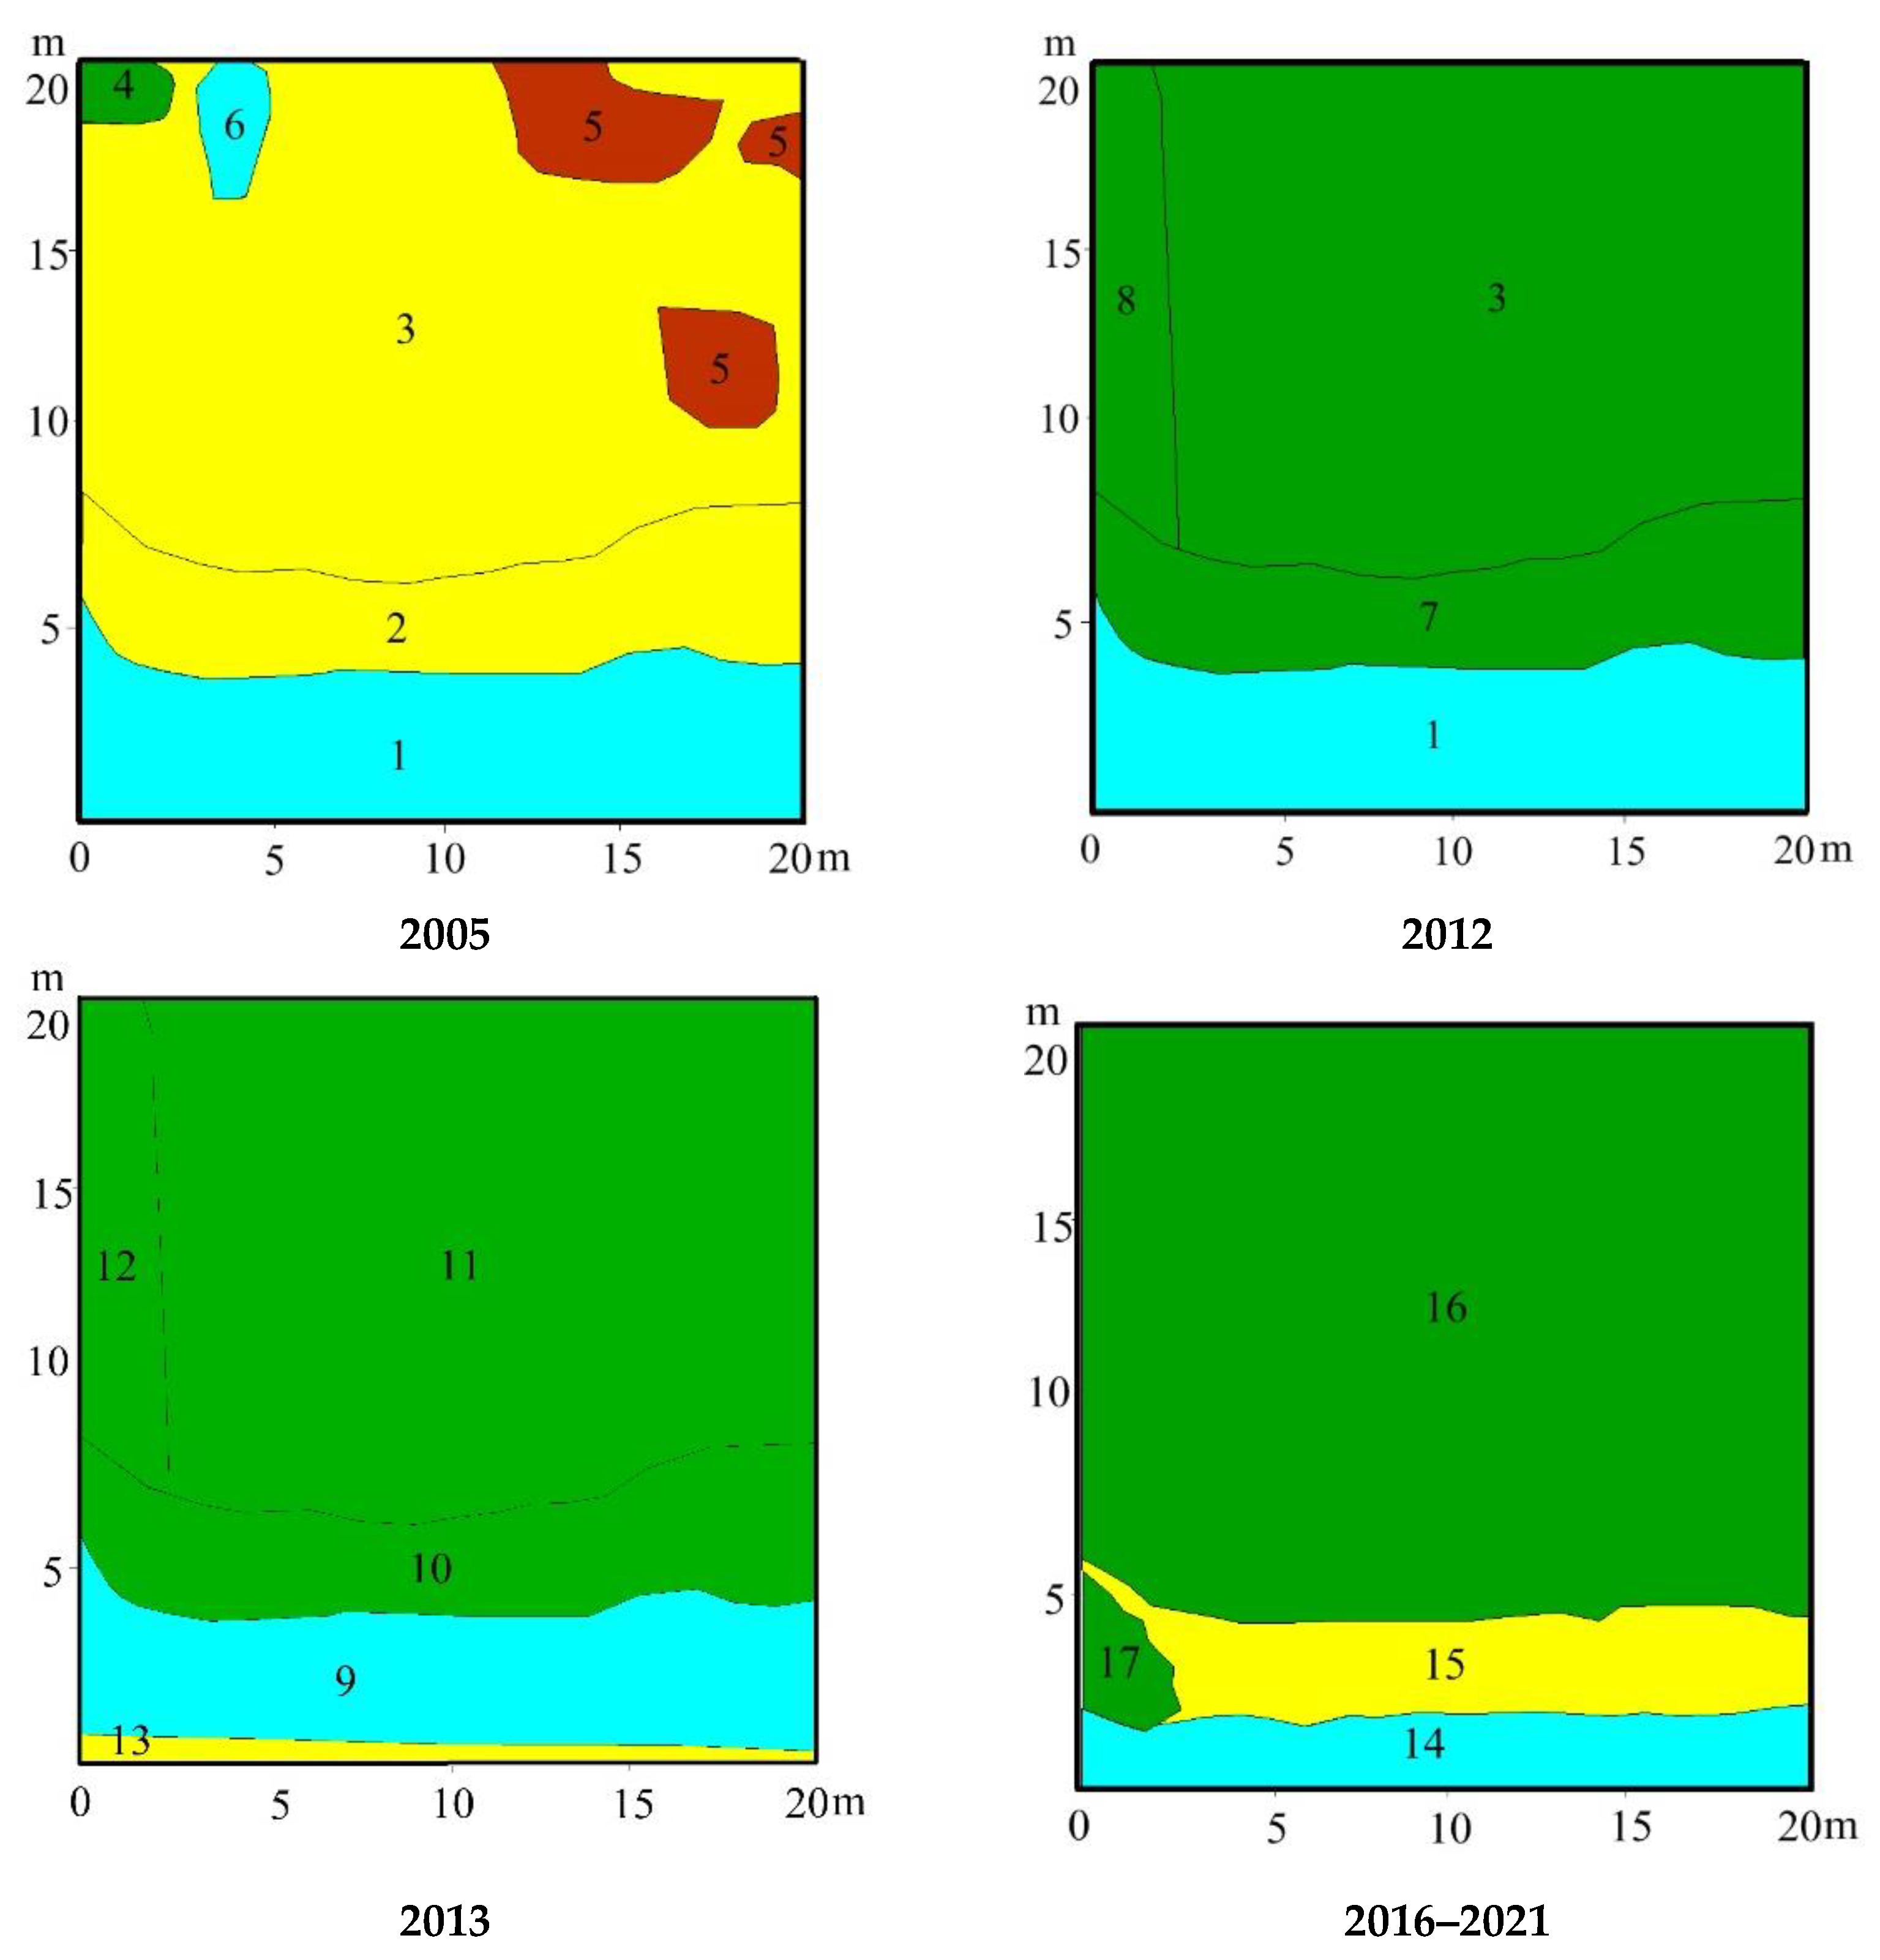
On plot No. 8 (Figure 14), in 2008 the main surface showed an increase in the shoots of Betula pubescens and Salix cinerea, an increase in the proportion of Calamagrostis epigejos and Marchantia polymorpha, the new species Populus tremula, Agrostis canina, and Alisma plantago-aquatica appeared. The abundance of Epilobium adenocaulon and Molinia caerulea decreased. Small pools here have dried up. In 2009–2010, Alnus glutinosa appeared at the site and the proportion of Calamagrostis epigejos increased, while plant species of wet habitats were noted—Thyselium palustre, Alisma plantago-aquatica, and Scutellaria galericulata; of deciduous and mixed forests—Ranunculus acris and Melampyrum nemorosum; and of disturbed sites—Tussilago tarfara. Alisma plantago-aquatica and Lemna minor appeared in the pool. In the moss cover, Marchantia polymorpha disappeared due to thick reed grass and leaf litter; it was preserved only in hollows with sedges. The trunks of fallen burnt trees were overgrown with Ceratodon purpureus. In 2012, Cardamine dentata, Carex elongata, and Solanum dulcamara appeared on the plot, the area covered by Chamaenerion angustifolium and Equisetum arvense decreased, while Epilobium adenocaulon, Melampyrum nemorosum, Molinia caerulea, Myosotis caespitosa, Poa pratensis, Potentilla erecta, and Tussilago tarfara disappeared, as Lemna minor and Phragmites australis disappeared in the pool. In 2013, there was growth of young trees Betula pubescens and Salix cinerea, the disappearance of Cirsium setosum, Ranunculus repens, and Solanum dulcamara, and the appearance of Hieracium umbellatum and Juncus effusus were noted.
Between 2014 and 2016, there was intense growth of willow and birch. There was invasion of Agrostis capillaris, Agrostis stolonifera, Angelica sylvestris, Carex diandra, Carex vesicaria, Cicuta virosa, Cirsium arvense, Cirsium palustre, Cirsium oleracium, Cirsium setosum, Deschampsia cespitosa, Dryopteris carthusiana, Epilobium adenocaulon, Potentilla norvegica, Pyrola minor, Pyrola rotundifolia, Scirpus sylvaticus, Solanum dulcamara, Urtica dioica, Agrostis canina, Cardamine dentata, Chamaenerion angustifolium, Hieracium umbellatum, Mentha arvensis have disappeared. A decrease in the abundance of Calamagrostis epigejos was noted, probably due to the strong overgrowth of trees that shade it. In 2017–2018 Alnus glutinosa, Angelica sylvestris, Carex vesicaria, Cicuta virosa, Cirsium oleracium, Epilobium adenocaulon, Galium uliginosum, Juncus effusus, Molinia caerulea, Scirpus sylvaticus, Scutellaria galericulata, Solanum dulcamara, Ranunculus repens, Taraxacum officinale, Thyselium palustre disappeared, and Chamaenerion angustifolium, Convallaria majalis, Mentha arvensis, Poa palustris, Rubus idaeus, and Viola uliginosa appeared. In 2021 Agrostis stolonifera, Carex canescens, Cirsium setosum, Chamaenerion angustifolium, Geum rivale, Potentilla norvegica, and Typha latifolia disappeared. The main part of the plot (70%) was occupied by the community Betula pubescensSalix cinereaCalamagrostis epigejos. The area of the pool varied: in dry years, it dried up completely, while in 2018, it occupied 21% of the plot area. No recovery of mire vegetation was observed, while a young birch forest is forming on the plot.
No GWL monitoring was conducted at plot No. 11 (Figure 15), while vegetation descriptions were made in 2005 and again in 2016. In 2005 the plot was dominated by burnt peat with isolated specimens of Betula pubescens, Vaccinium uliginosum, Andromeda polifolia, and burnt cotton-grass tussocks. A fire apparently occurred again in 2010, as the pine trees were 5–6 years old in 2016. When surveyed in 2016, 77% of the plot was occupied by the Betula pubescensVaccinium uliginosumPolytrichum juniperinum community. Along the edges of the channels, there was a community of Vaccinium uliginosum + Molinia caerulea + Eriophorum vaginatumPolytrichum juniperinum, Vaccinium uliginosum + Eriophorum vaginatum, and in shallow parts of the channel—tussocks with Eriophorum vaginatum and sphagnum hummocks with Sphagnum cuspidatum. At present, forest pine–birch–shrub communities are forming on the plot, but when the GWL increases, conditions for restoration of mire vegetation may be created here.
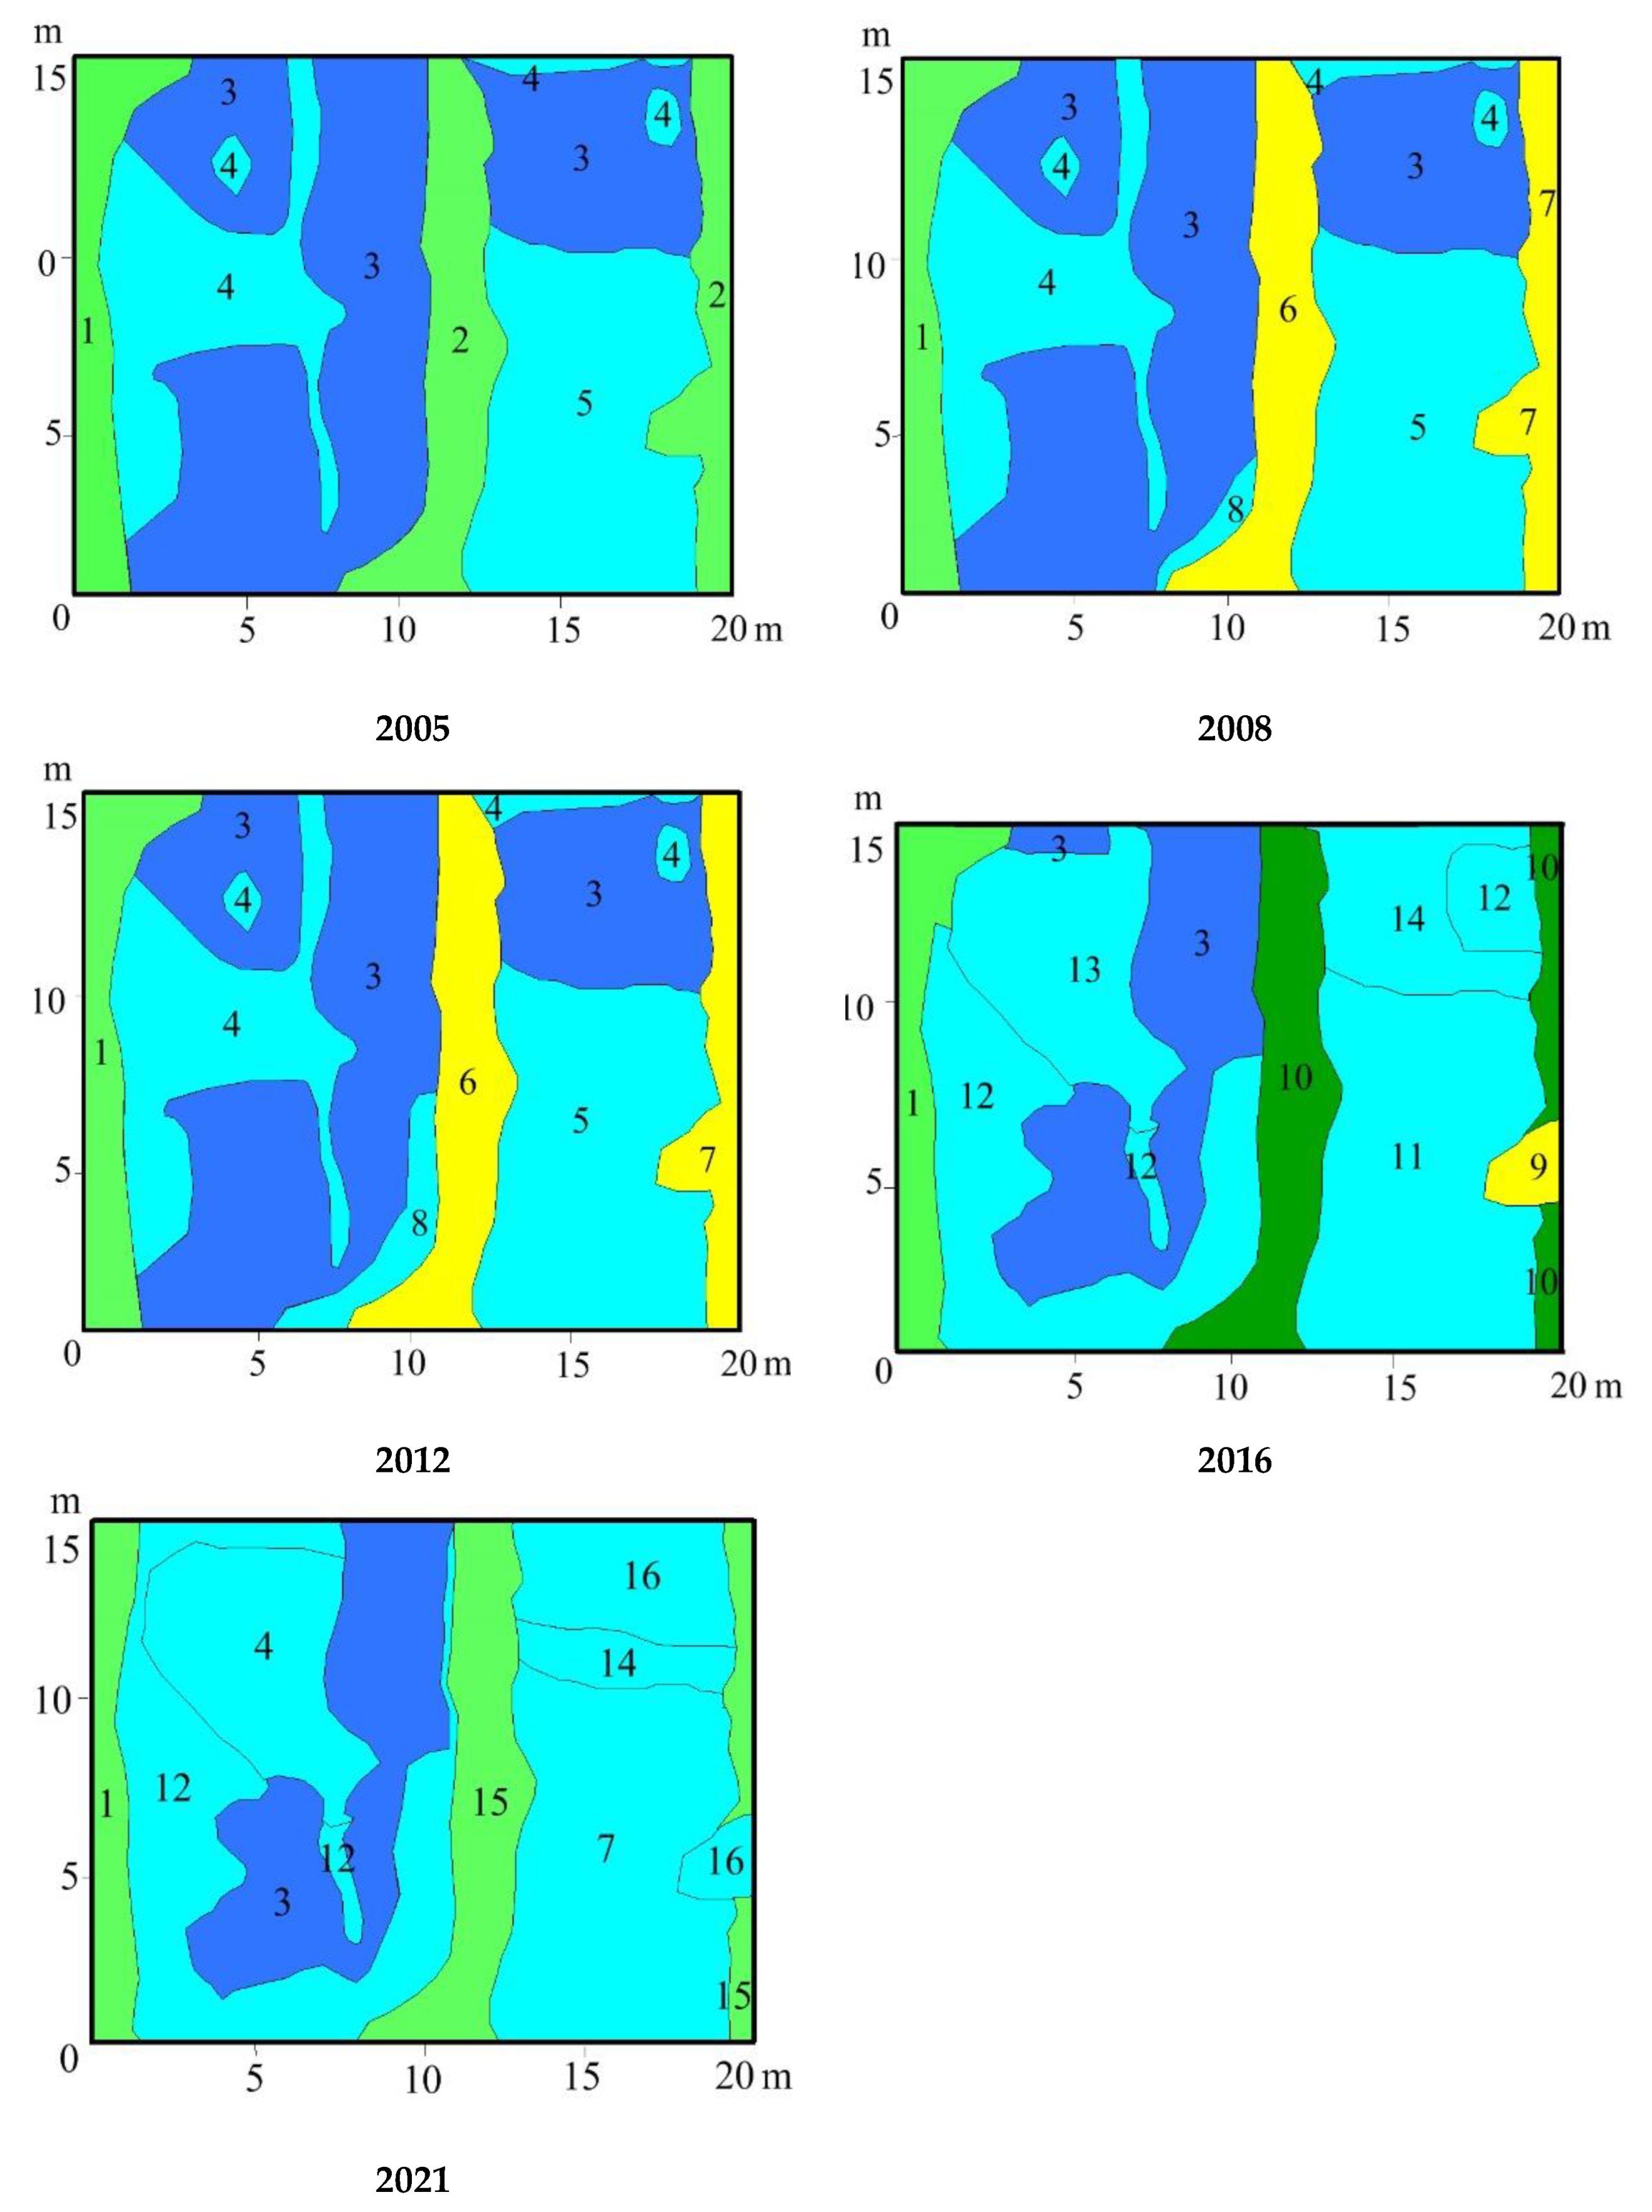
Plots No. 1, 3, 4 and 9 fell within the zone of rewetting, which was carried out in 2006, 2007, 2009 and 2010. Positive GWLs values at these sites are preserved at the present time. These milling fields are inundated with water. Plot No. 1 (Figure 16) was affected by a grass wildfire in the summer of 2007; the main surface with cotton-grass tussocks and most of the trees were burned. Mass vegetation and flowering of Eriophorum vaginatum was observed in autumn, on 18.10.07. Between 2008 and 2010, the projective cover of Eriophorum vaginatum increased considerably, forming hummocks where small clumps of sphagnum and green mosses developed. Good hydration was maintained, both ditches were filled with water, and water overflowed from one to the main surface. New species were noted: Populus tremula, Calluna vulgaris, Dryopteris cristata, Hieracium umbellatum, and Lycopodium clavatum. In 2011, the growth of trees Pinus sylvestris, Betula pubescens, and Salix cinerea was noted on the main surface. Communities of hydrophilous species, such as Eriophorum vaginatumPolytrichum juniperinum, Eriophorum angustifoliumPolytrichum juniperinum, Betula pubescensEriophorum vaginatumPolytrichum juniperinum, Betula pubescensPhragmites australisPolytrichum juniperinum, and Phragmites australisPolytrichum juniperinum continued to develop. In 2012 the plot was flooded with water, with individual cottongrass tussocks and trees towering over it, and some of the trees were dying. An Eriophorum vaginatum + Phragmites australis community dominates in vegetation cover, and cover of Eriophorum vaginatum significantly decreased; communities with Calla palustris dominated in canals, with Utricularia vulgaris, Utricularia minor, Lemna minor, and Hydrocharis morsus-ranae in water.
Bidens cernua, Sparganium natans, and Galium trifidum appeared on the cotton-grass tussocks that rise above the water surface. From 2013 to 2015, due to severe flooding, the cotton-grass tussocks disappeared and the vegetation was dominated by aquatic and coastal-water species Hydrocharis morsus-ranaeUtricularia minor and Phragmites australisHydrocharis morsus-ranae. Near-ditch vegetation was represented by communities Salix cinerea - Calla palustris + Typha latifolia and Calla palustris + Phragmites australis. In 2016, most of the site was flooded with a 0.5 m deep layer of water. A pool was formed, along the edges of which Salix cinereaPhragmites australis + Calla palustris and Phragmites australis + Carex canescens communities were formed. In the coastal zone, sphagnum mosses Sphagnum cuspidatum, S. fallax, S. majus, S. riparium, and S. squarrosum appeared. In 2017–2018 the pool was preserved. Coastal communities Phragmites australis + Carex canescensSphagnum squarrosum and Salix cinereaPhragmites australis + Calla palustris occupied 32% of the plot area, and the proportion of sphagnum mosses increased. In the dry summer of 2021, the area of water surface strongly decreased, and communities with Phragmites australis and Carex rostrata appeared on peat outcrops. The area of reed–sphagnum communities was 13.6%. The mire vegetation is recovering at the site, and maintaining the current GWL regime will enhance this process.
Plot No. 3 (Figure 17) is located on a former milling field, with a residual peat thickness of 2.1 m. The site is abundantly wet, which supports the formation of hydrophilic communities here. In the summer of 2007, the site was affected by a quick grass wildfire of low intensity, when dry leaves and stems of Eriophorum angustifolium and Typha latifolia burned. In 2008, the milling field where plot No. 3 is located was flooded with water; a pool with water depth of about 60 cm was formed, and Alisma plantago-aquatica, Hydrocharis morsus-ranae, Lemna minor, Scirpus radicans, Typha latifolia, and Utricularia vulgaris grew in water. In 2009, when the water level dropped, the peat bottom of the lake and burnt tree stumps were partially exposed. On high spots, peat islands were formed, abundantly moistened and covered with grasses Bidens cernua, Lycopus europaeus, and Galium uliginosum, and mosses Sphagnum squarrosum, Polytrichum juniperinum and Marchantia polymorpha, while Lemna minor, Hydrocharis morsus-ranae, and Utricularia vulgaris grew in the water.
In 2010–2011, the plot was again flooded with water and there appeared single specimens of Carex pseudocyperus, Scirpus radicans, and Phragmites australis. In 2012, the pool was preserved, and the vegetation cover of the site was dominated by Salix cinerea, Carex rostrata, Lemna minor, Hydrocharis morsus-ranae, Alisma plantago-aquatica, and Scirpus radicans. Between 2013 and 2015, compared to 2012, the water level in the pool was slightly lower, and a peat island covered with Eleocharis mamillata and Carex rostrata appeared in the centre. Salix cinerea and Typha latifolia formed the vegetation of the watered habitats, while Lemna minor and Hydrocharis morsus-ranae grew in water. In 2016–2018, the plot was again flooded by water, when coastal-water communities of Salix cinereaCarex pseudocyperus and Phragmites australis + Carex pseudocyperus began to form along its edges. Clumps of Sphagnum squarrosum were again found at the site. In 2021, due to dry and warm weather, a peat island with a community of Phragmites australis + Carex pseudocyperus again appeared in the center of the site. The present vegetation and flora in terms of structure and composition can be referred to as vegetation cover of lake-river shallows.
Plot No. 4 (Figure 18) entered the rewetted regime in 2007, and it was covered by water in 2008. Vegetation cover was represented by sphagnum and sedge–sphagnum communities: Eriophorum angustifoliumSphagnum cuspidatum, Eriophorum vaginatumSphagnum cuspidatum, and Carex rostrataSphagnum riparium. In 2009 the site was still covered by water. Plant cover was represented by Eriophorum vaginatumSphagnum cuspidatum and Carex rostrata + Calamagrostis canescensSphagnum riparium, and the share of Eriophorum vaginatum decreased. Between 2010 and 2012 waterlogging persisted. A pool more than 0.5 m deep appeared on the site, with the central part of the site occupied by sphagnum and sedge–sphagnum communities. Waterlogging persisted between 2013 and 2018, with a water depth of 0.5 m. The vegetation cover was dominated by sphagnum and sedge–sphagnum communities (78% of the area), and by 2021, the area of these communities was 90%. During the study period, in spite of severe waterlogging, the process of restoration of mire vegetation by sphagnum moss communities was active.
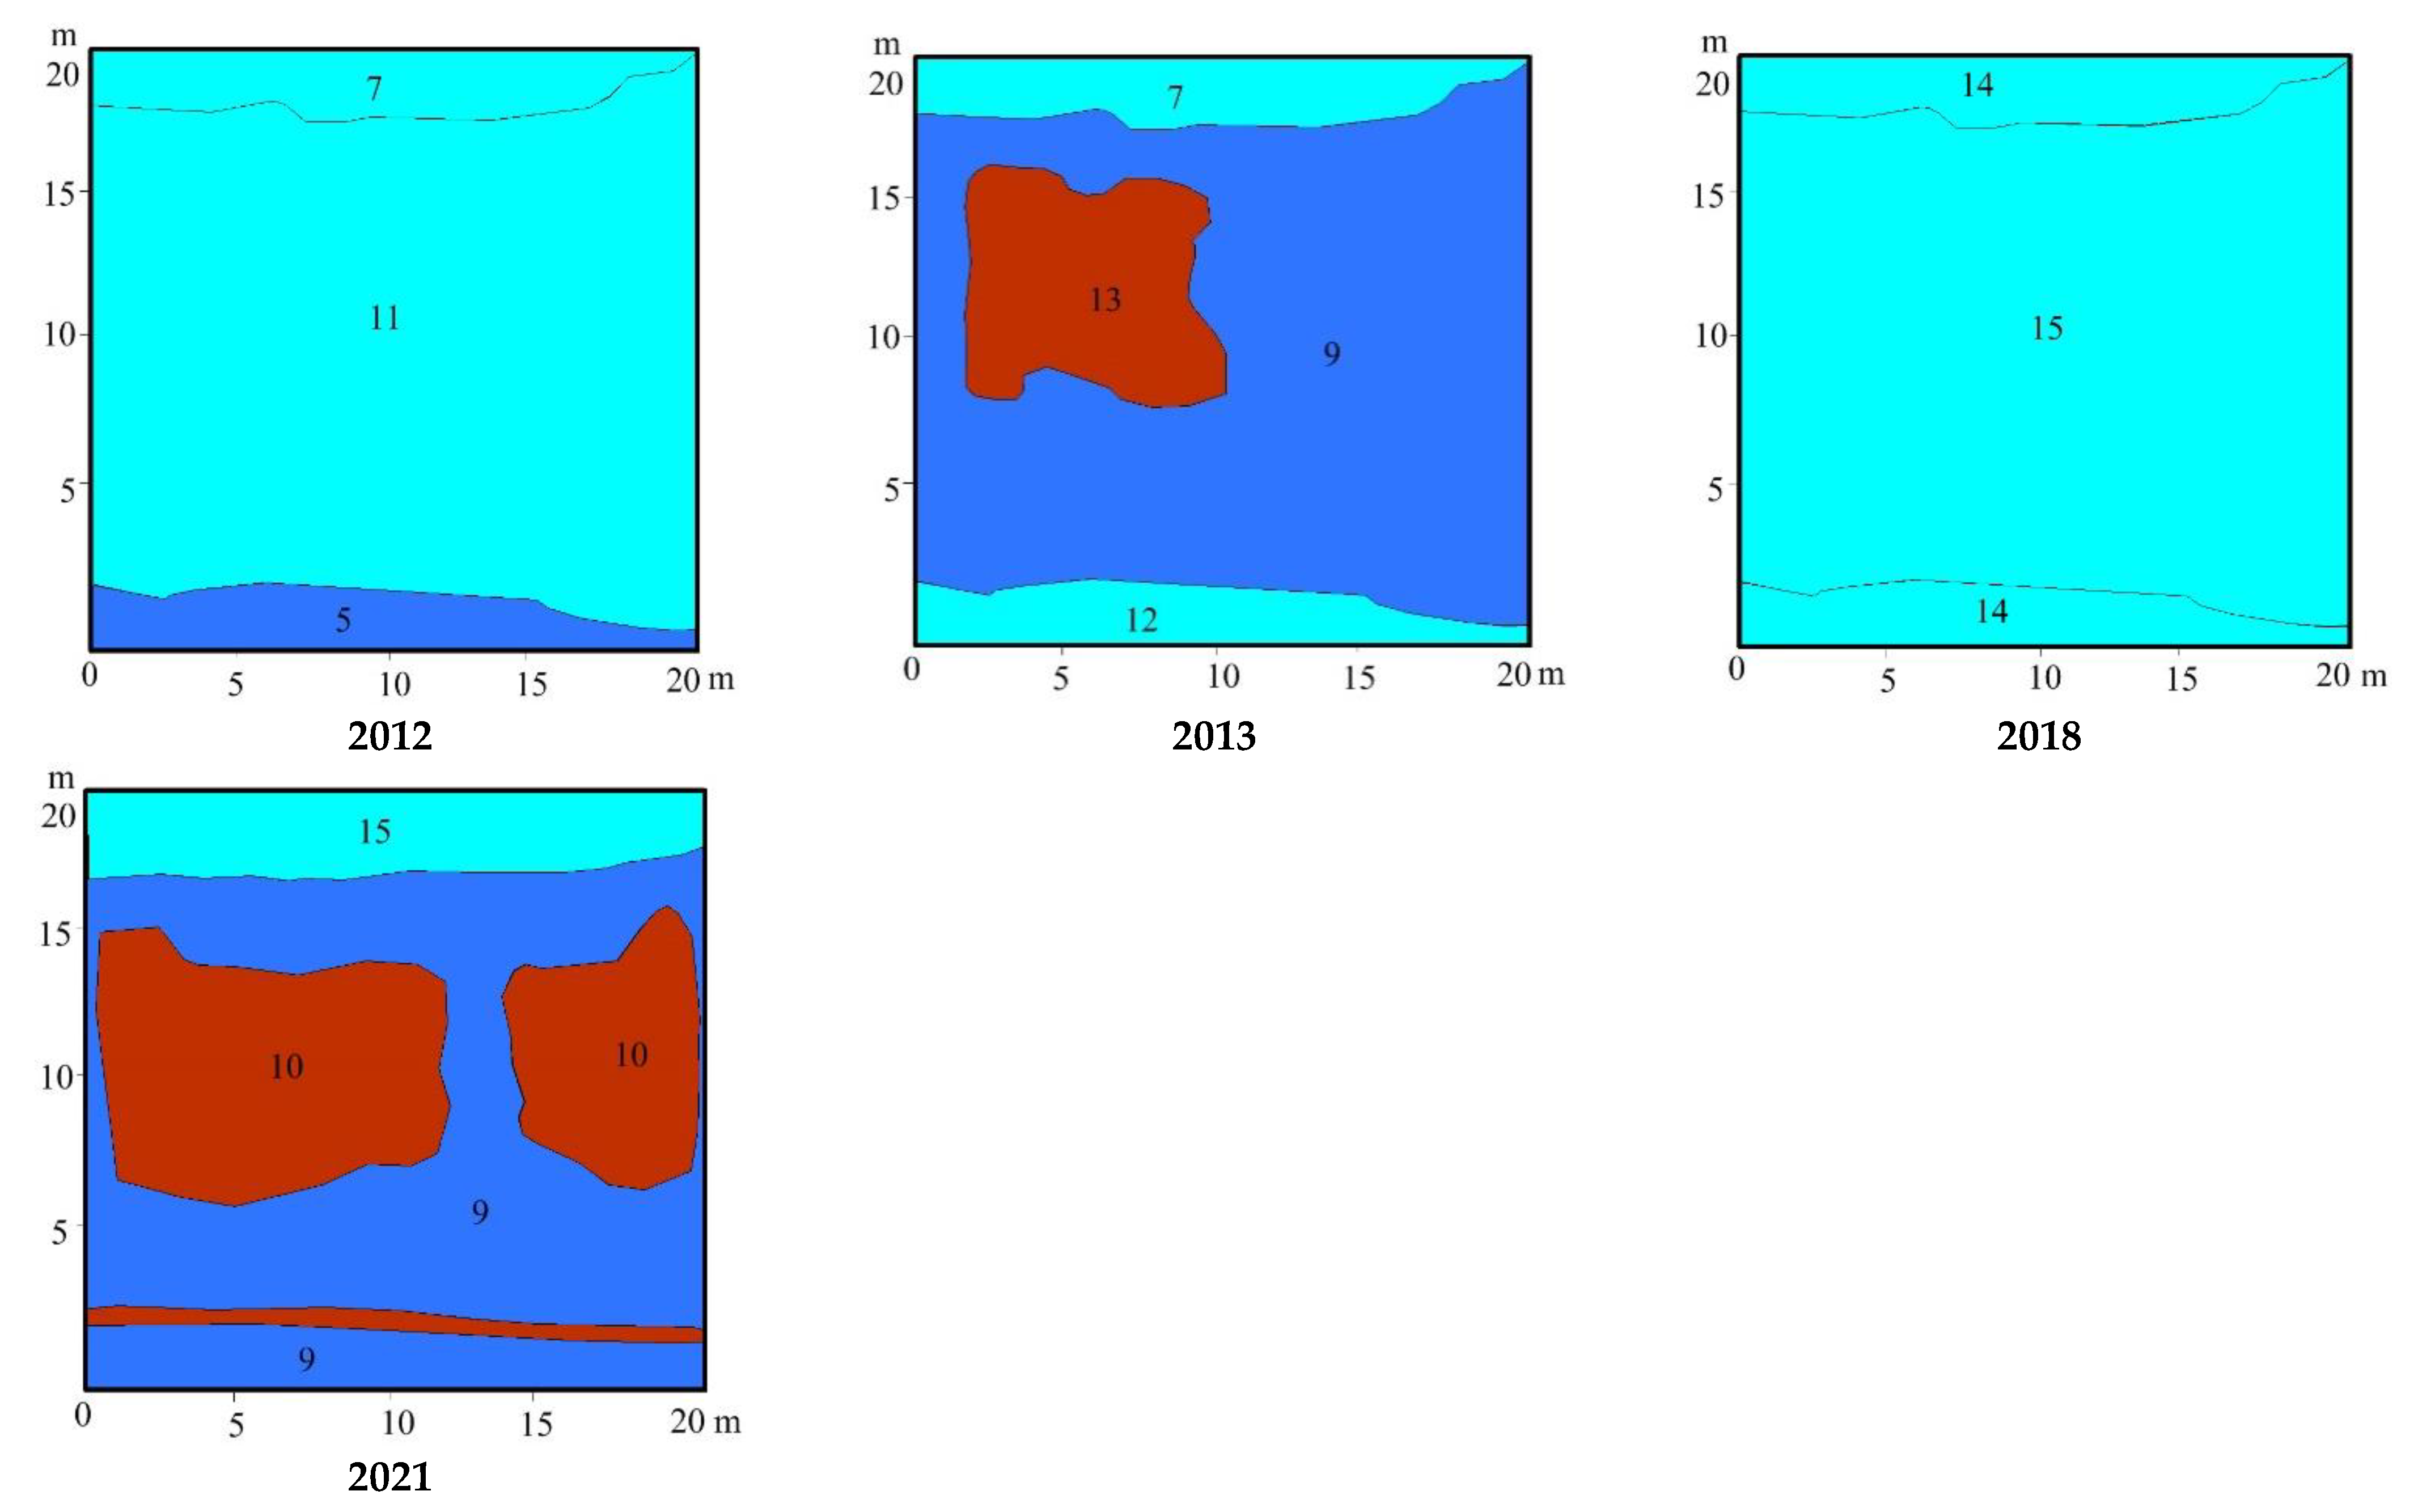
Plot No. 9 (Figure 19) entered rewetting in 2008. The pre-existing pool increased in size and flooded the adjacent communities. It occupied 54% of the site and was vegetated by Alisma plantago-aquatica + Scirpus sylvaticus. The bank of the pool was occupied by the communities Betula pubescensJuncus conglomeratus + Calamagrostis epigejos, Calamagrostis epigejos + Juncus conglomeratus, and Betula pubescensCalamagrostis epigejos + Agrostis canina. In the community Betula pubescensJuncus conglomeratus + Calamagrostis epigejos and areas of open humid peat, clumps of sphagnum mosses Sphagnum fimbriatum and S. squarrosum, with a total area of 1.84 m2, were observed. In 2009, the water receded and several new plant communities were observed on the exposed over-wetted peat substrate: Scirpus sylvaticusBidens tripartita, Alisma plantagoaquatica + Scirpus sylvaticusSphagnum squarrosum, swamp with Scirpus sylvaticus, and swamp with Typha latifolia. Dryer areas were occupied by Betula pubescensCalamagrostis epigejos + Juncus conglomeratus, Betula pubescensCalamagrostis epigejos + Agrostis canina, and Calamagrostis epigejos + Agrostis canina. Curtains of sphagnum mosses noted in these communities were preserved. In the autumn of 2009, the site was flooded with water, and in the spring of 2010, high water was preserved. Most of the pine and birch trees growing on the bank of the pool died and the sphagnum mosses disappeared.
Between 2010 and 2012, the area of the pool increased to up to 63% of the plot. In the pool, single plants of Salix cinerea, Lemna minor, and Utricularia vulgaris were observed. The shore was occupied by Betula pubescens + Salix cinerea communities and areas of open peat with Bidens tripartita, while sphagnum mosses were isolated. In 2013, the area of the lake increased to 84%, in which isolated individuals of Salix cinerea, Lemna minor, and Hydrocharis morsus-ranae were noted. Two peat islands occupied by Salix cinereaPhragmites australis and Carex rostrata + Scirpus sylvaticus appeared in it. The bank was occupied by Betula pubescens + Salix cinerea and areas of open peat with Phragmites australis. Sphagnum mosses were singular. In 2016, the area of the pool decreased to 59.9%, and individual plants Carex pseudocyperus were observed. The pool shores were occupied by diverse plant communities: Betula pubescensCalamagrostis canescens + Carex canescens, Phragmites australis + Alisma plantago-aquatica, Phragmites australis + Hydrocharis morsus-ranae, and Betula pubescensPolytrichum juniperinum. In 2018, the area of the pool increased to 67.7%, with noted individuals of Alisma plantago-aquatica, Carex pseudocyperus, and Hydrocharis morsus-ranae. Three peat islands with Carex pseudocyperus appeared in the pool, and coastal vegetation was represented by thickets of Betula pubescensSalix cinerea. Sphagnum mosses were singular. By 2021, the share of the pool had decreased to 54%, with single plants of Carex pseudocyperus, Hydrocharis morsus-ranae, Lemna minor, and Utricularia vulgaris. Underflooded banks were occupied by communities with willow and birch and willow thickets, and the presence of sphagnum mosses (Sphagnum fimbriatum, S. divinum) increased, but their projective coverage was not more than 1%. During the study period, the development of marsh vegetation was not observed, the flooded part of the plot was occupied by coastal-water and aquatic species, with the drier part occupied by willow–reedy thickets and birch–reedy communities.

4. Discussion

4.1. Vegetation Succession after Peat Extraction

Peat extraction in Meshchera National Park has been carried out by different methods: cut peat, machine-forming (sod peat), hydropeat, and milled peat. The latter has affected the largest area: 33% of the total peatland area of the park (7,634 ha) [47]. The method of extraction determined the nature of the peatland disturbance, which influenced subsequent revegetation. The gentlest methods of extraction are the so-called “wet” methods, which do not require intensive drainage of the peatland. The peat is extracted wet and dried outside the extraction site. These are carved, machine-formed, and hydro peat. Such sites were sites in all the peatlands, but their area is insignificant. Hydropeat was extracted at Tasinsky, Ostrovsky and Baksheevsky peatlands (~1600 ha), and machine-forming at Tasinsky, Mezinovsky peatlands (~1000 ha), with extraction taking place in 1930–50’s. Following extraction, there was left a system of borrow pits, filled with water. The quarry sites are represented by sites No. 5–7. The amplitude of GWL fluctuations during the period of observations here was minimal and did not exceed 20 cm (Figure 5). The exception being 2011, when GWLs dropped to record lows (Figure 5). The year 2011 was one of the driest years, with minimum precipitation, and was preceded by 2010 with an abnormally hot and dry summer (Table 3 and Table 4). However, the sphagnum moss communities represented here contributed to the maintenance of moisture at these sites, so the vegetation cover changed insignificantly, with the exception of the fire impacted plot No. 5.
The vegetation of the quarry peat extraction sites has changed over the last 70 years. We have caught the final phase of successional change (Figure 20). Previous studies have established that revegetation in peat extraction pits depends on water depth and mineral content [25,26,27,28,29,30]. The initial stage of vegetation development in quarries is aquatic vegetation, represented by Hydrocharis mosus-ranae, Lemna minor, and L. trisulca, and hydrophilic grasses – Phragmites australis, and Typha latifolia. The final stages are sedge–sphagnum, cotton-grass–sphagnum, and birch–willow–grass communities [25,27]. After 40 years, there is a clear trend towards the formation of mesotrophic mire vegetation in the peat pits, and the elevated areas adjacent to the pits may be occupied by the original oligotrophic vegetation [27].
According to our data, the final stage of succession for dry quarry benches is pine–shrub communities (Pinus sylvestris – Vaccinium uliginosum, Pinus sylvestris – Ledum palustre, Pinus sylvestris – Vaccinium uliginosum + Chamaedaphne calyculata, and Pinus sylvestris – Andromeda polifolia). The vegetation of the pits themselves depends on the area and depth of the water body, the residual thickness of the peat deposit, the presence of stumps, and the hydrochemistry of the water. The degree of overgrowth of pools varies: from areas of open water with isolated Calla palustris, Comarum palustre, Sphagnum cuspidatum, etc. to completely overgrown with sphagnum, cinquefoil-sphagnum, sedge–sphagnum, and sedge–sphagnum communities. The deepest water bodies with precipitous banks are swamped by the growth of floating mats.
Quarries after hydropeat extraction are larger and deeper, and tend to overgrow more slowly. Even after 60–70 years many of them are an open water surface with single aquatic plants (Comarum palustre, Calla palustris, Phragmites australis, Lemna minor, etc.). Along the edges, floating mats with dwarf-shrubs (Andromeda polifolia and Oxycoccus palustris) are formed. Dry banks are overgrown with pine and dwarf-shrubs, less often with willow and sedge communities. In general, the quarry areas gradually regenerate a sufficiently diverse area of mire vegetation. In the quarries, sphagnum moss communities (S. fallax, S. cuspidatum) form a top spit, which is indirect evidence of the preconditions for subsequent peat accumulation.
Peat extraction by milling is characterised by its severe impact on peatlands. Because of its manufacturability, it has been the most widely used method of commercial peat harvesting in many countries since the second half of the 20th century. The method involves draining a peatland by creating deep hillside channels along its contour, and progressively deepening the field channels as the peat is drained, which are naturally drained to the degree technologically required in the peat extraction fields. Deeply drained milled peat extraction fields are problematic environments for successful plant spontaneous revegetation because of dryness, destroyed propagule banks, temperature fluctuations on bare peat surfaces, and other negative factors [34,37,38,39,40,41]. Therefore, such sites require reclamation after the cessation of milling. In the Soviet Union, such measures were a regulatory requirement. Different purposes of reclamation were foreseen, however; reclamation for subsequent agricultural use prevailed, and less often for forestry. The Water Code of the Russian Federation (2006) prioritises reclamation–rewetting of mined out peatlands.
Even before Meshchera National Park was set up, parts of the excavated areas on the Tasinsky, Mezinovsky, and other peatlands had been reclaimed. Pine trees were planted on the Tasinsky peatland, and the Orlovsky one was used as hayfields. Several peatlands have been fully extracted; there are areas where peat was extracted, and also areas that have only been prepared for extraction (the original vegetation has been removed, drainage has been carried out). The latter hardly ever self-revegetates, and after decades they are still bare peat with isolated plants. Such dry sites can remain bare for more than 15 years [35]. Some of the milled fields in the Tasinsky peatland were reclaimed in the 1980s, and in the 1990s and 2000s, the first attempts of rewetting were made. Due to the shape of the milling fields, their central parts were waterlogged. Sphagnum, sedge–sphagnum, and fescue-sphagnum communities had developed 30 to 40 years after peat mining had ceased here. Dry margins of milled fields were overgrown with birch–wood–reed, birch–moss, birch–willow–herb, and pine–moss forest communities.
The vegetation cover of milled fields depends on the position of the site, the GWL regime, the time of overgrowth, and the properties of the peat deposit. According to different authors on effectively drained abandoned bare peat sites, pioneer species such as Calluna vulgaris, Polytrichum strictum, Eriophorum vaginatum, E. angustifolium, Drosera rotundifolia, Molinia caerulea, Deschampsia caespitosa, and Betula pubescens occur as the first ground cover. Dwarf shrub communities with Vaccinium myrtillus, V. vitis-idaea, and Calluna vulgaris may also appear. In wet depressions, communities with Eriophorum vaginatum, E. angustifolium, Oxycoccus palustris, and Sphagnum spec. can develop. After 30–50 years, areas with sphagnum mosses may appear [60]. Separately, the role of cotton-grass in the pioneering development of cutover peat extraction fields has been noted [37].
According to our data, depending on GWLs, different communities develop on abandoned milled fields. The driest areas on the Tasinsky peatland (GWL during the vegetation period −60 to −40 cm (Figure 5)) are overgrown with birch–wood–reed, birch–willow–herb, and birch–moss communities. On the margins of milled fields, willow–birch–vein cenoses are formed (plots No. 2 and 10). On plot No. 2, the average GWL during the growing season was the lowest during the study period, ranging from −54 to −90 (Figure 5). Plot 10 has a wide amplitude of GWL variation (−10 to −64 cm), and the average GWL value was −38 cm (Figure 5). As a consequence, fires occurred on plot 2 in 2002 and 2007. The vegetation cover burned completely. In the first year after the fire, birch–wood–-reed and birch–willow–herb communities appeared here; at present, forest communities dominate on the plots, and there is no recovery of mire vegetation. In the Ostrovsky peatland, the driest areas, with a residual peat thickness of 1.5–2 m, are occupied by birch–cotton-grass and birch–cotton-grass–moss communities. Average GWL during the vegetation period is −30 to −20 cm. Communities with pine participation have a wider amplitude and occupy both dry (GWL −40 cm) and waterlogged areas (GWL −5…+5) and are represented by pine–birch, pine–birch–moss, and pine–moss communities. On the Tasinsky peatland, there is a preserved area with pine plantations with dead ground cover.
This study shows that the natural regeneration of bog communities on mined peatlands with sphagnum mosses is possible. This phenomenon is more common on quarried peatlands than on milled fields. However, the spontaneous revegetation process is very slow and can take decades or even centuries before typical peatland communities are re-established, as illustrated by a study of peatland vegetation formation developed in 1925 and 1936 [61]. Several types of succession have been identified, leading to sphagnum dominance. Cotton-grass or Polytrichum strictum are often the pioneer species in milled fields, favouring the further emergence of mosses, including species from the genus Sphagnum. In the Ostrovsky peatland, cotton-grass tussocks were damaged by fire in 2002, and two years later, in 2004, the cotton-grass populations resumed, as clumps of moss species of the genus Polytrichum, which had previously been destroyed by fire, appeared.

4.2. Vegetation Succesion after Wildwires

In dry years, wildfires also occur in natural bogs, but drained and unused peatlands are the most fire prone, especially former fields of milled peat extraction [6]. Grass wildfires do not always burrow into peat and become peat fires. In spring, when dry grass fires ignite, the high after-snowmelt moisture content of the peat prevents the fire from deepening [62]. Fires during dry summer periods often result in peat burning, and the deeper the water table, the deeper the fire can penetrate into the peat [63]. The highest number of fires in Meshchera National Park were in 1936, 1972, 1992, 1996, 2002 and 2010.
According to our data in the peat extraction areas, the quarry slopes are most affected by fires of varying degrees of intensity. This is understandable, as they are the driest areas. As a result of grass wildfires, woody, bush, grass, and moss vegetation burns or dies. In the case of peat fires, the quarry banks burn down to the quarry water level, and after some years, mire vegetation (Oxycoccus palustris, Eriophorum vaginatum, Sphagnum fallax, etc.) appears on the banks. It has been noted [64] that burning occurs in the most desiccated central part of the cofferdam. Fire transfer to adjacent longitudinal dykes occurs due to falling trees with burning crowns across the vegetation of transverse cofferdams, and through moss rags in the pit.
Quarry banks on the Tasinsky peatland suffered from fires in 2002, 2006 and 2007. Post-pyrogenic succession on the peatland burned in 2007 was observed on plot No. 5. The berm vegetation burned out, but a year after the fire, pioneer species Chamenerion angustifolium and Marchantia polymorpha appeared, pine communities were replaced by birch and willow, and dwarf shrubs by grass vegetation. As a result, mire vegetation was replaced by birch–willow–herb, and then by the dwarf shrubs of the genus. Heathers regenerate, then they are replaced by birch–dwarf shrub communities with blueberry, ledum, and heather. After 5 years, seedlings of pine appear on the berms, pine–dwarf shrub communities begin to form, and we can assume that this is the final stage of successional changes in the vegetation of the berms.
The areas most affected by wildfires are the milling peat extraction sites. After the fires, the following alien plant species appear here: Epilobium adenocaulon, Erigeron acris, Gnaphalium sylvaticum, Hieracium umbellatum, Lactuca serriola, Nuttallanthus canadensis, Pilosella officinarum, Taraxacum officinale, and others. The following year after the fires, Chamaenerion angustifolium and Marchantia polymorpha massively spread. Later, the proportion of these species gradually decreases, Chamaenerion angustifolium is replaced by Calamagrostis epigejos, and Marchantia polymorpha by Polytrichum juniperinum. After 5–7 years, birch and birch–willow–herb communities are formed in these areas
Exhausted peat deposits and production areas with minimal or no peat are also affected by fires. The Garinsky peatland was excavated in 1983. The surface of the peatland has been burned repeatedly, particularly badly in 2002. Since 2003, forest vegetation has formed: willow, birch, and reed grass communities, and forest communities dominated by birch and aspen on the edges of the peatland. In 2003, a production area on the edge of the Tasinsky peatland, where birch communities were present, was affected by the fire. After the 2003 fire, birch–aspen dominant forest communities were formed. In our opinion, fires do not change the course of succession, but interrupt it. After fires, the pre-fire vegetation type is regenerated.
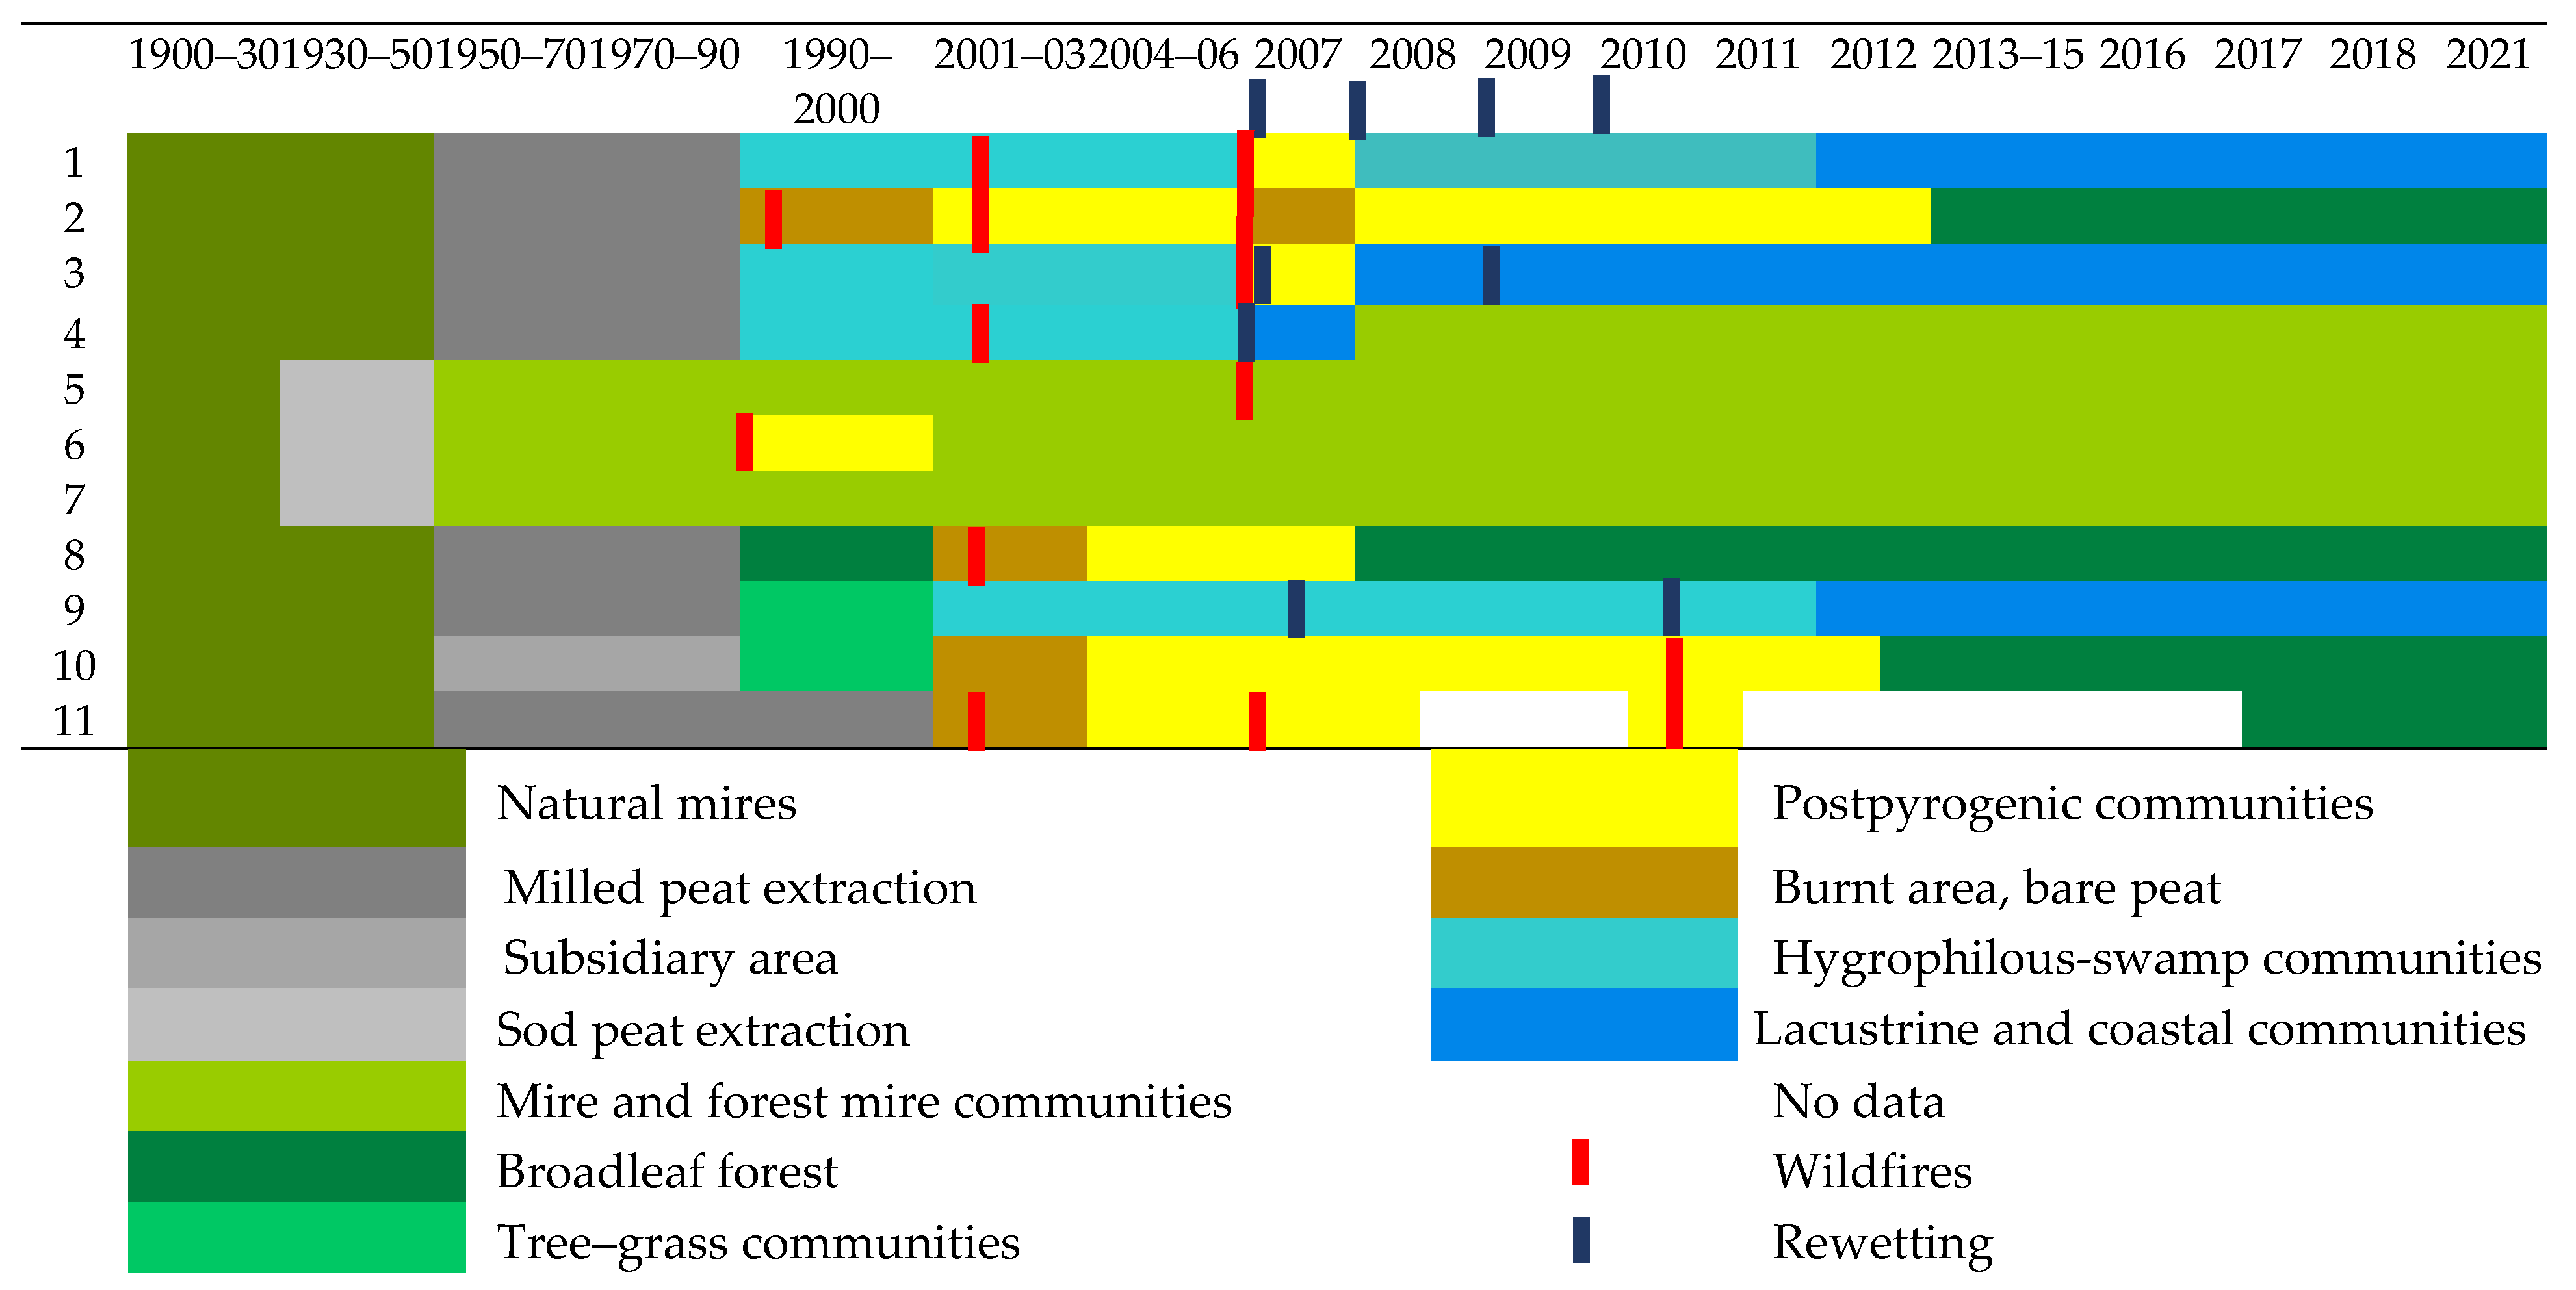
Rewetted abandoned milling fields suffer little fire damage. In 2007 a fugitive grassland wildfire ran through plots No. 1 and 3 (Figure 20) and dry stems and leaves of individual herbaceous plants were burned. On 18.10.07, mass vegetation and flowering of Eriophorum vaginatum on plot No. 1 was recorded, and in 2008 Betula pubescens and Eriophorum vaginatum grew on plot No. 1. Under the cover of abundantly growing cotton-grasses, clumps of sphagnum mosses appeared. Cotton-grass can influence plant colonisation patterns. The surroundings of tussocks may act as spreading centres for vegetation after peatland rewetting [37].

4.3. Vegetation Changes following Rewetting

Rewetting has been carried out in Meshchera National Park since 2002. Over a 20-year period, more than 9000 ha have been waterlogged, and all major peatlands have been covered. The rewetted area includes not only milling sites, but also peat quarrying sites and hydropeat pits. In 2011, the western part of the Ostrovsky peatland was rewetted. The hydropeat extraction sites were in the waterlogged area. The task was to rewet the dry banks, which had repeatedly suffered from fires. Before 2011, the water-filled pits were overgrown with floating mats, and pine–birch–bush communities developed on the slopes. After rewetting, pools with isolated islands were formed, on which bog vegetation is preserved: Pinus sylvestris + Betula pubescensAndromeda polifolia + Vaccinium uliginosum. The pond vegetation is represented by Phragmites australis, Hydrocharis morsus-ranae, and Lemna minor. However, due to high water levels, mire vegetation does not recover. In case of flooding (20–30 cm above soil surface), sparse Phragmites australis stands develop on the margins, accompanied by Sphagnum spec. If the flooding is deeper than 1 m, open water is expected to be colonised by floating Sphagnum species after a vegetation-free phase site [60].
Rewetting of the Tasinsky peatland was carried out in 2006, 2007, 2009, and 2010. The works covered most of the milling fields, and about 30% of their area was flooded. The first cofferdams were blind and, due to the heterogeneity of the relief, some of the milling fields were flooded with water of 0.6 to 1.5 m depth. However, some of the fields affected by the 2002 and 2006 fires were areas of open peat or reed grass communities. In some fields, particularly in central parts, sphagnum communities had already formed and were inundated by water. Further sphagnum communities developed on those fields where they were before flooding, e.g., plots No. 1 and 4 (Figure 20). On plots No. 1 and 4, the processes of mire revegetation were successful until 2011. Here, cotton-grass tussocks dominated, and clumps of sphagnum and green mosses developed, which is quite common [37].
The average GWL on plot 4 during the growing season of 2007 was −17.5 cm (Figure 6). The vegetation cover was represented by sphagnum and sedge–sphagnum communities. The site was waterlogged in 2007 and in 2008, when the maximum water storage in snow during the whole study period was observed (Figure 4). These two factors contributed to the appearance of a pool at plot 4, and the GWL rose to +10.7 cm. The formation of lacustrine and riparian-water cenoses had begun. The woody vegetation, unable to withstand the flooding, died. However, further GWL were within +1.2…−4.6 cm and the site was actively colonised by sphagnum mosses, which, by 2021, accounted for more than 80% (S. fallax, S. flexuosum, and S. riparium (Figure 20). We believe that the sphagnum cover will itself maintain the water regime of such sites in the future.
On plot 1, the average GWL value varied from +30 cm to −30 cm (Figure 6). The increase in GWL occurred in 2012, following the rewetting of the Tasinsky peatland in 2010. The mire vegetation recovery processes are active: the proportion of sphagnum mosses on plot 1 in 2021 was 13.6%, (S. cuspidatum, S. fallax, S. fimbriatum, S. majus, S. riparium, and S. squarrosum). Waterlogged areas with average GWLs of −10 cm to +15 cm are occupied by sedge–sphagnum and cotton-grass–sphagnum communities (as on plots No. 1 and 4). The processes of mire vegetation regeneration are active. Swamp cenoses are formed in the central, lowered parts of the milled fields. As the sphagnum cenoses regenerate, they grow from the centre to the periphery of the field.
Individual milled fields in the southern part of the Tasinsky peatland were rewetted in the 1990–2000s. In 2005 willow–sedge, willow–wood–reed, cattail–sedge, and reed–sedge communities dominated here (e.g., plots No. 3 and 9 with maximum GWLs during the growing season). As on plot No. 4, a rise in GWL occurred here in 2008 following rewetting. The former woody vegetation died, and areas of open water with single aquatic plants appeared on the plots. Subsequently, a significant fluctuation of GWLs is observed at the sites. We attribute the sharp drop in GWLs in 2011 and 2018 to low precipitation (556 mm and 522 mm, respectively) (Figure 3). The rise in GWL in 2010 was a consequence of rewetting, and in 2012 was due to an increase relative to the dry years of 2010 and 2011. When GWLs rise, the area of pools increases, and they can flood coastal areas. As a result, the sphagnum mosses appearing here die, as in plot No. 3 and 9 (Figure 20). As GWLs decrease, the area and depth of pools become shallower, exposing islands of floating peat and tree stumps left behind from peat extraction. Such fluctuations in GWLs during the growing season have a negative impact on the recovery processes of the mire vegetation. The vegetation at these sites now comprises willow–reed–grass, willow–sedge, and sedge–reed–grass communities typical of coastal-water cenoses. The proportion of sphagnum mosses Sphagnum fallax, S. fimbriatum, S. riparium, S. squarrosum is not more than 1%. The recovery of mire vegetation is still poorly expressed here.
The deepest central parts of the milling fields are flooded areas with GWLs of +40 cm or more, which are occupied by communities with reeds, cattail, chaff, and willow, and islands of floating peat often appear. As a rule, the area of the water body does not exceed the size of the milling peat production field.

5. Conclusions

The present condition of peatlands disturbed by peat extraction depends on the method of peat extraction, the subsequent use of the site, the remaining thickness of the peat deposit, its characteristics, the time since abandonment, and current changes in environmental factors, particularly weather and climatic conditions. The spontaneous self-revegetation of mined peat deposits may be interrupted by peat fires, which may be prevented by rewetting, which promotes peatland revegetation. Mire vegetation does not restore in areas with no or minimal peat layers.
Peat quarry sites are generally well-watered, which can allow for the gradual overgrowth of the quarries with floating mats and the development of predominantly mesotrophic mire vegetation. Due to the presence of cofferdams with the original mire vegetation still in place, the peat quarry areas can form a spatially diverse mire landscape over time.
Environmental conditions on abandoned milled peat extraction sites are not conducive to spontaneous self-revegetation. The driest areas can remain with bare peat for many years, posing the greatest wildfire risk. Depending on moisture content, different plant communities may develop there over time. Plots with an average GWL during the vegetation period of −60 cm to −40 cm are overgrown with birch–vein, birch–willow–herb, and birch–moss communities, and along the margins of milled fields, willow–birch–wood reed cenoses are developing. On dry areas, with residual peat of 1.5–2 m, birch–cotton-grass and birch–cotton-grass–moss communities can form (GWL −30 cm to −20 cm). Communities with pine can appear both in dry (GWL −40 cm) and waterlogged areas (GWL +5 cm to −5 cm).
Wildfires have an extremely negative impact on peatlands, interrupting the progress of re-vegetation. After fires, alien species appear and, over time, disappear. Despite a relatively stable moisture supply, the quarry peat extraction areas suffer from wildfires that run along the cofferdams of the quarries, leading to the destruction of the vegetation cover here.
Former milled peat extraction sites are the most frequent targets of peat fires. Woody vegetation is the most affected by wildfires, sometimes taking decades to recover. At low GWLs, significant amounts of peat are burned. After fires, pioneer communities of Betula pubescensChamenerion angustifoliumCeratodon purpureus; Calamagrostis epigejos + Epilobium adenocaulonMarchantia polymorpha; and Betula pubescensSalix cinereaCalamagrostis epigejosPolytrichum juniperinum appear on dry areas of milled fields.
Quarry sites are capable of self-restoration of peatland vegetation, and rewetting may promote the formation of pools to the detriment of mire vegetation. In order to prevent fires and create conditions conducive to mire revegetation at milled peat extraction sites, rewetting is necessary. When the GWLs are −5 cm to +15 cm, sedge–sphagnum and cotton-grass–sphagnum communities can form, and the processes of mire vegetation recovery are active. In areas flooded by water with GWLs of +30 cm and more, communities with willow, reed, cattail and other near-water and aquatic plants can form.
In order to restore mire vegetation proper, the average GWLs during the growing season should be between −25 cm and +25 cm. At higher levels, artificial pools are formed. However, in general, this contributes to the main goal of the rewetting of peatlands and the prevention of peat fires. Finally, the spatial differences in the wetting conditions of different areas after rewetting contribute to the formation of a variety of wetlands, which will contribute to increasing the biodiversity of these areas.
This analysis has identified the main trends in vegetation dynamics following cessation of peat extraction, the effects of wildfires, and the self-restoration of mire vegetation following rewetting. This understanding can form the basis of further, more detailed, floristic analysis, as well as help outline the environmental consequences—including greenhouse gases flux, carbon accumulation, etc. Changes in vegetation may be of a longer-term nature, and further observation is therefore needed. The location of the survey sites within a specially protected area provides protection against human disturbance, except for authorised restoration of disturbed ecosystems, thus ensuring the duration and continuity of observations. A comprehensive assessment of biodiversity and ecosystem services is needed [65]. The sites in Meshchera National Park have been used in developing a methodology for assessing the effectiveness of rewetting for peatland revegetation [22,23,24]. Further observations and research may help to develop and verify them, which is important for scientific support of mire restoration, biodiversity and other ecosystem services, including climate change and adaptation issues.

Supplementary Materials

The following supporting information can be downloaded at: https://www.mdpi.com/article/10.3390/d15010003/s1, Figure S1: View of the monitoring plots from different years of observation.

Author Contributions

Conceptualization, methodology, A.V., V.A. and A.S.; resources, A.V., V.A. and A.S.; formal analysis, A.V.; writing—original draft preparation, A.V. and A.S.; writing—review and editing, A.S.; visualization, A.V. and A.S. All authors have read and agreed to the published version of the manuscript.

Funding

This research was partly supported by the Russian Science Foundation (project 19-74-20185) and the project of the International Climate Initiative (IKI) of the Federal Ministry for the Environment, Nature Conservation and Nuclear Safety of the Federal Republic of Germany (BMUB) in the framework of Russian-German cooperation: “Restoring peatlands in Russia—for fire prevention and climate change mitigation” project managed through the German development bank KfW. V. Antipin thanks for the support State ordered research project of the Institute of Biology, Karelian Research Centre Russian Academy of Sciences (FMEN-2022-0008).

Institutional Review Board Statement

Not applicable.

Informed Consent Statement

Informed consent was obtained from all subjects involved in the study.

Data Availability Statement

Not applicable.

Acknowledgments

The authors are grateful to S.I. Grabovik, M.A. Boichuk, N.V. Stoykina, and V.L. Mironov of the Karelian Research Centre of the Russian Academy of Sciences for organizing, monitoring, and determining the species composition of higher plants and mosses. The authors are also grateful to the administration of Meschera National Park and its staff; to Y.A. Bykov, E.Yu. Tenyakova, S.O. Mayorova, E. V. Bobyleva, A.A. Leitis and Y.P. Zhuravlev and for their assistance in monitoring; to A.V. Markina and M.A. Medvedeva of the Institute of Forest Science of the Russian Academy of Sciences for their assistance in processing the mapping material; to Ryan Kelly for linguistic revision of the manuscript; and to Olivia Bragg for important advice on its title. The authors are grateful to the anonymous reviewers for their insightful and helpful comments that have helped to improve the original manuscript.

Conflicts of Interest

The authors declare no conflict of interest.

References

  1. Parish, F.; Sirin, A.; Charman, D.; Joosten, H.; Minayeva, T.; Silvius, M.; Stringer, L. (Eds.) Assessment on Peatlands, Biodiversity and Climate Change: Main Report; Global Environment Centre: Kuala Lumpur, Malaysia; Wetlands International: Wageningen, The Netherlands, 2008; p. 179. [Google Scholar]
  2. Joosten, H.; Sirin, A.; Couwenberg, J.; Laine, J.; Smith, P. The role of peatlands in climate regulation. In Peatland Restoration and Ecosystem Services: Science, Policy and Practice; Bonn, A., Allott, T., Evans, M., Joosten, H., Stoneman, R., Eds.; Cambridge University Press: Cambridge, UK, 2016; pp. 66–79. [Google Scholar] [CrossRef]
  3. Minayeva, T.Y.; Sirin, A.A. Peatland biodiversity and climate change. Biol. Bull. Rev. 2012, 2, 164–175. [Google Scholar] [CrossRef]
  4. Joosten, H.; Clarke, D. Wise Use of Mires and Peatlands: Background and Principles Including a Framework for Decision-Making; International Mire Conservation Group/International Peat Society, Saarijärven Offset Oy: Saarijärvi, Finland, 2002; 304p, ISBN 951-97744-8-3. [Google Scholar]
  5. IPCC 2019. Climate Change and Land: An IPCC Special Report on Climate Change, Desertification, Land Degradation, Sustainable Land Management, Food Security, and Greenhouse Gas Fluxes in Terrestrial Ecosystems; Shukla, P.R., Skea, J., Calvo Buendia, E., Masson-Delmotte, V., Pörtner, H.-O., Roberts, D.C., Zhai, P., Slade, R., Connors, S., van Diemen, R., et al., Eds.; in press; Available online: https://www.ipcc.ch/srccl/ (accessed on 15 December 2022).
  6. Sirin, A.; Minayeva, T.; Vozbrannaya, A.; Bartalev, S. How to avoid peat fires? Sci. Russ. 2011, 2, 13–21. [Google Scholar]
  7. Wilson, D.; Blain, D.; Couwenberg, J.; Evans, C.D.; Murdiyarso, D.; Page, S.E.; Renou-Wilson, F.; Rieley, J.O.; Sirin, A.; Strack, M.; et al. Greenhouse gas emission factors associated with rewetting of organic soils. Mires Peat 2016, 17, 1–28. [Google Scholar] [CrossRef]
  8. Günther, A.; Barthelmes, A.; Huth, V.; Joosten, H.; Jurasinski, G.; Koebsch, F.; Couwenberg, J. Prompt rewetting of drained peatlands reduces climate warming despite methane emissions. Nat. Commun. 2020, 11, 1644. [Google Scholar] [CrossRef] [PubMed] [Green Version]
  9. Granath, G.; Moore, P.A.; Lukenbach, M.C.; Waddington, J.M. Mitigating wildfire carbon loss in managed northern peatlands through restoration. Sci. Rep. 2016, 6, 28498. [Google Scholar] [CrossRef] [Green Version]
  10. Sirin, A.A.; Medvedeva, M.A.; Makarov, D.A.; Maslov, A.A.; Joosten, H. Multispectral satellite based monitoring of land cover change and associated fire reduction after large-scale peatland rewetting following the 2010 peat fires in Moscow region (Russia). Ecol. Eng. 2020, 158, 106044. [Google Scholar] [CrossRef]
  11. Minayeva, T.Y.; Bragg, O.M.; Sirin, A.A. Towards ecosystem-based restoration of peatland biodiversity. Mires Peat 2017, 19, 1–36. [Google Scholar] [CrossRef]
  12. Ahmad, S.; Haojie, L.; Günther, A.; Couwenberg, J.; Lennartz, B. Long-term rewetting of degraded peatlands restores hydrological buffer function. Sci. Total Environ. 2020, 749, 141571. [Google Scholar] [CrossRef]
  13. Bonn, A.; Reed, M.; Bain, C.; Chris, D.E.; Joosten, H.; Farmer, J.; Emmer, I.; Couwenberg, J.; Moxey, A.; Artz, R.; et al. Investing in nature: Developing ecosystem service markets for peatland restoration. Ecosyst. Serv. 2014, 9, 54–65. [Google Scholar] [CrossRef] [Green Version]
  14. Global Peatland Database. Available online: https://www.greifswaldmoor.de/global-peatland-database-en.html (accessed on 28 August 2021).
  15. Vompersky, S.E.; Sirin, A.A.; Salnikov, A.A.; Tsyganova, O.P.; Valyaeva, N.A. Estimation of forest cover extent over peatland and paludified shallow peatlands in Russia. Contemp. Probl. Ecol. 2011, 4, 734–741. [Google Scholar] [CrossRef]
  16. Tanneberger, F.; Tegetmeyer, C.; Busse, S.; Barthelmes, A.; Shumka, S.; Mariné, A.M.; Jenderedjian, K.; Steiner, G.M.; Essl, F.; Etzold, J.; et al. The peatland map of Europe. Mires Peat 2017, 19, 1–17. [Google Scholar] [CrossRef]
  17. Minayeva, T.; Sirin, A.; Bragg, O. (Eds.) A Quick Scan of Peatlands in Central and Eastern Europe; Wetlands International: Wageningen, The Netherlands, 2009; 132p, Available online: https://www.wetlands.org/publications/a-quick-scan-of-peatlands-in-central-and-eastern-europe/ (accessed on 15 December 2022).
  18. Sirin, A.; Minayeva, T.; Yurkovskaya, T.; Kuznetsov, O.; Smagin, V.; Fedotov, Y.U. Russian Federation (European part). In Mires and Peatlands of Europe: Status, Distribution and Conservation; Joosten, H., Tanneberger, F., Moen, A., Eds.; Schweizerbart Science Publishers: Stuttgart, Germany, 2017; pp. 589–616. [Google Scholar] [CrossRef]
  19. Tanneberger, F.; Moen, A.; Barthelmes, A.; Lewis, E.; Miles, L.; Sirin, A.; Tegetmeyer, C.; Joosten, H. Mires in Europe—Regional diversity, condition and protection. Diversity 2021, 13, 381. [Google Scholar] [CrossRef]
  20. Safronov, A.N.; Fokeeva, E.V.; Rakitin, V.S.; Grechko, E.I.; Shumsky, R.A. Severe wildfires near Moscow, Russia in 2010: Modeling of carbon monoxide pollution and comparisons with observations. Remote Sens. 2014, 7, 395–429. [Google Scholar] [CrossRef] [Green Version]
  21. Sirin, A.; Medvedeva, M.; Korotkov, V.; Itkin, V.; Minayeva, T.; Ilyasov, D.; Suvorov, G.; Joosten, H. Addressing peatland rewetting in Russian Federation climate reporting. Land 2021, 10, 1200. [Google Scholar] [CrossRef]
  22. Medvedeva, M.A.; Vozbrannaya, A.E.; Bartalev, S.A.; Sirin, A.A. Ocenka sostojanija zabroshennyh torforazrabotok po mnogospektral’nym sputnikovym izobrazhenijam [Assessment of abandoned peat extraction sites using multispectral satellite imagery] Issled. Zemli Iz Kosm. 2011, 5, 80–88. [Google Scholar]
  23. Medvedeva, M.A.; Vozbrannaya, A.E.; Sirin, A.A.; Maslov, A.A. Capabilities of multispectral remote-sensing data in an assessment of the status of abandoned fire hazardous and rewetting peat extraction lands. Izv. Atmos. Ocean. Phys. 2017, 53, 1070–1078. [Google Scholar] [CrossRef]
  24. Sirin, A.; Medvedeva, M.; Maslov, A.; Vozbrannaya, A. Assessing the land and vegetation cover of abandoned fire hazardous and rewetted peatlands: Comparing different multispectral satellite data. Land 2018, 7, 71. [Google Scholar] [CrossRef] [Green Version]
  25. Abramova, L.I. Formirovanie rastitel’nosti na vyrabotannyh torfjanikah i osnovnye puti ih ispol’zovanija [Vegetation formation on excavated peatlands and the main ways of their use]. Extended abstract of candidate’s thesis (PhD), Moscow State University, Moscow, Russia, 1969; 24p. [Google Scholar]
  26. Robert, É.C.; Rochefort, L.; Garneau, M. Natural revegetation of two block-cut mined peatlands in eastern Canada. Can. J. Bot 1999, 77, 447–459. [Google Scholar]
  27. Smagin, V.A. Dinamika zarastanija torfjanyh kar’erov (na primere vyrabotannyh torfjanikov Leningradskoj oblasti) [Dynamics of overgrowth in peat pits (the example of mined out peatlands in the Leningrad region)]. Bot. Zhurnal. 1982, 67, 1112–1117. [Google Scholar]
  28. Panov, V.V. Bolotoobrazovatel’nyj Process i Torfjanye Resursy. Vosstanovlenie Torfjanyh Bolot [Peatland Formation and Peat Resources. Peatland Restoration]; Izdatel’stvo Tomskogo Gosudarstvennogo Pedagogicheskogo Universiteta: Tomsk, Russia, 2007; 80p. [Google Scholar]
  29. Murav’eva, L.V.; Tihomirov, O.A.; Markov, M.V. Formirovanie akval’no-territorial’nyh kompleksov vyrabotannyh torfjanyh bolot i ih klassifikacija [Formation of aquatic-territorial complexes of drained peatlands and their classification]. Ychenii Zap. Kazan. Univ. 2010, 152, 102–115. [Google Scholar]
  30. Grishutkin, O.G. Bolota Mordovii: Landshaftno-Jekologicheskij Analiz, Flora, Posledstvija Antropogennogo Vozdejstvija [Peatlands of Mordovia: Landscape-Ecological Analysis, Flora, Effects of Anthropogenic Impact]; Saransk: Pushta, Russia, 2015; 154p. [Google Scholar]
  31. Tuittila, E.-S.; Vasander, H.; Laine, J. Impact of Rewetting on the Vegetation of a Cut-Away Peatland. Appl. Veg. Sci. 2000, 3, 205–212. [Google Scholar] [CrossRef]
  32. Lavoie, C.; Rochefort, L. The natural revegetation of a harvested peatland in sourthern Quebec: A spatial and dendroecological analysis. Ecoscience 1996, 3, 101–111. [Google Scholar] [CrossRef]
  33. Feldmeyer-Christe, E.; Küchler, M.; Wildi, O. Patterns of early succession on bare peat in a Swiss mire after a bog burst. J. Veg. Sci. 2011, 22, 943–954. [Google Scholar] [CrossRef]
  34. Priede, A.; Mežaka, A.; Dobkeviča, L.; Grīnberga, L. Spontaneous revegetation of cutaway fens: Can it result in valuable habitats? Mires Peat 2016, 18, 1–14. [Google Scholar] [CrossRef]
  35. Edom, F.; Keßler, K.; Stegmann, H.; Wendel, D.; Dittrich, I.; Münch, A. Hydrologisches und moorkundliches Gutachten zur Konkretisierung von 20 Erhaltungs- und Entwicklungsmaßnahmen für das Moor Stengelhaide im FFHGebiet "Mothäuser Heide“. Dr. Dittrich & Partner Hydro-Consult GmbH & HYDROTELM—Edom & Stegmann, Bannewitz & Dresden, im Auftrag der LfULG Zwickau, 2009, p. 77.
  36. Minayeva, T.; Sirin, A.; Stracher, G.B. The Peat Fires of Russia. In Coal and Peat Fires: A Global Perspective; V.2: Photographs and Multimedia Tours; Stracher, G.B., Prakash, A., Sokol, E.V., Eds.; Elsevier: Amsterdam, The Netherlands, 2013; pp. 375–394. ISBN 9780444594129. [Google Scholar]
  37. Tuittila, E.-S.; Rita, H.; Vasander, H.; Laine, J. Vegetation patterns around Eriophorum vaginatum L. tussocks in a cut-away peatland in southern Finland. Can. J. Bot. 2000, 78, 47–58. [Google Scholar]
  38. Rochefort, L. Sphagnum—A Keystone Genus in Habitat Restoration. Bryol. 2000, 103, 503–508. [Google Scholar] [CrossRef]
  39. Rochefort, L.; Quinty, F.; Campeau, S.; Johnson, K.; Master, T. North American approach to the restoration of Sphagnum dominated peatlands. Wetl. Ecol. Manag. 2003, 11, 3–20. [Google Scholar] [CrossRef]
  40. Vasander, H.; Tuittila, E.-S.; Lode, E.; Lundin, L.; Ilomets, M.; Sallantaus, T.; Heikkilä, R.; Pitkänen, M.-L.; Laine, J. Status and restoration of peatlands in northern Europe. Wetl. Ecol. Manag. 2003, 11, 51–63. [Google Scholar] [CrossRef]
  41. Kozlov, S.A.; Lundin, L.; Avetov, N.A. Revegetation dynamics after 15 years of rewetting in two extracted peatlands in Sweden. Mires Peat 2016, 18, 1–17. [Google Scholar] [CrossRef]
  42. Purre, A.-H.; Truus, L.; Ilomets, M. A decade of vegetation development on two revegetated milled peatlands with different trophic status. Mires Peat 2021, 27, 1–16. [Google Scholar] [CrossRef]
  43. Gorham, E.; Rochefort, L. Peatland restoration: A brief assessment with special reference to Sphagnum bogs. Wetl. Ecol. Manag. 2003, 11, 109–119. [Google Scholar] [CrossRef]
  44. Frei, S.; Holderegger, R.; Bergamini, A. Thirty years later: How successful was the restoration of a raised bog in the Swiss lateau? Mires Peat 2021, 27, 1–27. [Google Scholar] [CrossRef]
  45. Hytteborn, H.; Maslov, A.A.; Nazimova, D.I.; Rysin, L.P. Boreal forests of Eurasia. In Coniferous Forests; Andersson, F., Goodall, D.W., Eds.; Ecosystems of the World; Elsevier: Amsterdam, The Netherlands, 2005; Volume 6, pp. 23–29. ISBN 9780444816276. [Google Scholar]
  46. Moen, A.; Joosten, H.; Tanneberger, F. Mire diversity in Europe: Mire regionality. In Mires and Peatlands of Europe. Status, Distribution and Conservation; Joosten, H., Tanneberger, F., Moen, A., Eds.; Schweizerbart: Stuttgart, Germany, 2017; pp. 97–150. [Google Scholar]
  47. Antipin, V.; Boychuk, M.; Grabovik, S.; Stoikina, N. Plant cover of natural mires and disturbed peatlands in Meshchera National Park, Russia. In Mires from Pole to Pole; Lindholm, T., Heikkila, R., Eds.; The Finnish environment: Helsinki, Finland, 2013; pp. 247–257. [Google Scholar]
  48. Available online: https://rp5.ru/ (accessed on 10 November 2022).
  49. Available online: https://meteoinfo.ru (accessed on 10 November 2022).
  50. Polevaja Geobotanika, [Field geobotany]. Korchagin, A.A., Lavrenko, E.M., Eds.; Nauka: St. Petersburg/Moskow, Russia, 1964; Volume 3, 500p.
  51. Polevaja Geobotanika, [Field geobotany]. Korchagin, A.A., Lavrenko, E.M., Eds.; Nauka: St. Petersburg/Moskow, Russia, 1976; Volume 5, 319p.
  52. Metody Issledovanij Bolotnyh Jekosistem Taezhnoj Zony [Research Methods for Mire Ecosystems in the Taiga Zone]. Kuznetsov, O.L., Ed.; Nauka: Leningrad, Russia, 1991; 128p.
  53. Galanina, O. Comparative application of two vegetation classification approaches to large-scale mapping of bog vegetation. Suo 2006, 57, 71–79. [Google Scholar]
  54. Vahromeev, I.V. Opredelitel’ Sosudistyh Rastenij Vladimirskoj Oblasti [Vascular Plant Handbook for the Vladimir Region]; Tranzit-IKS: Vladimir, Russia, 2002; 312p. [Google Scholar]
  55. Ignatov, M.S.; Ignatova, E.A. Moss Flora of Middle European Russia; Volume 1: Sphagnaceae—Hedwigiaceae; Association of Scientific Publications KMK: St. Petersburg/Moscow, Russia, 2003; pp. 1–608. [Google Scholar]
  56. Ignatov, M.S.; Ignatova, E.A. Moss Flora of Middle European Russia; Volume 2: Fontinalaceae—Amblystegiaceae; Association of Scientific Publications KMK: St. Petersburg/Moscow, Russia, 2003; pp. 609–944. [Google Scholar]
  57. Barriopedro, D.; Fischer, E.M.; Luterbacher, J.; Trigo, R.M.; García-Herrera, R. The hot summer of 2010: Redrawing the temperature record map of Europe. Science 2003, 332, 220–224. [Google Scholar] [CrossRef] [PubMed] [Green Version]
  58. Rydin, H.; Jeglum, J.K. The Biology of Peatlands; University Press: Oxford, UK, 2006; 162p. [Google Scholar]
  59. Blain, D.; Murdiyarso, D.; Couwenberg, J.; Nagata, O.; Renou-Wilson, F.; Sirin, A.; Strack, M.; Tuittila, E.-S.; Wilson, D.; Evans, C.D.; et al. Rewetted organic soils. Chapter 3. In 2013 Supplement to the 2006 IPCC Guidelines for National Greenhouse Gas Inventories: Wetlands; Hiraishi, T., Krug, T., Tanabe, K., Srivastava, N., Baasansuren, J., Fukuda, M., Troxler, T.G., Eds.; IPCC: Geneva, Switzerland, 2014; p. 41. Available online: https://www.ipcc.ch/publication/2013-supplement-to-the-2006-ipcc-guidelines-for-national-greenhouse-gas-inventories-wetlands/ (accessed on 15 December 2022).
  60. Thiele, A.; Edom, F.; Liashchynskaya, N. Prediction of vegetation development with and without rewetting. Chapter: Peatlands and climate. In Carbon Credits from Peatland Rewetting; Tanneberger, F., Wichtmann, W., Eds.; Schweizerbart Science Publishers: Stuttgart, Germany, 2011; pp. 42–52. [Google Scholar] [CrossRef]
  61. Buttler, A.; Warner, B.G.; Grosvernier, P.; Matthey, Y. Vertical Patterns of Testate Amoebae (Protozoa: Rhizopoda) and Peat-Forming Vegetation on Cutover Bogs in the Jura; Switzerland. New Phytol. 1996, 134, 371–382. [Google Scholar] [CrossRef]
  62. Sirin, A.; Medvedeva, M. Remote Sensing Mapping of Peat-Fire-Burnt Areas: Identification among Other Wildfires. Remote Sens. 2022, 14, 194. [Google Scholar] [CrossRef]
  63. Glukhova, T.V.; Sirin, A.A. Losses of soil carbon upon a fire on a drained forested raised bog. Eurasian Soil Sci. 2018, 51, 542–549. [Google Scholar] [CrossRef]
  64. Panov, V.V.; Tsymlyakova, S.S. Spatial structure of fires and burnt areas in the technologically disturbed peat bogs. Proc. Russ. Geogr. Soc. 2013, 145, 80–90. [Google Scholar]
  65. Pisani, D.; Pazienza, P.; Perrino, E.V.; Caporale, D.; De Lucia, C. The economic valuation of ecosystem services of biodiversity components in protected areas: A review for a framework of analysis for the Gargano National Park. Sustainability 2021, 13, 11726. [Google Scholar] [CrossRef]
Figure 1. The main impacts (milling peat extraction, fires and rewetting), the impact of which is studied on the example of peatlands in the National Park Meshchera, Vladimir region, the center of the European part of Russia. (a) Abandoned milled peat extraction. Ostrovsky peatland. Photo by V. Zheltukhin. (b) Grass wildfire. Tasinsky peatland. Photo by A. Vozbranaya. (c) Rewetting of abandoned milled peat extraction fields. Orlovsky peatland. Photo by V. L’vov.
Diversity 15 00003 g001
Figure 2. Location of Meshchera National Park in relation to the European mire regions, the administrative boundaries of the center of European Russia: its intact mires (light green), peatlands disturbed by peat extraction (dark green), being rewetted (blue), and the location of permanent monitoring plots, 1–10 - monitoring plot numbers. The European mire regions are given against [19] as simplified from [46]: II—palsa mire region, III—northern fen region, IV—typical raised bog region, V—Atlantic bog region, VI—continental fen and bog region, VII—nemoral-sub-meridional fen region.
Diversity 15 00003 g002
Figure 3. Characteristic types of plant communities represented in the studied peatlands. The numbers indicate the monitoring plots.
Diversity 15 00003 g003aDiversity 15 00003 g003bDiversity 15 00003 g003c
Figure 4. Water storage in snow on the sample areas (mm) for the observation period.
Diversity 15 00003 g004
Figure 5. Average GWLs for the growing season (May−August) over the observation period on the monitoring plots not affected by rewetting.
Diversity 15 00003 g005
Figure 6. Average GWLs during the growing season (May−August) for the observation period on the monitoring plots affected by rewetting.
Diversity 15 00003 g006
Figure 7. Pore-water pH values in wells during the growing season (May–August) for the observation period.
Diversity 15 00003 g007
Figure 8. Water electrical conductivity in wells for GWL measurements during the growing season (May−August) for the observation period.
Diversity 15 00003 g008
Figure 9. Changes in vegetation on permanent plot No. 7: 1 Pinus sylvestrisVaccinium uliginosum + Calamagrostis epigejos; 2 Comarum palustreSphagnum riparium; 3 P. sylvestrisV. vitis-idaea; 4 Calla palustrisSphagnum riparium; 5 P. sylvestrisLedum palustre; • single trees of Betula pubescens. The colours in this and other drawings highlight the areas: light green — dominated by pine and other conifers; dark green — dominated by deciduous trees; red — bare peat with possible sparse vegetation; blue — open water, with possible aquatic vegetation; blue — hygrophilous vegetation, including sphagnum mosses; yellow — grass vegetation, with possible undergrowth of trees and shrubs.
Diversity 15 00003 g009
Figure 10. Changes in vegetation on permanent plot No. 6: 1 Pinus sylvestrisVaccinium uliginosum + Chamaedaphne calyculataSphagnum fallax; 2 Phragmites australisS. fallax; 3 C. calyculata + Oxycoccus palustrisS fallax; 4 Carex rostrataS. fallax; 5 C. calyculata + P. australisS. fallax; 6 Calluna vulgaris + Ledum palustre + V. uliginosumS. fallax; 7 V. uliginosum + L. palustreS. fallax; 8 C. calyculata + C. rostrataS fallax.
Diversity 15 00003 g010
Figure 11. Changes in vegetation on permanent plot No. 5: 1 Pinus sylvestrisVaccinium uliginosum + Eriophorum vaginatum; 2 P. sylvestrisAndromeda polifolia + E. vaginatumSphagnum fallax; 3 water; 4 E. vaginatumS. fallax; 5 Eriophorum angustifolium + Calla palustrisS. fallax; 6 Betula pubescensA. polifolia + E. vaginatumS. fallax; 7 Oxycoccus palustrisE. vaginatumS. fallax; 8 E. vaginatum + E. angustifoliumS. fallax; 9 A. polifolia + E. vaginatum; 10 B. pubescensV. uliginosum; 11 A. polifolia + E. vaginatum; 12 C. palustrisS. fallax; 13 Carex rostrataS. fallax; 14 Sphagnum cuspidatum; 15 P. sylvestris + B. pubescensV. uliginosumS. fallax; 16 O. palustris + A. polifolia + E. vaginatumS. fallax.
Diversity 15 00003 g011
Figure 12. Changes in vegetation on permanent plot No. 2: 1 bare peat; 2 Betula pubescensChamaenerion angustifoliumCeratodon purpureus; 3 C. angustifolium; 4 Calamagrostis epigejos; 5 C. angustifolium + C. epigejosC. purpureus; 6 curtains of Polytrichum juniperinum; 7 C. epigejos + C. angustifolium; 8 B. pubescens + Populus tremula.
Diversity 15 00003 g012
Figure 13. Changes in vegetation on permanent plot No. 10: 1 Carex rostrata + Juncus filiformis; 2 Betula pubescensAgrostis gigantea + Rumex acetosella; 3 B. pubescens - Salix cinereaCalamagrostis epigejosPolytrichum juniperinum; 4 S. cinereaJuncus conglomeratus; 5 P. juniperinum; 6 Utricularia vulgaris; 7. B. pubescensC. epigejos + A. giganteaPolytrichum commune; 8 B. pubescens + Populus tremulaJ. conglomeratus; 9 C. rostrata + Comarum palustre; 10 B. pubescensC. epigejos + Potentilla erectaP. commune; 11 B. pubescensC. epigejos + P. erectaP. commune; 12 B. pubescens + P. tremulaS. cinereaC. epigejosP. commune; 13 Nardus stricta + P. erecta; 14 Comarum palustre + Carex rostrata; 15 C. epigejos + C. palustre; 16 B. pubescens + P. tremula + S. cinerea; 17 bushes of S. cinerea.
Diversity 15 00003 g013
Figure 14. Changes in vegetation on permanent plot No. 8: 1 Betula pubescensSalix cinerea; 2 Calamagrostis epigejos + Molinia caerulea; 3 Salix auritaC. epigejos + Epilobium adenocaulonMarchantia polymorpha; 4 Typha latifolia; 4 quagmire; 5 B. pubescensS. cinereaC. epigejos; 6 T. latifolia; 7 S. cinereaC. epigejos; 8 Carex pseudocyperus + T. latifolia; 9 C. epigejos; 10 T. latifolia + C. pseudocyperus; 11 S. cinereaPhragmites australis + C. pseudocyperus; 12 B. pubescensC. epigejos; 13 B. pubescensS. cinerea; 14 B. pubescensCalamagrostis canescens; 15 S. cinereaP. australis; 16 B. pubescensS. cinerea; 17, 18, 19 B. pubescensS. cinereaC. epigejos; 20 lake with single S. cinerea; 21 bushes of S. cinerea.
Diversity 15 00003 g014aDiversity 15 00003 g014b
Figure 15. Changes in vegetation on permanent plot No. 11: 1 single Vaccinium uliginosum, Andromeda polifolia; 2 Betula pubescensEriophorum vaginatumPolytrichum juniperinum; 3 E. vaginatum; 4 Oxycoccus palustris + E. vaginatum; 5 P. juniperinum; 6 single B. pubescens; 7 water; 8 bare peat; 9 V. uliginosum + Molinia caerulea + E. vaginatumP. juniperinum; 10 B. pubescensV. uliginosumP. juniperinum; 11 Populations of E. vaginatum and Sphagnum cuspidatum; 12 V. uliginosum + E. vaginatum; •—P. juniperinum.
Diversity 15 00003 g015
Figure 16. Changes in vegetation on permanent plot No. 1: 1 Calla palustris + Typha latifolia; 2 Betula pubescensEriophorum vaginatum; 3 E. vaginatum; 4 B. pubescensPolytrichum juniperinum; 5 bare peat; 6 Phragmites australisP. juniperinum; 7 B. pubescensCalamagrostis epigejos; 8 P. australis + Lemna minor; 9 B. pubescensE. vaginatumP. juniperinum; 10 B. pubescensP. australisP. juniperinum; 11 B. pubescensE. vaginatum; 12, 13 E. vaginatumP. juniperinum; 14 B. pubescensE. vaginatumP. juniperinum; 15 E. vaginatumP. juniperinum; 16 C. palustris + P. australis; 17 Salix cinereaE. vaginatum; 18 B. pubescensE. vaginatum; 19 E. vaginatum + P. australis; 20 S. cinereaC. palustris + T. latifolia; 21 Hydrocharis morsus-ranae + Utricularia minor; 22 P. australis + H. morsus-ranae; 23 Agrostis stolonifera + Scirpus radicans; 24 P. australis + Carex canescens; 25 S. cinereaP. australis + C. palustris; 26 E. vaginatumLeptodictyum riparium; 27 bushes of S. cinerea; 28 water; 29 P. australis + C. canescensSphagnum squarrosum; 30 P. australisSphagnum riparium; 31 bushes of P. australis; 32 single Carex rostrata; 33 bushes of P. australis.
Diversity 15 00003 g016
Figure 17. Changes in vegetation on permanent plot No. 3: 1 Salix cinereaCarex canescensPolytrichum juniperinum; 2 Typha latifolia; 3 T. latifolia + Epilobium adenocaulon; 4 C. canescens + Eriophorum angustifoliumWarnstorfia fluitans; 5 bushes of S. cinerea; 6 Scirpus radicans; 7 S. cinereaT. latifolia; 8 S. cinereaBidens cernua; 9 water; 10 bare peat; 11 Carex rostrata + Hydrocharis morsus-ranae; 12 S. cinereaPhragmites australis; 13 C. rostrata + Eleocharis mammilataLeptodictyum riparium; 14 S. cinereaCarex pseudocyperus; 15 P. australis + C. pseudocyperus.
Diversity 15 00003 g017aDiversity 15 00003 g017b
Figure 18. Changes in vegetation on permanent plot No. 4: 1 bare peat; 2 Eriophorum vaginatum; 3 Eriophorum angustifoliumPolytrichum juniperinum; 4 Betula pubescensE. vaginatum; 5 single curtains Sphagnum cuspidatum + Sphagnum fallax; 6 Carex rostrata - Warnstorfia fluitans; 7 E. angustifoliumS. cuspidatum; 8 E. vaginatumS. cuspidatum; 9 C. rostrataSphagnum riparium; 10 open water with C. rostrata; 11 C. rostrata + Calamagrostis canescensS. riparium; 12 E. vaginatum; 13 E. angustifolium + C. canescensS. riparium; 14 water; 15 C. rostrata; 16 E. vaginatum + E. angustifolium; 17 C. rostrataS. cuspidatum; 18 C. rostrata + E. vaginatum; 19 E. angustifoliumS. riparium; 20 C. rostrata + P. australisS. riparium; 21 C. rostrataS. fallax + S. riparium; 22 E. angustifoliumS. fallax + S. riparium; 23 C. rostrataS. fallax; 24 C. rostrata + E. angustifoliumS. fallax.
Diversity 15 00003 g018
Figure 19. Changes in vegetation on permanent plot No. 9: 1 Calamagrostis epigejos + Persicaria maculosa; 2 Scirpus sylvaticus + Juncus conglomeratus; 3 Carex pseudocyperus + S. sylvaticus; 4 Salix cinerea + Salix myrsinifoliaC. epigejos + Lycopus europaeus; 5 bare peat; 6 quagmire; 7 Betula pubescensJ. conglomeratus + C. epigejos; 8 Alisma plantago-aquatica + S. sylvaticus; 9 C. epigejos + J. conglomeratus; 10 S. sylvaticus; 11 B. pubescensC. epigejos + Agrostis canina; 12 B. pubescensC. epigejos + J. conglomeratus; 13 A. plantago-aquatica + S. sylvaticusSphagnum squarrosum; 14 C. epigejos + A. canina; 15 Typha latifolia; 16 S. sylvaticusBidens tripartite; 17 B. pubescens + S. cinerea; 18 water; 19 S. cinerea - Phragmites. australis; 20 Carex rostrata + S. sylvaticus; 21 B. pubescensCalamagrostis canescens + Carex canescens; 22 P. australis + A. plantago-aquatica; 23 P. australis + Hydrocharis morsus-ranae; 24. Thickets B. pubescens; 25 B. pubescensPolytrichum juniperinum; 26. A. plantagoaquatica; 27 P. australis; 28 B. pubescensS. cinerea; 29 single C. pseudocyperus.
Diversity 15 00003 g019
Figure 20. Combined scheme of vegetation change at monitoring plots after peat extraction, fires and rewetting. No. 1: probably flooded in middle 1990’s; by 2003 communities of hygrophilous species with cotton-grass had formed; 2007, runaway grass wildfire; September 2007, flooded; 2012–2020, initial stages of sphagnum communities formation, by 2021 their proportion increased to 13.6%. No. 2: after mining had finished in the middle 1990s, probably, it burned; after the fire—post-pyrogenic communities; 2002—burned out completely; the next year, post-pyrogenic communities, alien species appeared; 2007—burned again; birch–willow–herb and birch–wood–reed communities are forming, appearance of alien species; by 2021 young birch–aspen forest has formed. No. 3: in 2000s probably waterlogged; hygrophilous poplar communities are forming; 2007—runaway grass wildfire; fall 2007—waterlogged, pool with single aquatic plants appeared; lacustrine and riparian vegetation. No. 4: Cutter peat mining until 1990s, then probably flooded; hygrophilous-quagmire communities formed; 2002—grass wildfire; in 2007 rewetting; pool appeared; by 2021 mire communities formed, proportion of sphagnum mosses about 90%. No. 5: 1950–2006—emergence of woody-shrubby vegetation on berms; overgrowth of pools in pits; 2007, berm vegetation burned out; 2008–2010—restoration of vegetation on berms; formation of floating mats on the edges of the pool; 2017—formation of forest and mire vegetation, the pool decreased by 2.6 times at the expense of overgrowth. No. 6: after the end of mining, the banks are overgrown; 1995—presumably wildfire, vegetation of the banks burned out; 2001–2003—formation of reed–sphagnum sedge–sphagnum communities; mire communities formed by 2021. No. 7: formation of woody–shrubby vegetation on berms since 1950s; pits overgrown; pine–shrubby communities formed on ridges by 2003; sphagnum–sphagnum communities formed in pits. No. 8: peat extraction was finished in 1978; from the end of 70s birch overgrowth; fire in 2002; birch–willow and willow–wood–reed communities appeared on the burnt area; by 2008 mixed grass birch forest was formed. No. 9: after completion of peat extraction in 1990s, reclamation with planting of pines was carried out; plantings died because of excessive moistening; by 2003 hygrophilous-quagmire vegetation is formed; 2007—rewetting, increase of pool and flooding of coastal communities; by 2012 lacustrine and coastal-water vegetation dominates. No. 10: production site, used for parking of machinery; 1990–2000 formation of herbaceous plant communities; 2002—runaway grass wildfire; willow–birch and birch–grass communities formed; spring 2009—runaway wildfire, woody vegetation affected; by 2021 forest vegetation. No. 11: peat extraction stopped in 1992; 2002—wildfire; 2003—single mire plants; 2007—wildfire; 2016—birch–birch–moss communities formed.
Diversity 15 00003 g020
Table 1. Location and characteristics of the monitoring plots.
PeatlandPlot NSize, mOrientationPeat Depth, cmPeat TypeCoordinates *
Tasinsky120 × 25NW75Eutrophic55°35′42.5″ N; 40°08′10.7″ E″
215 × 15SE200Oligotrophic55°35′35.8″ N; 40°07′56.0″ E″
320 × 20NE210Mesotrophic55°35′18.1″ N; 40°07′17.8″ E″
420 × 10SW90Mesotrophic55°35′49.4″ N; 40°08′01.4″ E″
520 × 15NNW300Oligotrophic55°35′48.9″ N; 40°08′18.4″ E″
615 × 15SSE250Mesotrophic55°36′04.4″ N; 40°08′58.4″ E″
715 × 7SE200Eutrophic55°36′07.2″ N; 40°09′03.0″ E″
930 × 30NNW175Eutrophic55°34′22.8″ N; 40°09′36.9″ E″
1020 × 20NNW20Eutrophic55°36′06.3″ N; 40°09′45.1″ E″
Garinsky820 × 25S30Eutrophic55°43′52.7″ N; 40°01′21.2″ E″
Ostrovsky1120 × 40E350Oligotrophic55°46′33.31″ N; 40°11′06.2″ E″
*—WGS84.
Table 2. Previous economic use; type of ecological-vegetation complex and its characteristics at the beginning of monitoring; numbers of permanent plot.
UseEcological-Vegetation ComplexDominant Plant SpeciesPeat Depth, mGWL, cmPlot No.
Sod peat extractionMirePinus sylvestris, Vaccinium uliginosum, Chamaedaphne calyculata, Eriophorum vaginatum, Sphagnum fallax2.15–3Ditch edge
−20…−50
Main surface 0–15
Pool > +50
5, 6
Forest-mireP. sylvestris, Ledum palustre, V. uliginosum, Calla palustris, Comarum palustre, Sphagnum riparium2Ditch edge
−40…−70;
Main surface
0…−5
7
Peat milled extraction (submerged)Hygrophilous-quagmireEriophorum angustifolium, C. palustris, Carex canescens, Typha latifolia, Sphagnum cuspidatum,
S. fallax
0.75–2.10Main surface
−10…−50;
Ditches +30…+50
1, 3, 4
Water and coastal-waterScirpus sylvaticus, Phragmites australis, Alisma plantago-aquatica1.75Pool +50…100, Main surface
0... −50
9
Peat milled extractionPostpyrogenic (peat-mineral soil)C. canescens, Betula pubescens, Epilobium adenocaulon, T. latifolia, Polytrichum commune0.1–0.2
0.75
0.1–0.3
Ditches and pits +10… +30 Main surface
−10…−50
8, 10 *
Postpyrogenic (raised bog peat)B. pubescens, V. uliginosum, E. vaginatum, Polytrichum juniperinum>4Main surface
−20…−70
2, 11
*—an area with a peat thickness of 20–30 cm, which was used for turning and parking machinery, installation of temporary structures.
Table 3. Average monthly and mean annual air temperature for the observation period and their average values for the 30-year period (1981–2010). The colour intensity indicates the degree of negative (blue) or positive (orange) deviation from the average temperature values.s.
Month
Year
IIIIIIIVVVIVIIVIIIIXXXIXIIAnnual
Mean
2007−12.6−15.2−4.75.412.318.716.817.112.65.91.0404.77
2008−9.2−2.91.29.111.315.319.517.910.28.11.6−3.26.57
2009−7.5−6.4−1.73.713.817.918.915.913.65.30.76−8.35.49
2010−16−9.7−2.47.416.818.925.621.311.13.21.9−8.45.80
2011−9.6−13.2−3.74.914.31822.718.811.15.8−1.9−1.75.45
2012−8.3−12.8−4.17.714.817.320.517.412.36.60.7−9.45.22
2013−9.8−5.0−7.05.716.219.419.018.110.35.62.8−2.76.05
2014−10.1−3.51.36.015.815.519.818.411.42.4−2.7−4.55.81
2015−6.5−3.40.45.121518.118.016.213.93.1−0.7−1.26.50
2016−11.3−1.3−0.47.814.317.620.419.510.03.9−3.3−6.85.86
2017−9.7−5.91.65.310.414.217.718.012.54.6−1.3−1.05.53
2018−6.1−11−7.16.515.316.620.318.613.26.0−2.3−7.45.21
2019−9.0−3.2−0.66.816.018.816.315.411.07.8−0.5−1.16.47
2020−1.3−2.03.04.011.617.819.316.612.87.60.5−7.56.86
2021−6.9−13.7−3.06.814.720.221.820.09.45.51.1−8.55.61
1981–2010−8.0−7.9−2.16.012.91719.216.810.94.8−2.2−6.615.06
Table 4. Average monthly and annual mean precipitation for the observation period and their average values for the 30-year period (1981–2010). Dark and light green shows the deviation towards higher or lower precipitation values.
Month
Year
IIIIIIIVVVIVIIVIIIIXXXIXIIAnnual
Mean
200738.041.136.344.286.327.8119.290.356.366.499.854.6760.3
200827.744.3117.036.1102.093.5102.097.770.749.35.532.6778.4
200943.438.242.330.221.786.28080.931.4153.758.049.1715.1
201024.341.622.727.4120.047.21.049.240.455.378.984.3592.3
201153.733.045.236.920.422.789.513.770.136.166.169.4556.8
201273.331.941.889.241.8139.133.557.00050.361.9619.8
201333.221.077.04655.833.891.133.1185.234.939.442692.5
201441.926.118.915.333.2130.724.968.516.861.620.671.1529.6
201553.534.84.742.660.5127.745.349.728.731.831.450.8561.5
201690.752.232.446.141.642.482.260.449.315.064.341.1617.7
201731.034.242.037.454.980.896.536.864.589.655.088.5711.2
201828.922.934.669.833.934.867.650.452.556.320.749.6522.0
201937.440.046.625.949.450.87889.942.284.326.930.3601.7
202047.327.128.150.277.447.610014.327.127.523.417.3487.3
202176.060.033.094.073.036.014.049.091.030.181.072.0709.1
1981–2010473834414681686658725556662
Disclaimer/Publisher’s Note: The statements, opinions and data contained in all publications are solely those of the individual author(s) and contributor(s) and not of MDPI and/or the editor(s). MDPI and/or the editor(s) disclaim responsibility for any injury to people or property resulting from any ideas, methods, instructions or products referred to in the content.