Article

Geometric Morphometrics of the Cranium and Mandible in Social Voles of the “Guentheri” Group (Arvicolinae: Sumeriomys)

1
Department of Zoology and Animal Ecology, University of Latvia, 1 Jelgava Street, LV-1004 Riga, Latvia
2
Institute of Biology, University of Latvia, 4 O. Vaciesa Street, LV-1004 Riga, Latvia
3
Zoological Institute, Russian Academy of Sciences, Universitetskaya Emb. 1, Saint Petersburg 199034, Russia
*
Author to whom correspondence should be addressed.
Diversity 2023, 15(1), 83; https://doi.org/10.3390/d15010083
Submission received: 6 December 2022 / Revised: 4 January 2023 / Accepted: 5 January 2023 / Published: 8 January 2023

Abstract

:
We analyzed the cranium dorsal projection and the mandible lateral projection in bone specimens from five Microtus guentheri and Microtus hartingi forms by geometric morphometrics (GM) methods (generalized Procrustes analysis, principal component analysis, canonical variance analysis, and discriminant function analysis). Analyses of the linear size and shapes of the cranium and lower jaw showed clear-cut differentiation among the forms into an eastern cluster and western cluster, matching M. guentheri and M. hartingi, respectively. Differences were revealed both between two subspecies of M. guentheri and between the subspecies M. h. strandzensis and Rhodopean M. hartingi, whose subspecies status has not yet been determined. M. h. ankaraensis bone specimens differ in many parameters of GM from the studied European specimens and to a lesser extent from M. g. guentheri and M. g. philistinus. Calculated morpho-ecological indices of the lower jaw revealed significant differences among all these forms, thereby possibly indicating adaptation of each to a specific habitat and dietary habits. Because of the emergence of impenetrable barriers for voles (the Anatolian Diagonal in the east and the Dardanelles and Bosporus in the west), the resultant vole groups have evolved independently.

1. Introduction

The position of social voles in the subfamily Arvicolinae has been unclear for a long time. For the first time, Argyropulo [1] proposed to allocate social voles into special subgenus Sumeriomys Argyropulo, 1933, within the genus Microtus. Ellerman [2] has subdivided the subgenus into two taxa: “socialis” and “guentheri”. This subdivision into groups has been confirmed by molecular analyses of the Cytb gene [3,4,5]. The socialis group comprises the following species: Microtus socialis Pallas, 1773; M. anatolicus Kryštufek et Kefelioglu, 2001; M. irani Thomas, 1921; and M. schidlovskii Argyropulo, 1933. The taxonomic status of the last two nominative forms varies among different authors. These forms are regarded as several distinct species, as one polymorphic species, or as the “irani–schidlovskii” species complex [6,7,8,9,10,11,12]. The “guentheri” group according to Ellerman [2] includes M. guentheri guentheri Danford and Alston (1880) (Türkoğlu-Kahramanmaraş in southeastern Anatolia, Asia Minor, Turkey); M. g. shevketi Neuhauser, 1936 (Tarsus, Vilayet Adana, Asia Minor, Turkey); M. g. lydius Blackler, 1916 (Smyrna, Asia Minor, Turkey); M. g. hartingi Barrett-Hamilton, 1903 (Larissa, Thessaly, Greece); M. philistinus Thomas, 1917 (Ekron, south-east of Jaffa, Israel); M. mustersi Hinton, 1926 (Cyrenaica, N. Africa, Libya); and M. cabrerae Thomas, 1906 (Rascafria, Province of Madrid, Spain). The latter species has later been excluded from the “guentheri” group [13].
Karyological similarity has been confirmed for voles from Anatolia and from the Balkans [6,7,14,15,16,17,18]. Kryštufek et al. [3,4] and Golenishchev and Malikov [19] have performed systematic research on this taxon using a Cytb marker and separated the “guentheri” group into two lineages that correspond to two nominative species: M. guentheri (eastern Anatolia, Syria, and Israel) and M. hartingi (Macedonia, Greece, Bulgarian and Turkish Thrace, western and central Anatolia). According to molecular data, M. hartingi voles are grouped into one clade [3,20]; however, isolated populations of this species in the Balkans and Turkey have diverged unequally, and this outcome probably reflects the duration of their isolation.
Traditionally, the “guentheri” group has been thought to contain seven nominative forms. M. guentheri is represented by two subspecies: the subspecies M. g. guentheri inhabiting the southeastern part of Anatolia and M. g. philistinus being widespread in Syria and Israel. M. hartingi has the following subspecies: M. h. hartingi (Greece); M. h. lydius (western Anatolia); M. h. macedonicus Kretzoi, 1964 (=M. h. martinoi Petrov, 1939) (Macedonia and Serbia); M. h. strandzensis (Markov, 1960) (Thrace); and M. g. shevketi (Cilician Plain, southeast Turkey). Moreover, according to Cytb gene analyses, three additional species should be assigned to this group: M. mustersi; M. dogramacii Kefelioğlu and Kryštufek, 1999, from central Turkey; and M. qazvinensis Golenishchev et al., 2003, from northwestern Iran [3,4,10]. Some authors regard the latter species as a junior synonym of M. dogramacii [9,11]. The taxonomic position of a form from the coast of western Anatolia is controversial. It has been described as an independent species [21], as a subspecies of M. guentheri [13], and as a subspecies of M. socialis [22,23]. Turkish researchers have proposed to restore the species status of this form. Moreover, they distinguish two subspecies M. lydius lydius and M. l. ankaraensis [16,24]. Markov et al. [25] found that M. l. lydius and M. l. ankaraensis are highly similar morphologically and that M. guentheri is closer to these subspecies than to the European populations. These authors consider M. lydius an endemic valid species of western Anatolia and think that it differs from the M. hartingi of southeastern Thrace (Bulgaria and Turkey) in dorsal coloration and in skull and baculum shapes [26]. Nonetheless, those authors expressed a different opinion in a later paper [27]. They classified the Thrace population as M. h. hartingi, but the population of western Anatolia is hard to classify as M. hartingi (previously termed M. lydius by Yiğit et al.) [26]. At present, however, this trinomial name is used for voles from Greece, while another subspecies, M. h. strandzensis [28], resides in Thrace. According to other authors [29], this is just a subspecies, M. h. lydius. The use of the trinomial classification within M. hartingi and M. guentheri is not sufficiently substantiated and is mostly explained by the presence of isolated populations that are given the subspecies status. At the molecular level, no clear genetic differences have been found using the Cytb gene between different subspecies forms of M. hartingi [3,4,8,10,20], and for this reason, the legitimacy of the form described by formal trinomial taxonomy has been called into question [11]. Nevertheless, numerous data on morphology and evidence from analysis of the Cytb gene and from experimental hybridization indicate the complicated intraspecific structure of M. hartingi, and this structure should be reflected in the trinomial nomenclature. There are studies on the linear morphometry of the skull, on the baculum [6,16,30], on exterior signs [6,26], and on linear and geometric morphometrics (GM) of spermatozoa [31,32] and of the brain [33] in some species of the “guentheri” group. To detect reproductive isolation between species, their hybridization is also widely used [6,34,35]. An integrative analysis of an isolated population of Harting’s vole (M. hartingi) from the Eastern Rhodope Mountains (Bulgaria) has been carried out by means of morphological and morphometric methods, computed tomography, Cytb gene variation data, and experimental hybridization [8].
To detect the morphological heterogeneity of the two species M. hartingi and M. guentheri across their entire range, we used the method of GM of the cranium and lower jaw (mandible) in representatives of the “guentheri” group. Special attention is paid to the jaw, which may contain taxonomic and phylogenetic information [36,37]. On the other hand, it cannot be ruled out that the structure and shape of the cranium and especially of the mandible reflects adaptation to the external environment. Changes in the climate, feeding, and digging on different substrates can affect first the functional adaptations and later the jaw shape [38,39]. It has been experimentally shown that mandible shape and integration have evolved as parts of a complex system including mechanical loading food resource utilization and possibly foraging behavior [40].
The purposes of this work were (i) to determine the degree of differentiation in the shape of the cranium and of the mandible both between species M. guentheri and M. hartingi and among their intraspecific forms and (ii) to assess the taxonomic value of these data by GM analysis of the cranium and lower jaw.

2. Materials and Methods

2.1. Morphometry

2.1.1. Material

We studied 126 crania and 125 mandibles of M. hartingi and M. guentheri (67 males and 59 females) from the bulk of their geographic ranges (see a map in 8). Samples of three M. hartingi forms and two M. guentheri forms were investigated: M. hartingi (“Har R”: Mandrica, the Rhodopes, Bulgaria; 41°41 N, 26°12′ E; collection of the department of Zoology: DEZ, University of Latvia), M. h. strandzensis (“Str”: Gramatikovo, Bulgaria, 42°3′ N, 27°39′ E); M. h. ankaraensis (“Ank”: Kirşehir, Turkey; 39°9′ N, 34°6′ E), M. g. guentheri (“Gue”: Türkoğlu, Turkey; 37°23′ N, 36°52″ E), and M. g. philistinus (“Phi”: Qiryat Shemona, Israel; 33°12′ N, 35°35′ E) (collection of the Zoological Institute [ZIN], Russian Academy of Sciences, St. Petersburg, Russia) (Table 1). The skulls were obtained from the animals either from natural populations (seven individuals of M. hartingi from the Rhodopes: ID 1–4, 6–8; Table S1) or after 1–2 generations of laboratory breeding (Table S1). We did not find significant differences in size and shape between wild-caught and captive-bred Rhodopean M. hartingi individuals; therefore, all of the specimens were combined into one group. Age has a strong influence on the size and shape of the crania and mandibles [41,42]. Therefore, for morphometric analyses, we used the skulls of adult animals (5–6 months old).

2.1.2. Microscopy

Eighty-six crania and eighty-two mandibles from ZIN collections were photographed using a stereomicroscope equipped with a Canon EOS 60D camera and subsequently, these data were processed in Helicon Focus v. 6.8.0 and Helicon Remote v. 3.9.2 W. A Leica MSV266 stereomicroscope combined with a digital camera operated by software (Leica Application Suite, version 1.06d) was employed to obtain pictures of 40 cranium specimens and 43 mandible specimens from DEZ (Table 1). Afterwards, all of the specimens were fixed separately on a movable piece of plasticine (height: 5 mm). A millimeter scale bar was placed near each specimen during photography for the subsequent measurement calibrations. Appropriate magnification and focus were chosen for visibility of an entire specimen in a single field of view. The geographical forms, sex, position (cranium or mandible), and a three-digit code of individual ID were coded in the name for each digital photograph, and the file was saved in TIF format (digital resolution: 4272 × 2848 pixels for ZIN and 2560 × 1920 pixels for digital images of the DEZ specimens). All of the photographed objects were calibrated and thus brought to a single measurement scale owing to different image optical resolutions resulting from the need to combine the images obtained at different scientific organizations. Such different optical resolutions may slightly reduce the accuracy of the estimates during subsequent shape analyses. This issue does not significantly affect our results but in further research, it should be taken into account and avoided.

2.1.3. Differences in the Size of Crania and Mandible, and the Mandible Indices

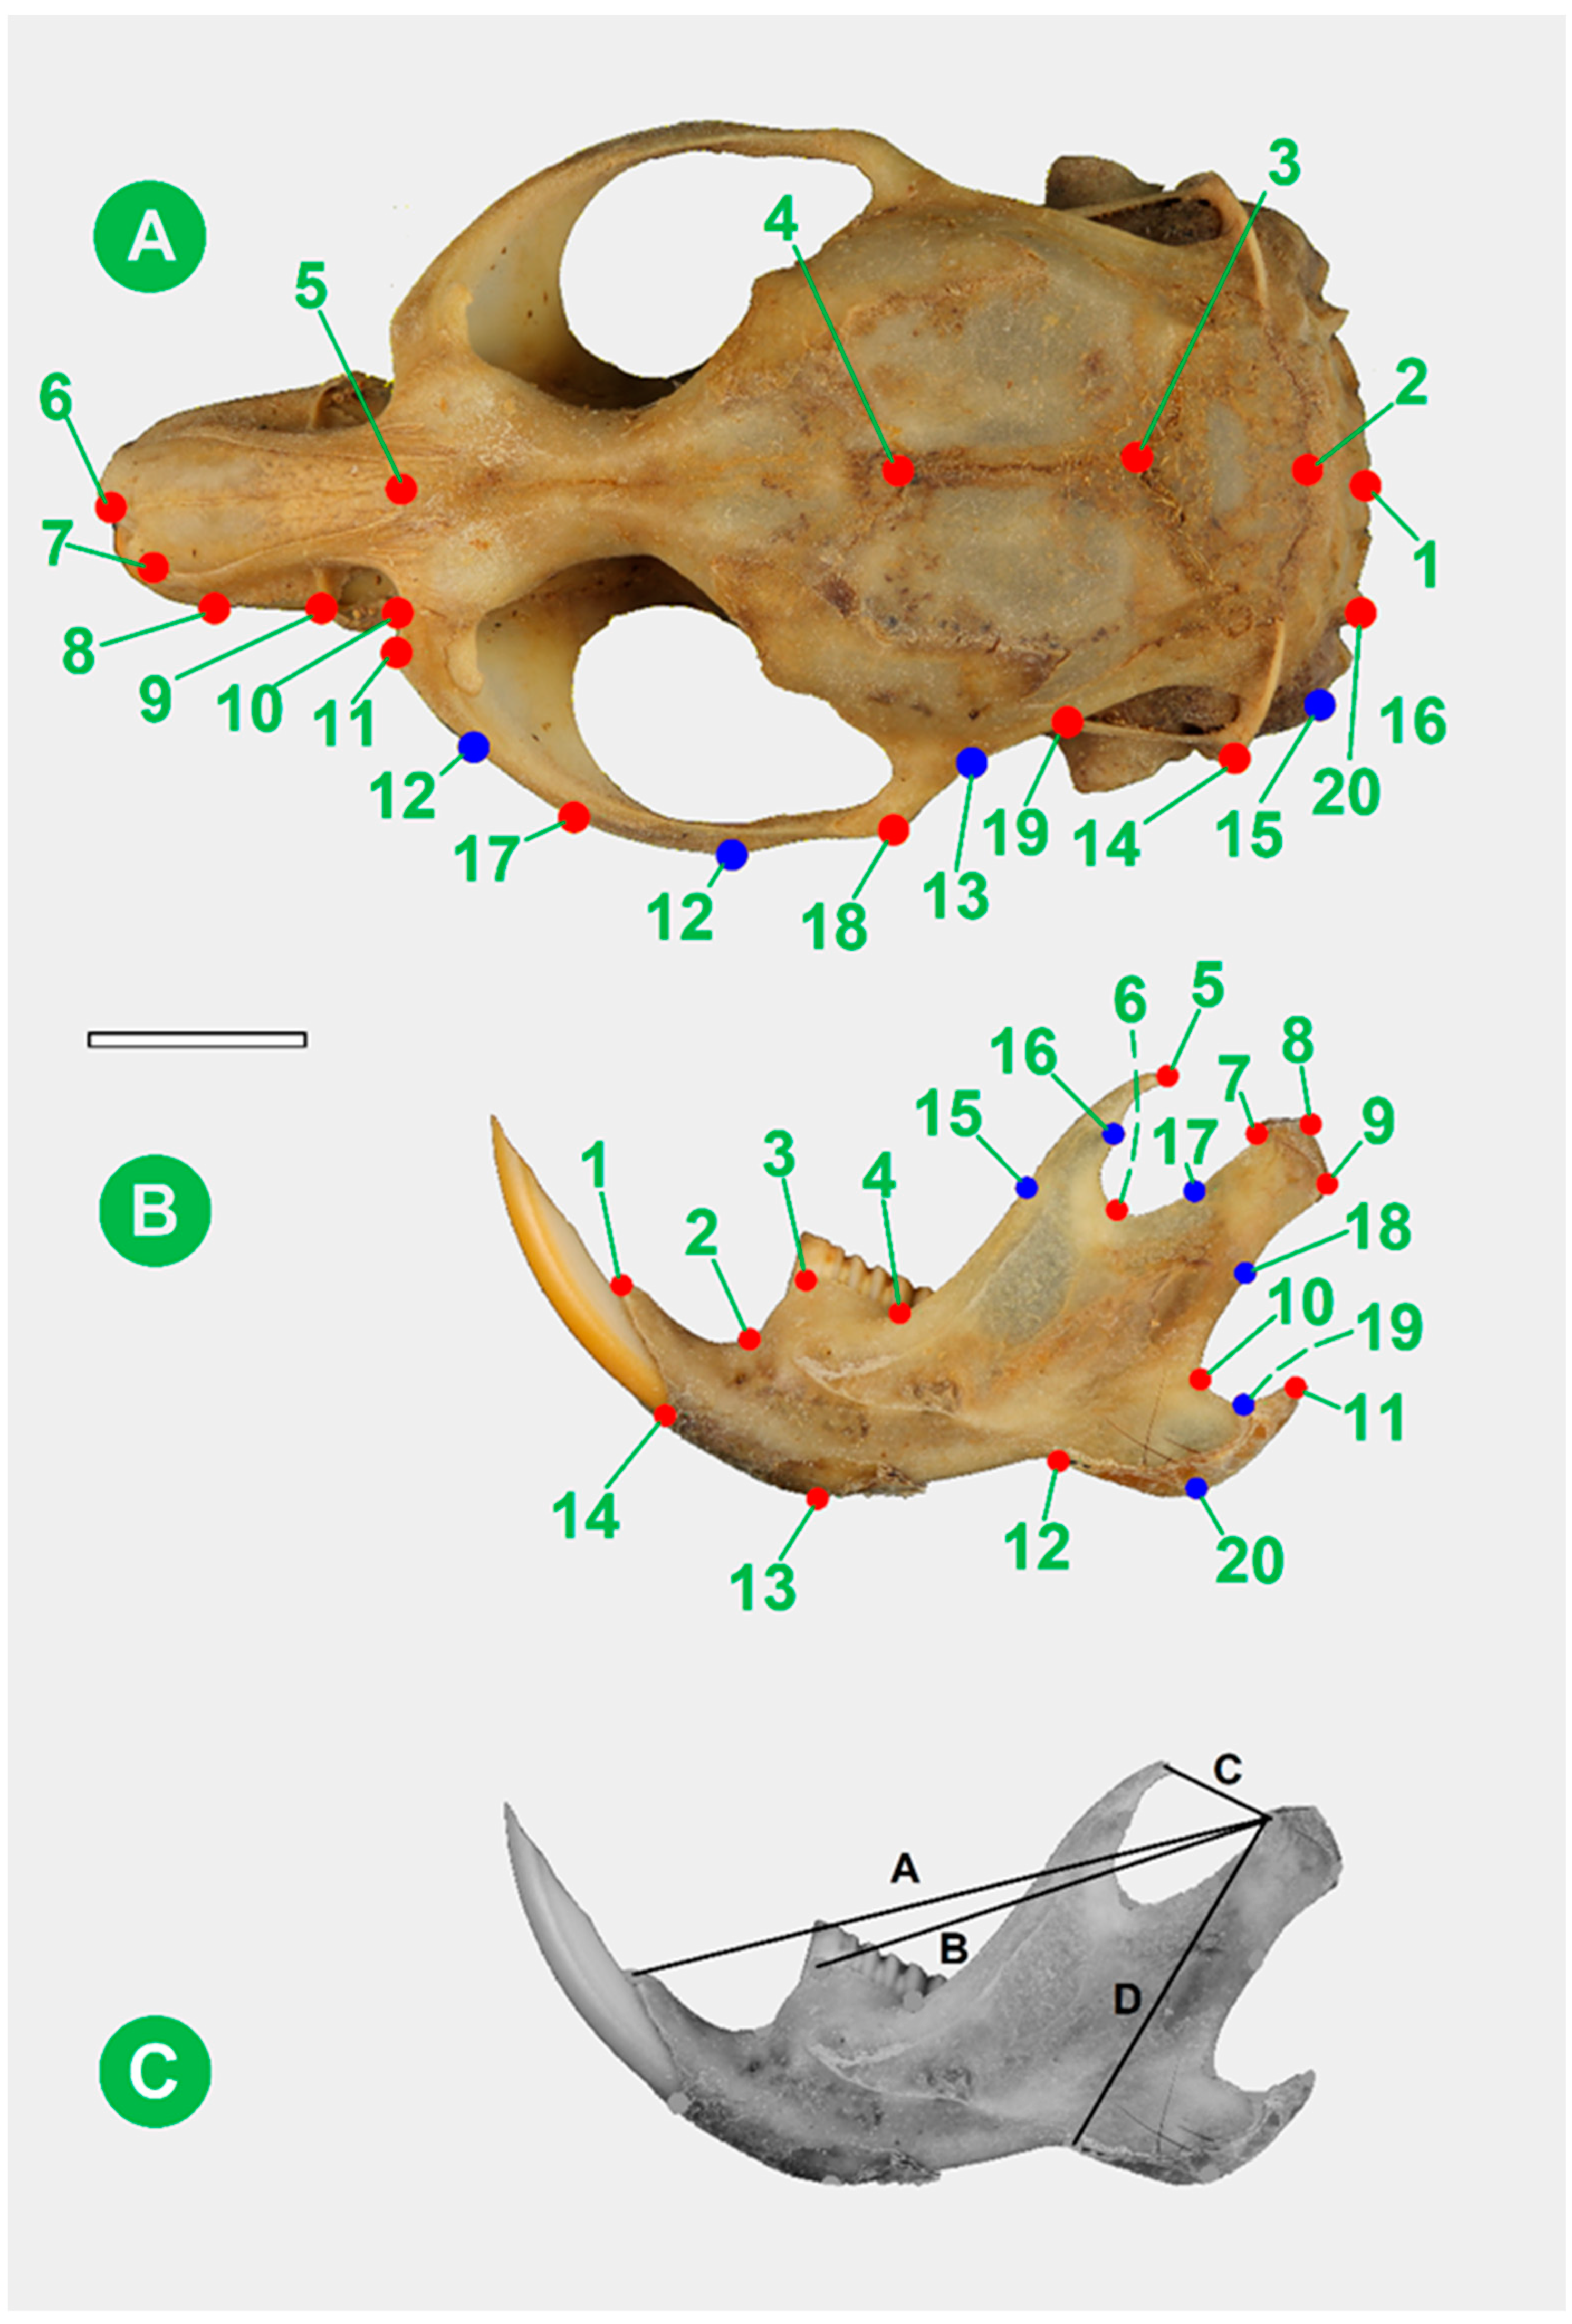
The choice of linear measurements was based on the results of an analysis of shapes of the cranium and lower jaw. Linear measurements were taken with the help of landmarks: two cranial parameters (LM 1–6 and LM 5–6) and five distances for the mandible (LM 5–8, LM 5–12, LM 11–14, LM 16–17, and LM 5–20) (Figure 1A,B). The values of the distances were taken as absolute values computed on aligned specimens. A number of studies have shown that the morpho-ecological indices of the lower jaw obtained via four characteristic measurements make it possible to investigate the configurations that characterize the morphological functional features associated with differences in the mechanics of food processing by rodents [40,43]. This approach allows scientists to quantify trophic specialization of populations and species. Four indices were calculated [44]: temporal incisive (TI) = C/A, temporal molar (TM) = C/B, masseter incisor (MI) = D/A, and masseter molar (MM) = D/B (Figure 1C). These indices served as indirect ecological criteria for characterizing interspecific or intraspecific differentiation.

2.2. GM and Shape Analyses

Twenty landmarks from the cranium and from the mandible were digitized (Figure 1 and see Appendix A for the correspondence of landmarks) in tpsDig32 [45]. Curve lines representing a contour of a specimen were digitally drawn using tpsDig32 software and a Wacom Intuos Draw CTL-490DW drawing tablet. Additionally, the linear traits were determined manually by calculation of interlandmark distance among seven pairs of landmarks used in GM (see below): 1–16, 5–8, 5–12, 5–20, and 11–14 for mandible landmark data and 1–6 and 5–6 for cranial landmark data. Euclidean distances were computed.
Data on crania and mandibles were separated and treated as two different datasets. In the case of M. hartingi from the Rhodopes, some specimens were excluded from the analysis owing to missing landmarks. The position of missing landmarks was first estimated and next, all of the specimens missing at least one landmark were excluded from the further analyses (see Table 1). Data on form, sex, and geographical location were treated as variables (individuals or factors).
Figure 1. Locations (A): the dorsal projection of the cranium, (B): the lateral projection of the mandible) of anatomical (type I) landmarks (red dots) and mathematical (type III) landmarks (blue dots) and (C): four linear distances (A: incisor; B: molar; C: temporal; D: masseter) that served as a basis for calculation of morpho-ecological indices (Appendix A). Green numbers indicate the landmark numbers. Scale bar: 5 mm.
Diversity 15 00083 g001

2.3. Statistical Analyses

Descriptive statistics were obtained in Microsoft Excel 2010. To describe the shape variation of the cranium and mandible among different vole samples, MorphoJ [46] was utilized to perform generalized Procrustes analysis, principal component analysis (PCA), canonical variance analysis (CVA), and discriminant function analysis (DFA). Discriminant analysis optimizes discrimination between two groups by one or more axes, the discriminant functions (DFs). These are mathematical functions in the sense that the projection scores of data points on the axes are linear combinations of the variables, as in the PCA. An exploratory method for grouped data, canonical variates analysis generates Mahalanobis distances between at least three different groups based on sample centroids. To calculate the influence of sex, taxa, or geographical location on shape differences in cranial and mandibular data, Procrustes ANOVA analysis was carried out. Both parametric and permutation p values were calculated in order to make the statistical comparisons more reliable. The correlation of independent centroid size data with geographical latitude and longitude data as dependent variables were described as regression coefficient I for the available sample size (n) and were plotted in a scatter-type diagram using the function “covariation/regression” also in MorphoJ. For each analysis, the p value was calculated in a permutation test within 10,000 randomization rounds. Box–whisker plots were constructed to compare differences in the morpho-ecological indices of the mandible among social voles of the “guentheri” group by means of the R Studio (version 3.0.1) software.

3. Results

3.1. Linear Craniometry

Measurements of the linear size of the cranium and mandible are summarized in Table 2. The largest nasal bone size (LM 5–6) was noted in Har R samples, which is statistically significantly different from all of the other samples (p < 0.02–0.001); however, this parameter is similar among representatives of all of the other analyzed samples (p > 0.05). In terms of the linear size of the cranium (LM 1–6), the smallest values were recorded in M. guentheri, and the largest values were recorded in M. hartingi (Table 2). At the same time, pairs of analyzed forms (Ank versus Gue, Phi, Str, or Har R) were significantly different (p < 0.001). The statistical significance of differences in the linear size of the mandible was revealed by pairwise comparisons of all of the samples (p < 0.05–0.001). Among all forms, the highest linear measurement values of the mandible were registered in Har R voles, whereas Phi and Gue showed the lowest values of interlandmark distances.
According to linear craniometry, the studied samples can be subdivided into two clusters. The eastern cluster corresponds to M. guentheri, while the western cluster matches M. hartingi. In the eastern cluster, there are no linear differences between the two sampled subspecies (Gue and Phi), but they differ in all seven measurements from the western cluster (Table 3). The centroid size of the cranium is noticeably smaller in the eastern forms compared to Ank, Str, and Har R (p < 0.001). More noticeable differences were observed in the structure of the jaw of the analyzed voles. Variation in the distance between the coronoid and articular processes was revealed in the upper part (LM 5–8) and in the lower part of the jaw (LM 16–17). In the western forms of voles (Str and Har R), the jaw processes are at greater distance from each other, while in the eastern subspecies (Gue and Phi), they are close together; as a result, the angle between them differs markedly among the forms. There is a clear-cut increase in the length of the jaw from the base of the incisors to the extreme point of the angular process (LM 11–14) from east to west. The jaw body height (LM 5–12) also showed the same trend. The distance LM 5–20 did not show a trend, and the largest distance was noted in Har R and Ank; in other forms, the distance proved to be smaller. The Student’s t-test revealed significant differences between the western and eastern forms for each measurement (Table 4). A special place is occupied by the central form (Ank), which has higher values for all of the parameters of the cranium and jaw as compared to the eastern cluster and lower values as compared to the forms of the western cluster. Despite the revealed differences between the Ank specimens and the western cluster, they seem to be closer to each other than to the eastern cluster, thus indicating their later divergence (Table 4). Differences were also found in seven parameters of the cranium and jaw between the two European forms (p < 0.001), thereby pointing to significant divergence of these forms (Str and Har R).
The analysis of morpho-ecological indices showed the significance of the differences between the eastern and western cluster (p < 0.001). The smallest TI and TM indices were noted in subspecies Phi and Gue (TI 0.169 and TM 0.237; 0.171 and 0.237, respectively) and the highest indices were noted in the forms Str and Har R (TI 0.186 and TM 0.254; 0.204 and 0.277, respectively; Figure 2). Subspecies Ank from Central Anatolia (TI 0.165 and TM 0.229) was not different in any index from the eastern cluster. Meanwhile, it differed significantly from the western cluster (p < 0.001). Marked differences in four indices were found between the two European forms in four indices (p < 0.001) (Figure 2). Differences in the MI index and in the MM index proved to be smaller, but pairwise comparisons detected statistically significant differences. Each form of voles was found to have specific morpho-ecological indices, pointing to significant changes affecting all parts of the jaw.

3.2. Shape

Differences between cranial and mandibular shape variations were strongly statistically significant among the vole forms (p < 0.0001, for both CS and Shape), contrary to vole sex, which did affect shape variation only by the mandible shape (Table 5).
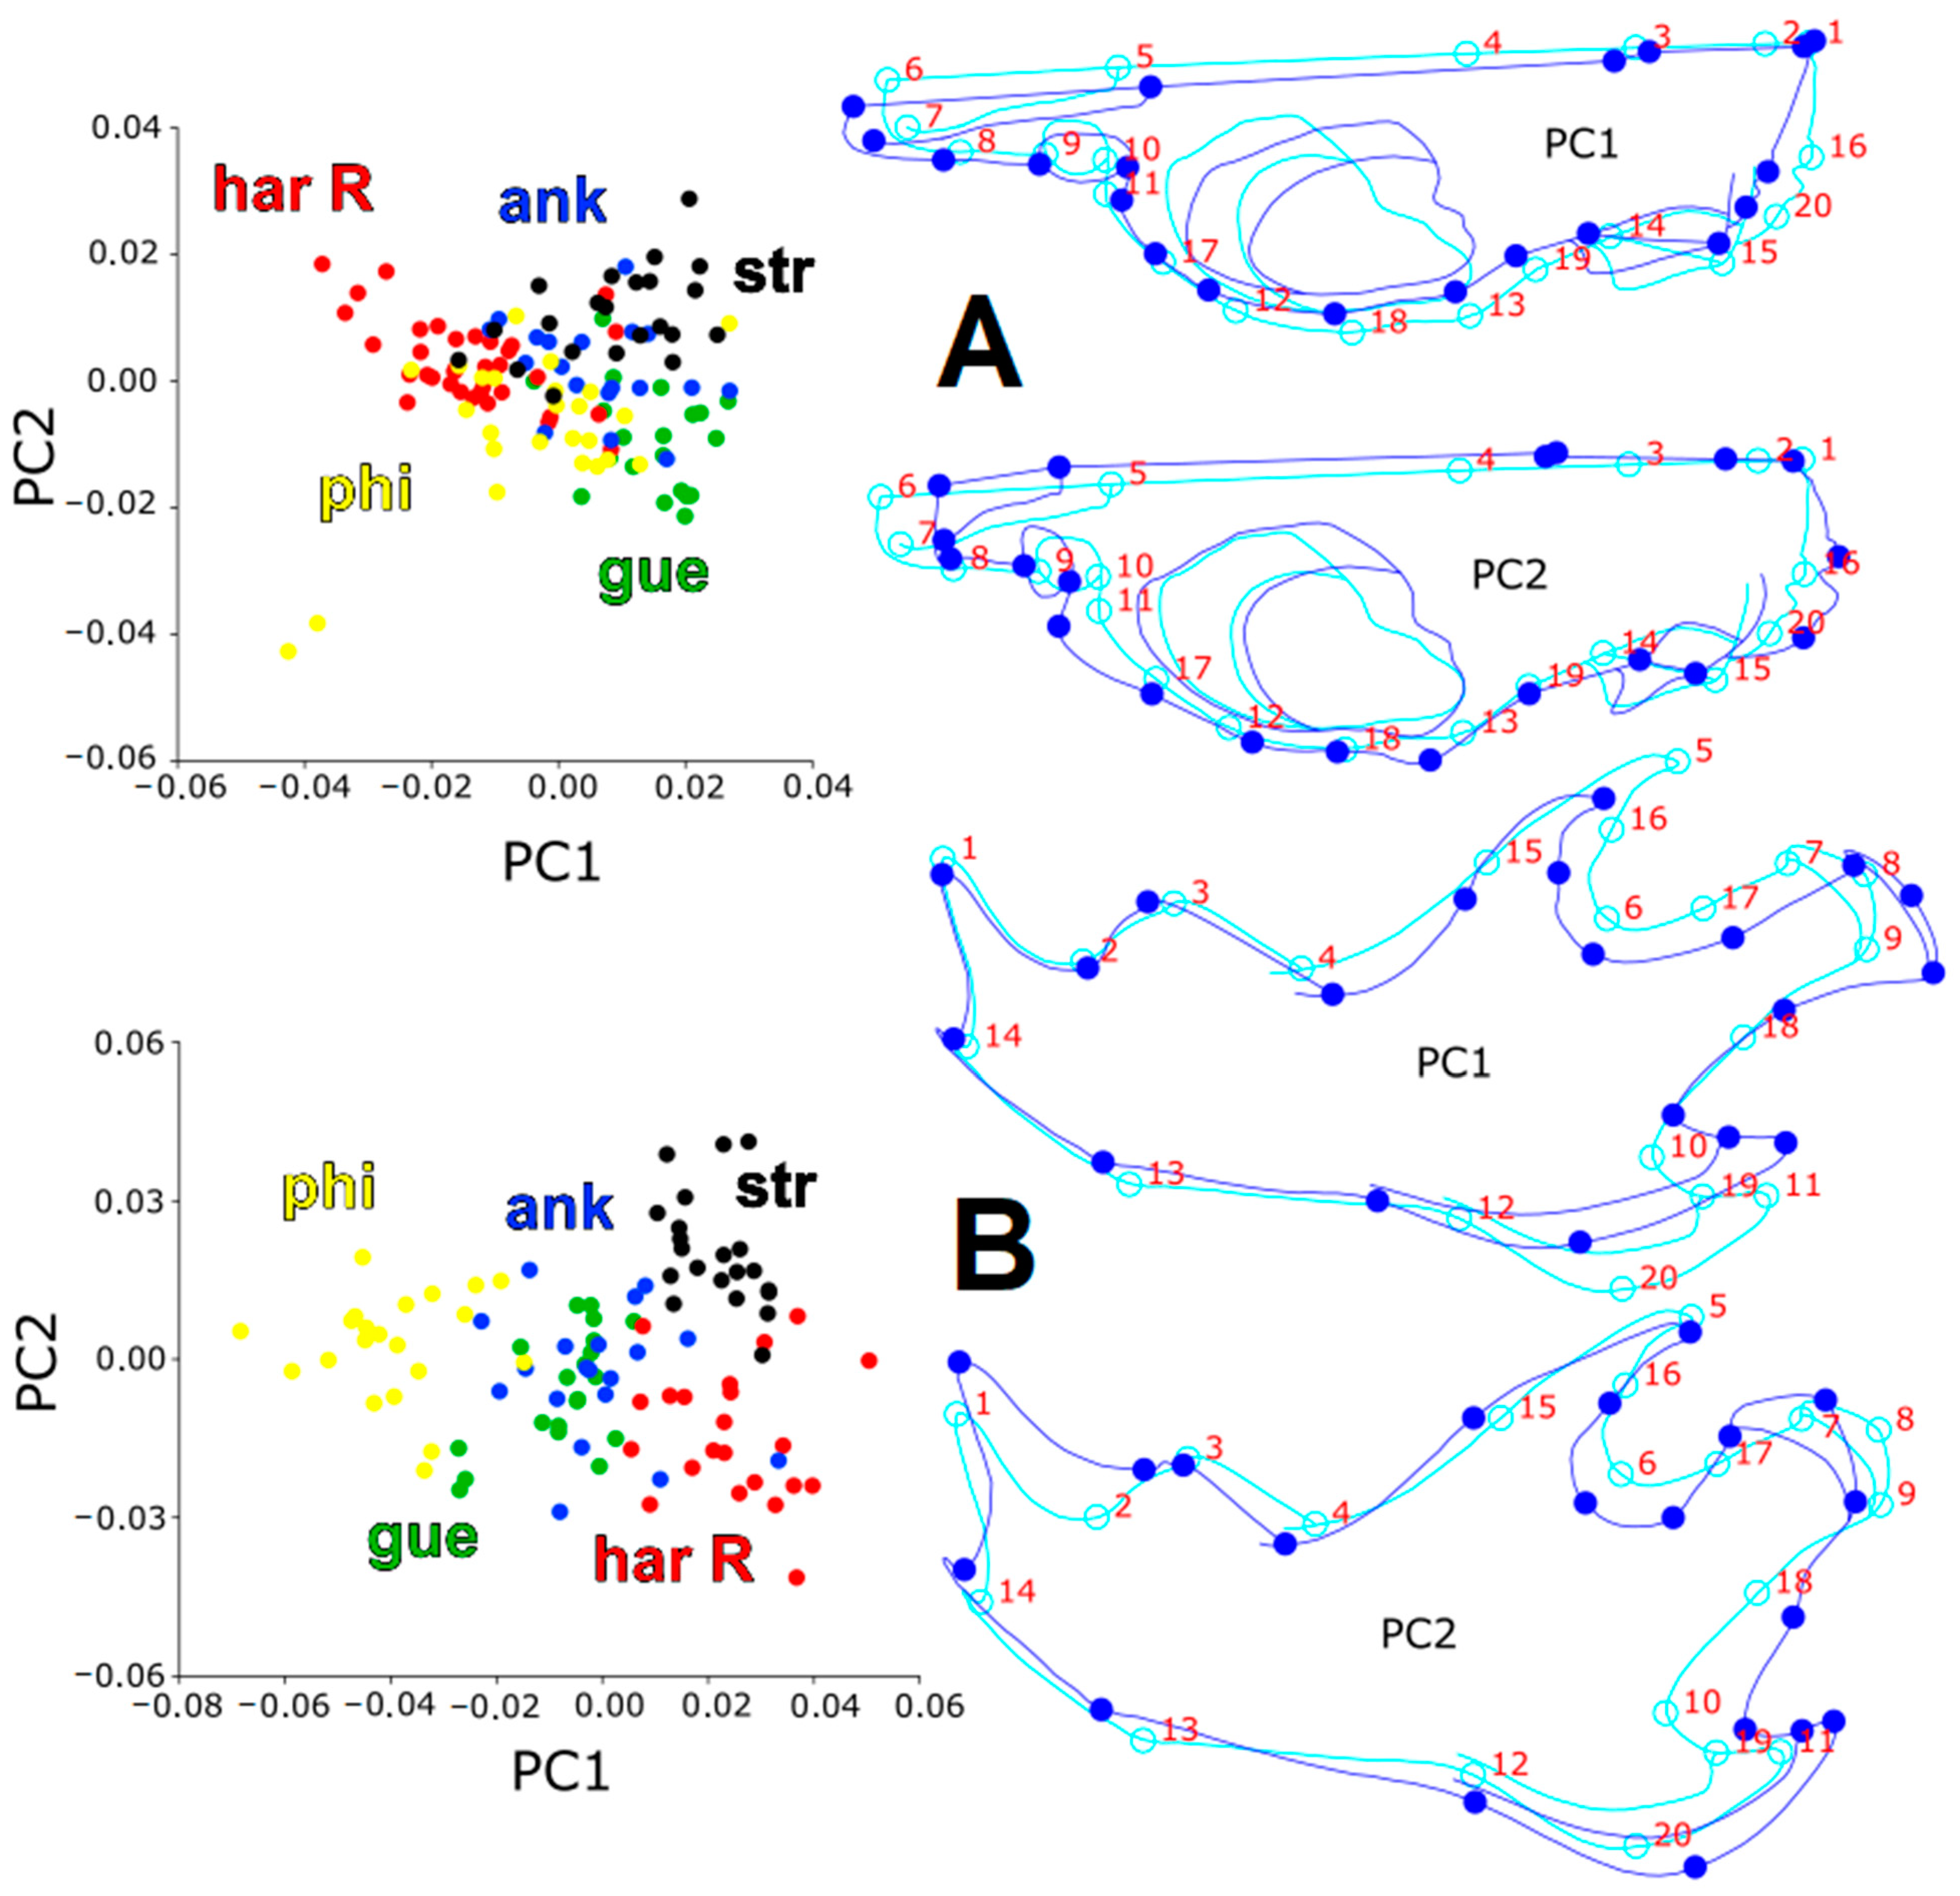
For the crania, the first two principal components (PCs) explained 40.58% of the total shape variance, where the first PC explained 27.3% of variance in the PCA; 46.53% of mandible shape variance was explained by the first two PCs, where PC1 explained 33.51% of total mandible variance. Shape variability data between the vole forms were less separately distributed along the PC1 and PC2 axes for both cranial (Figure 3A) and mandibular (Figure 3B) specimens in the PCA compared to the CVA. Additionally, the positive and negative shape deformations of the cranium and mandible in the PCA were similar to the CVA results, as explained in the text below. In the CVA, there were statistically significant differences in the shape of the skull and especially for the mandible projection, according to permutation p values based on Mahalanobis and on Procrustes distances. The difference was approximately equal among all of the form pairs compared (Table 6).
The results of the DFA also showed the strong effect size (p < 0.001) of the shape differences between most of examined datasets except for Ank vs. Gue in their cranial deformation (parametric p = 0.2002) and Ank vs. Gue (parametric p = 0.6723) and Ank vs. Phi (parametric p = 0.0774; permutation p = 0.0770) in mandible variation (Table 7). The DFA detected no statistically significant difference in shape between males and females for both cranial and mandibular projections (high permutation p values of the Procrustes distance; p > 0.05; Table 8).
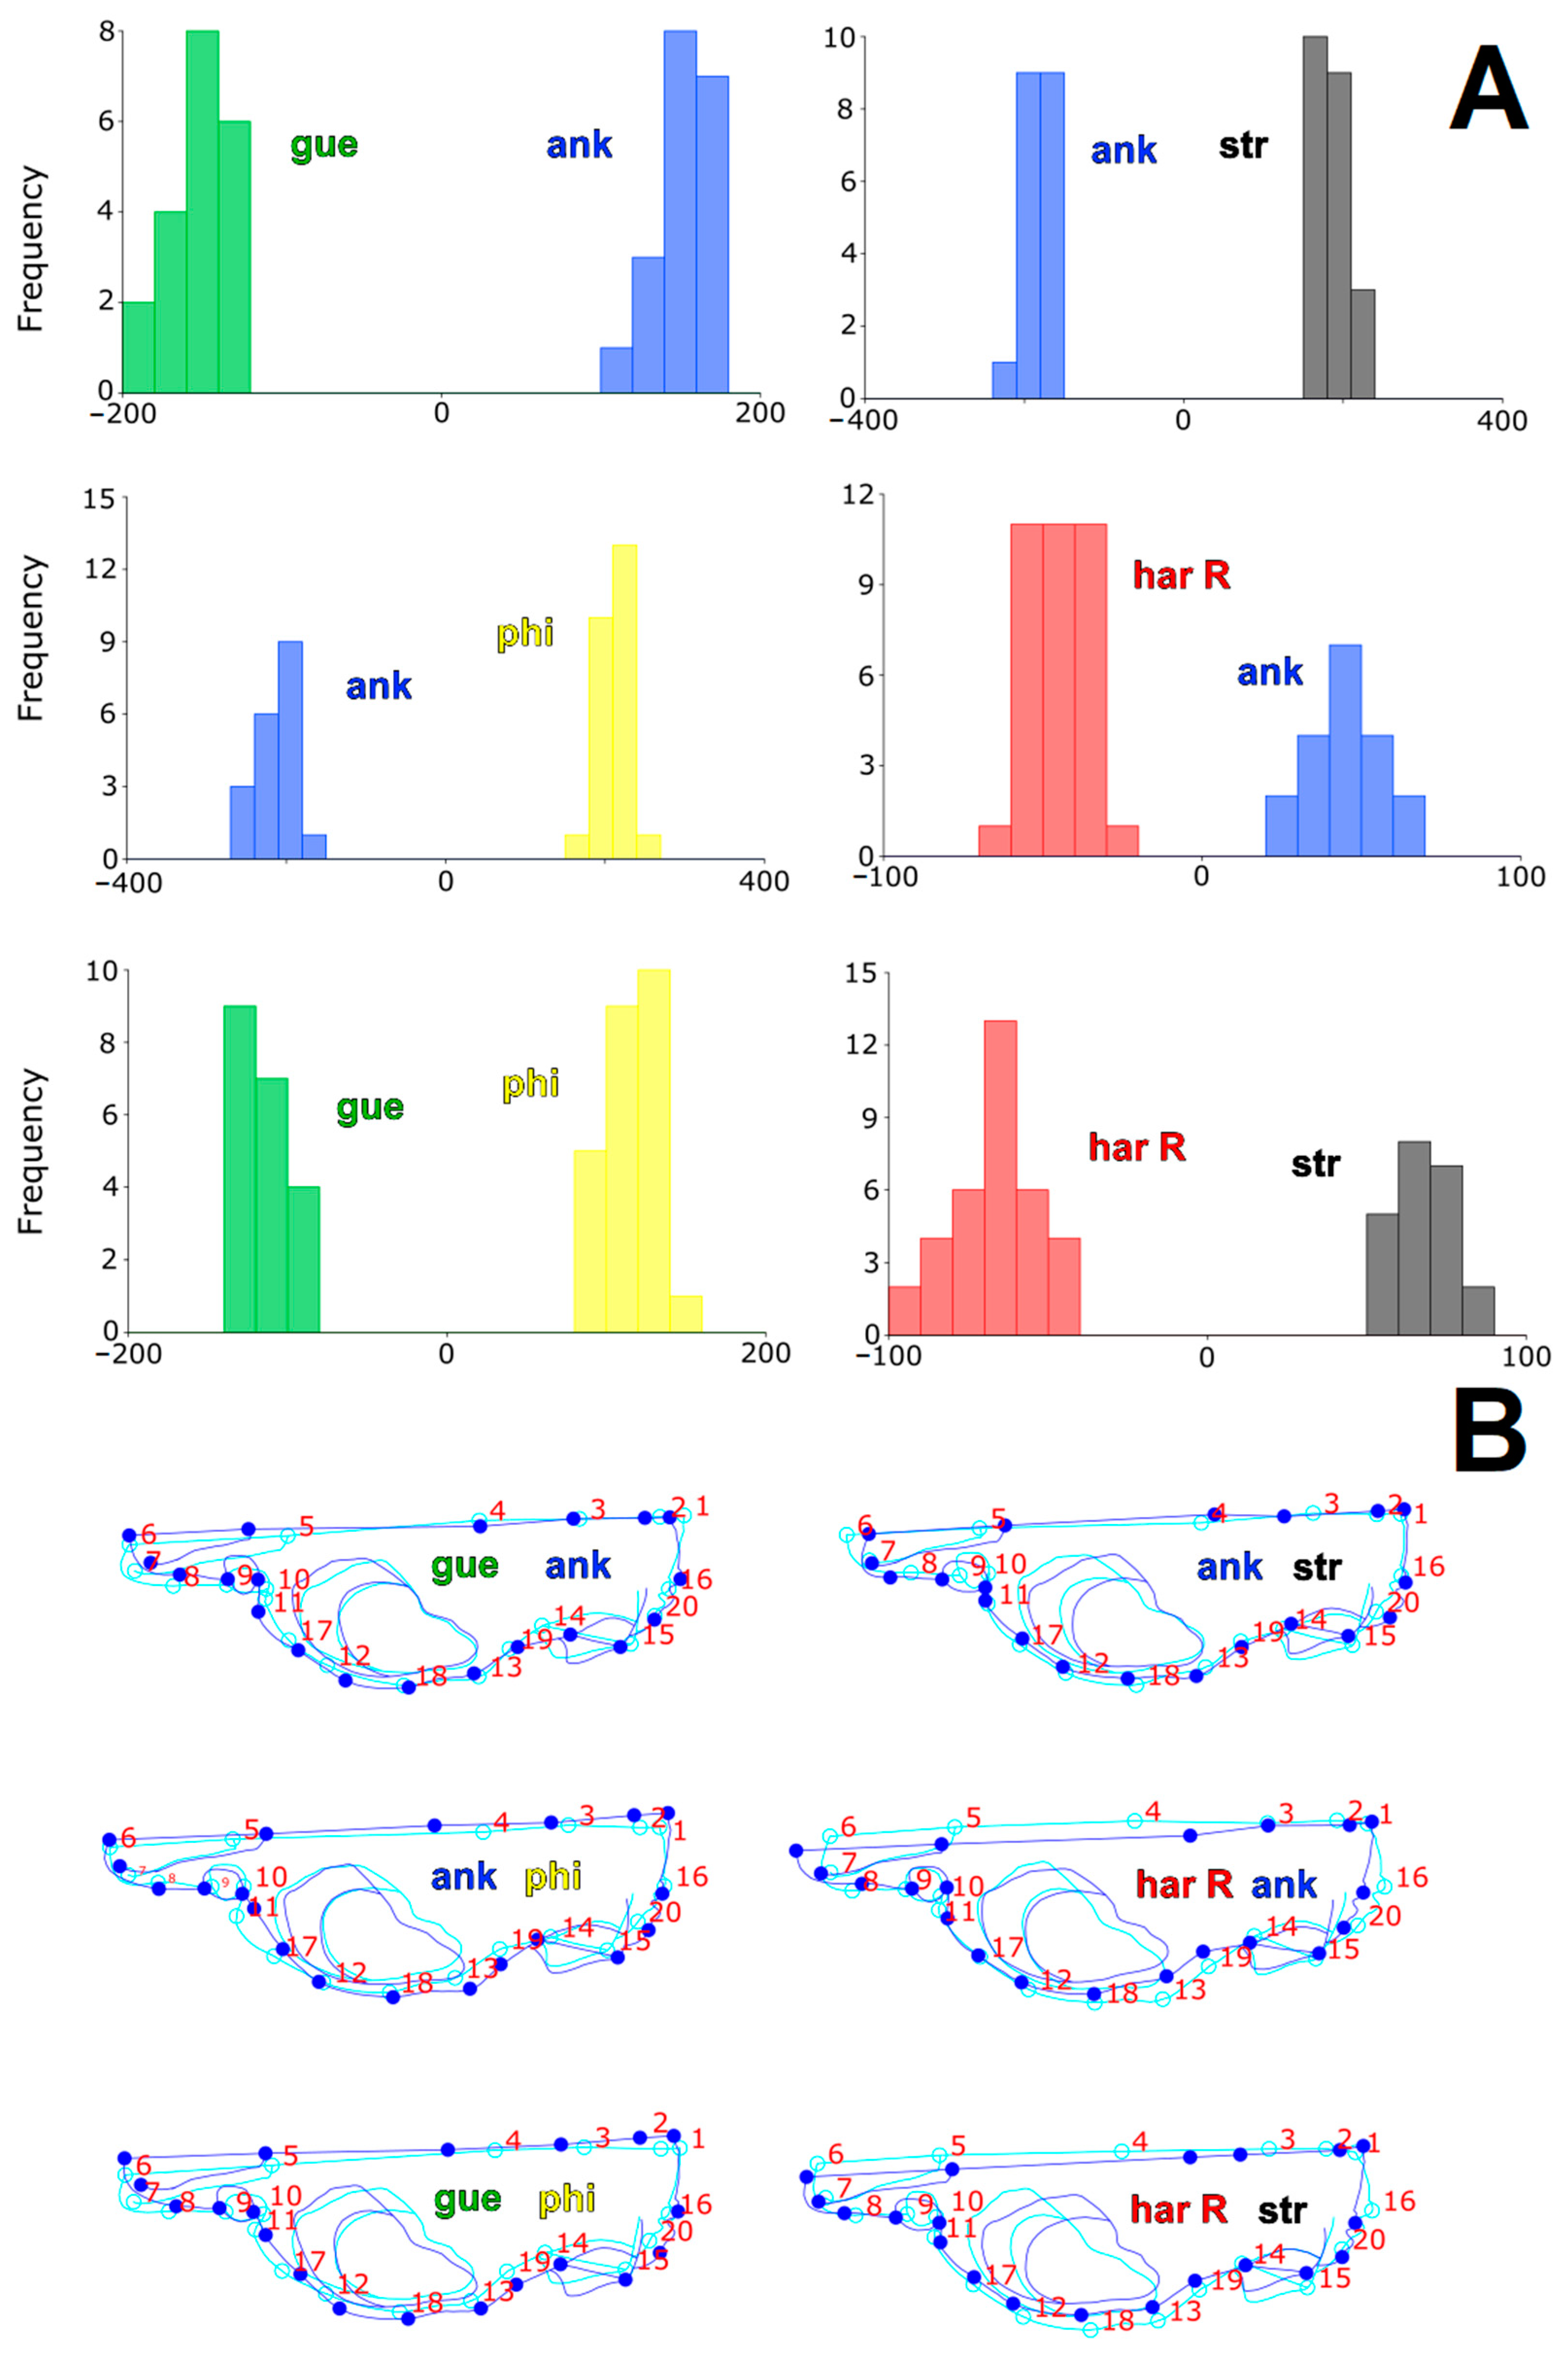
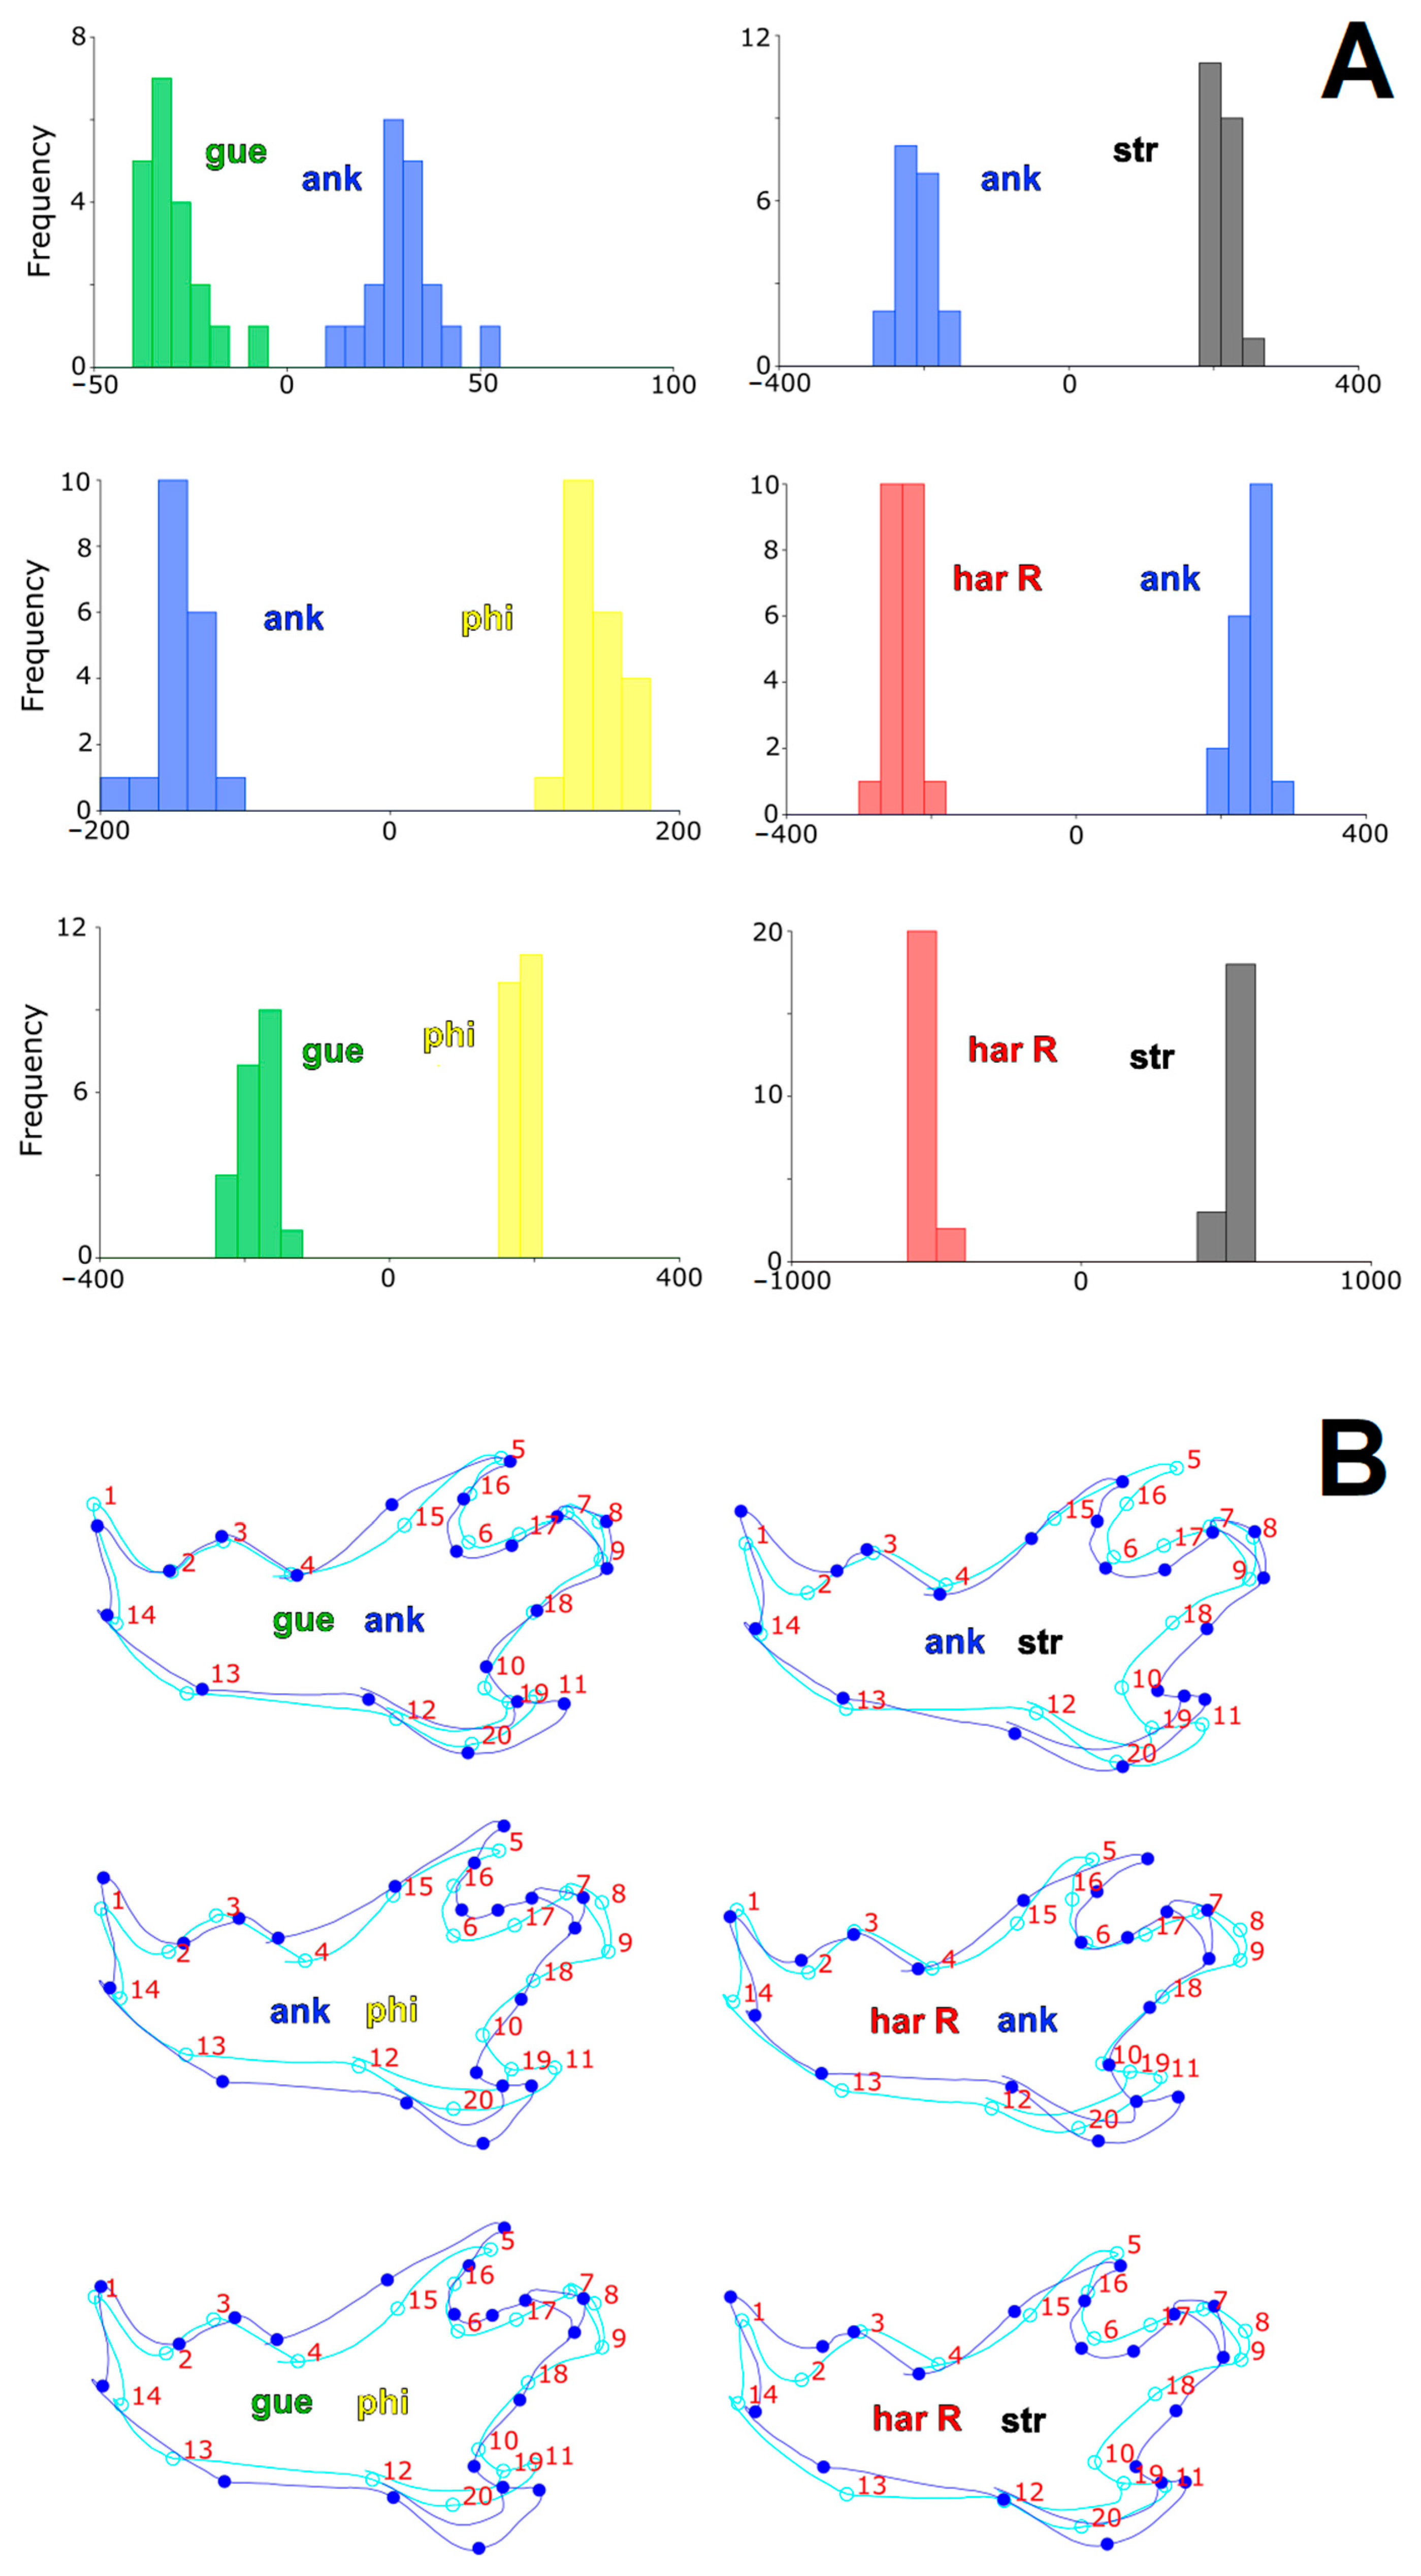
Shape peculiarities in vole forms were well separated along the first axis of the scatter plot in the CVA (Figure 4). In the cranial dataset, CV1 explained 52.68% of the total variance, and in the mandibular dataset, CV1 explained 55.6% of the total variance in shape in all of the examined forms. The first two CV axes together explained 79.1% of the cranium shape variance and 80.3% of the mandible shape variance. The most significant shape changes of the positive and negative directional deformation according to cranium CV1 were the slenderer and more elongated rostrum of M. h. philistinus and M. g. guentheri along CV1, whereas M. hartingi voles had shorter and blunter premaxillae and nasal bones. According to CV2, M. h. philistinus, M. h. strandzensis, and M. hartingi from the Rhodopes had a broader cranium dorsally with the coronoid process developed further from the medial line and the parietal and occipital bones developed broader as compared to Ank and Gue showing the oppositely directed deformation of the cranial shape (see Figure 4A). As for the mandible specimens, M. hartingi voles (Har and Str) are characterized by a narrower and slenderer mandibular condyle as compared to the other voles, judging by CV1. Furthermore, Phi, Ank, and Gue showed thicker and wider mandibles making incisura mandibulare narrower and making the coronoid process (LM 5) stand proportionally closer to the condyle (LM 7) (Figure 4B). Positive and negative directional shape changes between specific forms in the DFA were more or less similar to the patterns seen in the CVA (Figure 5 and Figure 6). Additionally, according to the DFA graphical visualization, for all the parameters, the values of shape deformation did not overlap (Figure 6), thereby pointing to form-specific and significantly different shape deformations. The mandible data also had lower interspecific shape variation as compared to the cranial data (Figure 5).
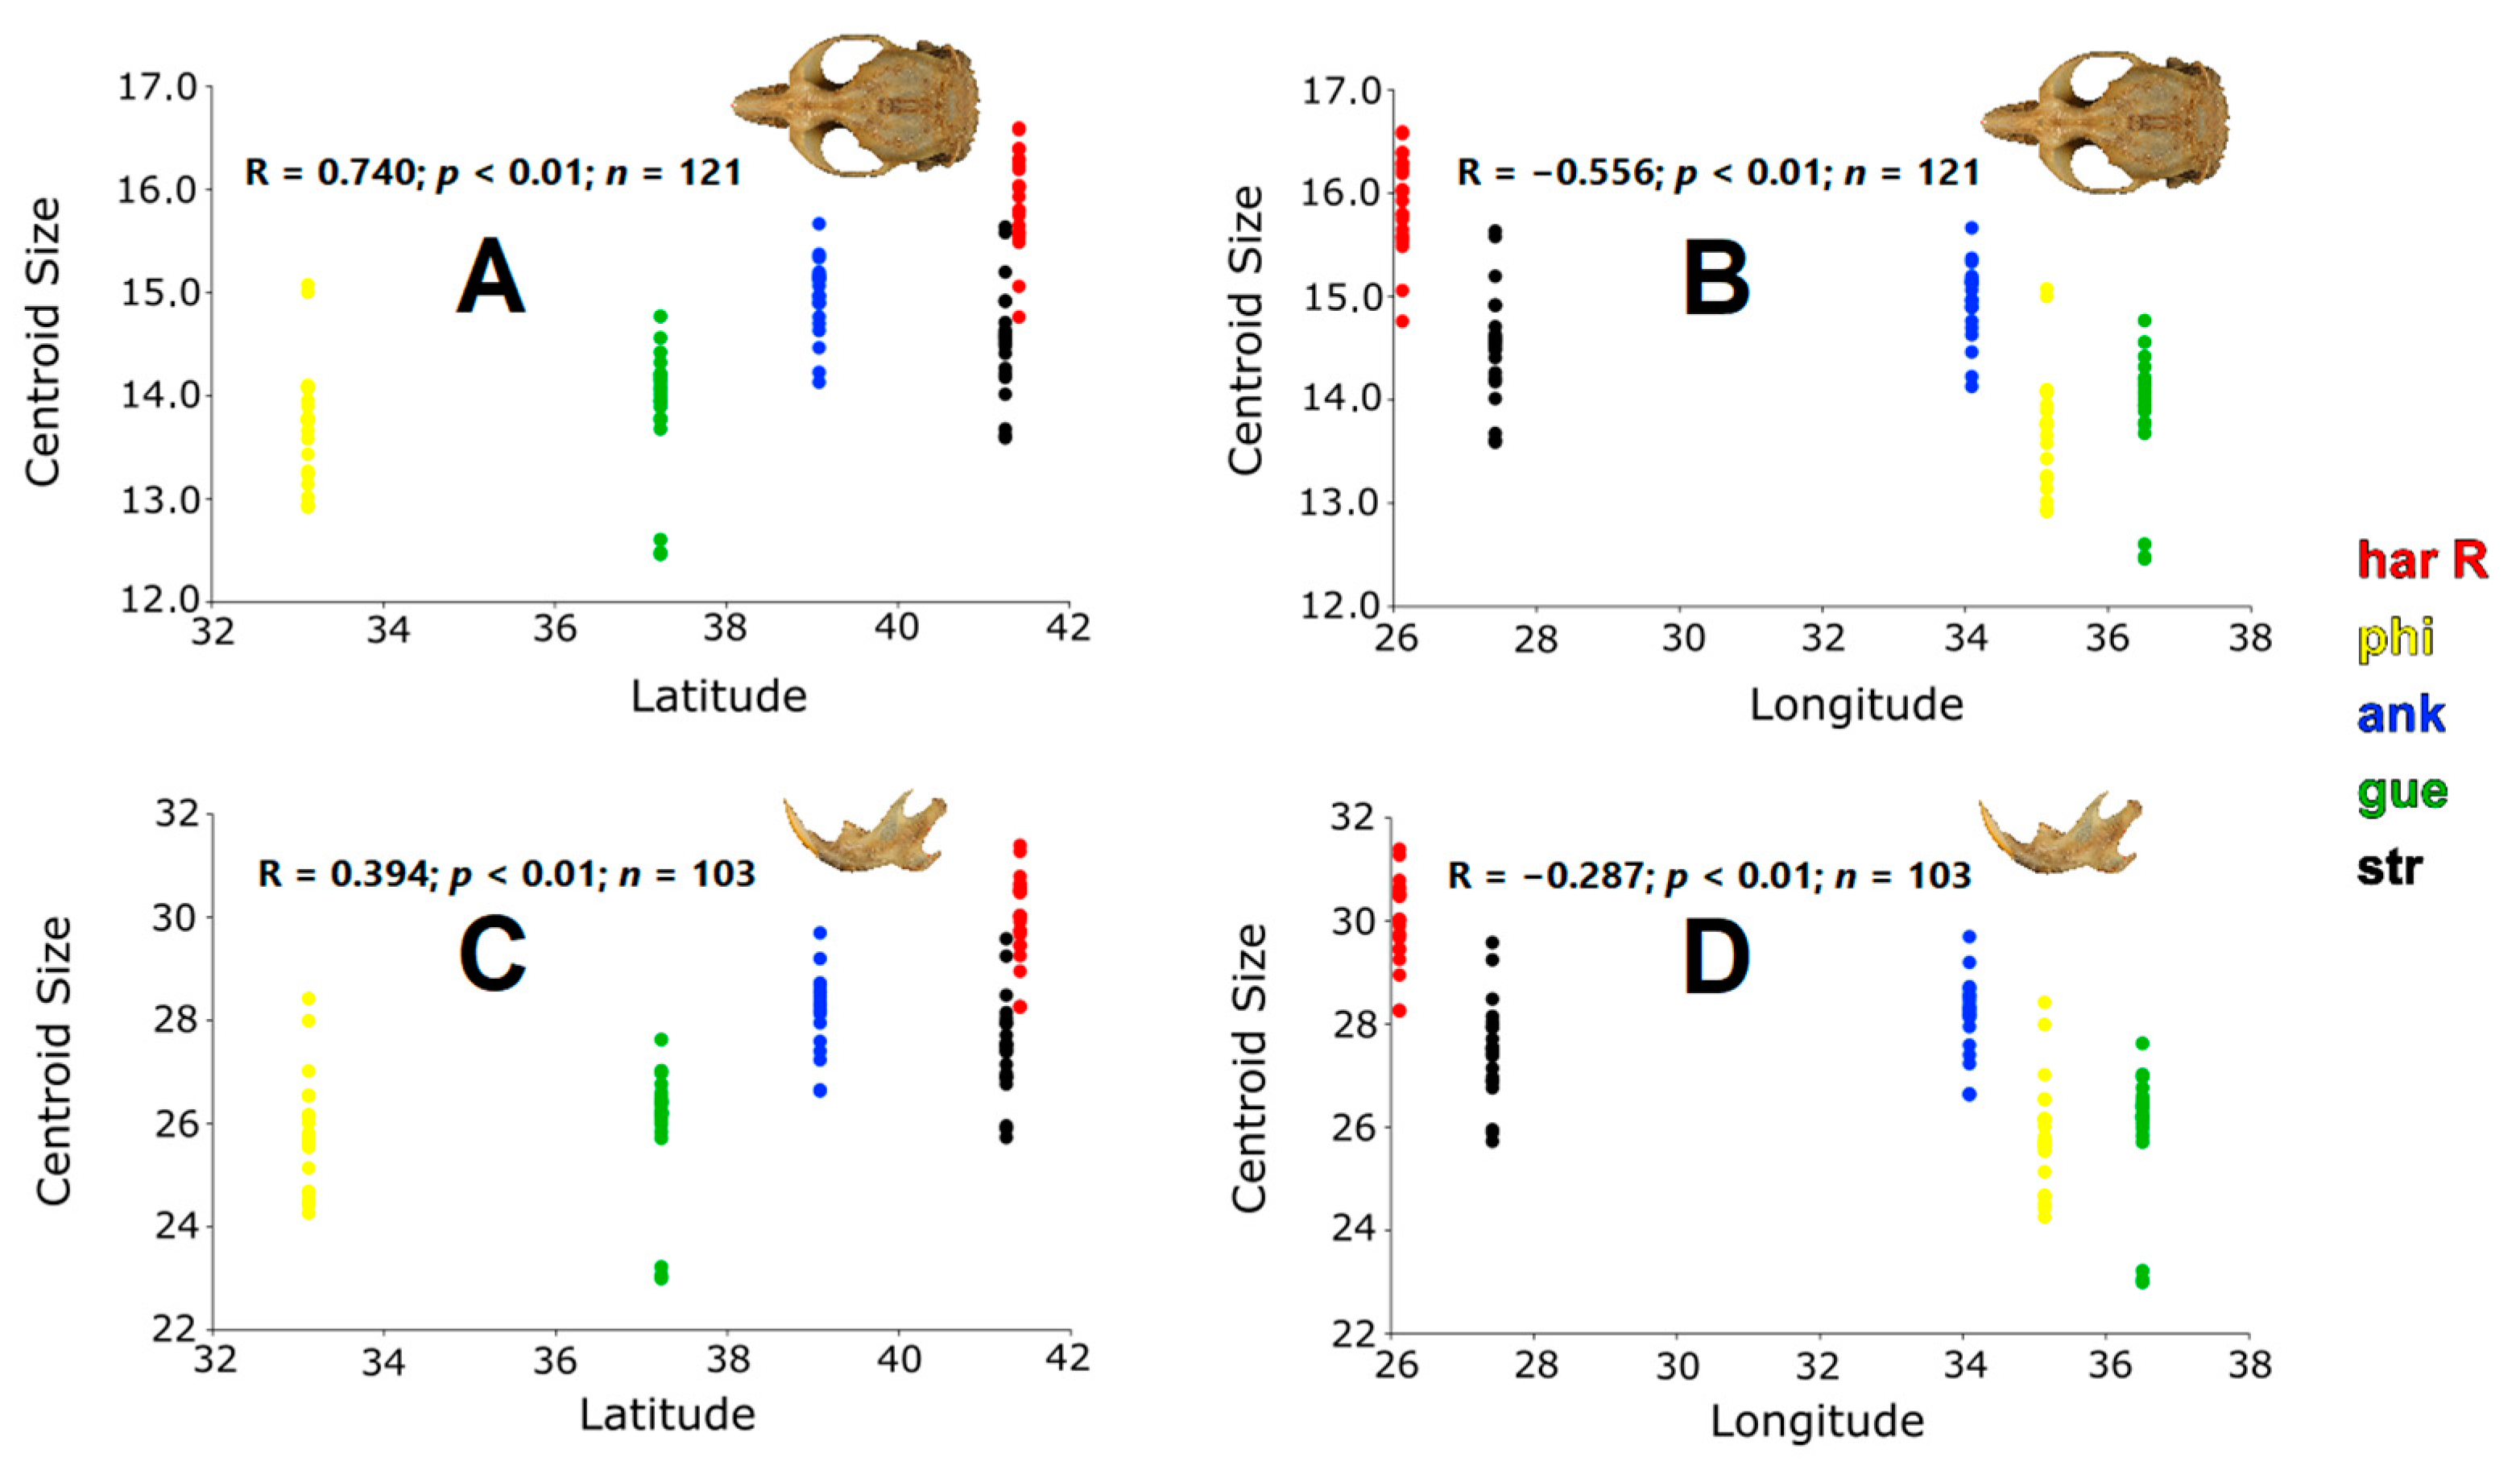
The centroid size of the cranium and mandible changed with geographical coordinates (latitude and longitude; Figure 7). The deformation of the dorsal projection of the cranium and of the jaw proceeds both from south to north and from east to west. The obtained data yielded two clusters based on the geographical and taxonomic influences. As presented in Figure 2, each cluster is geographically contiguous and corresponds to a group of forms. Forms Har R and Str are located in the west and toward the north. Gue and Phi are situated in the east and toward the south and M. h. ankaraensis is between them and is located closer in latitude to the western cluster, whereas in longitude, it is nearer the eastern cluster. For the lower jaw, in the direction to south and east, we noted a lower ramus (LM 6–12), a shorter mandible (LM 11–14), a narrower and elongated coronoid process (LM 5), an elongated articular process (LM 6–8), and a narrowed angular process (LM 10–12), as well as a decrease in the distance between the coronoid and articular processes (LM 5–7 and 8). Conversely, the opposite shape features were most obvious in the western forms.

4. Discussion

Social voles of the “guentheri” group occupy a large geographic range, which is divided into many isolated populations, and this arrangement is promoted by the complex structure of the landscape, by climate aridity, and by specific features of the life history of voles. Apparently, Asia Minor can be considered the center of origin of this taxon [47], where in its western and central part, M. h. lydius, M. h. ankaraensis, and M. dogramacii currently reside [3,4], while M. qazvinensis resides in the east [7,48]. In our previous article, we showed that subspecies of M. hartingi and the form of M. hartingi from the Rhodope Mountains differ little in standard morphometric parameters [8]; therefore, we decided to apply the methods of GM.
The GM method allows the centroid size to be used (thereby more accurately describing the size) and helps to visualize the detected shape patterns [41]. GM studies involve different projections of the cranium and of the lower jaw to compare species and subspecies, although their informativeness may differ. The lower jaw is considered the most informative [44,49], although cranial shape is also widely used [38,42,50,51]. The choice of the lower jaw for the current study is of paramount importance because this bone is directly related to processes of obtaining and processing of food, which characterize the ecological features of a species [40,44,52,53].
The subspecies of M. guentheri turned out to be the smallest in terms of the centroid length of the dorsal cranium, whereas voles of nominative forms of M. hartingi as well as M. h. ankaraensis from central Anatolia are larger. In this context, the length of the cranium of M. h. ankaraensis is greater than that of the territorially nearest subspecies M. h. strandzensis but smaller than that of M. hartingi from the Rhodopes. Only M. hartingi from the Rhodopes stands out significantly in the length of the nasal bone; the other forms are similar in this parameter. It should be noted that M. g. guentheri was found to have the biggest dorsal cranium as compared to M. dogramacii, M. anatolicus, and M. rossiaemeridionalis (=M. levis) [50]. The DFA of the dorsal projection of the cranium showed that in M. guentheri, the rostral part of the cranium is narrowed. The line in the cranium within the area between the maxilla and premaxilla is deformed inward (LM 11), especially in M. g. philistinus. In contrast, in M. hartingi, the rostrum is elongated, and the cranial line between the maxilla and premaxilla is flattened. The cranium of both forms of M. hartingi is more elongated overall than of the other forms. Significant deformations were noted in the occipital region of the cranium, especially in M. h. ankaraensis compared to the European forms. Overall, our GM analysis revealed that M. hartingi from the Rhodopes and M. h. strandzensis have similar cranial deformations, which distinguish them from both M. guentheri and M. h. ankaraensis. According to craniological results of DFA by other authors, social voles M. hartingi from Bulgaria and Turkish Thrace have markedly diverged from the eastern forms of M. guentheri and from M. h. ankaraensis [26], which is in agreement with our results.
More noticeable differences found in the shape and centroid size of the mandible were detected in the voles under study. The mandible differs across all of its modules (the ramus region and coronoid, articular, and angular processes). In the subspecies of M. guentheri, the distance between the coronoid and articular processes is the narrowest; furthermore, in M. g. philistinus, the coronoid process is elongated, while the angular process is smaller and more graceful. At the same time, the length of the jaw (from the base of incisors to the extreme point of the angular process) and the height of the body (ramus) of the jaw are smaller. In the subspecies of M. hartingi, on the contrary, the distance between the coronal and articular processes is the widest, and the angular process is sizeable. The length and body height of the jaw are markedly greater (Table 2, Table 5, and Table 6). In the vole M. h. ankaraensis, the distance between the coronoid and articular processes (just as the shape of the angular process) is intermediate between these parameters of M. guentheri and M. hartingi. The analysis of linear size revealed that M. h. ankaraensis is statistically significantly different from both the eastern cluster and western cluster (Table 4) and occupies an intermediate position between them. The DFA also indicated similar lower jaw deformations.
Our comparison of the average morpho-ecological indices of the lower jaw among the five sampled groups of voles revealed a statistically significant hiatus between the European and Asian groups in terms of the temporal-incisive and temporal-molar indices (Figure 1). The smallest and identical temporal-incisive and temporal-molar indices were noted in the subspecies of M. guentheri; M. h. ankaraensis is close in this regard. The highest indices were registered in M. hartingi, and these indices are noticeably higher in the voles from the Rhodopes than in the voles from Strandzha. Differences in the MI index were detected too, both between the subspecies of M. guentheri (the MI index is greater in M. g. philistinus than in M. g. guentheri) and between the forms of M. hartingi (in voles from the Rhodopes, the MI index is greater than that in M. h. strandzensis). Nonetheless, individuals of M. h. ankaraensis and M. guentheri do not differ in the MM index. A higher MM index is characteristic of M. g. philistinus, M. h. ankaraensis, and M. hartingi, and it is smaller in M. g. guentheri and M. h. strandzensis (Figure 2).
Due to flexibility in nutrition, voles widely use the forage opportunities of steppes and semideserts. Because of the widespread presence of ephemerides and ephemerals, voles find adequate nutrition all the year around. Although seeds constitute a part of their diet, voles cannot live well without green plant mass because all parts of a plant’s maintain water and energy balances [54,55,56,57]. The role of the underground parts of plants increases when the steppe and semidesert vegetation dries up. Foods used by voles vary in hardness and mineral composition. In this context, changes in temperature and humidity are of great importance [49]. In an experiment, it was demonstrated that the type of food (solid or jelly-like) significantly affects the biomechanical parameters of the jaw [40]; furthermore, in mice feeding on solid food, all indices increase; they decrease when mice eat wet food. In addition, a diet of softer foods causes weakening of masticatory muscles and as a consequence, a decline in bone mineral density [58]. The differences in the morpho-ecological indices revealed by us among voles of the “guentheri” group may reflect dissimilarities in the biomechanical features of the jaw. In Harting’s vole from the Rhodopes, there is a transformation of those modules of the jaw that determines successful cracking (TI and TM indices) and chewing of harder and coarser foods (MI and MM indices). In contrast, in M. h. strandzensis, all of the indices are lower (Figure 2) in comparison with not only voles from the Rhodopes but also the subspecies of M. guentheri. Additional focused studies are needed to determine the causes of changes in the size and shape of the lower jaw and in the respective indices. In a comparison of the morpho-ecological indices within the species Sylvaemus uralensis (small forest mouse), differences in the MI index and MM index were found to be the greatest [44]. Those authors propose that in the Asian race, during the processing of food, horizontal forces predominate, which lead to the grinding of food, whereas in the Eastern European race, on the contrary, vertical forces are typical, implementing the crushing and cracking of food objects.
A comparison of the lower jaw between the continental and insular populations of the house mouse has shown that during 200 years of isolation on the island, mice underwent profound changes in their jaw structure [52], which was explained by those authors by a transition to a different type of nutrition, where invertebrates play an important role. On the other hand, only minor and unstable changes in the jaw have been noted in recent decades [52]. Despite the relatively short period of isolation of the island population, jaw restructuring has already become hereditary, with is consistent with our data on voles of the “guentheri” group, whose history of formation comprises many millennia. The revealed differences suggest that the differentiation of the lower jaw is a consequence of an adaptation in feeding behavior to specific habitat conditions in the course of evolution. Nevertheless, non-hereditary variability can be considerable in the early stages of population formation [52]. This theory is gaining increasing recognition [59].
An attractive hypothesis postulates the influence of soil density on the variability of jaw shape. Social voles are typical diggers, and their burrowing ability is almost two-fold greater than that of common voles [60]. With the help of lower incisors, voles gnaw out pieces of a substrate [54]. Loading on the jaw in this case is substantial and can cause its deformation. Observations in the Rhodopes and in a laboratory have revealed that voles devote a major proportion of their daily activity to burrowing; however, this hypothesis has not been confirmed for the dwarf fat-tailed jerboa Pygeretmus pumilio [49].
Our GM analyses showed that the five forms can be differentiated by the shapes of the cranium and mandible. Only in the PCA was there a partial overlap in the cranial and mandibular parameters in terms of shape (Figure 3), whereas in the CVA (Figure 4) and DFA (Figure 5 and Figure 6), each examined form was clearly discriminated. The GM analyses, in most statistical tests, did not reveal sexual dimorphism in the shape of the crania and mandibles in the “guentheri” group (Table 5 and Table 8), which is true for many species [42,50,51]. There are also no gender differences in the shape of the brain [33]; this observation can be explained by the finding that the structures in question are not subject to sexual selection [61].
Here, the geographic factor was found to significantly affect the phenotypic variation in the shapes of the cranium and jaw in voles of the “guentheri” group; furthermore, the changes correlate with geographic coordinates. Figure 7 shows that in the latitudinal direction from north to south, there is a decrease in the centroid dimensions of the cranium and especially of the jaw. The influence of longitude also indicates that centroid dimensions of the cranium and jaw diminish in the east and enlarge in the west if we take into account that the center of the “guentheri” group’s formation is located in Asia Minor. In the east of its range, M. guentheri was found to have a more slender and more elongated rostrum, whereas M. hartingi voles have shorter and blunter premaxillae and nasal bones. In M. h. philistinus, M. g. guentheri, and M. h. ankaraensis, the lower jaw is thicker and wider; the coronoid process stands proportionately closer to the articular process. In the west, M. hartingi is characterized by a narrower and slenderer mandibular condyle. The effects of latitude and longitude have been documented for many species with a large geographic range [42,44,49].
We can theorize that the diversification of voles of the “guentheri” group results from allopatric evolution. According to molecular analysis, division into the two groups, “socialis” and “guentheri” took place approximately 1 Mya [10,62]. The formation of M. guentheri took place in the eastern part of the range beyond the Anatolian Diagonal, as a consequence of which several isolated forms of the subspecies level and of the species level arose during the period 0.8–0.2 Mya [10]. The evolution of the western lineage proceeded in Europe at approximately the same time under conditions of fragmentation of the range and of biotopes suitable for settlement after its isolation from Asia Minor [27,63,64]. Our craniometry data support a special position of voles in the central part of Anatolia. It may be worth revisiting the hypothesis of isolation of the independent endemic species M. lydius in this region [16,26].
Our findings about the shape and linear dimensions of the cranium and lower jaw and about morpho-ecological indices point to a special position of Harting’s vole in the Rhodopes and complement previously obtained information [8]. Our new GM data revealed the complex intra- and interspecific structure of variability in cranium and mandible shapes in the studied voles of the “guentheri” group, and this structure should be reflected in taxonomic categories. To resolve the issue of the taxonomic status of this group of voles, it is necessary to conduct comparative craniometric research on European Harting’s voles from other isolated populations (M. h. hartingi from Greece and M. h. martinoi from Macedonia) and M. g. shevketi from southeastern Turkey and to include two more species of this group—namely M. dogramacii and M. qazvinensis—in the GM analysis.

5. Conclusions

Asia Minor is considered to be the center of origin of social voles of the “guentheri” group. Because of the emergence of impenetrable barriers for voles in the form of the Taurus Mountain range (Anatolian Diagonal) in the east and the Dardanelles and Bosporus in the west, the subsequent evolution of the eastern and western forms of these voles proceeded mostly independently. Analysis of linear sizes and shapes of the cranium and mandible revealed clear subdivision of the studied forms into an eastern cluster and western cluster, matching two species: M. guentheri and M. hartingi. At the same time, differences were detected both between two subspecies of M. guentheri (M. g. guentheri and M. h. philistinus) and between the subspecies M. h. strandzensis and Rhodopean M. hartingi, whose subspecies status has not yet been determined. The subspecies M. h. ankaraensis can be clearly distinguished and differs significantly from European M. hartingi and to a lesser extent from M. guentheri in many parameters of GM. Our analysis of the morpho-ecological indices of the jaw showed significant differences among all the forms under study, possibly indicating the adaptation of each to a specific habitat and features of feeding. The described indices of the lower jaw can be used as additional diagnostic criteria.

Supplementary Materials

The following supporting information can be downloaded at: https://www.mdpi.com/article/10.3390/d15010083/s1, Table S1: The material of forms—species and subspecies of Microtus voles—that is used in the article (ZIN—Collection of the Zoological Institute, Russian Academy of Sciences, DEZ—Collection of the department of Zoology, University of Latvia).

Author Contributions

Conceptualization, T.Z. and F.G.; methodology, T.Z. and U.K; formal analysis, U.K. and L.B.; writing—original draft preparation, T.Z., F.G., and U.K.; writing—review and editing, T.Z. and F.G.; collecting material on voles in the field and vivarium, T.Z. and F.G. All authors have read and agreed to the published version of the manuscript.

Funding

This work was supported by grants from the Russian Science Foundation, No. RSF 22-24-00782 (to F.G.).

Institutional Review Board Statement

The animal study protocol was approved by the Ethics Committee of the Zoological Institute, the Russian Academy of Sciences (protocol No. 2-7/28-11-2022 of 28 November 2022). Applicable international, national, and institutional regulations for keeping and working with animals were followed. All the experiments conducted during this research were performed in accordance with European directive No. 2010/63/EU and with Latvian laws and regulations [65].

Data Availability Statement

The data presented in this study are available on request from the first author.

Acknowledgments

We thank the anonymous reviewers for their helpful and constructive comments on the manuscript. The English used in this paper was corrected and certified by shevchuk-editing.com.

Conflicts of Interest

The authors declare no conflict of interest.

Appendix A

Anatomical (type I) and mathematical (type III) landmarks used to assess GM of the cranium and mandible in voles of the “guentheri” group (mathematical landmarks or so-called semi-landmarks are indicated with an asterisk).
Description of landmark locations on the cranium: (1) the medial point of the caudal end of the curvature of the occipital; (2) the point at the intersection of interparietal and occipital bones at the midline; (3) the point at the intersection of interparietal and parietal bones; (4) the point at the intersection of the parietal bone and frontal bone; (5) the point at the intersection of the parietal bone and nasal bone; (6) the point of the terminal tip of the internasale suture; (7) the point of the anterior tip at the intersection of premaxillae and nasal bones; (8) the point of maximum width at the external margin on premaxilla; (9) the point at the rostral end of the anterior notch; (10) the point at the caudal end of the anterior notch; (11) the point at the rostral end of the zygomatic plate; (12) the point at the projection of rostral internal maximum curvature of the articular process; (13) the point at the projection of caudal internal maximum curvature of the articular process; (14) the point at the intersection of the articular process and squamosal body; (15) the transition point between parietal and occipital bones; (16) the point at the caudolateral end of the occipital bone; (17) the point at half of the distance between landmarks 11 and 12*; (18) the point at half of the distance between landmarks 12 and 13*; (19) the point at half of the distance between landmarks 13 and 14*; (20) the point at half of the distance between landmarks 15 and 16*.
Description of landmark locations on the mandible: (1) the point at the anterior-dorsal border of the incisive alveolus; (2) the point at the most concave point of the diastema; (3) the basal point of the anterior alveolus of the lower premolar; (4) the point at the intersection of the anterior alveolus of the lower premolar and the base of the coronoid process; (5) the point at the tip of the coronoid process; (6) the most concave point of the incisura mandibulare; (7) the point at the minimum width on the anterior edge of the articular surface of the condyle; (8) the point of the terminal tip of the mandibular condyle; (9) the point at the posterior edge of the articular surface of the condyle; (10) the most anterior point on the curve of the posterior edge of the mandible; (11) the point at the tip of the mandibular angle; (12) the most dorsal point on the ventral border of the ramus; (13) the most inferior point on the border of ramus inferior to incisor alveolar; (14) the point at the antero-ventral border of the incisive alveolus; (15) the point at half of the distance between landmarks 4 and 5*; (16) the point at half of the distance between landmarks 5 and 6*; (17) the point at half of the distance between landmarks 6 and 7*; (18) the point at half of the distance between landmarks 9 and 10*; (19) the point at half of the distance between landmarks 10 and 11*; (20) the point at half of the distance between landmarks 11 and 12*.

References

  1. Argiropulo, A.J. Ueber zwei neue paläarktische Wühlmäuse. Z. Säugetierkd. 1933, 8, 180–183. [Google Scholar]
  2. Ellerman, J.R. The Families and Genera of Living Rodents; British Museum: London, UK, 1941; Volume 2, 690p. [Google Scholar]
  3. Kryštufek, B.; Bužan, E.V.; Vohralík, V.; Zareie, R.; Özkan, B. Mitochondrial cytochrome b sequence yields new insight into the speciation of social voles in south-west Asia. Biol. J. Linn. Soc. 2009, 98, 121–128. [Google Scholar] [CrossRef]
  4. Kryštufek, B.; Zorenko, T.; Buzan, E. New insights into taxonomy and phylogeny of social voles inferred from mitochondrial cytochrome b sequences. Mamm. Biol. 2012, 77, 178–182. [Google Scholar] [CrossRef]
  5. Golenishchev, F.N.; Abramson, N.I. New data on phylogeography of voles’ subgenus Sumeriomys (Arvicolinae; Rodentia). In Proceedings of the International Conference “Mammals of Russia and Adjacent Territories” IX Congress of Theriological Society RAS, Moscow, Russia, 1–4 February 2011; KMK Scientific Press: Moscow, Russia, 2011; p. 117. (In Russian). [Google Scholar]
  6. Golenishchev, F.N.; Sablina, O.V.; Borodin, P.M.; Gerasimov, S. Taxonomy of voles of the subgenus Sumeriomys Argyropulo, 1993 (Rodentia, Arvicolinae, Microtus). Russ. J. Theriol. 2002, 1, 43–55. [Google Scholar] [CrossRef]
  7. Golenishchev, F.N.; Malikov, V.G.; Nazari, F.; Vaziri, S.; Sablina, O.V.; Polyakov, A.V. New species of vole of “guentheri” group (Rodentia; Arvicolinae; Microtus) from Iran. Russ. J. Theriol. 2003, 1, 117–123. [Google Scholar] [CrossRef]
  8. Golenishchev, F.N.; Zorenko, T.A.; Petrova, T.V.; Voyta, L.L.; Kryuchkova, L.Y.; Atanasov, N. Evaluation of the “Bottleneck” Effect in an Isolated Population of Microtus hartingi (Rodentia, Arvicolinae) from the Eastern Rhodope (Bulgaria) by Methods of Integrative Analysis. Diversity 2022, 14, 709. [Google Scholar] [CrossRef]
  9. Pardiñas, U.F.J. True Hamsters, Voles, Lemmings and New World Rats and Mice. In Handbook of the Mammals of the World—Vol. 7: Rodents II; Wilson, D.E., Lacher, T.E., Jr., Mittermeier, R.A., Eds.; Lynx Edicions: Barcelona, Spain, 2017; pp. 204–279. [Google Scholar]
  10. Thanou, E.; Paragamian, K.; Lymberakis, P. Social but lonely: Species delimitation of social voles and the evolutionary history of the only Microtus species living in Africa. J. Zoolog. Syst. Evol. 2019, 58, 475–498. [Google Scholar] [CrossRef]
  11. Kryštufek, B.; Shenbrot, G.I. Voles and Lemmings (Arvicolinae) of the Palaearctic Region; Maribor University Press: Maribor, Slovenia, 2022; p. 436. [Google Scholar]
  12. Mahmoudi, A.; Golenishchev, F.N.; Malikov, V.G.; Arslan, A.; Pavlova, S.V.; Petrova, T.V.; Kryštufek, B. Taxonomic evaluation of the “irani–schidlovskii” species complex (Rodentia: Cricetidae) in the Middle East: A morphological and genetic combination. Zool. Anz. 2022, 300, 1–11. [Google Scholar] [CrossRef]
  13. Ellerman, J.R.; Morrison-Scott, T.C.S. Checklist of Palearctic and Indian Mammals 1756–1946; British Museum Natural History: London, UK, 1951; 810p. [Google Scholar]
  14. Belcheva, R.; Peshev, T.H.; Peshev, T.D. Chromosome C- and Gbanding patterns in a Bulgarian population of M. guentheri Danford and Alston (Microtinae, Rodentia). Genetica 1980, 52, 45–48. [Google Scholar] [CrossRef]
  15. Kefelioğlu, H. The taxonomy of the genus Microtus (Mammalia: Rodentia) and its distribution in Turkey. Turk. J. Zool. 1995, 19, 35–63. (In Turkish) [Google Scholar]
  16. Yiģit, N.; Çolak, E. On the distribution and taxonomic status of Microtus guentheri (Danford and Alston; 1880) and Microtus lydius Blackler; 1916 (Mammalia: Rodentia) in Turkey. Turk. J. Zool. 2002, 26, 197–204. [Google Scholar]
  17. Lemskaya, N.A.; Romanenko, S.A.; Golenishchev, F.N.; Rubtsova, N.V.; Sablina, O.V.; Serdukova, N.A.; O’Brien, P.C.; Fu, B.; Yiğit, N.; Ferguson-Smith, M.A.; et al. Chromosomal evolution of Arvicolinae (Cricetidae, Rodentia). III. Karyotype relationships of ten Microtus species. Chromosome Res. 2010, 18, 459–471. [Google Scholar] [CrossRef] [PubMed]
  18. Zima, J.; Arslan, A.; Benda, P.; Macholàn, M.; Kryštufek, B. Chromosomal variation in social voles: A Robertsonian fusion in Gűnter’s vole. Acta Theriol. 2013, 58, 255–265. [Google Scholar] [CrossRef]
  19. Golenishchev, F.N.; Malikov, V.G. The systematics and distribution of the grey voles of the tribe Microtini (Rodentia; Arvicolinae) in the Caucasus and Asia Minor. In Proceedings of the International Conference “Biological Diversity and Conservation Problems of the Fauna of the Caucasus”, Yerevan, Armenia, 26–29 September 2011; LLC Spika: Yerevan, Armenia, 2011; pp. 101–105. (In Russian). [Google Scholar]
  20. Thanou, E.; Tryfonopoulos, G.; Chondropoulos, B.; Fraguedakis-Tsolis, S. Comparative phylogeography of the five Greek vole species infers the existence of multiple South Balkan subrefugia. Ital. J. Mammal. 2012, 79, 363–376. [Google Scholar] [CrossRef] [Green Version]
  21. Blackler, W.F.G. On a new species of Microtus from Asia Minor. Ann. Mag. Nat. Hist. 1916, 17, 426–427. [Google Scholar] [CrossRef] [Green Version]
  22. Corbet, G.B. The Mammals of the Palearctic Region: A Taxonomic Review; British Museum (Natural History): London, UK; Cornell University Press: Ithaca, NY, USA, 1978; 314p. [Google Scholar]
  23. Harrison, D.L.; Bates, P.J.J. The Mammals of Arabia; Harrison Zoological Museum: Sevenoaks, UK, 1991; 354p. [Google Scholar]
  24. Yiğit, N.; Markov, G.; Çolak, E.; Kocheva, M.; Akdi, Y. Contributions to taxonomy and morphological diversity of the “guentheri” group vole (mammalia: Rodentia) in the southeast of the Balkan Peninsula. In Proceedings of the 12th International Conference Rodens et Spatium, Zonguldak, Turkey, 19–23 July 2010; p. 38. [Google Scholar]
  25. Markov, G.; Yiğit, N.; Çolak, E.; Kocheva, M.; Gospodinova, M. Epigenetic diversity and similarity of the voles of “guentheri” group (Mammalia: Rodentia) in Anatolian Peninsula and southeastern part of the Balkan Peninsula. Acta Zool. Bulg. 2014, 66, 159–164. [Google Scholar]
  26. Yiğit, N.; Markov, G.; Çolak, E.; Kocheva, M.; Saygılı, F.; Yüce, D.; Çam, P. Phenotypic features of the ‘guentheri’ group vole (Mammalia: Rodentia) in Turkey and southeast Bulgaria: Evidence for its taxonomic detachment. Acta Zool. Bulg. 2012, 64, 23–32. [Google Scholar]
  27. Yiģit, N.; Çetintürk, D.; Çolak, E. Phylogenetic assessment of voles of the Guentheri Group (Mammalia: Microtus) in Turkish Thrace and Western Anatolia. Eur. Zool. J. 2017, 84, 252–260. [Google Scholar] [CrossRef] [Green Version]
  28. Markov, G. Microtus güentheri strandzensis subsp. nov., eine neue wühlmaus-unterart im Strandza-Gebirge, Ost-bulgarien. C. R. Acad. Bulg. Sci. 1960, 13, 615–661. [Google Scholar]
  29. Kryštufek, B.; Vohralík, V.; Zima, J.; Koubinova, D.; Bužan, E.V. A new subspecies of the Iranian Vole, Microtus irani Thomas, 1921, from Turkey (Mammalia: Rodentia). Zool. Middle East 2010, 50, 11–20. [Google Scholar] [CrossRef]
  30. Zorenko, T.A. Morphology of genitals and sexual behavior of social voles of the subgenus Sumeriomys (Arvicolinae, Microtus). Zool. J. 2000, 79, 990–999. (In Russian) [Google Scholar]
  31. Zorenko, T.; Golenishchev, G. The spermatozoa structure peculiarities of the subgenus Sumeriomys (Rodentia, Arvicolinae, Microtus). Russ. J. Theriol. 2015, 14, 105–111. [Google Scholar] [CrossRef]
  32. Zorenko, T.A.; Kagainis, U. Discrimination of the two subspecies of Microtus hartingi (Rodentia: Arvicolinae) by shape and linear features of the spermatozoon. Russ. J. Theriol. 2021, 21, 143–157. [Google Scholar] [CrossRef]
  33. Zorenko, A.; Kagainis, U.; Baraškova, L. Does the geometric and linear morphometry of the brain reflect the divergence in the “guentheri” group (Arvicolinae; Sumeriomys)? Russ. J. Theriol. 2020, 19, 45–57. [Google Scholar] [CrossRef]
  34. Zorenko, T.A.; Golenishchev, F.N.; Skinderskaya, I.A. Behavioral features of social voles of the subgenus Sumeriomys (Arvicolinae, Microtus) during hybridization. Balt. J. Lab. Anim. Sci. 1997, 7, 77–102. (In Russian) [Google Scholar]
  35. Zorenko, T.A.; Atanasov, N.; Golenishchev, F.N. Behavioral differentiation and hybridization of the European and Asian forms of Harting’ vole Microtus hartingi (Rodentia; Arvicolinae). Russ. J. Theriol. 2016, 15, 133–150. [Google Scholar] [CrossRef]
  36. Kryštufek, B.; Shenbrot, G.; Klenovšek, T.; Janžekovič, F. Geometric morphometrics of mandibular shape in the dwarf fat-tailed jerboa: Relevancy for trinomial taxonomy. Zool. J. Linn. Soc. 2021, 192, 1363–1372. [Google Scholar] [CrossRef]
  37. Marr, M.M.; Macleod, N. Geographical variation in Eurasian red squirrel (Sciurus vulgaris L., 1758) mandibles and the issue of subspecies level organization: A failure of history? Biol. J. Linn. Soc. 2019, 128, 337–359. [Google Scholar] [CrossRef]
  38. Yazdi, F.T.; Adriaens, D.; Darvish, J. Geographic pattern of cranial differentiation in the Asian Midday Jird Meriones meridianus (Rodentia: Muridae: Gerbillinae) and its taxonomic implications. J. Zool. Syst. Evol. Res. 2012, 50, 157–164. [Google Scholar] [CrossRef]
  39. Potapova, E.G. Zygomasseteric construction in rodents (typological, adaptive and taxonomic aspects). Zool. J. 2014, 93, 841–856. (In Russian) [Google Scholar]
  40. Anderson, P.S.; Renaud, S.; Rayfield, E.J. Adaptive plasticity in the mouse mandible. BMC Evol. Biol. 2014, 14, 85. [Google Scholar] [CrossRef] [PubMed]
  41. Barčiovà, L. Advances in insectivore and rodent systematics due to geometric morphometrics. Mammal Rev. 2009, 39, 80–91. [Google Scholar] [CrossRef]
  42. Voyta, L.L.; Omelko, V.E.; Petrova, E.A. Analysis of the morphometrics variability and intraspecific structure of Sorex minutisimus Zimmerman, 1780 (Lipotyphla: Soricidae) in Russia. Proc. Zool. Inst. RAS 2013, 317, 332–351. (In Russian) [Google Scholar] [CrossRef]
  43. Hiiemae, K.M. The structure and function of the jaw muscles in the rat (Rattus norvegicus L.) III. The mechanics of the muscles. Zool. J. Linn. Soc. 1971, 50, 111–132. [Google Scholar] [CrossRef]
  44. Gorodilova, J.V.; Vasil’eva, I.A. Geometric morphometrics of the low jaw of chromosome races of the pygmy mouse (Sylvaemus uralensis Pallas, 1881): Taxonomical and ecological aspects. Adv. Curr. Nat. Sci. Biol. Sci. 2014, 11, 19–24. (In Russian) [Google Scholar]
  45. Rohlf, F.J. SB Morphometrics at Suny Stony Brook. 2020. Available online: http://www.sbmorphometrics.org/ (accessed on 5 December 2022).
  46. Klingenberg, C.P. MorphoJ: An integrated software package for geometric morphometrics. Mol. Ecol. Resour. 2011, 11, 353–357. [Google Scholar] [CrossRef] [PubMed]
  47. Kryštufek, B.; Vohralik, V. Mammals of Turkey and Cyprus—Rodentia I: Sciuridae, Dipodidae, Gliridae, Arvicolinae; Znanstveno-Raziskovalno Središče Koper, Založba Annales, Zgodovinsko Društvo za Južno Primorsko: Ljubljana, Slovenia, 2005; 292p. [Google Scholar]
  48. Mahmoudi, A.; Darvish, J.; Aliabadian, M.; Khosravi, M.; Golenishchev, F.N.; Kryštufek, B. Chromosomal diversity in the genus Microtus at its southern distributional margin in Iran. J. Vertebr. Biol. 2014, 63, 290–295. [Google Scholar] [CrossRef]
  49. Kryštufek, B.; Janžekovič, F.; Shenbrot, G.; Ivajnšič, D.; Klenovšek, T. Phenotypic plasticity under desert environment constraints: Mandible variation in the dwarf fat-tailed jerboa, Pygeretmus pumilio (Rodentia: Dipodidae). Can. J. Zool. 2019, 97, 940–951. [Google Scholar] [CrossRef]
  50. Selçuk, A.Y.; Kaya, A.; Kefelioğlu, Y. Geomorphometric differences among four species of Microtus in Turkey (Mammalia: Rodentia). Zool. Middle East 2017, 64, 27–37. [Google Scholar] [CrossRef]
  51. Selçuk, A.Y.; Kaya, A.; Kefelioğlua, H. Differences in shape and size of skull and mandible in Talpa species (Mammalia: Eulipotyphla) from Turkey. Zool. Middle East 2019, 65, 20–27. [Google Scholar] [CrossRef]
  52. Renaud, S.; Rodrigues, H.G.; Ledevin, R.; Pisanu, B.; Chapuis, J.L.; Hardouin, E.A. Divergent in shape and convergent in function: Adaptive evolution of the mandible in Sub-Antarctic mice. Evolution 2018, 72, 878–892. Available online: https://pubmed.ncbi.nlm.nih.gov/29528493/ (accessed on 5 December 2022). [CrossRef] [Green Version]
  53. Giacomini, G.; Herrel, A.; Chaverri, G.; Brown, R.P.; Russo, D.; Scaravelli, D.; Meloro, C. Functional correlates of skull shape in Chiroptera: Feeding and echolocation adaptations. Integr. Zool. 2022, 17, 430–442. [Google Scholar] [CrossRef]
  54. Vereshchagin, N.K. The main ecological features of the social vole in the semi-desert zone of the Azerbaijan SSR. Tr. Zool. Inst. Acad. Sci. Azerbaijan SSR 1946, 9, 144–182. (In Russian) [Google Scholar]
  55. Kasatkin, M.V.; Neronov, V.V. Space usage and reproduction in social voles (Microtus socialis Pallas, 1773) in semi-desert under recently erased fire factor. Bull. Soc. Nat. 1995, 110, 92–97. (In Russian) [Google Scholar]
  56. Çolak, E.; Sőzen, M.; Yiģit, N.; Özkurt, Ç. A study on ecology and biology of Microtus guentheri Danford and Alston, 1880 (Mammalia: Rodentia) in Turkey. Tr. J. Zool. 1998, 22, 289–295. [Google Scholar]
  57. Abaturov, D.D. Forage resources, supply with food, and viability of herbivorous mammals. Zool. J. 2005, 84, 1251–1271. (In Russian) [Google Scholar]
  58. Mavropoulos, A.; Ammann, P.; Bresin, A.; Kiliardis, S. Masticatory demands induce region-specific changes in mandibular bone density in growing rats. Angle Orthod. 2005, 75, 625–630. [Google Scholar] [CrossRef]
  59. Badyaev, A.V. Stress-induced variation in evolution: From behavioral plasticity to genetic assimilation. Proc. Roy. Soc. B 2005, 272, 877–886. [Google Scholar] [CrossRef] [PubMed] [Green Version]
  60. Gambaryan, P.P. Adaptive Features of the Organs of Movement of Burrowing Mammals; Publishing House of the Academy of Sciences of the Armenian SSR: Yerevan, Armenia, 1960. (In Russian) [Google Scholar]
  61. Fraguedakis-Tsolis, S.E.; Chondropoulos, B.P.; Stamatopoulos, C.V.; Giokas, S. Morphological variation of the five vole species of the genus Microtus (Mammalia, Rodentia, Arvicolinae) occurring in Greece. Acta Zool. 2009, 90, 254–264. [Google Scholar] [CrossRef]
  62. Abramson, N.I.; Bodrov, S.Y.; Bondareva, O.V.; Genelt-Yanovskiy, E.A.; Petrova, T.V. A mitochondrial genome phylogeny of voles and lemmings (Rodentia: Arvicolinae): Evolutionary and taxonomic implications. PLoS ONE 2021, 16, e0248198. [Google Scholar] [CrossRef] [PubMed]
  63. Markov, G.; Dimitrov, H. Habitat fragmentation and its implications for abundance of Guenther’s vole in southeastern Bulgaria (Strandzha mountain region). Biotechnol. Biotechnol. Equip. 2010, 24, 679–682. [Google Scholar] [CrossRef] [Green Version]
  64. Kryštufek, B.; Zorenko, T.; Bontzorlos, V.; Mahmoudi, A.; Atanasov, N.; Ivajnšič, D. Incipient road to extinction of a keystone herbivore in south-eastern Europe: Harting’s vole (Microtus hartingi) under climate change. Clim. Change 2018, 149, 443–456. [Google Scholar] [CrossRef]
  65. Latvian Council of Science 2018. Scientist’s Ethics Code. Section 2.7. Riga. Available online: https://www.lzp.gov.lv/index.php?mylang=english (accessed on 5 December 2022).
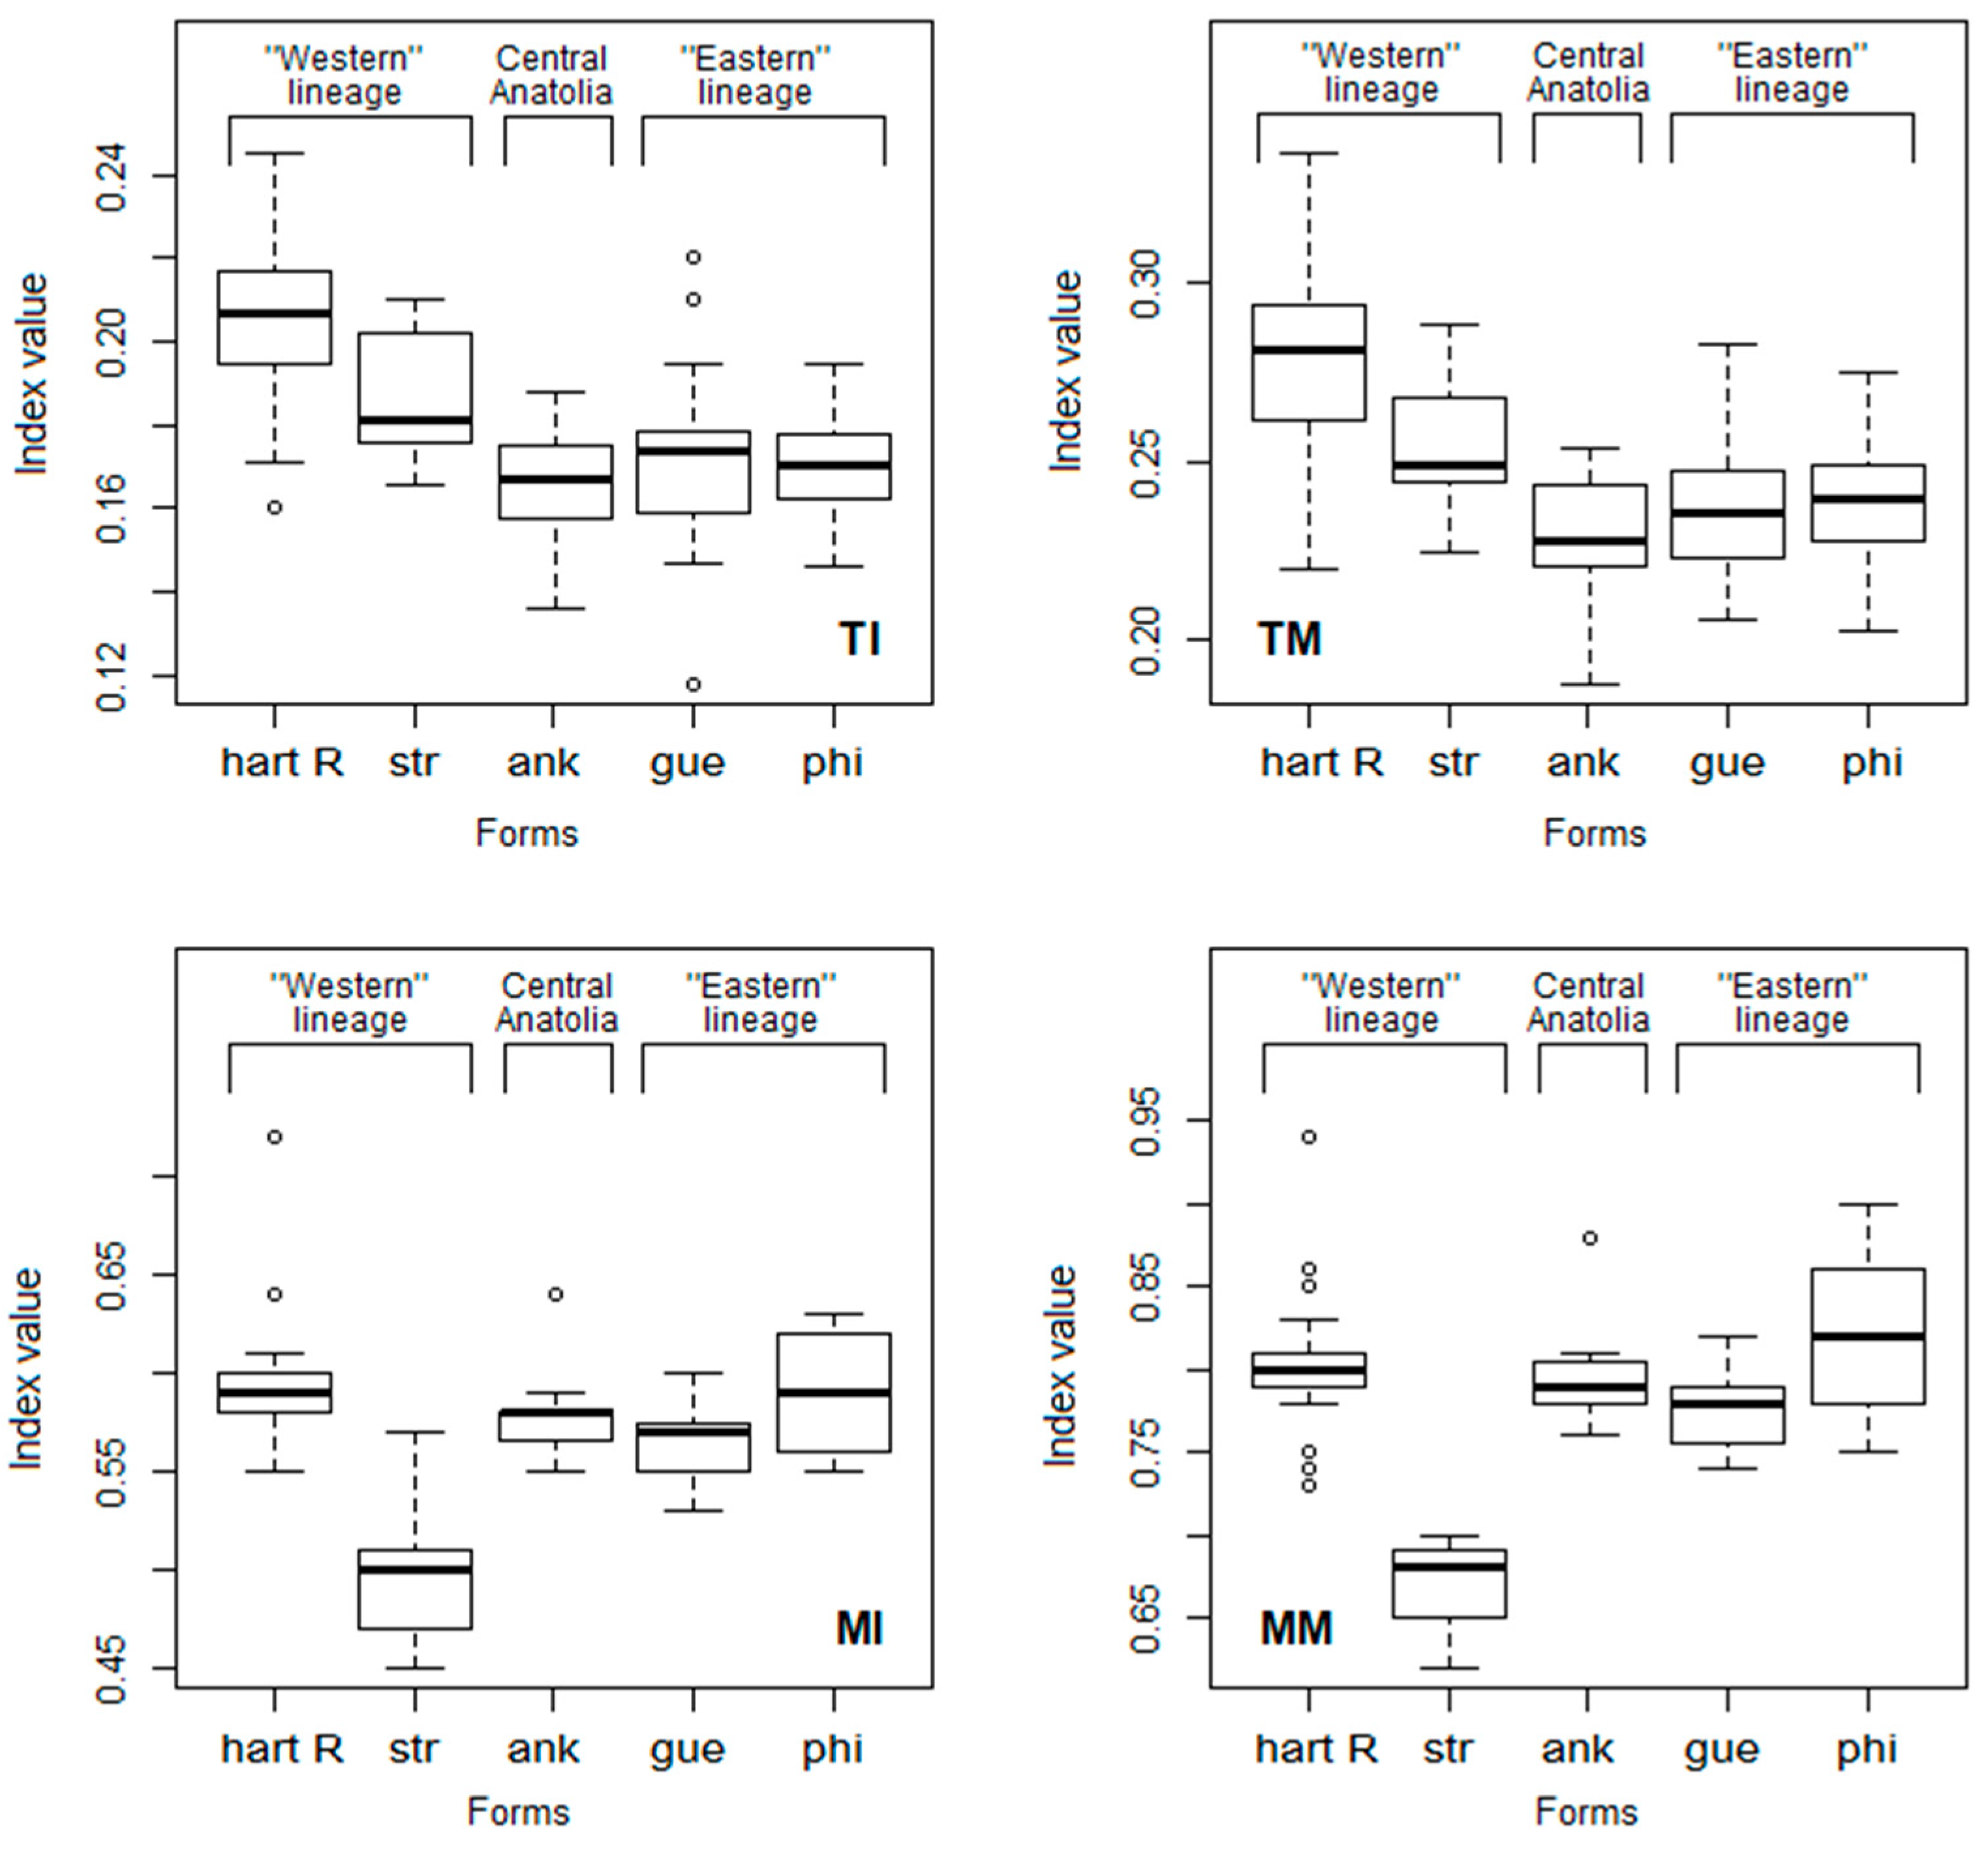
Figure 2. Differences in the morpho-ecological indices of the mandible among social voles in the “guentheri” group. The boxplot bars represent an interquartile range (25th to 75th percentiles) and white dots are outlier data points that are located outside 1.5 times the interquartile range above the upper quartile and below the lower quartile: TI: temporal incisor index, TM: temporal molar index, MI: masseter incisor index; MM: masseter molar index.
Diversity 15 00083 g002
Figure 3. Scatter plots of the PCA (on the left) and positive directional shape changes of PC1 and PC2 (on the right) of the cranial (A) and mandibular (B) datasets among five vole forms in the “guentheri” group. Blue dots indicate landmarks after shape deformation; red numbers indicate landmark numbers; the scale factor for deformation visualization for the cranium is 0.13, and for the mandible, it is 0.16.
Diversity 15 00083 g003
Figure 4. Scatter plots of the CVA (on the left) and positive directional shape changes of CV1 and CV2 (on the right) in the cranial (A) and mandibular (B) datasets among five vole forms in the “guentheri” group. Blue dots indicate landmarks after shape deformation; red numbers indicate landmark numbers; the scale factor for deformation visualization: 30.0.
Diversity 15 00083 g004
Figure 5. The DFA histogram (A) and shape (B) deformation results for cranial datasets from five vole forms in the “guentheri” group. Blue dots indicate landmarks after shape deformation; red numbers denote landmark numbers; the scale factor for deformation visualization: 4.0.
Diversity 15 00083 g005
Figure 6. The DFA histogram (A) and shape (B) deformation results for mandible datasets from five vole forms in the “guentheri” group. Blue dots indicate landmarks after shape deformation; red numbers represent landmark numbers; the scale factor for deformation visualization: 4.0.
Diversity 15 00083 g006
Figure 7. Correlations between centroid size–related cranial GM landmark data (A,B) or mandibular GM landmark data (C,D) and the geographical latitude and longitude of sampling.
Diversity 15 00083 g007
Table 1. Number of specimens obtained from DEZ (indicated with an asterisk symbol) and ZIN collections in each dataset used in the statistical analysis of various forms of the “guentheri” group (numbers of excluded specimens during statistical analysis of GM data are indicated in parentheses).
FormsNumbers of Specimens
CraniaMandibles
FemalesMalesTotalFemalesMalesTotal
Gue101020101020
Phi10152591322
Har R18 (3) *22 (2) *40 (5) *20 (12) *23 (10) *43 (22) *
Ank 1091910919
Str111122101121
Total5967126 (5)59 (12)66 (10)125 (22)
Table 2. Means and standard deviations of linear measurements (mm) in five vole forms: Har R: M. hartingi from the Rhodopes, Str: M. h. strandzensis, Ank: M. h. ankaraensis, Gue: M. g. guentheri, and Phi: M. g. philistinus. * See the corresponding landmarks in Figure 1.
Traits
FormsCraniumMandible
LM 1- 6 *
m ± SE
LM 5–6
m ± SE
LM 5–8
m ± SE
LM 16–17
m ± SE
LM 5–12
m ± SE
LM 11–14
m ± SE
LM 5–20
m ± SE
Gue 26.7 ± 0.257.0 ± 0.103.7 ± 0.062.1 ± 0.038.9 ± 0.1114.1 ± 0.219.2 ± 0.11
Phi26.6 ± 0.246.9 ± 0.113.6 ± 0.051.9 ± 0.049.2 ± 0.1014.3 ± 0.109.8 ± 0.10
Ank 29.1 ± 0.277.1 ± 0.133.98 ± 0.082.3 ± 0.059.6 ± 0.1015.6 ± 0.1110.1 ± 0.09
Str27.8 ± 0.206.9 ± 0.084.2 ± 0.052.5 ± 0.029.3 ± 0.1015.3 ± 0.139.7 ± 0.09
Har R30.6 ± 0.137.4± 0.095.1 ± 0.082.7 ± 0.0410.6 ± 0.2616.7 ± 0.1010.8 ± 0.25
Table 3. A comparison of the linear size of the voles’ mandible between the eastern and western clusters of the forms under study.
Measurements“Eastern” Cluster
n = 42
“Western” Cluster
n = 48
t Testp Value
LM 5–83.62 ± 0.04 4.68 ± 0.008t = 11.79<0.001
LM 16–171.91 ± 0.012.58 ± 0.03t = 14.00<0.001
LM 5–129.03 ± 0.0710.05 ± 0.18t = 5.36<0.001
LM 11–1414.22 ± 0.1316.02 ± 0.13t = 9.82<0.001
LM 5–209.51 ± 0.0810.27 ± 0.16t = 4.23<0.001
Table 4. A comparison of the linear size of the voles’ mandible between the eastern or western cluster of forms and M. h. ankaraensis.
MeasurementsAnk
n = 19
Ank vs. “Eastern” Cluster
t Test, p Value
Ank vs. “Western” Cluster
t Test, p Value
LM 5–83.98 ± 0.08 t = 3.98, p < 0.001t = 2.39, p < 0.02
LM 16–172.27 ± 0.05t = 3.93, p < 0.001t = 2.88, p < 0.001
LM 5–129.61 ± 0.10t = 8.20, p < 0.001t = 3.41, p < 0.001
LM 11–1415.62 ± 0.11t = 8.25, p < 0.001t = 2.28, p < 0.05
LM 5–2010.10 ± 0.09t = 4.92, p < 0.001t = 0.93
Table 5. Procrustes ANOVA results (F: Goodal’s F, CS: centroid size, Pill: Pillai trace, boldfaced: a significant difference).
IndividualsDataset Fp Value
FormsCraniumCS118.87<0.0001
Shape10.84<0.0001
MandibleCS61.13<0.0001
Shape18.00<0.0001
SexCraniumCS0.850.3591
Shape1.330.0882
MandibleCS0.710.3998
Shape1.790.0025
Table 6. CVA results for cranial and mandibular datasets among five vole forms (Mah. Dist.: Mahalanobis distance; Proc. Dist.: Procrustes distance; Perm. P: permutation p value; boldfaced: a statistically significant difference).
FormsMah.dist.Perm.p.Proc.dist.Perm.p.Mah.dist.Perm.p.Proc.dist.Perm.p.
GuePhi
Cranium
Phi6.1696<0.00010.0236<0.0001----
Har R8.8259<0.00010.0331<0.00017.8984<0.00010.0222<0.0001
Ank6.5101<0.00010.0208<0.00017.8335<0.00010.0226<0.0001
Str7.3190<0.00010.0237<0.00014.8337<0.00010.0259<0.0001
Mandible
Phi6.7497<0.00010.0410<0.0001----
Har R6.2963<0.00010.0412<0.00019.5139<0.00010.0664<0.0001
Ank4.6236<0.00010.0219<0.00018.2303<0.00010.0453<0.0001
Str9.2308<0.00010.0439<0.000111.1936<0.00010.0647<0.0001
Har RAnk
Cranium
Phi--------
Har R--------
Ank6.7391<0.00010.0244<0.0001----
Str4.8337<0.00010.0263<0.00015.8432<0.00010.0185<0.0001
Mandible
Phi--------
Har R--------
Ank6.2203<0.00010.0371<0.0001----
Str7.7632<0.00010.0381<0.00017.1452<0.00010.0378<0.0001
Table 7. DFA results for cranial and mandibular specimens among five vole forms of the “guentheri” group (T2: T-square, Param. P: parametric p values, Perm. P: permutation p value, Proc.: Procrustes distance, boldfaced: a significant difference).
FormsT2Param.p.Perm.p. (T2)Perm.p. (Proc.)T2Param.p.Perm.p. (T2)Perm.p. (Proc.)
GuePhi
Cranium
Phi2563.70210.00040.0010<0.0001----
Har R3889.0052<0.0001<0.0001<0.00011508.2471<0.0001<0.0001<0.0001
Ank2963.63690.20020.1840<0.00014618.48570.0002<0.0001<0.0001
Str1828.70750.02370.0260<0.00011524.61410.0003<0.0001<0.0001
Mandible
Phi3709.79570.01650.0160<0.0001----
Har R3306.94460.00620.0040<0.00014757.69740.0006<0.0001<0.0001
Ank578.69970.6723<0.0001<0.00012851.90730.07740.0770<0.0001
Str3894.18940.01500.0190<0.00014175.05440.04580.0420<0.0001
Har R Ank
Cranium
Phi--------
Har R--------
Ank1110.7694<0.0001<0.0001<0.0001----
Str1815.6868<0.0001<0.0001<0.00013738.97640.01620.0190<0.0001
Mandible
Phi--------
Har R--------
Ank4892.75040.00980.0140<0.0001----
Str11,455.2269<0.0001<0.0001<0.000133,813.5451<0.0001<0.0001<0.0001
Table 8. DFA results for cranial and mandibular data between vole sexes (T2: T-square, Param. P: parametric p values, Perm. P: permutation p value, Proc.: Procrustes distance value, boldfaced: a significant difference).
GroupsFemales
T2Param.p.Perm.p. (T2)Perm.p. (Proc.)
Cranium
Males85.83560.02660.03200.1950
Mandible
Males99.31850.01900.01800.0890
Disclaimer/Publisher’s Note: The statements, opinions and data contained in all publications are solely those of the individual author(s) and contributor(s) and not of MDPI and/or the editor(s). MDPI and/or the editor(s) disclaim responsibility for any injury to people or property resulting from any ideas, methods, instructions or products referred to in the content.