Abstract
Yunnan Province has emerged as a trailblazer in fostering an ecological civilization, assuming a prominent and pioneering role as the vanguard of ecological conservation in the southwestern region of China. Within the expansive tapestry of Yunnan Province, the northwest region has assumed a pivotal and indispensable position in spearheading the advancement of ecological civilization. To unravel the intricate and complex dynamics at play, this investigation employed a comprehensive array of methodologies, encompassing the sophisticated land use transfer matrix, the dynamic degree of land use, the center-of-gravity migration model, and the standard deviation ellipse. These sophisticated approaches were employed to delve deeply into the nuanced characteristics of the spatiotemporal evolution of ecologically pristine land in northwest Yunnan, while meticulously exploring the multifaceted factors that have intricately shaped its trajectory. The research findings illuminated several pivotal domains: (1) In terms of quantitative transformations, a substantial conversion of vast grassland expanses into cultivated land transpired from 2000 to 2010, spanning an expansive territory of 1303 km2. The most significant transformations were observed between forested land and grassland (591.81 km2) and from cropland to built-up land (51.99 km2). (2) Turning our attention to the pace of transformation, a closer examination of the land use dynamic degree revealed that urban construction land exhibited the highest degree of dynamism throughout the study period, demonstrating an average annual growth rate of 3.89% from 2000 to 2010, followed by a more accelerated growth rate of 6.14% from 2010 to 2020. In terms of the comprehensive land use dynamic degree, the annual rates of land use change from 2000 to 2010 and from 2010 to 2020 were only 0.1% and 0.03%, respectively. These figures indicate a gradual and deliberate overall pace of land use change in the northwest region of Yunnan throughout the entire study period. (3) Regarding spatial transformations, between 2000 and 2010, there was a discernible southeastern displacement of the center of gravity for ecological land. However, from 2010 to 2020, the center of ecological land experienced a migration towards the northwest, covering an impressive migration distance of up to 48,657.35 m. Simultaneously, the index of biological abundance exhibited high values in the northwest and low values in the southeast, indicative of favorable ecological conditions in the northwest region. (4) An analysis of the influencing factors revealed that the adaptive and dynamic nature of social and economic factors played a pivotal role in shaping the alterations observed in the ecological landscape. The study of ecological land use in northwest Yunnan holds the potential to provide valuable support for the protection and sustainable utilization of regional ecological land use, thereby contributing to the consolidation of the ecological security barrier in southwestern Yunnan and the preservation of biodiversity.
1. Introduction
“The prosperity of the natural environment is intricately intertwined with the flourishing of human civilization.” In January 2015, during his visit to Yunnan, President Xi Jinping underscored the province’s strategic imperative to “strive for leadership in advancing ecological civilization” [1,2]. Aligned with Xi Jinping’s ideology of ecological civilization, Yunnan Province has consistently prioritized the promotion of green and low-carbon development, along with the comprehensive enhancement of resource utilization efficiency, all aimed at facilitating the attainment of carbon peaking and carbon neutrality objectives. Against this backdrop, the issue of land ecology has garnered escalating scholarly attention.
Ecological civilization embodies a societal paradigm aimed at fostering harmonious coexistence, a virtuous cycle, comprehensive development, and sustained prosperity between human beings and nature, among human beings, and between human beings and society [3,4,5]. Within the broader framework of nationwide endeavors to build an ecological civilization, the scholarly community has increasingly turned its attention to the realm of land ecology. Research in this field encompasses several crucial aspects. Firstly, various conceptualizations and classifications of ecological land have emerged, each representing distinct viewpoints. Scholars such as Dong Yawen [3] and Yu Feng [4] advocate for the identification of ecological elements as a primary consideration. On the other hand, Zhang Hongqi [5], Deng Hongbing [6], and Long Hualou [7] champion a perspective that emphasizes holistic ecological functions. The third viewpoint, advocated by Fei Jianbo [8] and others, emphasizes the role of human agency in determining the functions of ecological land. These scholars have enriched the discourse surrounding the definition and classification of ecological land. In analyzing the spatiotemporal evolution of ecological land, numerous scholars have used diverse methodologies to examine the characteristics of regional changes. These methodologies encompass metrics such as the Gini coefficient, the land use dynamic degree, the land use transfer matrix, the center-of-gravity migration model, and kernel density analysis [9,10,11,12,13,14,15,16,17,18,19]. When examining the drivers of ecological land use, scholars have taken into account the social and economic conditions of the research areas and have carefully selected pertinent indicators to assess the underlying factors. Scholars have employed a range of quantitative analysis models, including logistic regression, geographic detectors, and geographically weighted regression (GWR) models, to unveil the underlying forces at play [20,21,22,23,24,25,26]. For prognosticating future trends in the evolution of ecological land use, scholars have pursued simulation and predictive approaches. Some researchers have utilized single simulation models to forecast forthcoming land use changes depending on the models’ applicability [27,28,29,30,31,32,33]. Others have adopted a fusion of two or more models to simulate and predict land use changes, harnessing the strengths of each to achieve heightened accuracy [33,34,35,36,37]. When it comes to the methods employed for the detection and analysis of drivers, most scholars have tended to rely on a single model for their analyses, such as logistic regression models [20], multiple linear regression models [21], and geoprobes [22,23]. Some scholars have combined two models at the same time, such as Li Tong [24] and Liu Yanwen [38], who combined spatial autocorrelation and geoprobes to investigate the mechanisms influencing the stability of ecological land use. Moreover, in addition to the aforementioned topics, scholars have conducted extensive research on ecological compensation [39,40,41,42], ecological environmental quality [43,44,45,46,47], and the valuation of ecosystem services [48].
To recapitulate, initial scholarly endeavors centered around the conceptualization and classification of ecological land. Between 2005 and 2020, researchers shifted their focus towards the spatial identification of ecological land, exploring the value of its ecosystem services and establishing patterns related to landscape ecological security. In the past five years, the academic community has delved into the spatiotemporal evolution, influencing factors, and simulation-based predictions of ecological land use. Collectively, over the past two decades, scholars have conducted comprehensive and multifaceted investigations into ecological land, yielding commendable outcomes. However, certain limitations persist. Firstly, existing research on the spatiotemporal evolution and influencing factors of ecological land exhibits some weaknesses. Through a thorough literature review, it became evident that the majority of researchers have concentrated their studies on representative regions such as large urban areas, the Beijing–Tianjin–Hebei region, the Yangtze River Delta, the Pearl River Delta, the Chang–Zhu–Tan region, the arid northwest, and coastal areas [46,47,48,49]. There is limited research concerning ecological land in the mountainous border areas, despite the recognition that ecological functions vary across different spatial scales. The intricacies of mountainous regions call for further exploration in these realms. Secondly, most scholars have examined ecological land-related issues in isolation. However, in reality, ecological land is subject to the influence of both human activities and natural geographical conditions, displaying intricate interactions and transformations with other land use types. Moreover, in China’s current land use classification system, greater emphasis is placed on the economic attributes of land, while the ecological attributes are not adequately considered, resulting in ecological land not being listed as a distinct land category. The classifications of ecological land by most scholars also show a limited degree of convergence with the current land use classification. Finally, most of the existing scholars have analyzed the causes of ecological land changes from a qualitative perspective but have not carried out quantitative explorations. Therefore, this study chose a highly applicable geodetector to quantitatively analyze the drivers of ecological land changes in northwest Yunnan.
From a comprehensive standpoint, considering the interplay between ecological land and other land uses, this investigation selected the representative mountainous border region of northwest Yunnan as the designated study area. Through preprocessing remote sensing images depicting the current land use in northwest Yunnan, land use data for the years 2000, 2010, and 2020 were acquired. The primary objective of this study was to analyze the distinctive characteristics of ecological land in terms of its quantity, rate of change, spatial distance, and the direction of migration of its center of gravity in contrast to other land use types. We anticipate that this endeavor will provide valuable insights and serve as a point of reference for further explorations into ecological land within mountainous border regions.
Through a meticulous examination of the distribution patterns and distinctive features of the spatiotemporal evolution of regional ecological land within the designated study area, coupled with an in-depth exploration of the influencing factors, it will become possible to mitigate conflicts between human activities and the environment. Moreover, this analysis can facilitate the judicious utilization of regional ecological land and foster sustainable development. In the present investigation, four distinct methodologies (namely, the land use transfer matrix, the land use dynamic degree, the gravitational-center migration model, and the standard deviation ellipse) were employed to dissect the characteristics of the spatiotemporal evolution of ecological land in northwest Yunnan over the past two decades. Additionally, the objective was to unravel the factors that drive changes in ecological land. This study will enrich the dynamic exploration of ecological land use in mountainous areas while simultaneously providing valuable references for both the utilization of ecological land and the conservation of biodiversity in northwest Yunnan. Ultimately, it will contribute to the establishment of an ecological civilization within the province of Yunnan.
2. Materials and Methods
2.1. Overview of the Study Area
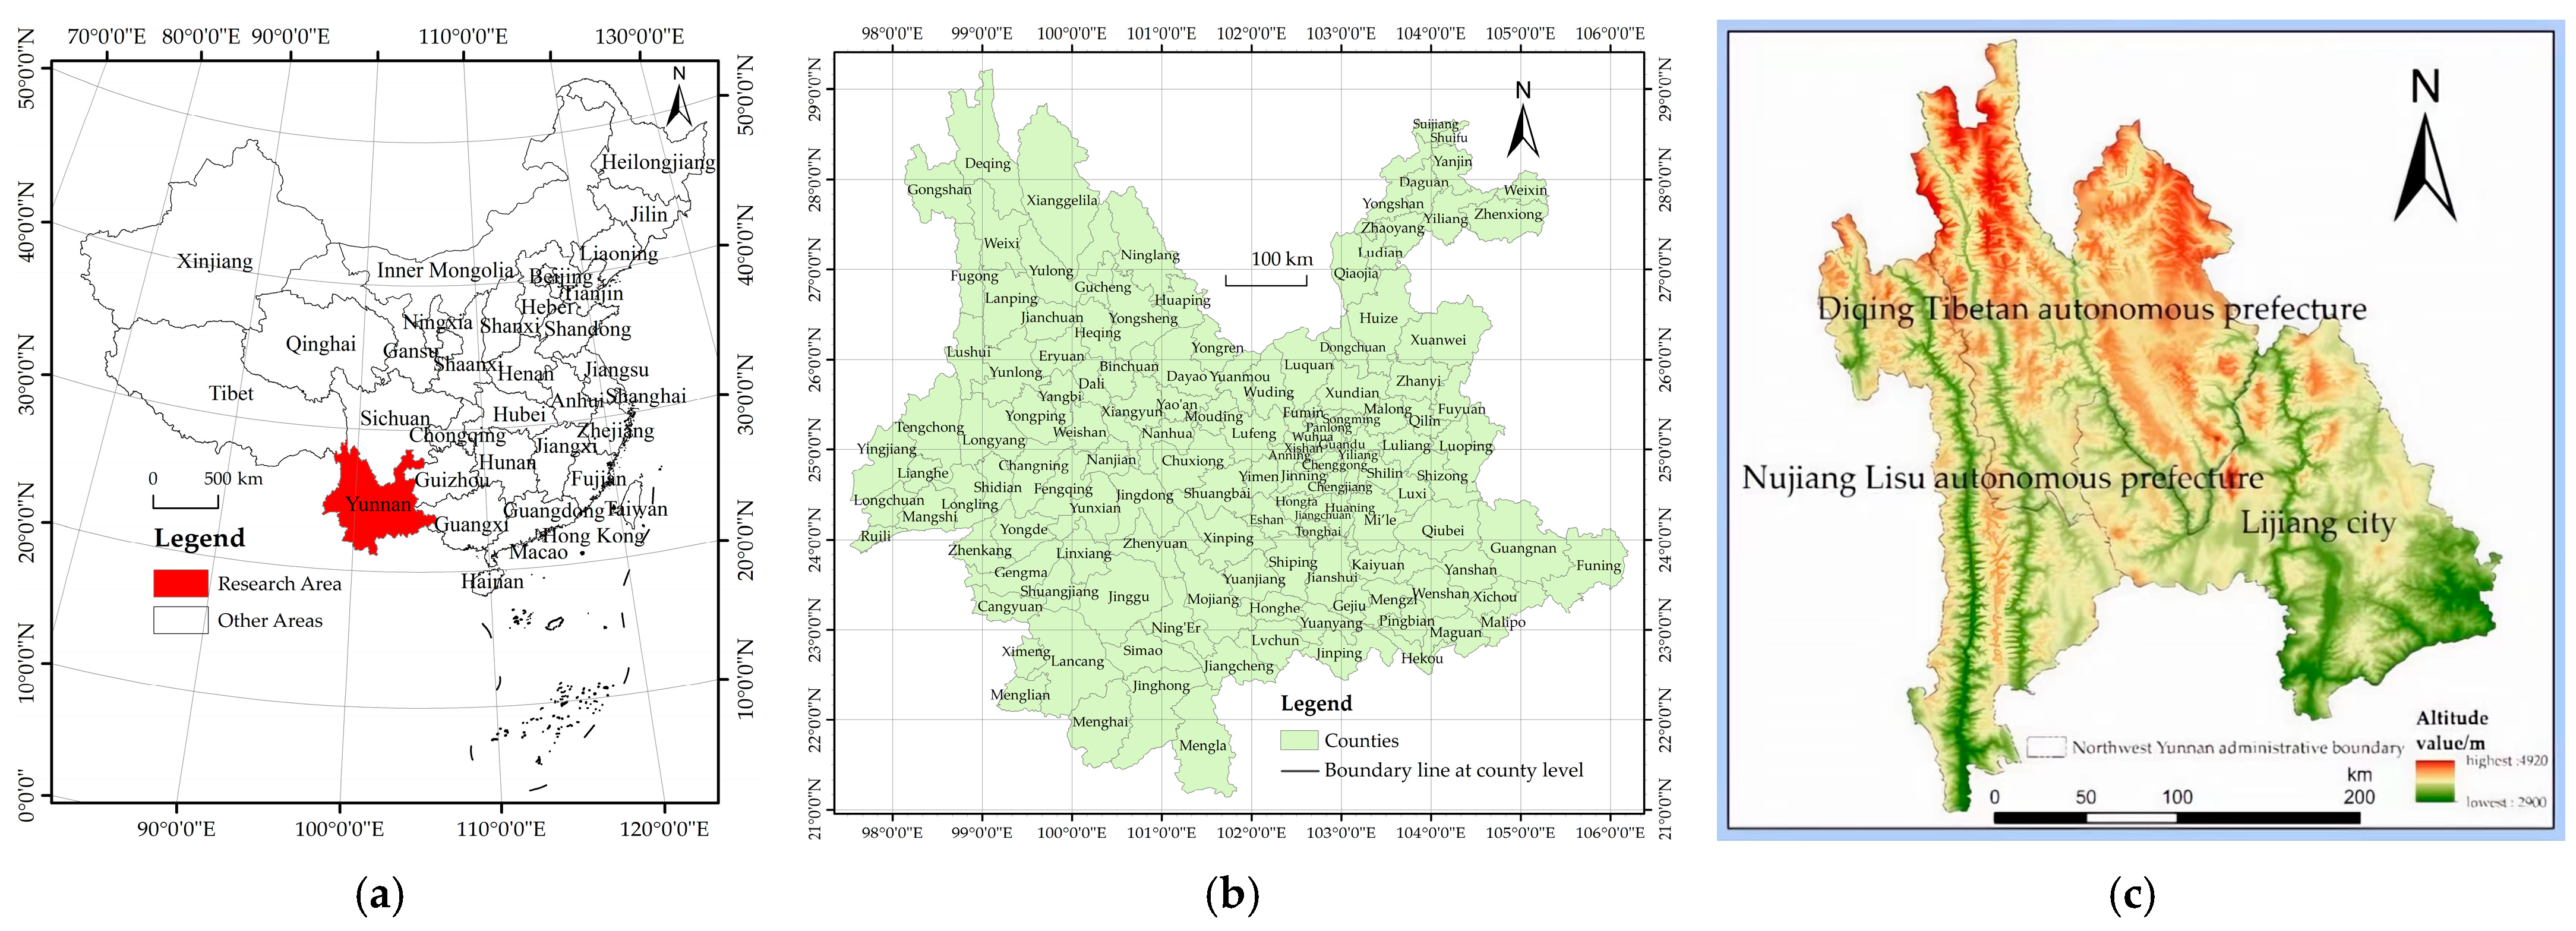
Northwest Yunnan, an integral component of the southwestern ecological security barrier, assumes a paramount role as a nucleus for the advancement of ecological civilization and economic prosperity within the province of Yunnan. Geographically, it shares borders with Myanmar, Tibet, and Sichuan. Administratively, it encompasses three prefectures in the northwestern part of Yunnan Province, namely, Lijiang City, Diqing Tibetan Autonomous Prefecture, and Nujiang Lisu Autonomous Prefecture. Encompassing a vast land area of 5.8375 million hectares (87,562,500 acres), northwest Yunnan was home to a population of 2.5704 million people by the conclusion of 2020, with 800,400 individuals residing in urban areas and 1.7696 million inhabiting rural regions. Over the course of the research period, the regional gross domestic product of northwest Yunnan witnessed a substantial increase from CNY 3.043 billion in 2000 to CNY 99.042 billion in 2020. Nestled at the junction of the Qinghai–Tibet Plateau and the Yungui Plateau, northwest Yunnan epitomizes the quintessential characteristics of a region adorned with lofty mountains and deep gorges, where three rivers converge. It displays a diverse distribution of fault structures, giving rise to intricate landforms and captivating topography. The region encompasses a wealth of forest resources and supports rich biodiversity, making it a pivotal ecological barrier for the nation. However, within this ecological oasis, a delicate balance exists between advantages and vulnerabilities. Regrettably, in recent years, the relentless pursuit of economic development has inflicted significant harm upon the pristine ecological environment. Hence, a comprehensive examination of the ecological land in northwest Yunnan is imperative, serving as a bulwark for the protection and sustainable utilization of ecological resources within this realm, thereby nurturing the establishment of an ecological civilization in Yunnan Province. Figure 1 provides an overview of the geographic location of the study area.
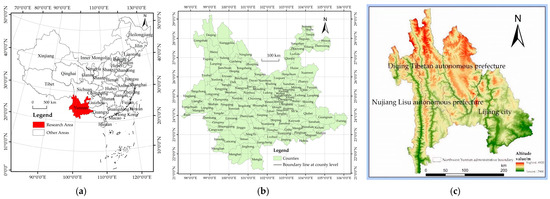
Figure 1.
Schematic of the geographic location of the study area. Note: (a–c) indicates the serial number of the picture.
2.2. Definition and Categorization of Ecological Land Use in the Study Area
The value of ecosystem services is the basis for many scholars to define eco-land. So-called ecosystem services refer to the products and services that human beings obtain directly or indirectly from nature, such as a water resource supply, soil and water conservation, biodiversity, and other services, which play an important role in maintaining the sustainable development of human society [14,17,43]. Adopting the classification framework proposed by Fei Jianbo [8], this study placed utmost importance on the fundamental functions performed by ecological land as the principal criterion for its delineation. Consequently, within the context of this study, ecological land is land that bestows ecological products and upholds the ecological equilibrium. Its primary responsibilities encompass the provision of vital ecological services, the regulation of the environment, and the preservation of biodiversity. Undeniably, ecological land assumes a pivotal role in sustaining the regional ecological balance and driving the trajectory of sustainable development [3,4,5,6,7,8,9,10,11,12].
According to the main function of land use, when calculating the ecological service value of land use types in northwest Yunnan, land with an ecological service value greater than CNY 100,000 is regarded as ecological land, and, as shown in the table, there are four types of ecological land, namely, arable land, forest land, grassland, and watersheds, according to the conditions. However, the ecological service value of arable land has a shorter service period, and its main function is production, so it is not included in the scope of ecological land [9,15]. Although the ecological service value of unutilized land is relatively small, it has neither a mainly productive function nor a mainly living function; it presents ecological service value all year round; and it can be used as follow-up reserve land for forests, grassland, and water areas, so unutilized land is included in the category of ecological land [26]. The ecological service values of land use types in Northwest Yunnan are shown in Table 1.

Table 1.
Ecological service value of land types in northwest Yunnan in the last 20 years.
On the basis of calculating the value of ecosystem services, by employing the LUCC (land use and land cover change) classification methodology and aligning it with contemporary land use classifications, this investigation categorized the ecological land in northwest Yunnan into four primary categories, namely, woodland, grassland, waterbodies, and unused land. Table 2 provides a comprehensive breakdown of this classification, incorporating insights from both domestic and international scholars who have made significant contributions to the discourse surrounding the categorization of ecological land [50].
Table 2.
Classification of ecological land use in northwest Yunnan.
2.3. Data Sources
Initially, the shapefile data encompassing the administrative boundaries of the northwest Yunnan region were obtained from DataV GeoAtlas [21]. Subsequently, remote sensing monitoring images depicting land use for the years 2000, 2010, and 2020 in northwest Yunnan were procured from the Data Center for Resources and Environmental Sciences, an affiliate of the esteemed Chinese Academy of Sciences. Utilizing advanced GIS technology, a series of intricate steps including vectorization, mask extraction, fusion, and intersection were employed to extract the land use data.
The economic data, which constituted an integral component of this study, were sourced from a myriad of reputable publications, including the China Statistical Yearbook and Yunnan’s Statistical Yearbook. Additionally, statistical bulletins pertaining to the national economy and the social development of local municipalities within northwest Yunnan were also consulted. These diverse data sources played a pivotal role in comprehensively examining the driving forces behind the transformation of ecological land within the northwest Yunnan region over the course of the past two decades.
2.4. Research Methods
2.4.1. Land Use Transfer Matrix
A land use transfer matrix serves as a quantitative representation of the states and transitions within a system, facilitating the in-depth analysis of the system dynamics. One was used to examine the quantitative alterations and trajectories of land use types over the study period [32,33,34]:
where Aij represents a transfer from land use type i to land use type j, and n represents the total number of land use types.
2.4.2. Land Use Dynamics
An examination of land use dynamics entails an exploration of the pace at which a specific land use category undergoes transformations within a defined temporal and spatial framework [32]. In this study, both the individual land use dynamic degrees and the comprehensive land use dynamic degree were employed to evaluate the rate of change for each land use type in the northwest Yunnan region. A positive value was attributed to a land use type when its area expanded, whereas a negative value was assigned when its area diminished [33]:
where S represents the dynamic change in land use, the land area occupied by a specific land use type during the initial period of the study is denoted as U1, the land area corresponding to that land use type after the study is denoted as U2, t0 designates the time of the baseline period, t1 designates the period under investigation, L denotes the rate of land use transformation, and n signifies the total number of land use types.
2.4.3. Center-of-Gravity Migration Model
A center-of-gravity model offers a more encompassing portrayal of the spatial configuration of elements within a region. It adeptly captures the spatial concentration and migration witnessed in regional development, thereby illustrating the dynamic shifts in the center of gravity of these elements [51].
In these formulas, Xt and Yt represent the latitude and longitude coordinates of the center of gravity of land use type i in year t, respectively, and Tti represents the area of land use type i in year t. The combined latitude and longitude coordinates of the center of gravity of each land use type are represented by Xi and Yi, respectively.
2.4.4. Standard Deviation Ellipse
The standard deviation ellipse is a spatial statistical technique used to quantitatively analyze the centrality and directionality of features by utilizing the covariates of long and short semiaxes. Within this framework, the long and short semiaxes provide insights into the spatial distribution of the data, encompassing both its orientation and magnitude [38].
2.4.5. Geographic Detector
The geodetector technique is used to investigate a spatial model and delineate the magnitude of influence exerted by diverse natural and socioeconomic factors on a specific geographical attribute. This approach boasts fewer prerequisite constraints and confers distinct advantages in handling heterogeneous data types. A geoprobe encompasses four fundamental components: risk detection, interaction detection, factor detection, and ecological detection. Its extensive application spans the domains of land utilization, regional economics, and environmental contamination. The underlying concept revolves around the notion that when an independent variable significantly impacts a specific dependent variable, their respective spatial distributions tend to exhibit a degree of resemblance. In this study, factor detection, interaction detection, and ecological detection were harnessed for the quantitative analysis of the factors driving the transformations in ecological land use [20].
Factor detection endeavors to elucidate the degree to which each influencing factor affects ecological land use and can be conceptualized through the following model [20,25]:
In the aforementioned model, the explanatory potency (q) of a factor pertaining to the rate of transformation in ecological land is represented by a value within the range of 0 to 1. A higher value signifies a greater explanatory strength of the factor regarding the rate of change in ecological land. Meanwhile, L represents the sub-area, signifying the spatial distribution of a specific factor. The variable Nh denotes the number of samples within the sub-area; N represents the total number of samples within the entire area; and Nδ2 and δ2 correspond to the discrete variance of the rate of change in ecological land within the sub-area (h) and the entire area, respectively.
Interaction detection was used to investigate whether the combined effect of two factors on ecological land changes was diminished or amplified, or whether they exhibited independent influences. Initially, we calculated q(X1) and q(X2), representing the explanatory strengths of the two influencing factors, namely, the supply capacity and the demand intensity, or supply–demand index. Subsequently, we calculated q(X1∩X2), indicating the interaction between the two influencing factors.
Ecological probes were employed to discern the presence of a substantial disparity in the observed alterations in ecological land use between the two factors, X1 and X2. This comparative analysis is indicated by the variable S [25].
Here, Nx1 and Nx2 denote the sample sizes of the two factors x1 and x2, respectively, and δx12 and δx22 denote the sums of the within-stratum variance of the strata formed by x1 and x2. The null hypothesis (H0) is δx12 = δx22; if H0 is rejected at the confidence level, this suggests that there is a significant difference between the effect of the two factors X1 and X2 on the change in ecological land use. The technical frameworks of the study are presented below.
3. Results
3.1. Changes in the Amount of Ecological Land
By utilizing 30 m remote sensing imagery furnished by the esteemed Chinese Academy of Sciences, land use data pertaining to northwest Yunnan for the years 2000, 2010, and 2020 were extracted through a sequence of meticulous procedures encompassing land use type reclassification, fusion, and intersection, all executed within the sophisticated ArcGIS 10.2 platform [21]. Subsequently, these data were imported into an Excel spreadsheet and converted into a pivot table, culminating in the creation of the land use transfer matrix for northwest Yunnan, vividly illustrated in Table 3 below.
Table 3.
Types of interactions among the effects of two independent variables on the dependent variable.
From Table 4, it becomes apparent that between the years 2000 and 2010, the dominant land use conversions manifested in the transformation of grassland into cropland and forested areas, encompassing a substantial expanse of 2175.57 km2. Additional land types, primarily transformed into grassland, accounted for a collective area of 488.92 km2. Moreover, the conversion areas of cropland and forest were nearly equivalent, comprising 315.84 km2 and 325.31 km2, respectively. A fraction of cropland underwent conversion into forest and grassland, while the principal transformations for forest regions involved their metamorphosis into cropland and grassland. Waterbodies and built-up land, in contrast, presented relatively minor conversion areas, measuring 38.66 km2 and 9.76 km2, respectively. Overall, during this period, a discernible shift of ecological land towards cropland was observed, aligning with the historical pattern of extensive land cultivation undertaken to address food security concerns in diverse regions throughout China.
Table 4.
Land use transfer matrix in northwest Yunnan from 2000 to 2020.
During the temporal span encompassing 2010 to 2020, forest areas underwent an outward transfer, encompassing an expansive region measuring 797.71 km2. Within this expanse, a portion of 136.18 km2 underwent conversion into cropland, while a significant area of 591.81 km2 underwent a transformation into grassland. Notably, grassland, as the second most active land type, presented a major shift to woodland of 588.79 km2, which is a conversion representing ecological land use. Furthermore, during this period, cropland also exhibited considerable activity, with a substantial transfer of 303.04 km2; a fraction of this cropland underwent conversion into forested areas, while most of it was transitioned into built-up land.
In summary, during the scrutinized timeframe, from 2000 to 2010, the ecological land with the most change was grassland, which mainly shifted to cropland, while during the period of 2010–2020, the ecological land types with the most active changes were woodland and grassland, which switched to each other, and the non-ecological land type with the most active changes was cropland, which, besides shifting to woodland, partly shifted to construction land. The area of cropland that shifted to construction land (51.99 km2) was larger than the area of ecological land that shifted to construction land (32.46 km2), indicating that most of the land used for construction during this period originated from cultivated land. However, with the implementation of many environmental protection policies, such as the state’s red line for basic farmland protection, the red line for ecological protection, and the beginning of the development of town boundaries, the total area of ecological land was brought under control.
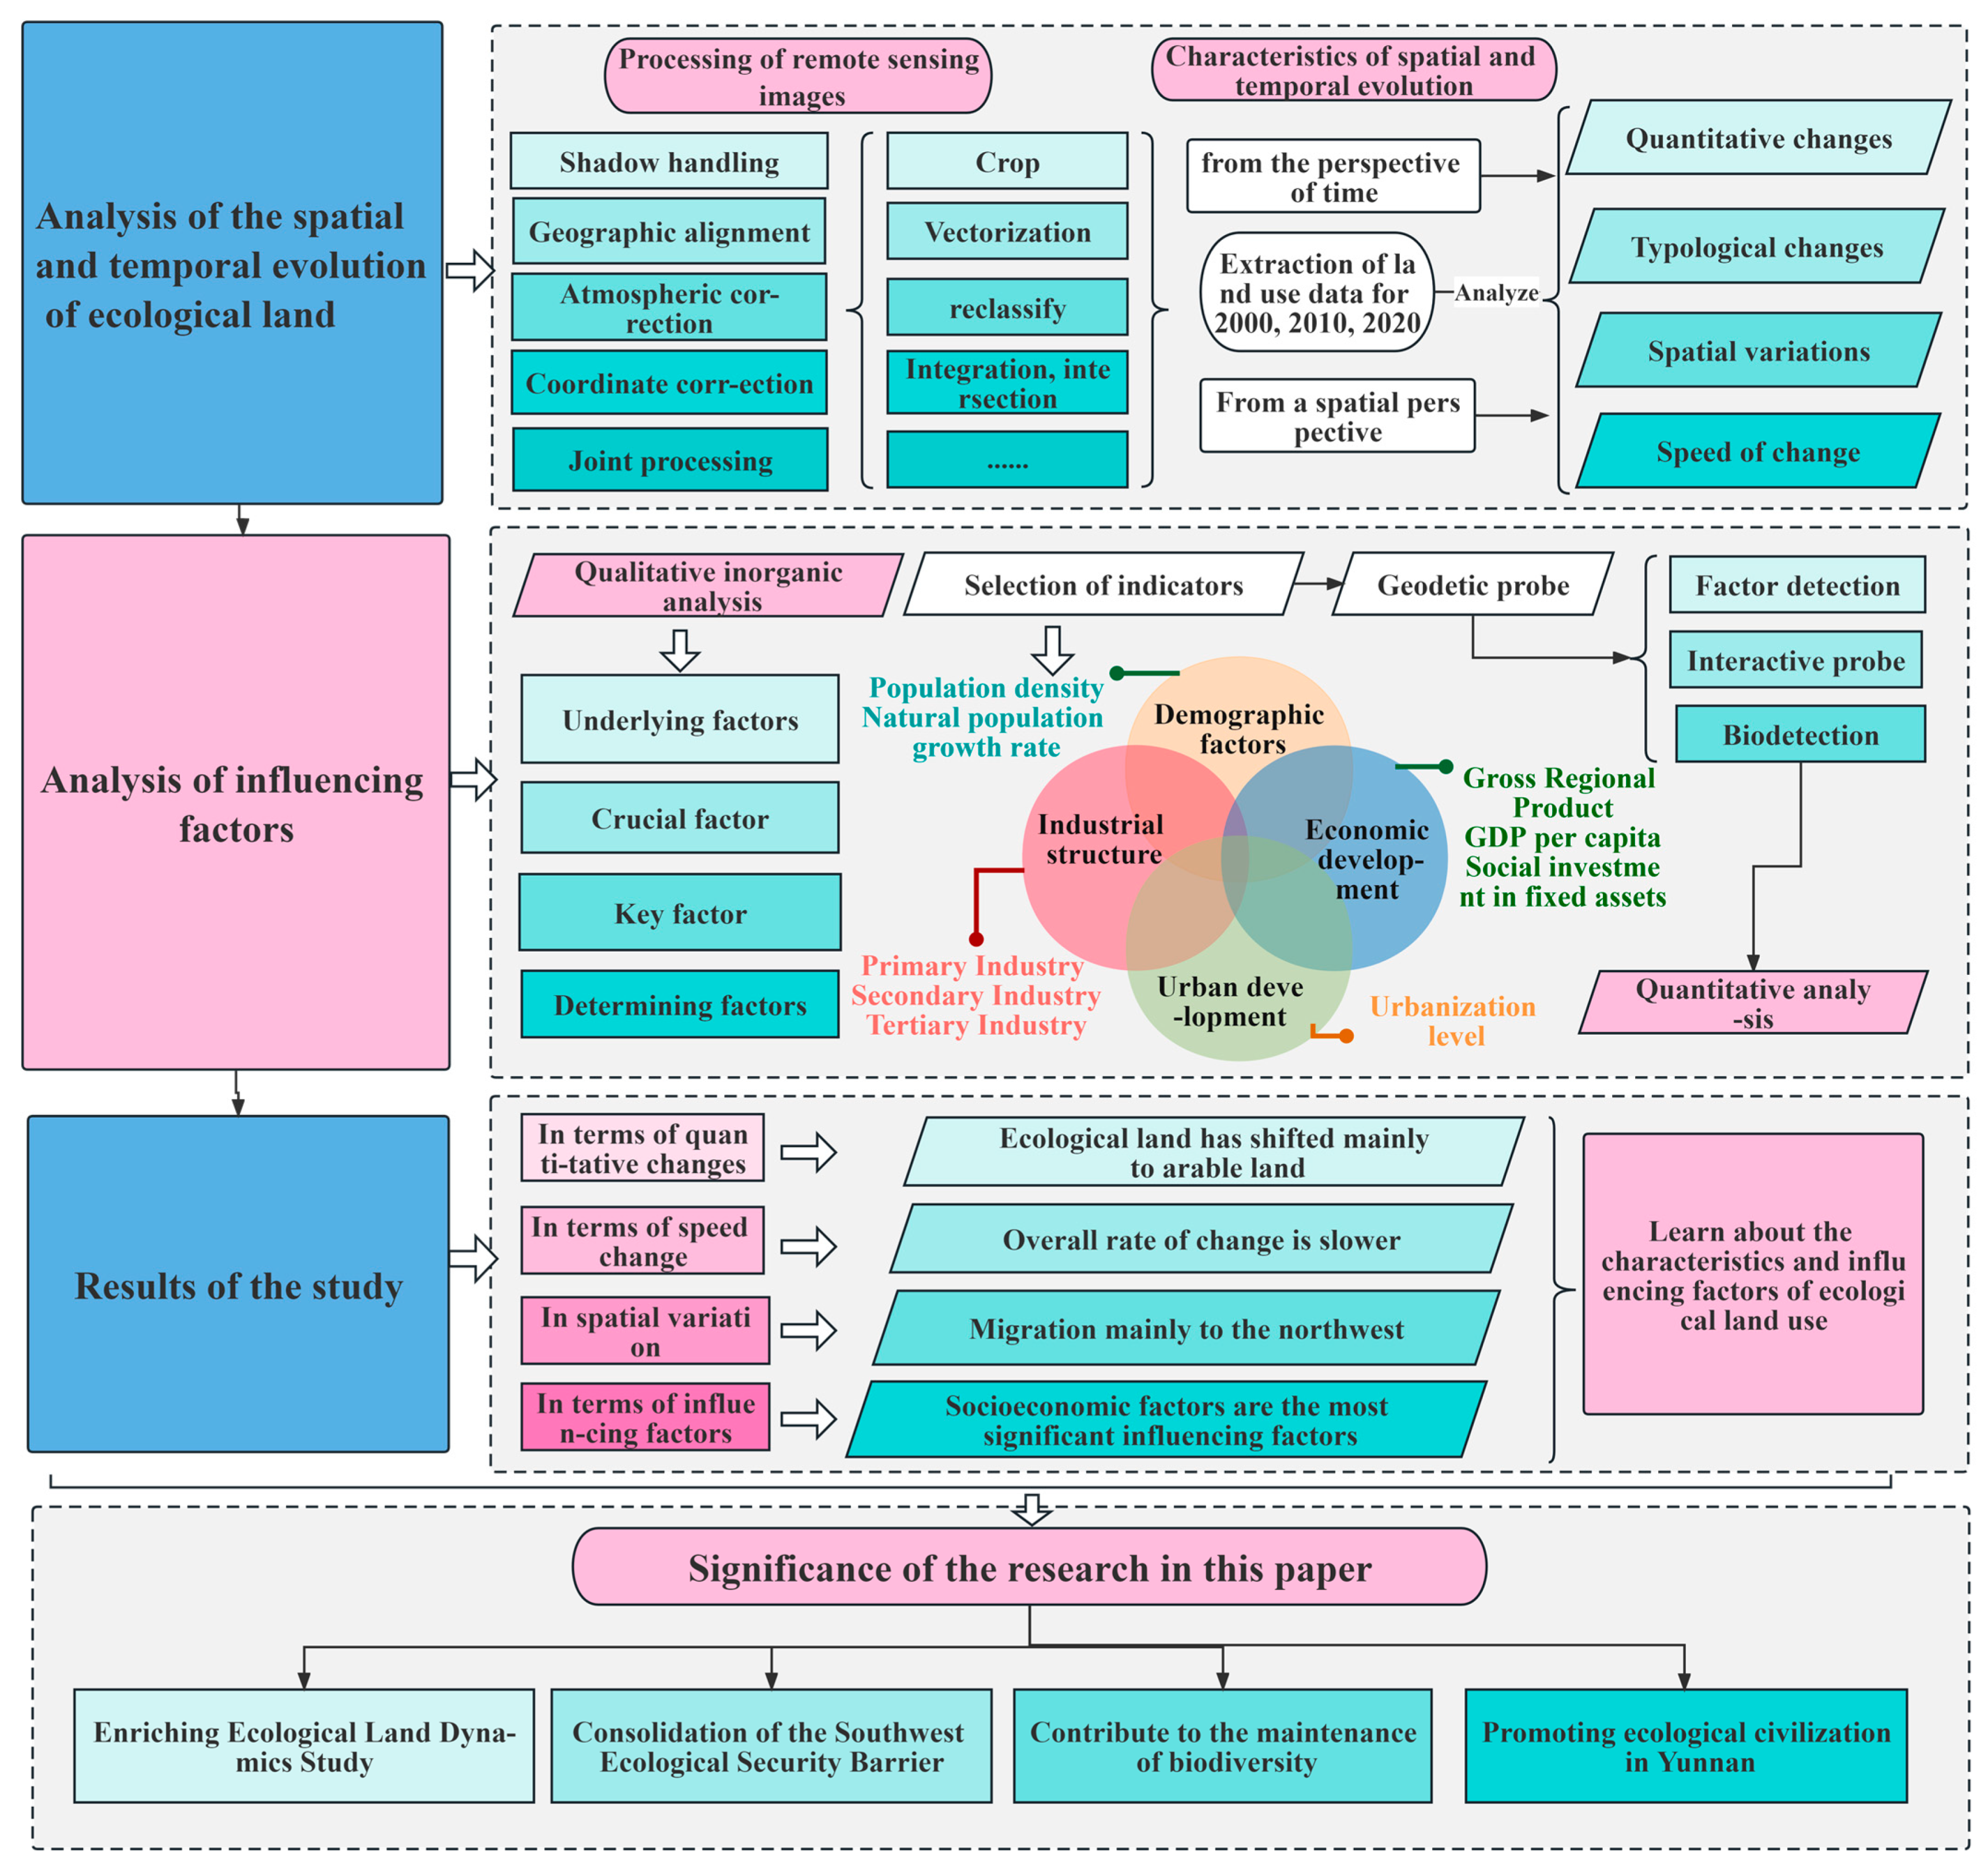
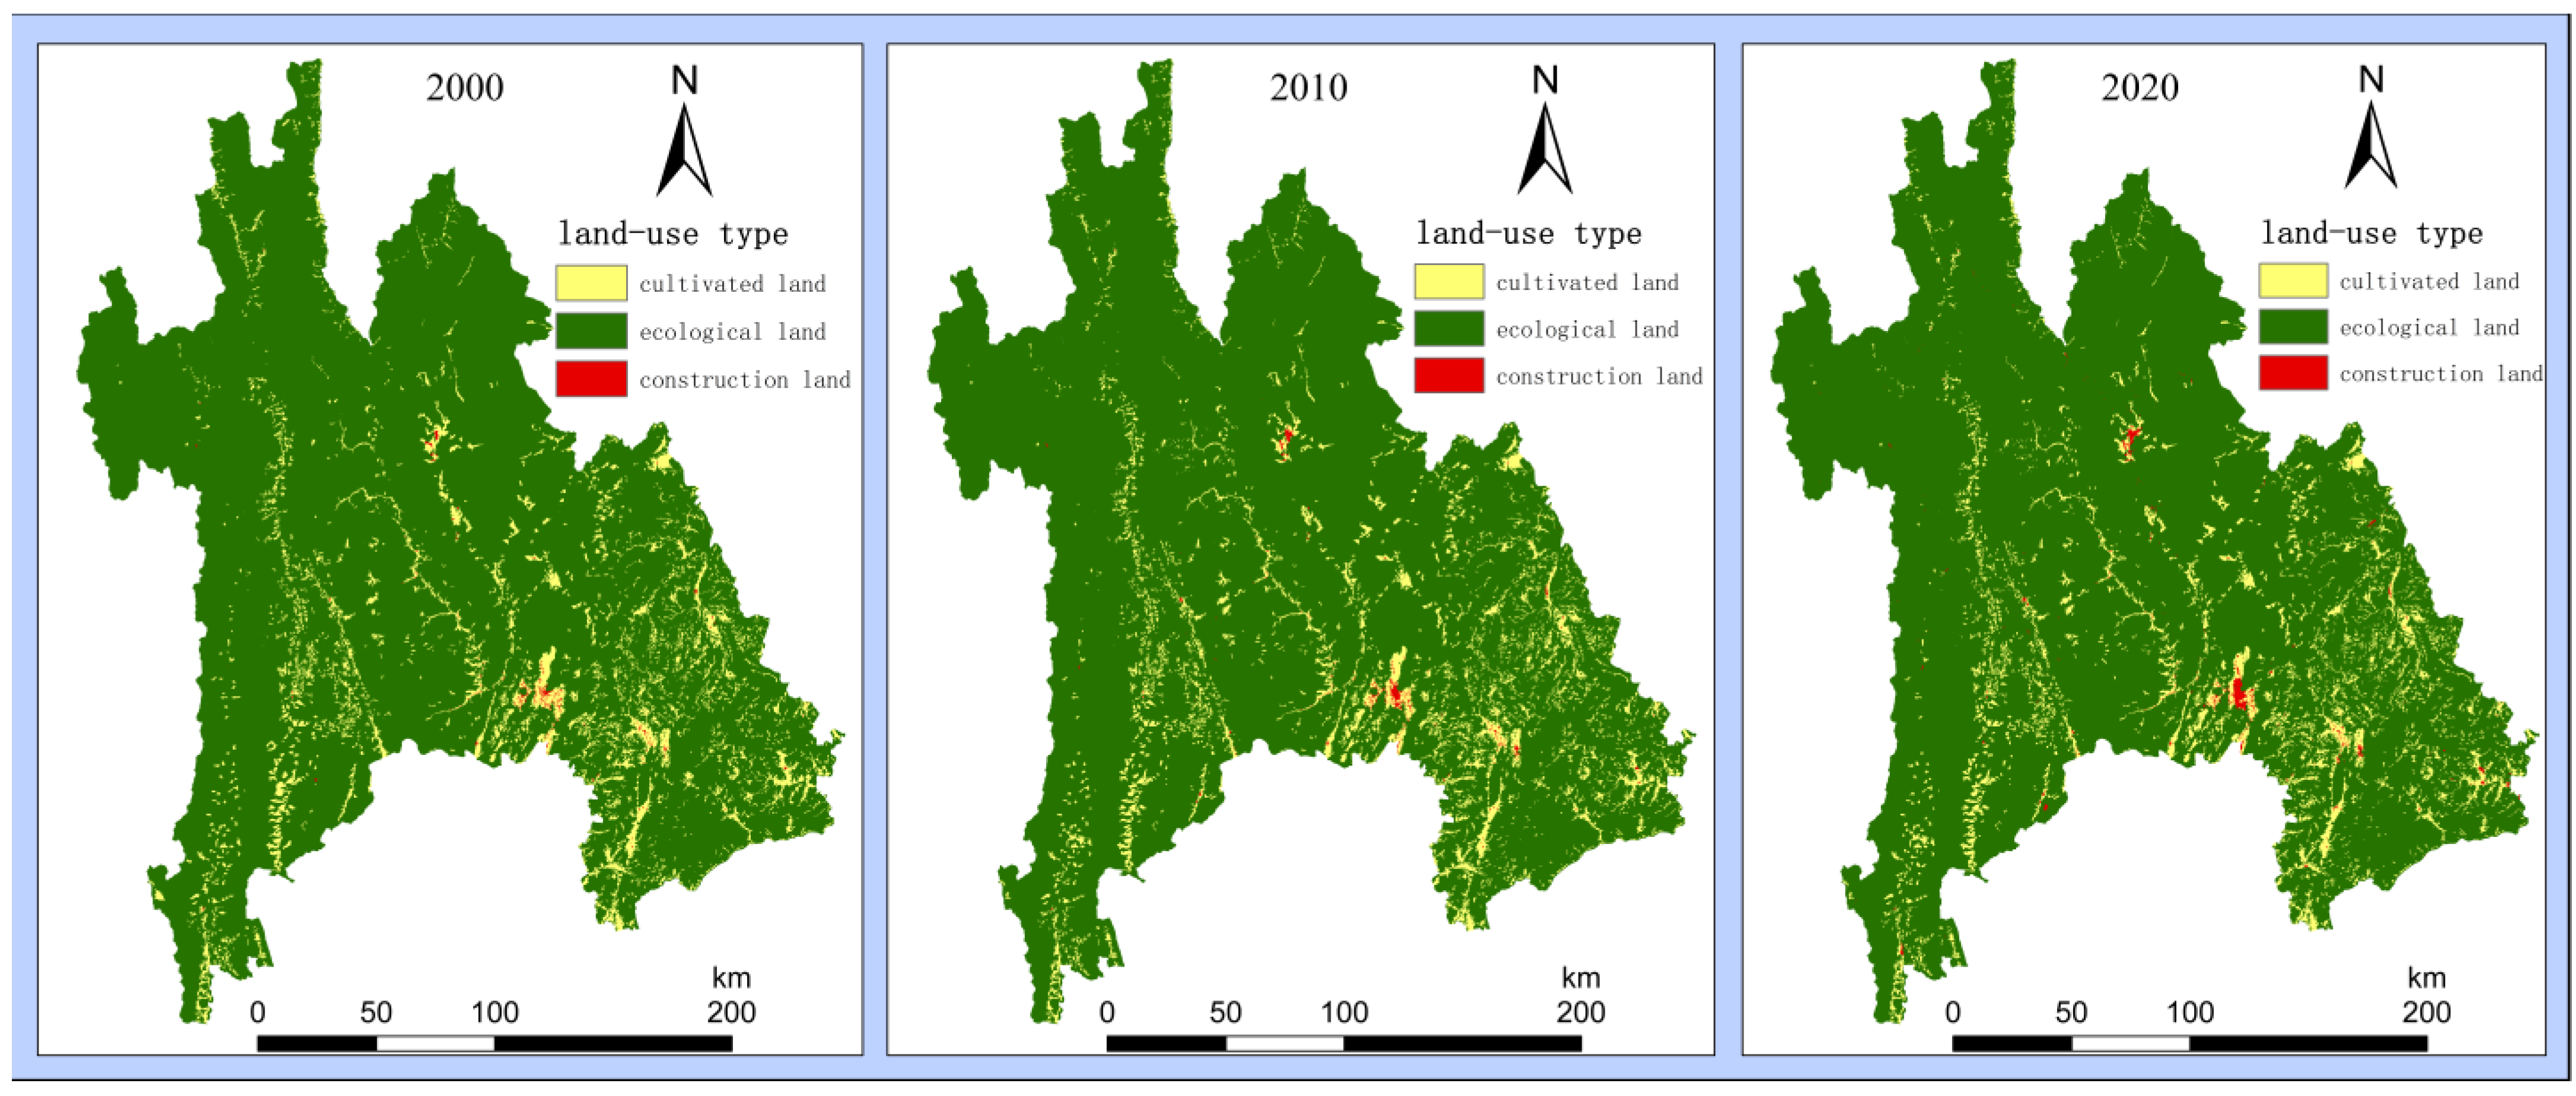
In the following, Figure 2 unveils the metamorphoses in land utilization spanning the intervals of 2000–2010 and 2010–2020. These visual representations elucidate the flux of diverse land categories, wherein the breadth of the vividly hued regions mirrors the magnitude of the alterations in land utilization.
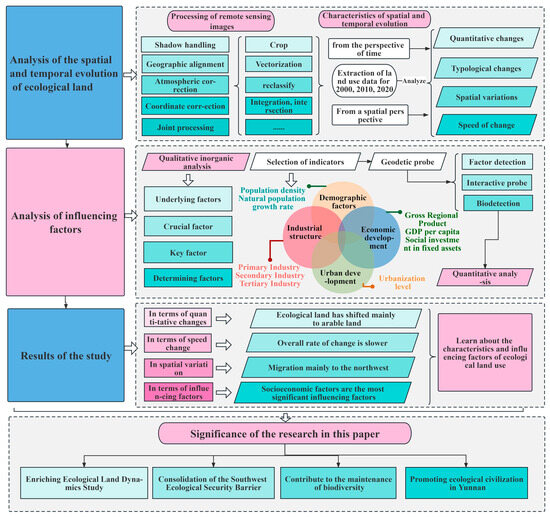
Figure 2.
Technical frameworks of the study.
3.2. Rate of Ecological Land Change
The ecological health of land use change and its correlation with human activities in the northwest Yunnan region is commonly assessed using the comprehensive dynamic degree index and various individual indices. The progressive patterns characterizing the transformation of land use in this region, spanning from 2000 to 2020, are succinctly delineated in the tabular representation provided in Table 4 below.
Regarding the yearly fluctuations in specific land use categories between 2000 and 2010, it is noteworthy that built-up land exhibited the most robust average annual growth rate, amounting to an impressive 3.89%. Forests, on the other hand, experienced a minor growth rate of 0.14%. Cropland, grassland, waterbodies, and other land types saw average annual reductions of 0.25%, 0.03%, 0.37%, and 2.40%, respectively. Moving forward to the period spanning from 2010 to 2020, built-up land and waterbodies displayed more active performance, with individual dynamics of 6.14% and 1.5%, respectively. In contrast, the remaining land types exhibited individual dynamics below 0.1%, indicating relative stability within these classifications throughout the entire study duration.
Drawing upon the data elucidated in Table 5, it is discernible that the cumulative land use transformation experienced a nominal 0.1% alteration from 2000 to 2010, subsequently dwindling marginally to 0.03% from 2010 to 2020. The latter interval showcased a reduced rate of alteration in comparison to its predecessor, thereby implying a heightened degree of land use modification during the earlier 2000–2010 timeframe, characterized by a relatively accelerated pace of transformation. Generally, the land use alterations observed within northwest Yunnan during the study period remained relatively stable.
Table 5.
Dynamic trends of land use changes in northwest Yunnan, 2000–2020.
As can be seen from Table 4 and Table 5, Figure 3 and Figure 4, in the period of 2000–2010, ecological land mainly shifted to arable land; in particular, with grassland shifting to cropland being the largest area, and the comprehensive land use motivation was larger, while in the period of 2010–2020, the performance was characterized by the conversion of ecological land and arable land to construction land, followed by the conversion of ecological land and arable land to each other. The most active was construction land, whose individual land use dynamic attitude was as high as 6.14%, mainly due to the fact that during this period, arable land was converted to construction land in large quantities, which made the area of construction land increase significantly. However, due to the mutual conversion between arable land and ecological land, the increase and decrease offset each other, so the comprehensive motivation in this period was lower, at only 0.03%, and the overall land use change was slow.
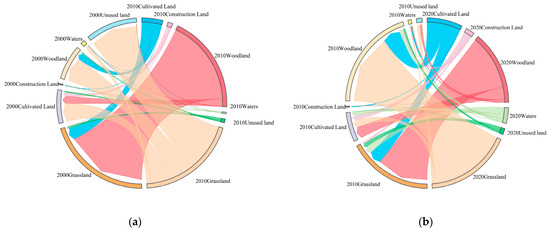
Figure 3.
Dazzle map of land use changes in northwest Yunnan from 2000 to 2020. Note: (a,b) indicates the serial number of the picture.
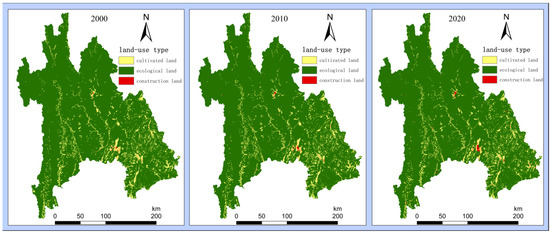
Figure 4.
Schematic of land use changes in northwest Yunnan, 2010–2020.
3.3. Spatial Changes in Ecological Land Use
The gravitational-center migration model served as a valuable tool for delving into the intricate dynamics of land use and land cover transformations, encapsulating both the temporal and spatial dimensions. This model investigated the directional and spatial displacement of the center of gravity for various land use types in relation to the natural characteristics of the region. By analyzing the shift in the center of gravity, it provided insights into the overall trend of land use changes within the region.
What does the term “ecological center of gravity” entail? Gravity, as the universal force that governs all objects on Earth, establishes gravitational force, while the center of gravity represents its focal point in a physical context. Gravity, being a distinctive force, adheres to the triad of force elements, namely magnitude, direction, and point of application. Similarly, the ecological center of gravity undergoes transformations commensurate with the intensity and direction of human activities. In regions characterized by a high population density, well-developed transportation networks, and rapid economic progress, it signifies a dominance of built-up areas and frequent human engagements. Consequently, the ecological center of gravity is unlikely to reside in such locations. Conversely, regarding regions where robust ecological protection measures are in place, characterized predominantly by expansive forests, verdant grasslands, pristine bodies of water, and vast tracts of untapped land, coupled with a minimal human footprint, it is highly probable that the ecological center of gravity would converge within such locales. The magnitude and trajectory of the ecological center of gravity’s migration serve as a reliable indicator of the inherent fluctuations in land use patterns within the northwestern region of Yunnan province. This invaluable insight facilitates a comprehensive exploration of the spatial distribution characteristics of ecological lands in the aforementioned region [52,53,54].
Based on the findings presented in Table 6, the relocation of the gravitational center of ecological land from 2000 to 2010 demonstrated a relatively minor shift. Nonetheless, a noticeable pattern emerged, indicating migration predominantly towards the southeast, spanning a distance of 3739.08 m over the course of a decade. Throughout this period, the concentration of construction land primarily resided in the central region, subsequently expanding towards the northwest and southwest, encroaching upon ecological land. Simultaneously, the southeastern region witnessed an augmentation in forested land area, thereby causing a shift in the ecological land’s center of gravity towards the southeast. Conversely, from 2010 to 2020, there was a noteworthy relocation of the center of gravity towards the northwest, characterized by a significant migration distance of 48,657.35 m. From the viewpoint of Figure 5, the migratory pattern observed during this timeframe exhibited more pronounced characteristics. Influenced by the radiation effect emanating from neighboring regions, the rapid surge in tourism development within the southeastern region and the escalating demand for urban expansion exerted immense pressure on the utilization of ecological land. Meanwhile, the northwestern region, characterized by its high mountain canyon terrain and pristine ecological environment, emerged as a sanctuary. Consequently, the center of gravity for ecological land utilization underwent a northwestward migration during this period.
Table 6.
Changes in ecological land’s center of gravity, 2000–2020.
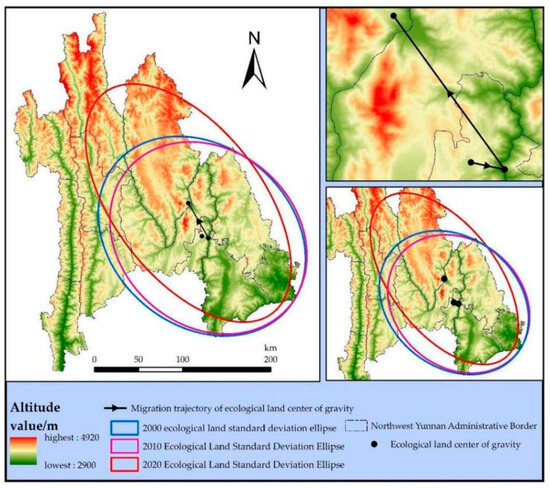
Figure 5.
Migration of ecological land’s center of gravity in northwest Yunnan, 2000–2020.
Upon examining Table 7, it is evident that the major axis of ecological land displayed a northwest–southeast orientation. Initially, the length of the major axis demonstrated a growth trend, which was subsequently followed by a decrease. Conversely, the length of the minor axis showed an initial increase, after which it remained relatively constant. Notably, significant disparities arose in the changes between the major and minor axes, with the minor axis presenting an inverse pattern. This observation indicated an increase in the directional variation of the spatial distribution of ecological land. Additionally, the standard deviation of the elliptical perimeter and the ecological land area initially decreased before undergoing an upward trajectory, signifying an overall upward trend. This implied an expansion in the extent and coverage area of ecological land, predominantly moving towards the northwest and displaying a tendency towards dispersion.
Table 7.
Parameters of the standard deviation ellipse of ecological land.
The comprehensive Table 6 and Table 7 show that the changes in the long and short axes of the standard deviation ellipse of ecological land were consistent with the migration direction of the ecological center of gravity, and human activities were the most important factor leading to these changes. If the intensity of human activities in a certain region were lower, the center of gravity of ecological land would be close to the region with a high probability, and the long axis of the corresponding standard deviation ellipse of ecological land would be extended along with the direction of the center of gravity of ecological land.
3.4. Analysis of Changes in Biological Abundance Indices
The index of biological abundance (IBR) is used to evaluate the abundance of biodiversity in a region. If the biological abundance index of a region is higher, then the degree of biodiversity is higher, and vice versa [54,55,56]. In this paper, the calculation model for the biological abundance index utilized the standard of “Technical Specification for Evaluation of Ecological Environment Condition (Trial) HJ/T192-2006” issued by the former State Environmental Protection Administration (SEPA), that is:
In the given context, IBR symbolizes the indicator of biological abundance, while Abio denotes the standardized indicator of biological abundance. Amax corresponds to the utmost value of the indicator of biological abundance prior to standardization, whereas Amin signifies the minimum value of the indicator of biological abundance prior to standardization. Lastly, IBRC represents the indicator of biological abundance following the process of normalization.
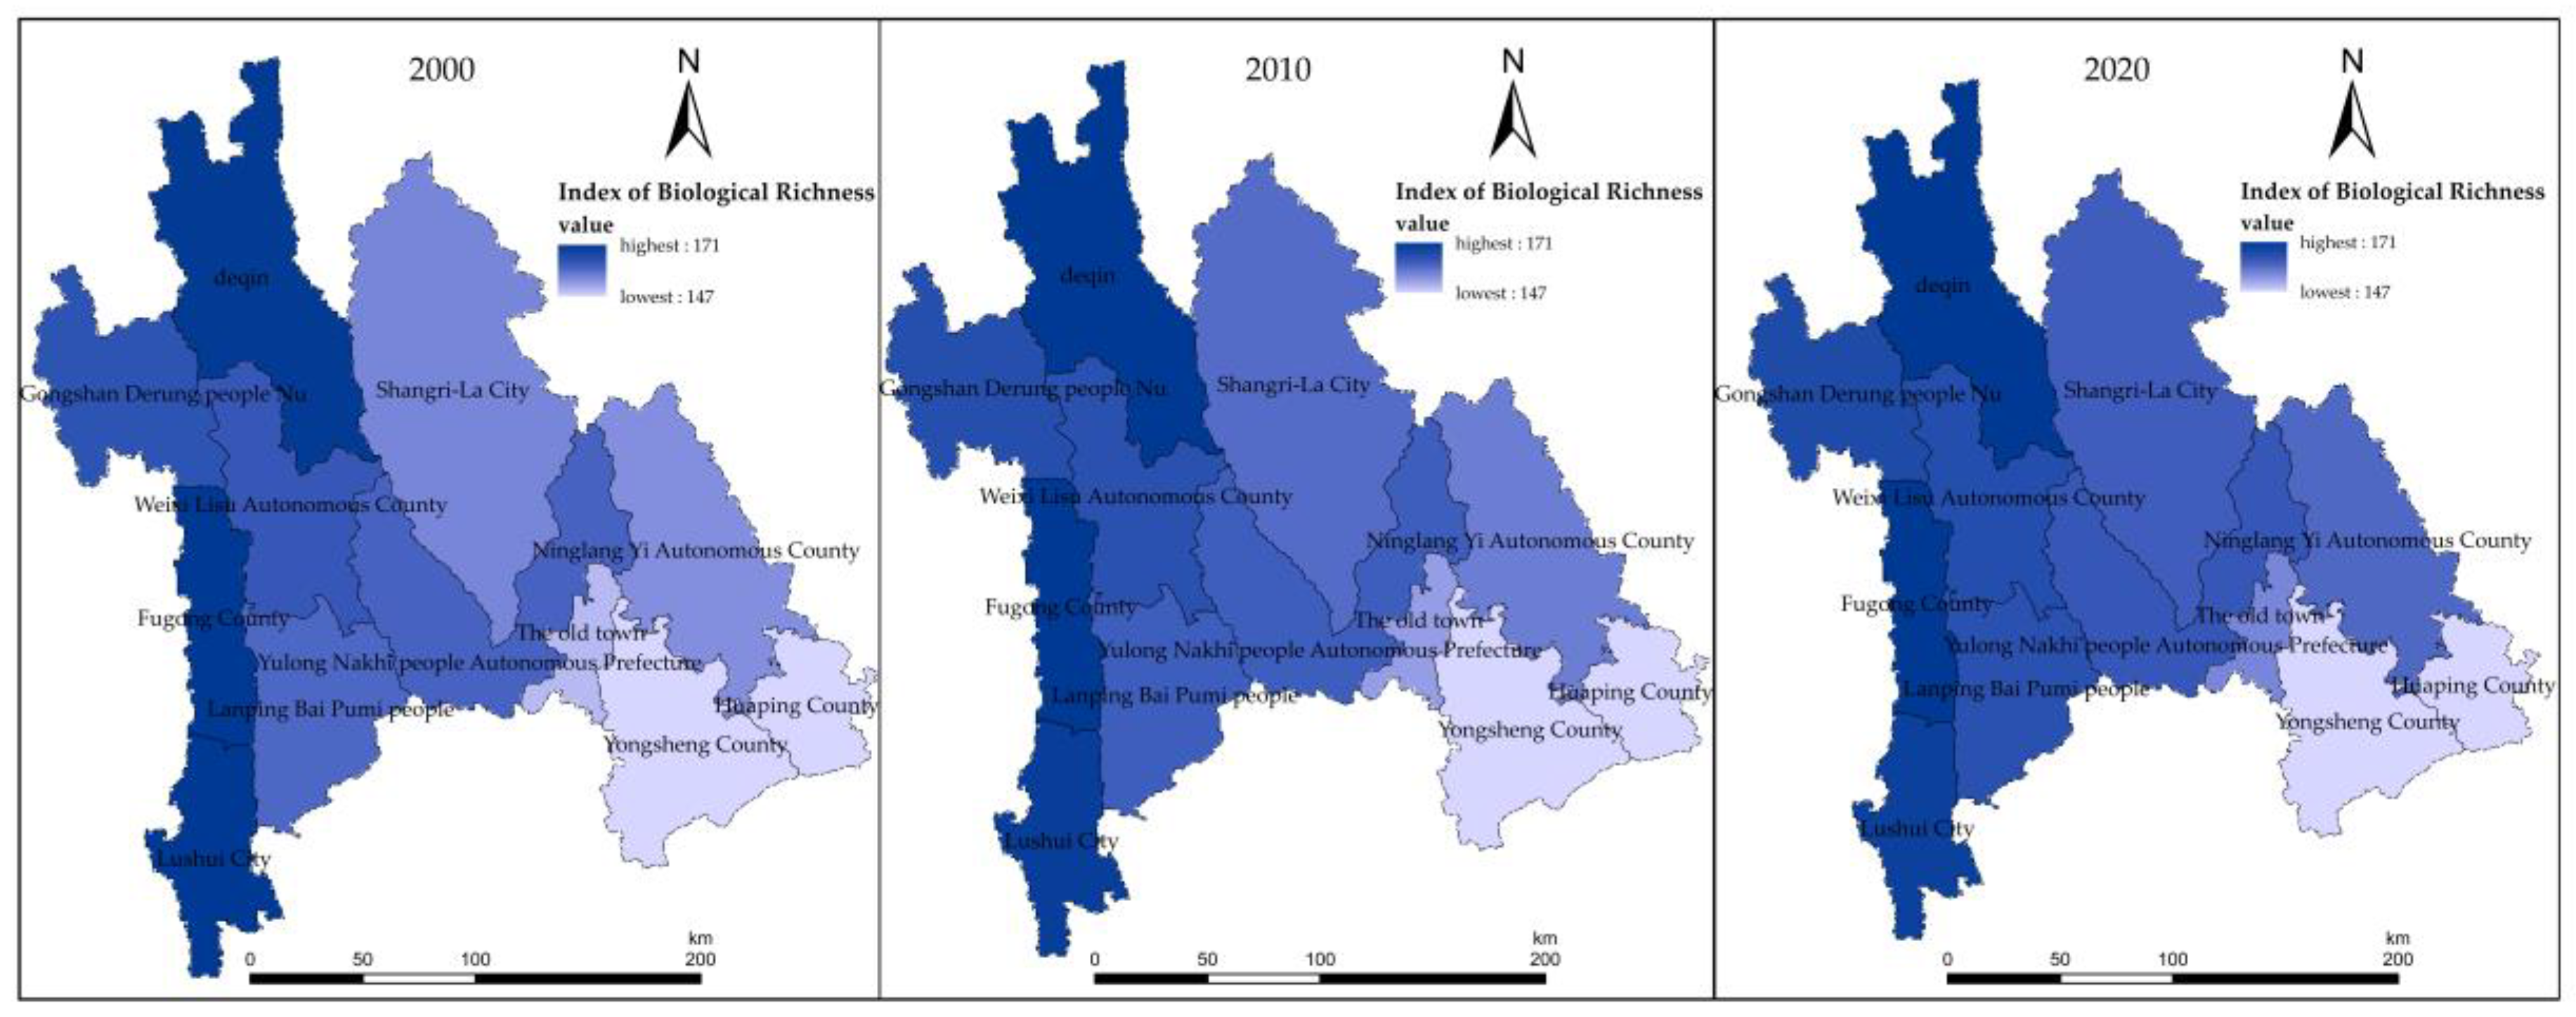
As shown in Table 8. as a cohesive entity, the bioabundance index of northwest Yunnan exhibited a generally upward trajectory over the past two decades, demonstrating a distinct pattern of being higher in the northwest and lower in the southeast. This spatial distribution aligned harmoniously with the topography of northwest Yunnan. The western and northwestern regions of northwest Yunnan predominantly consist of alpine valleys, where human impact is minimal. These areas boast a landscape primarily characterized by forests, grasslands, and rivers. Given that forests and grasslands carried significant weight in the computation of the bioabundance index, it followed that they contributed to a higher bioabundance index in these regions. Conversely, the southeastern part of the region is predominantly occupied by towering mountains and hills, featuring relatively level terrain and a more developed economy. Construction land predominates in this area, but its contribution to the bioabundance index was smaller. Consequently, the bioabundance index in this region tended to be lower.
Table 8.
Biological abundance index for northwest Yunnan, 2000–2020.
Combining Table 8 and Figure 6 to analyze, within the local context, notable variations in the biological abundance index emerged over the past two decades. Specifically, Huaping and Yongsheng Counties experienced a discernible decline, with their respective rates of decrease standing at 13.77% and 35.47%. These declines exerted a downward influence on the overall biological abundance of the region. Conversely, Deqin County, Shangri-La City, Wisi Lisu Autonomous County, and Lamping Bai Pumi Autonomous County all exhibited an upward trend in the biological abundance index. Among them, Deqin County demonstrated the most pronounced increase in this regard. The bioabundance index value serves as a direct reflection of the ecological state of a region, and the upward trajectory observed in the bioabundance index of northwest Yunnan over the past two decades signified an overall improvement in the ecological condition of the region.
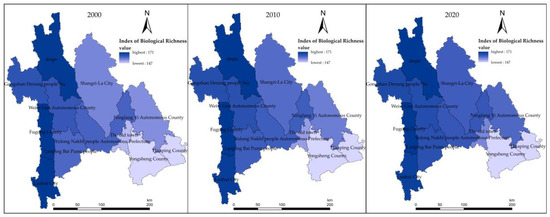
Figure 6.
Biological abundance index for northwest Yunnan, 2000–2020.
3.5. Analysis of the Factors Influencing the Changes in Ecological Land Use
The dynamics of land use types are influenced by a multitude of factors, which can be classified into two main categories: natural and socioeconomic factors. Natural factors exert a pivotal influence on the trajectory and progression of land use patterns, characterized by stability and long-lasting repercussions. Conversely, socioeconomic factors possess greater adaptability and dynamism compared with their natural counterparts, emerging as the dominant catalysts behind changes in land use types within relatively compressed timeframes.
3.5.1. Qualitative Inorganic Analysis
(1) Fundamental factor: natural conditions.
In localized regions, the natural climate may not display substantial fluctuations, yet variations in the topography and slope can be observed across different regions. The presence of flat terrain holds particular significance when choosing suitable sites for construction and agricultural land use. Flat terrain offers the advantage of reducing the time, effort, and financial resources required for development. Consequently, within the realm of land use transformations, one can discern an expansion in the extent of developed and cultivated land in regions distinguished by flat terrain, such as plateau surfaces, expansive basins, and alluvial plains nestled at the foothills of mountains.
(2) Crucial factor: residents’ awareness of environmental protection.
Fundamentally, whether it revolves around economic progress or the growth of the populace, the consciousness of the public with regard to environmental stewardship assumes paramount significance. Only when individuals possess a conscientious understanding of environmental matters can they refrain from encroaching upon ecological boundaries. Without such environmental awareness, the risk of ecological degradation arises, potentially resulting in the long-term diminishment of the ecological landscape. It is only through the voluntary engagement of all individuals in safeguarding the ecological milieu and nurturing the harmonious coalescence of humanity and nature that the ecological panorama can persist in fulfilling its crucial role in sustaining human productivity.
(3) Vital factor: the orientation of policies on development.
The government assumes a central role in formulating policies and regulations that exert a direct influence on regional land utilization, operating from two distinct perspectives. Firstly, policy guidance directly impacts the structural utilization of land, serving as the most immediate and pervasive impetus for the metamorphosis of land use [32]. Dominant policies, such as the “Preserving 1.8 billion Mu of Cultivated Land” initiative, have effectively safeguarded the quantity of arable land. However, concerns have arisen regarding the quality of compensatory measures employed when balancing the occupation of cultivated land with construction land, as the source of compensation often lies in ecological land. Numerous policies wield significant sway over people’s mindsets and, consequently, facilitate the desired transitions in land use.
Furthermore, within the realm of rapidly burgeoning metropolises or regions, heightened emphasis is placed on the advancement of and infusion of resources into infrastructure. This encompasses the establishment of expressways, railways, educational institutions, residential complexes, industrial plants, and other indispensable amenities. The realization of these novel edifices hinges upon the availability of land. As urban land utilization nears its saturation point, the only viable recourse lies in the development and conversion of ecological land for construction endeavors. From nationwide macro-regulations to localized policies, the influence of policies on land utilization should not be underestimated. Policies assume a direct role in shaping the structure and methodology of land utilization, and their ramifications often extend over a substantial duration.
(4) Determining factor: socioeconomic progress.
In accordance with the National Statistical Yearbook, the collective populace of northwest Yunnan amounted to 2.1853 million individuals in 2010, with 564,400 residing within urban areas and 1.6209 million in rural regions. As of the end of 2020, the overall population in northwest Yunnan reached 2.5704 million, with 800,400 individuals dwelling in urban areas and 1.7696 million in rural regions. Throughout the preceding decade, the total population in northwest Yunnan experienced a growth of 401,400, with the urban populace expanding by 236,000 and the rural populace increasing by 148,700. During this study period, the regional gross domestic product (GDP) of northwest Yunnan soared from CNY 3.043 billion in 2000 to CNY 99.042 billion in 2020. The per capita GDP exhibited a consistent upward trajectory, driven by the continuous refinement of the tertiary sector’s structure and the overall enhancement of the economic framework. A multitude of economic indicators witnessed significant increases, parallel to an accelerated pace of urbanization. Consequently, this inevitability engendered the conversion of ecological land into construction land and transportation land, as well as the need for additional land to bolster agricultural production.
3.5.2. Quantitative Analysis
(1) Selection of the indicators of the impact factors.
Taking into account the distinctive natural environment of northeast Yunnan, alongside socioeconomic factors and the availability of data, we identified the change in biodiversity (Y) as the dependent variable. Furthermore, we chose the information in Table 9 as the independent variables that exerted an influence on this transformation in northeast Yunnan.
Table 9.
Indicator selection of factors influencing ecological land use.
Considering that natural factors exhibit minimal annual variation and do not have a significant impact on biodiversity, this study excluded them from the quantitative analysis of the influencing factors. Instead, the focus was primarily directed toward socioeconomic factors, which served as the primary impetus driving short-term changes in land use. The rationale behind selecting the nine indicators listed in Table 9 that were adopted in this study was as follows: First and foremost, the size of the population in a region directly influences its development, making population density and the natural population growth rate compelling indicators within the demographic factors. Beyond population, economic development and the industrial structure within a region play pivotal roles, exerting significant influence on regional land use patterns. Therefore, this study selected the following indicators to assess economic development: gross regional product (GRP), GRP per capita, and investment in fixed assets. Furthermore, the primary industry, secondary industry, tertiary industry, and tertiary industry’s contribution to the GDP, along with the composition of the GDP, were selected to represent the industrial structure. Additionally, to account for the impact of urban development on the arrangement, quantity, and area of land use, the rate of urbanization was included as a noteworthy indicator.
3.5.3. Analysis of the Results of Detection
(1) Single factor detection analysis.
Table 10 showcases the outcomes of factor detection, revealing the values of q and p. These values range from 0 to 1, denoting the explicative potency and significance, respectively. When q is closer to 1, it indicates the stronger influence of the independent variable X on the dependent variable Y. Conversely, when q is lower, the influence is weaker. For p, a smaller value signifies the higher reliability of the effect, implying that a particular independent variable X has a significant impact on the dependent variable Y.
Table 10.
Geodetector single-factor test results.
The findings of factor detection unveiled the comprehensive impact of all nine factors on the dynamics of ecological land, collectively shaping its transformation. These factors included population density, gross regional product, and the degree of urbanization. Based on the extent of their explicative prowess, we could classify them into three levels: core influencing factors, intermediate influencing factors, and secondary influencing factors. The core influencing factors consisted of population density (X1), gross regional product (X4), and the rate of urbanization (X9); the intermediate influencing factors comprised the social investment in fixed assets (X2), the natural population growth rate (X3), the proportion of primary industry (X6), and the proportion of secondary industry (X7); and the secondary influencing factors consisted of per capita gross regional product (X5) and the proportion of the tertiary industry (X8).
Based on the data presented in Table 10, the rate of urbanization exhibited the highest q value, showcasing an impressive explanatory power of over 83%. Following closely were population density and gross regional product, exhibiting explanatory powers of 73% and 71%, respectively. Similarly, social investment in fixed assets, the natural growth rate of the population, and the proportion of the secondary industry showcased explanatory powers surpassing 60%. However, the remaining factors, such as per capita gross regional product, the proportion of primary industry, and the proportion of tertiary industry, fell short, with explanatory powers below 50%. It is important to note that the explanatory powers of the GDP per capita, primary industry ratio, and tertiary industry ratio proved insufficient, lacking robust insights. Furthermore, the p values associated with the rate of urbanization, population density, and GDP, which had higher explanatory powers, all fell below 0.05. This suggested a higher degree of reliability in affirming the significant impact of these factors on biodiversity.
(2) Multifactor interaction detection analysis.
Using the interaction detector, we assessed the influence of each influencing factor on ecological land use and their interactions. Table 11 presents the results of the interaction detection. Among the findings, the interaction X5∩X4 (0.8776) exhibited the highest degree of influence, followed by X4∩X3 (0.8518), X7∩X4 (0.7962), X9∩X4 (0.6089), and X4∩X1 (0.6047). The residual factor interactions, in terms of explaining the dynamics of ecological land changes, exhibited an explanatory power below 0.5, indicating a comparable impact to that of the individual factors. Moreover, these interactions presented a non-linear growth. Notably, the interactions involving population density, gross regional product, and the proportion of primary industry tended to exhibit a greater degree of influence. This underscored the pivotal role of population growth and regional economic advancement in shaping the spatial allocation of ecological land within the region.
Table 11.
Geodetector multifactor interaction results.
(3) Analysis of ecological detection.
Table 12 unveils remarkable differentiations in the spatial and temporal changes in ecological land related to the regional GDP, proportion of secondary industry, and rate of urbanization. These factors manifested significant disparities compared with the other factors, indicating that regional economic development and the level of urbanization played pivotal roles in shaping the spatial and temporal changes in ecological land. Conversely, factors such as population density, social investment in fixed assets, natural population growth rate, per capita GDP, and the proportion of tertiary industry exhibited comparable effects on the spatial alterations in ecological land use, with no discernible variations among them.
Table 12.
Geoprobe biological detection results.
4. Discussion
Drawing upon an examination of the spatiotemporal dynamics of ecological land changes in northwest Yunnan, this study provided a relatively comprehensive view of the evolutionary patterns of ecological land alterations within the region spanning from 2000 to 2020. These findings hold intrinsic importance in fortifying the ecological security frontline in southwest China and advancing the establishment of an ecological civilization in Yunnan Province and, indeed, throughout the entire nation. However, due to data limitations, this study refrained from undertaking a quantitative analysis of the factors influencing the spatiotemporal changes in ecological land use.
The analysis of the data in this study indicated that during the preceding decade, the ecological land in northwest Yunnan predominantly underwent transformations into cultivated land and construction land. It is strongly recommended to establish precise definitions and classifications for ecological land, placing utmost importance on implementing targeted measures to safeguard the fundamental tenets of ecological security. Additionally, a concerted emphasis should be placed on advancing the holistic governance of the ecological environment, remedying ecological deficiencies, and strengthening the foundation for sustainable development. The crux of the matter lies in establishing a symbiotic relationship between economic prosperity and ecological sustainability.
Throughout the course of the investigation, remarkable transformations unfolded within the key areas of ecological land in northwest Yunnan. In order to effectively guide the process of constructing an ecological civilization, it is prudent to establish stringent regulations across multifarious dimensions, guiding local regions towards cultivating an eco-economy firmly grounded in ecological resources. Furthermore, it is imperative to foster the advancement of green development, heighten the oversight and scrutiny of environmental preservation, and faithfully fulfill all obligations associated with safeguarding the ecological environment. By reinforcing the ecological security frontier, Yunnan’s pursuit of constructing an ecological civilization can forge ahead with resolute strides, propelling it into a new epoch as a vanguard in this realm.
5. Conclusions
This scholarly investigation conducted on the ecological land in northwest Yunnan provided profound insights for improving the development of Yunnan Province as a vanguard in the overarching endeavor of constructing a national ecological civilization. This study delved into the spatiotemporal attributes characterizing the alterations in ecological land between 2000 and 2020, while simultaneously scrutinizing the influential factors behind these changes. The key findings are elucidated below.
(1) Regarding the area of numerical variations, between the years 2000 and 2020, a noteworthy transformation occurred, whereby approximately 2175.57 km2 of grassland underwent a conversion to cultivated land, while an additional 488.92 km2 of other land categories was transformed into grassland. Notably, from 2010 to 2020, the greatest change occurred in forested terrain, with 136.18 km2 converted to cropland, another 591.81 km2 converted to grassland, and 51.99 km2 of cropland converted to construction land.
(2) Upon examining the pace of transformation and focusing on the evolving patterns of distinct land utilization categories, it was unveiled that between 2000 and 2010, the expansion of construction land occurred at an average annual growth rate of 3.89%. Forest land followed, with a comparatively modest average annual growth rate of 0.14%. In the subsequent decade, from 2010 to 2020, construction land and waterbodies showed the most rapid alterations, demonstrating individual dynamic rates of 6.14% and 1.5%, respectively. This finding underscores the heightened dynamism observed within the realm of construction land throughout the study period, while the other land types maintained a relatively stable state. Concerning the comprehensive dynamics of land use, the annual rate of land use changes from 2000 to 2010 amounted to 0.1%, indicating a relatively gradual pace of change. However, from 2010 to 2020, the annual rate of land use change dwindled to a mere 0.03%, signifying the effectiveness of the construction of an ecological civilization during this specific period.
(3) In terms of spatial transformations, the focal point of ecological land underwent a migratory shift towards the southeast between 2000 and 2010, spanning an approximate distance of 3739 meters over the course of a decade. Subsequently, from 2010 to 2020, the center of gravity of ecological land experienced a notable migration towards the northwest, covering an impressive distance of 48,657 meters. This distinct migratory pattern was a remarkable characteristic of the geographical repositioning observed during this period. Concurrently, the biological abundance index in northwest Yunnan exhibited a high value in the northwest and a low value in the southeast, displaying an upward trend. This signified that the ecological environment in the northwest region of the province was in a favorable state, with well-preserved biodiversity.
(4) The dynamics of ecological land changes were predominantly driven by socioeconomic factors. Factors such as population growth, economic progress, and the resulting expansion of production and residential areas exerted a profound impact on the utilization of ecological land. Furthermore, policies, regulations, and the environmental awareness of the population had a crucial impact on biodiversity change.
Author Contributions
Conceptualization, X.W., S.Y., R.Y. and Z.Y.; methodology, X.W., S.Y. and R.Y.; software, X.W.; validation, S.Y., R.Y. and Z.Y.; formal analysis, X.W.; investigation, X.W.; resources, S.Y., R.Y. and Z.Y.; data curation, S.Y. and R.Y.; writing—original draft preparation, X.W., S.Y., R.Y. and Z.Y.; writing—review and editing, X.W., S.Y., R.Y. and Z.Y.; visualization, X.W.; supervision, R.Y. and Z.Y.; project administration, X.W. and Z.Y.; funding acquisition, X.W. and Z.Y. All authors have read and agreed to the published version of the manuscript.
Funding
This research was funded by the National Natural Science Foundation of China (grant No. 41261018) and the Yunnan University of Finance and Economics Graduate Student Innovation Fund Program (grant No. 2023YUFEYC114).
Institutional Review Board Statement
Not applicable.
Data Availability Statement
The RS image data in the study were obtained from https://www.resdc.cn/ (accessed on 21 May 2023). The DEM data were obtained from http://www.gscloud.cn. (accessed on 23 March 2023). The county boundaries of Yunnan Province were obtained from https://yunnan.tianditu.gov.cn/MapResource (accessed on 9 August 2023). Economic and social statistics were taken from the website https://www.epsnet.com.cn/index.html#/Index. (accessed on 10 September 2023).
Conflicts of Interest
The authors declare no conflict of interest.
References
- Hu, X.R. Painting a New Picture Scroll of South of Colorful Clouds: An Overview of Yunnan’s Efforts to Become the Front-Runner in Ecological Civilization Construction. Yunnan Daily, 13 January 2021. [Google Scholar]
- Li, C.H. Historic Breakthrough in Province’s Ecological Civilization Construction Frontrunner Work. Yunnan Daily, 29 April 2021. [Google Scholar]
- Zhou, S.P. How does the general public understand ecological civilization?—An Interview with Zhou Hongchun, Researcher of Development Research Center of the State Council. Environ. Educ. 2020, 6, 20–25. [Google Scholar]
- Li, X.X.; Wang, Z.H. Three Dimensions of Understanding Xi Jinping’s Thought on Ecological Civilization. J. Jiangxi Univ. Financ. Econ. 2019, 3, 11–18. [Google Scholar]
- Tian, S. The reverse interpretation of “development”—Three options for understanding ecological civilization. Dialectics Nat. Newsl. 2018, 40, 134–140. [Google Scholar]
- Dong, Y.W.; Zhou, W.; Zhou, L.; Zhou, H. Research on Ecological Protection in Urbanized Areas—Taking Jiangsu Province and Nanjing as an Example. Urban Res. 1999, 6, 6–8. [Google Scholar]
- Yu, F.; Li, X.B.; Zhang, L.J.; Xu, W.H.; Fu, R.; Wang, H. Study of ecological land in China: Conception, classification, and spatial-temporal pattern. Acta Ecol. Sin. 2015, 35, 4931–4943. [Google Scholar]
- Zhang, H.Q.; Wang, L.X.; Jia, B.Q. A conception of ecological land use and its function classification in arid areas in Northwest China. Chin. J. Eco-Agric. 2004, 12, 10–13. [Google Scholar]
- Deng, H.B.; Chen, C.D.; Liu, X.; Wu, G. Conception and function classification of regional ecological land. Acta Ecologica. Sin. 2009, 29, 1519–1524. [Google Scholar]
- Long, H.L.; Liu, Y.Q.; Li, T.T.; Wang, J.; Liu, A.X. A Primary Study on Ecological Land Use Classification. Ecol. Environ. Sci. 2015, 24, 1–7. [Google Scholar]
- Fei, J.B.; Xia, J.G.; Hu, J.; Shu, X.Y.; Wu, X.; Li, J. Research progress of ecological space and ecological land in China. Chin. J. Eco-Agric. 2019, 27, 1626–1636. [Google Scholar]
- Jiang, H.T.; Niu, S. Spatiotemporal Evolution of Ecological Land in Inner Mongolia and Its Influencing Factors. Sci. Technol. Manag. Land Resour. 2021, 38, 39–53. [Google Scholar]
- Hofstetterg, M. Numerical modeling of concrete cracking. Cism Int. Cent. Mech. Sci. 2011, 76, 1087–1108. [Google Scholar]
- Zhang, Q.; Gao, M.; Yang, L.; Chen, C.L.; Sun, Y.; Wang, J.Z. Changes in the spatial structure of ecological land and ecosystem service values in nine key districts of Chongqing City over the past 25 years. Acta Ecol. Sin. 2017, 37, 566–575. [Google Scholar]
- An, G.Q. Spatio-Temporal Evolution and Conservation Zoning of Ecological Land in Shandong Province based on EKC & Lorenz Curve. China Land Sci. 2018, 32, 89–96. [Google Scholar]
- Guo, M.; Wang, S.J.; Yu, N. Ecological Land Fragmentation Evaluation and Dynamic Changes in Changbai Mountain Areas. Resour. Develop. Mark. 2020, 36, 14–22. [Google Scholar]
- Huang, M.Y.; Yue, W.Z.; Fang, B.; Feng, S.R. Scale response characteristics and geographic exploration mechanism of spatial differentiation of ecosystem service values in Dabie Mountain area, central China from 1970 to 2015. Acta Geogr. Sin. 2019, 74, 1904–1920. [Google Scholar]
- Crespo, C.J.; Danylo, O.; Fritz, S.; McCallum, I.; Obersteiner, M.; See, L.; Walsh, B. Economic development and forest cover: Evidence from satellite data. Sci. Rep. 2017, 7, 40678. [Google Scholar] [CrossRef]
- Ferketic, J.S.; Latimer, A.M.; Silander, J.A.J. Conservation justice in metropolitan Cape Town: A study at the Macassar Dunes Conservation Area. Biol. Conserv. 2017, 143, 1168–1174. [Google Scholar] [CrossRef]
- Tan, Y.Z.; Zhao, Y.; Cao, Y.; He, J. Research Progress on Regional Ecological Land Classification in China. China Land Sci. 2016, 30, 28–36. [Google Scholar]
- Guan, Q.C.; Hao, J.M.; Shi, X.J.; Gao, Y.; Wang, H.L.; Li, M. Study on the Changes of Ecological Land and Ecosystem Service Value in China. J. Natural Res. 2018, 33, 195–207. [Google Scholar]
- Lin, T.; Feng, Z.H.; Wu, D.F.; Yang, M.Z.; Wu, P.F. Spatial-temporal Changes and Multi-scenario Prediction of Ecological Land in Karst Area Based on FLUS Model. Bull. Soil Water Conserv. 2022, 42, 219–227. [Google Scholar]
- Xie, H.L. Analysis of Regionally Ecological Land Use and Its Influencing Factors Based on a Logistic Regression Model in the Beijing-Tianjin-Hebei Region, China. Resour. Sci. 2011, 33, 2063–2070. [Google Scholar]
- Yin, J.; Zi, B.F.; Yang, L.Y.; Chen, J.W. Spatial-temporal evolution and driving factors of ecological land use in Fu xian Lake basin. Bull. Soil Water Conserv. 2020, 40, 228–235. [Google Scholar]
- Li, Y.; Feng, Y.; Peng, F.; Chen, S.D. Pattern Evolvement of Ecological Land in Tianjin Based on Geodetector. Econ. Geogr. 2017, 7, 180–189. [Google Scholar]
- Qu, L.L.; Liu, Y.S.; Zhou, Y.; Li, Y.R. Spatio-temporal evolution of ecologically-sustainable land use in the Luoxiao mountains and responses of its ecosystem services: A case study of Jinggangshan City in Jiangxi Province. Acta Ecol. Sin. 2019, 39, 3468–3481. [Google Scholar]
- Li, T.; Jia, B.Q.; Liu, W.R.; Zhang, Q.M. Spatial pattern of ecological land stability analysis and influencing factor in Beijing-Tianjin-Hebei Region. Acta Ecol. Sin. 2022, 42, 9927–9944. [Google Scholar]
- Zhang, J.P.; Qiao, Q.; Liu, C.L.; Wang, H.H.; Zhuang, X. Ecological land use planning for Beijing City based on the minimum cumulative resistance model. Acta Ecol. Sin. 2017, 37, 6313–6321. [Google Scholar]
- Wang, X.R.; Pan, P.P.; Wang, X.X.; Wang, X.M. Simulation of landscape pattern for land use in Hebei province based on Geo-SOS-FLUS model. Jiangsu J. Agr. Sci. 2021, 37, 667–675. [Google Scholar]
- Tang, J.; Hu, X.J.; Wei, B.J.; Luo, Z.W.; Zhao, S.W.; Wang, Y.Z. Land Use Change Prediction and Hydrological Response Assessment of Watershed Based on FLUS Model. J. Yangtze River Sci. Res. Inst. 2022, 39, 63–69. [Google Scholar]
- Lin, T.; Yang, M.Z.; Wu, D.F.; Liu, F.; Yang, J.H.; Wang, Y.J. Spatial correlation and prediction of land use carbon storage based on the InVEST-PLUS model: A case study in Guangdong Province. China Environ. Sci. 2022, 42, 4827–4839. [Google Scholar]
- Jessica, P.; Ordens, C.M.; Barnett, S.; Djordjevic, S.; Chen, A.S. Small-scale land use change modeling using transient groundwater levels and salinities as driving factors-An example from a sub-catchment of Australia’s Murray-Darling Basin. Agric. Water Manag. 2023, 278, 108174. [Google Scholar]
- Willcock, S.; Phillips, O.L.; Platts, P.J.; Swetnam, R.D.; Balmford, A.; Burgess, N.D.; Ahrends, A.; Bayliss, J.; Doggart, N.; Doody, K.; et al. Land cover change and carbon emissions over 100 years in an African biodiversity hotspot. Glob. Chang. Biol. 2016, 22, 2787–2800. [Google Scholar] [CrossRef] [PubMed]
- Liu, Q.; Yang, Z.Y.; Chen, Y.Q.; Lei, J.R.; Chen, Z.Z.; Chen, X.H. Multi-scenario simulation of land use change and its eco-environmental effect in Hainan Island based on CA-Markov model. Ecol. Environ. Sci. 2021, 30, 1522–1531. [Google Scholar]
- Zhang, B.; Lei, G.P.; Zhou, H.; Wang, R.; Dong, B.W.; Zhang, X. Scenario Simulation of Land Use in Mining City Based on CLUE-SMode. Res. Soil Water Conserv. 2016, 23, 261–266. [Google Scholar]
- Li, C.; Wu, J. Land use transformation and eco-environmental effects based on production-living-ecological spatial synergy: Evidence from Shaanxi Province, China. Environ. Sci. Pollut. Res. 2022, 29, 41492–41504. [Google Scholar] [CrossRef] [PubMed]
- He, D.; Zhou, J.; Gao, W.; Guo, H.C.; Yu, S.X.; Liu, Y. An Integrated CA-Markov Model for Dynamic Simulation of Land Use Change in Lake Dianchi Watershed. Acta Sci. Nat. Univ. Pekin. 2014, 50, 1095–1105. [Google Scholar]
- Liu, J.H.; Zhang, Q.B.; Yang, D.; Yue, D.P.; Yu, Q.; Yang, L. Simulation of Ecological Land Transition in Baotou City Based on MCR-ANN-CA Model. Trans. Chin. Soc. Agric. Mach. 2019, 50, 187–194. [Google Scholar]
- Wu, D.; Li, H.; Ai, N.; Huang, T.; Gu, J.S. Predicting spatiotemporal changes in land use and habitat quality based on CA-Markov: A case study in central Ningxia, China. Chin. J. Eco-Agric. 2020, 28, 1969–1978. [Google Scholar]
- Liu, Y.W.; Liu, C.W.; He, Z.Y.; Zhou, X.; Han, B.H.; Hao, H.Z. Spatial-temporal evolution of ecological land and influence factors in Wuhan urban agglomeration based on geographically weighted regression model. Chin. J. Appl. Ecol. 2020, 31, 987–998. [Google Scholar]
- Zhang, X.R.; Li, A.N.; Nan, X.; Lei, G.B.; Wang, C.B. Multi-scenario simulation of land use change along China-Pakistan Economic Corridor through coupling FLUS model with SD model. J. Geo-Inf. Sci. 2020, 22, 2393–2409. [Google Scholar]
- Lai, Y.; Lin, S.T.; Huang, G.Q.; Chen, S.Z.; Chen, C.X. Spatial-temporal dynamics of ecosystem services value in a rapid urbanization process: A case study of Chao’An District, Chaozhou City. Ecol. Sci. 2023, 42, 18–28. [Google Scholar]
- Rong, B.L.; Li, D.; Xie, Y.X. On planning method of mesoscale and microscale ecological land. Acta Ecol. Sin. 2011, 31, 5351–5357. [Google Scholar]
- Wang, P.T.; Zhang, L.W.; Li, Y.J.; Jiao, L.; Wang, H.; Yan, J.P.; Lv, Y.H.; Fu, B.J. Spatio-temporal characteristics of the trade-off and synergy relationships among multiple ecosystem services in the Upper Reaches of Hanjiang River Basin. Acta Geogr. Sin. 2018, 33, 195–207. [Google Scholar]
- Zhang, M.X.; Zhou, Y.; Cao, J.J.; Chen, G.P.; Ye, Q.Q. Analysis of Spatial and Temporal Changes of Ecological Land Use in Wuhan City from 2000 to 2015. Chin. J. Agr. Resour. Reg. Plan. 2021, 42, 168–177. [Google Scholar]
- Wang, Z.Y.; Li, X.; Jiang, C.; Tang, Y.L.; Liao, J.J. Construction of ecological security pattern and urban growth control based on GIS—A case study of central district in Yueyang. Ecol. Sci. 2022, 41, 49–59. [Google Scholar]
- Su, W.Z.; Yang, G.H.; Zhen, F. Ecological Land Fr agmentation and Its Connectivity with Urbanization in the Yangtze River Delta. Acta Geo. Sin. 2007, 74, 1309–1317. [Google Scholar]
- Zhang, W.H.; Cai, L.P.; Lu, X. Spatio-temporal Evolution Pattern and Influencing Factors Analysis of Ecological Land in Shandong Province. Resour. Develop. Mark. 2019, 35, 794–799+844. [Google Scholar]
- Feng, Z.Y.; Shi, R.H. Spatio-temporal features and the association of ground-level PM2.5 concentration and its emission in China. J. Geo-Inf. Sci. 2021, 23, 1221–1230. [Google Scholar]
- Yan, G.; Zhang, H.; Zhang, Y. 5E teaching method in teaching the concept of center of gravity in secondary school physics. Phys. Teach. 2018, 39, 27–29. [Google Scholar]
- Madrigal, M.S.; Puga, C.R.J.; Bustinza, U.V.; Vilca, G.O. Ppatiotemporal Changes in Land Use and Ecosystem Service Valuse Under the Influence of Glacier Retreat in a High-Andean Environment. Front. Environ. Sci. 2022, 10, 941887. [Google Scholar] [CrossRef]
- Zhao, L.; Zhang, G.J.; Zhu, Y.M.; Zhang, P.T.; Xu, H. Land Multi-functional Transformation and Characteristic Analysis based on Land Use Transition: A Case Study of Tang County, Hebei Province. China Land Sci. 2017, 31, 1001–8158. [Google Scholar]
- Fu, S.J.; Wang, W.; Wan, B.C. Study on Normalized Coefficient of Hebei Provincial Biology Abundances and Vegetation Abundances Based on RS and GIS Data. Chin. J. Environ. Manag. 2014, 6, 1674–6252. [Google Scholar]
- Deng, Y.B.; Li, D.P.; Yi, M. RS-based study on the normalized coefficient of biological abundance in Hunan Province. Geospat. Infor. 2016, 14, 48–51+8. [Google Scholar]
- Guo, C.X.; Zhu, Y.Q.; Sun, W.; Song, J. Dataset of Biological Abundance Index of China in 1985 and 2005 at 1 km Resolution. J. Glob. Chang. Data Discov. 2017, 1, 60–65. [Google Scholar]
- Zhao, Z.Z.; Feng, J.D. Spatial-temporal evolution features of land use gravity center in Horqin sandy land during 1980-2016. Bull. Soil Water Conserv. 2019, 39, 256–260. [Google Scholar]
Disclaimer/Publisher’s Note: The statements, opinions and data contained in all publications are solely those of the individual author(s) and contributor(s), and not of MDPI and/or the editor(s). MDPI and/or the editor(s) disclaim responsibility for any injury to people or property resulting from any ideas, methods, instructions, or products referred to in the content. |


Disclaimer/Publisher’s Note: The statements, opinions and data contained in all publications are solely those of the individual author(s) and contributor(s) and not of MDPI and/or the editor(s). MDPI and/or the editor(s) disclaim responsibility for any injury to people or property resulting from any ideas, methods, instructions or products referred to in the content. |
© 2023 by the authors. Licensee MDPI, Basel, Switzerland. This article is an open access article distributed under the terms and conditions of the Creative Commons Attribution (CC BY) license (https://creativecommons.org/licenses/by/4.0/).