Article

Effects of Stand Structure of Artificial Shelter Forest on Understory Herb Diversity in Desert-Oasis Ecotone

1
College of Life Science and Technology, Tarim University, Alar 843300, China
2
Xinjiang Production and Construction Corps Key Laboratory of Protection and Utilization of Biological Resources in Tarim Basin, Alar 843300, China
3
College of Horticulture and Forestry, Tarim University, Alar 843300, China
*
Author to whom correspondence should be addressed.
Diversity 2023, 15(10), 1083; https://doi.org/10.3390/d15101083
Submission received: 21 September 2023 / Revised: 8 October 2023 / Accepted: 10 October 2023 / Published: 13 October 2023

Abstract

:
The relationship between the spatial structure of shelter forests and the diversity of understory herbaceous plants in desert–oasis ecotones is important for maintaining biodiversity indices and protecting the oasis ecosystem. In this paper, we explore the coupling relationship between tree layer structure (competition index, angle scale, neighborhood comparison, DBH, etc.) and understory herb diversity in the transition zone of shelter forest plots near oases and near deserts; in addition, we also aim to elucidate the dominant stand structure factors affecting herb biodiversity. The results indicated the following: A total of 13 herbaceous plant species were discovered in the transitional zone, with 11 species found near the oasis area and 4 species near the desert region. The Shannon, Simpson, and Pielou indices of understory herbaceous plants were significantly higher near the oasis area compared to the desert region. The Margalef index mean was higher in the oasis area compared to the desert region. Pearson and canonical correlation analyses revealed significant associations between specific stand structure indicators and diversity in the herbaceous layer. The results of the multiple linear regression analysis revealed that the competition index had a significant impact on the Shannon, Simpson, and Pielou diversity indices of the herbaceous layer in the understory of the shelterbelt forest near the oasis, with corresponding impact coefficients of 0.911, 0.936, and 0.831, respectively. The mingling degree was found to be the primary influencing factor for the Margalef index, with an impact coefficient of 0.825. However, in the understory of the shelterbelt forest near the desert, the neighborhood comparison ratio negatively affected the Shannon and Margalef indices, with impact coefficients of −0.634 and −0.736, respectively. Additionally, tree height negatively impacted the Simpson and Pielou indices, with impact coefficients of −0.645 and −0.677, respectively. In order to enhance the diversity of understory herbaceous species in the transitional zone and preserve the ecological system of the oasis, specific modifications to the forest structure and arrangement are essential. Pruning and thinning are necessary for shelterbelt forests located near desert regions, while shelterbelt forests near oases should use a suitable mix of tree species. These measures can help preserve or enhance the diversity of understory herbaceous plants.

1. Introduction

The transitional zone bordering the Taklimakan Desert and the 11th regiment of Alar City in southern Xinjiang belongs to the alluvial–pluvial fan oasis–desert fragile zone [1]. The fragile zone is characterized by obvious environmental degradation, land desertification, serious salinization, weak soil fertility, and a fragile ecological environment. As a special ecological landscape embedded in desertified land, the oasis is a sensitive area of the arid ecosystem, and it is vulnerable to wind and sand disasters. Optimization and desertification are two geographical processes of opposite development. In order to avoid desertification in desert oases and their peripheries, the local government protects the soil by increasing the surface vegetation coverage. While increasing the area of cultivated land, protective shelter forests are planted outside of farmland to form a “green barrier”, which effectively blocks the expansion of the Taklimakan into the oases to the North and greatly improves agricultural productivity. In addition to environmental improvement, planting shelter forests in sandy areas can also conserve biological resources, increase biodiversity, and increase plant biomass [2]. As an integral part of the arid ecosystem, understory vegetation plays a crucial role in fixing sand flow and soil nutrient enrichment [3]. The study of the biodiversity of understory herbaceous plants in the desert–oasis transition zone can reflect the adaptability of plants to the environment and the succession patterns in this region. Whittaker proposed three types of diversity measures (α, β, and γ diversity) in 1972, which have been used up to the present day, among which α diversity is applicable to a small-scale range [4], including species richness, species relative abundance, species diversity index, and species evenness index.
Understory herbaceous plants play a vital role in maintaining the normal functioning of the ecosystem. The distribution pattern and biodiversity of organisms are influenced by both environmental factors and the structure of the upper layer. Most studies analyze the effects of environmental factors, such as topography [5], soil nutrients [6], and microclimates [7,8]. However, the diversity of understory herbaceous plants is also significantly affected by the stand structure of tree layers at small scales [9,10]. Previous studies have suggested that non-spatial structural factors (such as tree height, diameter at breast height, and density), as well as spatial structural factors (such as angle scale, mingling degree, and competition index) [11], restrict the diversity of understory herbaceous plants. For example, Li et al. [12] found that the diversity of understory herbaceous plants in an aerially sown Pinus massoniana forest was mainly affected by the stand density index. Zhang et al. [13] suggested that the opening degree and mingling degree were the dominant stand structures affecting the overall level of herbaceous plant diversity in Platycladus orientalis forests. Liu et al. [14] conducted a study on the spatial structure of forests at three different stages of succession. They found that forest structure measures, such as angular scale, forest layer index, and openness in spatial structure parameters, had a significant impact on the diversity of shrubs and grasses within the forests.
The above studies show that understory vegetation is closely related to the structure of the upper forest stand. In this study, the transition zone between the Taklamakan Desert and the 11th regiment of Alar City was taken as the study area. We investigated the species and biodiversity of understory herbaceous vegetation, as well as the structural characteristics of shelterbelt forests located at the edge of deserts and near oases in the transition zone, explored the dominant stand structural factors influencing the diversity of understory herbaceous plants in these shelterbelt forests, and analyzed the relationship between the characteristics of understory herbaceous communities and changes in the spatial structure of the forest stand. The impacts of shelterbelt construction on understory herbaceous communities in this area will be explored in order to adjust the shelterbelt structure based on local conditions and promote the recovery of vegetation in the desert–oasis transition zone. This research is of great value for local ecological management.

2. Materials and Methods

2.1. Overview of the Study Area

The experimental area (Figure 1) is located in the transitional zone (80°30′–81°58′ E, 40°22′–40°57′ N) between the 11th Regiment of Alar City and the Taklimakan Desert in the Xinjiang Uygur Autonomous Region. It possesses a warm, temperate continental arid desert climate, with an average altitude of 1015 m, with a maximum altitude of 1028 m and a minimum altitude of 1000 m, an average annual temperature of 10.7 °C, a maximum temperature of 43 °C, a minimum temperature of −27 °C, and an average frost-free period of 220 days. The average annual amount of solar radiation is between 133.7 and 146.3 kcal/cm2. The average annual daylight hours are 2556.3–2991.8 h, the average annual precipitation is 54.8 mm, the maximum annual precipitation is 82.5 mm, and the minimum is 40.1 mm; the maximum annual evaporation is 2558.9 mm, and the minimum is 1876.6 mm [15,16]. The dominant wind direction is northwest and southwest, and the annual average wind speed is 3.5~4.5 m/s. The northwest wind is dominant in the winter, and the southwest wind is dominant in the summer. The vegetation coverage in this area is low, and the surrounding farmland shelterbelts are mostly small grids and narrow forest belts; the main tree species in the area are Populus alba var. pyramidalis and Populus euphratica.

2.2. Sample Plot Setting

In this study, the plots were located in the desert–oasis transition zone of the eleventh regiment of Alar City. Plots with similar tree species, slope, slope direction, and soil texture were selected based on the results of previous forestry surveys. Thirteen standard shelter forest plots with Populus alba var. pyramidalis as the dominant tree species and Populus euphratica as the associated tree species were selected (including 7 shelter forest plots near the desert (Area A) and 6 shelter forest plots near the oasis (Area B)), and the average area of the protective forest is 11860 m2 (593 m × 20 m). Three small quadrats with an area of 900 m2 (90 m × 10 m) were established in each plot. The survey included recording the tree species composition, DBH, tree height, crown width, etc., and a grid method was used to record the relative coordinates of each tree (x, y). At the same time, according to the five-point sampling method, five 1 m × 1 m herb quadrats were established in each sample plot to record the species name and number of herbaceous species in each quadrat.

2.3. Research Methods

2.3.1. Stand Structure Calculation

Stand structure includes stand spatial structure and non-spatial structure. In this study, the stand spatial structure parameters measured were mingling degree (M), neighborhood comparison (U), competition index (CI), angle scale (W), and opening degree (K); the stand non-spatial structure parameters were tree height (H) and diameter at breast height (DBH).
The spatial structure of a forest stand is a crucial basis for evaluating the distribution and growth conditions of trees within the stand. It is defined as the positional relationship of all tree species within a forest stand, based on spatial structure units. Each spatial structure unit consists of an object tree and its neighboring trees. In this study, Voronoi polygons were employed to determine the competition units of trees [17,18]. The tree coordinates were imported into ArcGIS software to construct Voronoi diagrams and Delaunay triangulations (Figure 2). The trees within each Voronoi polygon are object trees, while the trees in the neighboring Voronoi polygons are considered competing trees. The number of competing trees (n) in an object tree is equal to the number of neighboring Voronoi polygons. The distance between the object wood and its nearest neighbor wood is represented by the length of the side of the triangle in the Delaunay triangular mesh construction. Additionally, the angle between the two sides originating from the object wood represents the angle of the nearest competing neighbor wood (α) [19,20]. This method ensures maximum correlation between competing and object trees and improves the precision of the study results. It avoids the shortcomings of selecting too few near-neighbor trees, which results in failing to take into account all the surrounding near-neighbor trees, or selecting too large a number of near-neighbor trees, which includes trees that are not actually near-neighbors in the consideration [21]. Additionally, it overcomes the drawback of the traditional fixed-radius circle that incorrectly classifies the object wood from the competing woods [22].
Calculation formula for spatial structure parameters of forest stands:
(1) Neighborhood comparison (U) is an index that represents the difference between neighboring trees based on the relative difference in diameter (or height, crown width) between the target tree and the competing tree. It is calculated by examining the relationship between the diameter (or height, crown width) of the target tree and the competing tree [23,24,25,26]. The formula is as follows:
U i = 1 n K ij n j = 1
(2) Mingling degree (M) is a measure of the extent to which different tree species are mixed together in a forest stand. It quantifies the level of interspecies interactions and diversity within the stand. The mingling degree can be calculated by determining the percentage of competing trees that belong to species other than the target tree species [23].
M i = 1 n V j n j = 1
V j = 1 , T h e   c o m p e t i n g   t r e e   i s   o f   t h e   s a m e   s p e c i e s   a s   t h e   t a r g e t   t r e e   i 0 , C o n v e r s e l y
(3) Angle scale (W) is an index that describes the uniformity of competing trees around a target tree. It is calculated by taking the target tree as the vertex and counting the number of neighboring competing trees whose angle ( α ) with the target tree is less than the standard angle ( α 0 = 360 ° n ± 360 ° 10 n ) , divided by the total number of n closest neighboring trees to the target tree [25].
W i = 1 n Z ij n i = 1
Z ij = 1 , T h e   j t h   a n g l e   ( α )   i s   l e s s   t h a n   t h e   s t a n d a r d   a n g l e   ( α 0 ) 0 , C o n v e r s e l y
(4) Competition index (CI) is an indicator that reflects the relationship between individual tree growth and spatial occupation. It utilizes Hegyi’s diameter–distance competition index [27,28], where D represents the distance between the target tree and the competing tree, and Hi and Hj represent the diameters of the target tree i and the competing tree j, respectively.
CI i = ( 1 D ij × H j H i ) n i = 1
(5) Opening degree (K) is a relative measure of light intensity within a forest stand [29]. It is defined as the ratio between the distance and the height of the target tree and the competing tree. Di represents the height of each individual plant, and Hij represents the distance.
K i = ( D i H ij ) n i = 1
Drawing on previous research findings [30,31,32,33], the mingling degree (M), neighborhood comparison (U), uniform angle scale (W), and opening degree (K) were divided into five grades, as shown in Table 1. The parameters U of each grade from small to large represent dominance, sub-dominance, mean, bad state, and absolute bad state. Each level of parameter K represents a serious shortage, insufficient, basically sufficient, sufficient, or very sufficient; the grades of parameter W represent uniform distribution, random distribution, and cluster distribution. Each grade of parameter M represents zero-degree mingling, weak-degree mingling, moderate-degree mingling, strong-degree mingling, and extremely strong-degree mingling. The lower the competition index (CI), the more advantageous the position of the target wood is in the competition [34].

2.3.2. Calculation of Understory Herbaceous Plant Diversity Index

In this study, the Simpson index, Shannon–Wiener index, Margalef richness index, and Pielou evenness index were selected to reflect the species diversity of understory herbaceous plants. The calculation formulae are as follows [35,36]:
Margalef richness index:
R = ( S - 1 ) In ( N )
Pielou evenness index:
E = H In ( S )
Simpson index:
D = 1 - ( P i ) 2 s i = 1
Shannon–Wiener index:
H = i = 1 S P i In P i
In the formulae, S is the total number of species;
N is the number of individuals of all species;
H is the species richness of various species in the habitat;
Pi is the proportion of species in the total community;
Ni is the number of individuals of the species.

2.3.3. Data Processing

The article utilized ArcGIS 10.8 to create Voronoi diagrams and Delaunay triangulation grids in order to calculate spatial structure parameters for forest stands (see details in Section 2.3.1). Pearson correlation analysis is employed to select forest structure factors that are related to various diversity indices (p < 0.05). The R language (yacca package) is used for canonical correlation analysis to explore the relationship between diversity indices and forest structure factors, which are two distinct sets of variables. By using the species diversity index as the dependent variable and the forest structure index as the independent variable, stepwise regression is conducted to establish a multiple linear regression model and determine the directly related parameters that affect the diversity index of understory herbaceous plants.

3. Results

3.1. Understory Herbaceous Species Diversity Characteristics

The study area is part of the Asian Desert Plant Subregion of the Pan-Arctic Flora, which originated from the dry-hot flora on the southern coast of the ancient Mediterranean. After long-term drought and species invasion, its species composition is complex and ancient [37]. According to the plot survey findings (Table 2), Area A contained 11 plant species in 6 families and 10 genera. Herbaceous plants were concentrated in Leguminosae, Gramineae, Compositae, and Polygonaceae, with Compositae containing the highest number of plant species. The dominant species in this area were Phragmites australis, Rumex acetosa, and Eleusine multiflora, with importance values of 0.433, 0.323, and 0.21, respectively. In contrast, Area B had fewer herbaceous species overall, with only four plants in four families and four genera. The absolute dominant species in this area was Phragmites australis, with an importance value of 0.569. Cynanchum cathayense followed with an importance value of 0.391. Interestingly, two desert plants, Alhagi sparsifolia and Karelinia caspia, appeared in the sample plots in Area B. The importance value of Karelinia caspia (0.261) was higher than that of Alhagi sparsifolia (0.052).
The diversity index of understory herbaceous plants in each plot is displayed in Table 3. In Area A, the Shannon, Simpson, and Pielou indices were significantly higher than those in Area B. However, there was no significant difference between the Margalef indices of Area A and Area B (p = 0.115). The Margalef index is employed as a quantitative measure to assess the level of species richness present within a given ecological community. The variation in species abundance across different sites in Area A results in a substantial coefficient of variation for the Margalef index, reaching 69.08%. The coefficient of variation in this area is not statistically different from the coefficient of variation observed in Area B. The coefficients of variation for the diversity indices were higher in Area B. The Simpson’s index had the highest coefficient of variation at 55.49%. Variations in species richness and evenness among the same sites in Area B resulted in higher coefficients of variation for the diversity indices.

3.2. Basic Characteristics of Stand Structure

From Table 4, it can be seen that the coefficient of variation for non-forest spatial structure parameters (tree height, DBH) in Area A and B is significant; meanwhile, the non-forest stand spatial structure indicators in A were all significantly more extensive than those in B (p = 0.015, p = 0.000). Referring to Table 1, analyzing the spatial structure indicators of each forest stand in Area A, we can see that the neighborhood comparison was 0.495, which is moderate. The opening degree was 2.903, indicating that the stand growth space is mainly sufficient; the angle scale was 0.503, which is close to random distribution, thus showing that the distribution state is ideal. The mingling degree was weak at 0.009, indicating a high degree of isolation between tree species. The neighborhood comparison of Area B was 0.485, and the forest differentiation was moderate; the opening degree was 0.58, the light transmission condition of the stand was good, and the growth space of the stand was sufficient. The angle scale was 0.508, and the horizontal distribution pattern of the trees conformed to a random distribution. The mingling degree was 0.069, showing weak mingling. The competition index values for Area A and B were 1.403 and 3.292, respectively, and the competitive pressure of Area B was significantly greater than that of Area A (p = 0.039). At the same time, the differences in mingling degree, neighborhood comparison, and angle scale were not significant. Moreover, the coefficient of variation for most of the indices in Areas A and B was relatively large, among which the coefficient of variation for the mingling degree was the largest at 155.56% and 316.23%, respectively (both of which are greater than 100%, thus showing substantial variability).

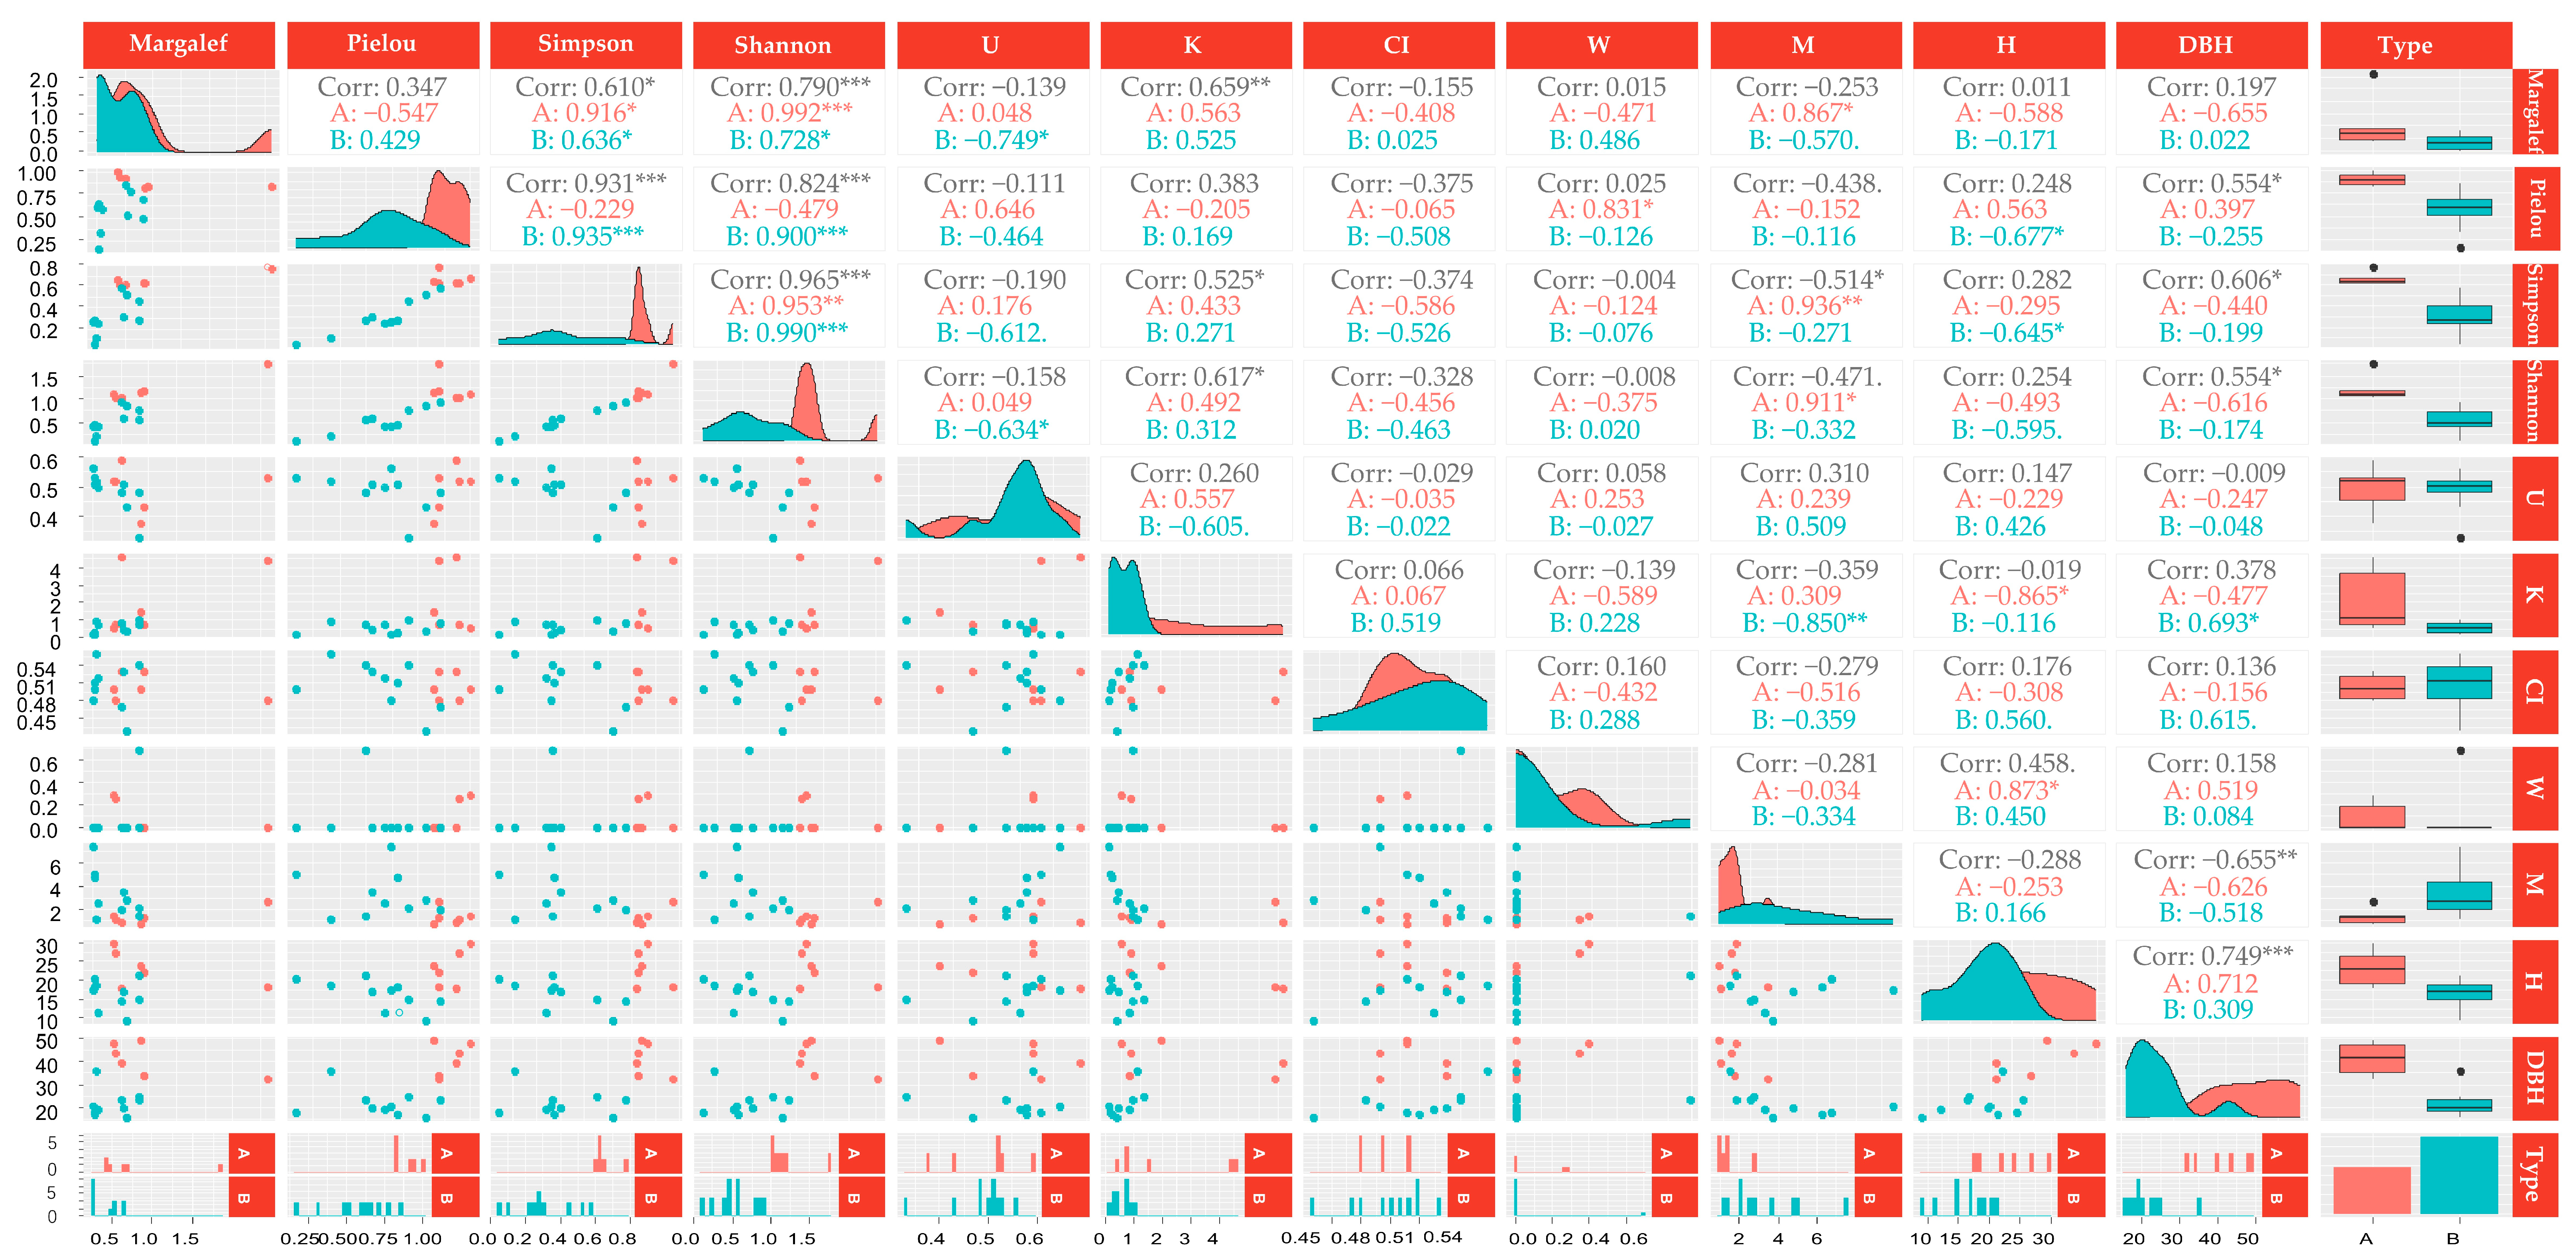
3.3. Correlation Analysis between Stand Structure Factors and Herb Diversity Index

The results of the Pearson’s correlation analysis conducted on the stand structural factors and diversity indices (shown in Figure 3) reveal a significant positive correlation between the Margalef richness index, Shannon evenness index, and Simpson diversity index of herbaceous plants, and the stand competition index (CI) in area A (p = 0.025, p = 0.011, p = 0.006). Furthermore, the Pielou evenness index exhibited a significant correlation with the stand mingling degree (M) (p = 0.045). Moreover, the Margalef richness index of herbaceous plants in area B demonstrated a noteworthy inverse relationship with the neighborhood comparison (U) (p = 0.013). Additionally, the Pielou evenness index and Simpson diversity index demonstrated a significant correlation with the tree height (H) (p = 0.032, p = 0.044). Conversely, the Shannon evenness index showed a significant negative correlation with the neighborhood comparison (U) (p = 0.049). Nevertheless, no significant correlation (p > 0.05) was found between the opening degree (K), angle scale (W), DBH, and the four diversity indices.

3.4. Canonical Correlation Analysis between Stand Structure and Understory Herb Diversity

The results of Pearson’s correlation analyses showed that the diversity of understory herbaceous plants was significantly correlated (p < 0.05) with the mingling degree (M) and the competition index (CI) in Area A. Additionally, the diversity of understory herbaceous plants was significantly correlated (p < 0.05) with the neighborhood comparison (U) and tree height (H) in Area B. To gain a deeper understanding of these correlations, we assign the four diversity indices in Area A (Margalef, Pielou, Simpson, Shannon) as the composite variable U1, while the indices for mingling degree and competition index are designated as the composite variable V1. Similarly, the four diversity indices in Area B are denoted as the composite variable U2, while the indices for neighborhood comparison and tree height are denoted as the composite variable V2. Canonical correlation analysis is subsequently conducted on the composite variables U1, V1, and U2-V2 to elucidate the linear associations between the biodiversity indices and forest structure variables in Areas A and B. This analysis provides a quantitative representation of the associations.
Table 5 presents the correlations between vegetation indices and environmental factors, offering valuable insights into their relationships. The correlation coefficients between the first group and the second group of typical variables in Area A were 1 (p = 0.000) and 0.675 (p = 0.004), respectively. The canonical correlation coefficients between the two groups of typical variables in Area B were 0.947 (p = 0.000) and 0.710 (p = 0.013), respectively, which reached extremely significant levels, indicating that the two groups of variables passed the canonical correlation coefficient test and that there was a strong correlation. The variables composed of two stand structure indicators can be used to explain the variables of understory herbaceous diversity composition. Generally speaking, the significance of the first pair of canonical correlation variables is evident and represent variables that explain a great deal of variation [38]. Therefore, only the first set of canonical variables was analyzed.
Combining the information presented in Figure 4 and Table 6 demonstrates that, in the linear combination U1 of the first group of typical variables in Area A, the negative loadings of X1, X3, and X4 are larger, (−0.934, −0.934, and −0.959, respectively), and the cross-load coefficients are −0.940, −0.934, and −0.960, respectively. This indicates that the Margalef, Simpson, and Shannon–Wiener indices were the most responsive indices for the stand structure comprehensive index change; furthermore, they play a decisive role in the comprehensive index of understory herbaceous plant species diversity. The maximum negative loading of Y2 in V1 was −0.984, and the cross-load coefficient was −0.978, indicating that V1 is mainly composed of the competition index. Based on the relationship between the two, it was considered that the Margalef, Simpson, and Shannon–Wiener indices would increase with the increase in the stand competition index. In the linear combination, U2, of the first group of typical variables in Area B, the maximum negative load of X1 was −0.810, the cross-load coefficient was −0.766, the minimum negative load of X2 was −0.343, and the cross-load was −0.325, indicating that the Margalef index had the largest weight in U2, and the Pielou index had the smallest weight. The maximum load coefficient of Y3 in V1 was 0.971, and the cross-load coefficient was 0.920, indicating that V2 is mainly composed of the size ratio. Therefore, the larger the stand size ratio, the smaller the Margalef index.

3.5. Multiple Stepwise Regression Analysis of Stand Structure and Understory Herb Diversity

The multiple linear regression model was used to find the stepwise regression approach, with the species diversity index as the dependent variable and the stand structure index as the independent variable. In order to determine the relative importance of stand structure factors related to the species diversity index. It can be seen from Table 7 that all equations passed the significance test (p < 0.05). The regression equation coefficients were well fitted; furthermore, the Durbin–Watson value was around 2.0, indicating that the model can be used to test the dominant stand structure factors affecting the diversity of understory herbaceous species. The four diversity indices of Area A and B were dominated by different stand structure factors. The regression equations of the Shannon–Wiener index, Simpson index, and Pielou evenness index in Area A (R2 = 0.831, R2 = 0.876, R2 = 0.946) all retained the stand competition index, and the standardized coefficients were 0.911, 0.936, and 0.831, respectively. Therefore, it was considered that the competition index was the main influencing factor of the Shannon–Wiener, Simpson, and Pielou evenness indices. The regression equation of the Margalef richness index (R2 = 0.946) retained the two factors of competition index and mingling degree, and the standardized coefficient for the mingling degree was the largest (0.852); thus, it was considered that the mingling degree had a great influence on the Margalef richness index. The regression equations of the Simpson index and Pielou evenness index in Area B (R2 = 0.402, R2 = 0.778) retained tree height, and the standardized coefficients were −0.645 and −0.677, respectively, indicating that tree height was the dominant factor influencing the Simpson index and Pielou evenness index. The Shannon–Wiener index regression equation (R2 = 0.402) retained the stand size ratio, and the standardized coefficient was −0.634, indicating that the size ratio was the dominant factor of the Shannon–Wiener index. The regression equation of the Margalef richness index (R2 = 0.778) retained the size ratio and mingling degree, and the largest standardized coefficient was the size ratio (−0.736), indicating that the size ratio had the greatest influence on the Margalef richness index.

4. Discussion

In an ecologically fragile area such as the desert–oasis transition zone, herbaceous plants play a crucial role in ecosystem restoration; furthermore, they also help to stabilize the ecological environment of the oasis. Studies have shown that the growth of herbaceous plants is often affected by the upper stand [39]. Therefore, it is of great significance to explore the relationship between herbaceous plant diversity and the upper stand structure factors for ecological restoration.
The structural parameters of shelter forests near the oasis (Area A) and near the desert (Area B) in the transitional zone were analyzed. It was considered that they all met the ideal standard, the tree species were open, the viability was good, the degree of forest differentiation was moderate, and the distribution pattern was close to random distribution. In Area A, tree height and diameter at breast height (DBH) were significantly greater (p = 0.015, p = 0.000), while the competition index was significantly lower compared to Area B (p = 0.039). The herbaceous plants found in Area A comprised a total of 11 species belonging to 6 families and 10 genera, indicating a relatively diverse range of species. The dominant species in this area were Phragmites australis, Rumex acetosa, and Eleusine multiflora. Phragmites australis exhibited a significant dominance in Area B, as indicated by its high importance value of 0.569. Two desert plant species, Alhagi sparsifolia and Karelinia caspia, were observed in Area B, whereas they were not present in Area A. Analyses of the understory herbaceous vegetation’s biodiversity revealed a statistically significant increase in the Shannon, Simpson, and Pielou indices in Area A compared to Area B. Furthermore, although the Margalef index did not demonstrate a significant difference in comparison to Area B, it displayed a mean value of 0.761, which was higher than that of Area B (0.422). Hence, it can be inferred that the vegetation growth environment in the transitional zone closer to the desert region is relatively poorer compared to the transitional zone closer to the oasis area. This region is more suitable for the growth of desert plants that are drought-tolerant and adapted to harsh environments.
Pearson correlation analysis and canonical correlation analysis indicate that there was a correlation between the stand competition index, mingling degree, and species diversity index (variable U1) in Area A, and the correlation coefficient of the competition index was the largest (−0.984). It was considered that the species diversity of understory herbaceous plants in Area A was affected by the combination of the stand competition index and mingling degree. The multiple regression equation showed that the Shannon–Wiener index, Simpson index, and Pielou evenness index equations were positively correlated with the mingling degree of the stand. The Margalef richness index equation was affected by the competition index and the mingling degree, and the coefficients were 0.852 and −0.442, respectively. Therefore, it was considered that the stand competition index in Area A was the main influencing factor of the biodiversity index, and the diversity index will increase with the increase in the stand competition index. This may be due to the increase in the stand competition index, thus resulting in the increase in suitable species and the increase in species diversity. Hence, it is considered that the stand competition index is a significant factor affecting the species diversity of the herb layer. As the stand competition index in Area A is between 0 and 2, it belongs to weak competition. It is believed that an increase in the stand competition index within a certain range will lead to an invasion of shade-tolerant organisms, thereby increasing the value of the species diversity index [40].
The results of canonical correlation analysis in Area B showed that there was a correlation between the stand size ratio, tree height, and species diversity (U2), and the load coefficients were 0.971 and 0.188, respectively. It can be seen from the analysis of the multiple regression equations that the Simpson index and Pielou evenness index in Area B are significantly affected by tree height, and the coefficients were −0.645 and −0.677, respectively. Previous research conducted by Zhu et al. [41] found a significant negative correlation between the biodiversity index and tree height, which is consistent with the results of our study. This correlation can be explained by the concentration of the root system of Xinjiang poplar primarily within the 0–40 cm soil layer, as suggested by Zhang et al. [42]. As tree height increases, transpiration rates also increase, leading to higher water consumption. This intensifies competition for water and nutrients among herbaceous plants in the shallow soil layer [43]. Consequently, the lack of favorable growth conditions for undergrowth plants results in a decrease in species richness and biodiversity index. The dominant factor of the Shannon–Wiener index equation was the stand size ratio, and the coefficient was −0.643. The Margalef richness index equation was affected by the size ratio and the mingling degree, and the coefficients were −0.736 and 0.466. It is believed that an increase in stand size ratio will lead to a decrease in biodiversity, which is different from the results [44] where the stand size ratio has no significant effect on the species diversity of understory herbaceous plants (p > 0.05). The reason for this discrepancy may be that the size ratio is mainly used to analyze the degree of differentiation for individual tree sizes [45]. The larger the value, the weaker the advantage of Populus alba var. pyramidalis species. The stronger the tree competition, then the lower the overall stability of the stand [46], which in turn affects the degree of the uniform distribution of understory herbaceous plants, resulting in a decrease in the Shannon–Wiener index. Bazzaz found that when the stand size was relatively small, the diversity index of understory herbaceous species was larger [47], which is similar to the results of this study. The Margalef richness index was not only negatively affected by the size ratio, but also positively affected by the mingling degree. Therefore, the higher the mingling degree of trees in the tree layer, then the greater the evenness index and diversity index of the understory shrub species [12,48]. It may be due to the fact that the canopies, branches, and trunks of different tree species in mixed forests form a complex structure. This structure can effectively intercept and attenuate wind forces compared to pure forests, providing a suitable growing environment for understory herbs.
This paper found no significant correlation between stand openness, angular scale, and four diversity indices (p > 0.05). Studies have shown that there is a positive correlation between lower herbaceous plants and upper stand openness in a small spatial scale in closed forests [7]. However, in this study, the shelter forest plots in Areas A and B were low-closed stands; thus, the way in which the lower vegetation obtains light is not limited to the upper stand openness. The abundance and diversity of herbaceous plants are not necessarily related to the effectiveness of light. The size of the angle scale reflects the distribution of the stand. Certain studies suggest that, when the angle scale is large, it is an example of aggregated distribution, which may have a direct or indirect impact on the understory herbaceous plants—thus affecting their species diversity. However, many environmental factors also play a role in interfering with the influence of the light spot distribution of upper trees when the stand with a small angular scale conforms to random distribution [48].
The main dominant factors of biodiversity—which were stand competition index, tree height, and size ratio—in Area A and B were compared. Plot B is adjacent to the desert and is vulnerable to wind and sand. Herbaceous plants in this area have evolved traits to adapt to drought, such as thicker leaves, thicker cuticles, and more complex, deeper, and wide-ranging root systems [49]. Herbaceous plants and trees compete for shallow water, which is easily affected by the size and distribution of trees. Therefore, the main influencing factors of herbaceous biodiversity in Area B are the tree height and size ratio. The sample plot of Area A is close to the oasis, and the natural environment is more suitable for the growth of species than that of Area B. At this time, a moderate increase in stand density and competition index will improve the soil environment and promote the growth of understory vegetation. Therefore, the main influencing factor of understory herbaceous diversity in Area A was the stand competition index.
In summary, through Pearson correlation analysis, multiple linear stepwise regression analysis, and canonical correlation analysis, this study demonstrates the primary and secondary factors of stand structure that impact understory biodiversity of herbaceous plants. In subsequent protection forest construction and ecological restoration work, the stand structure can be adjusted according to the local conditions in order to improve the biodiversity of understory herbaceous vegetation. In the follow-up study, environmental factors such as climate, light, and water can be included in the impact category of understory herbaceous plant diversity. This should be performed so as to more comprehensively understand the main and secondary influencing factors of understory herbaceous diversity. This can also help us to understand the formation mechanism of understory herbaceous plant diversity more accurately and to provide a scientific basis for the protection and utilization of forest resources.

5. Conclusions

A total of 13 species of herbaceous plants were found in the Taklimakan desert–oasis transitional zone in the Alar region of southern Xinjiang, involving 6 families, 12 genera, 9 species of xerophytes, 1 species of mesoxerophytes, and 3 species of xeromesophytes. The results showed that there were differences in the dominant factors in the biodiversity of understory herbaceous plants in the two experimental plots near the desert and near the oasis in the transitional zone. For the shelter forest plots near the oasis, the stand competition index was the main factor affecting the biodiversity of the understory herbaceous layer, and the stand competition index was positively correlated with the biodiversity of the understory herbaceous layer (within a reasonable range). In the shelter forest plots near the desert, there was a significant negative relationship between the biodiversity of the understory herbaceous layer, the stand size ratio, and tree height. In addition, in the investigation of the study area, it was found that there were a few shrub layer species under the forest. Therefore, while reasonably improving the stand structure through pruning and thinning, it is particularly important to increase the construction of understory shrubs. This can not only promote the restoration and growth of vegetation in the transitional zones of the sandy area, but it can also strengthen the windbreak and sand fixation of the tree, shrub, and grass structures so as to improve the soil quality of the transitional zone and improve the biodiversity and ecosystem stability.

Author Contributions

Conceptualization, Z.Z.; methodology, Y.Y.; validation, Y.Y.; formal analysis, Y.Y.; investigation, Y.Y., L.S., Y.Z., Y.T. and J.T.; writing—original draft, Y.Y.; writing—review and editing, Y.Y.; visualization, Y.Y.; supervision, Z.Z.; funding acquisition, Z.Z. All authors have read and agreed to the published version of the manuscript.

Funding

This research was founded by the Key Regional Science and Technology Research Project of the Corps (Funding number: 2021AB022, Funder: Xinjiang Production and Construction Corps), the China Ocean University—Tarim University Joint Fund Project (Funding number: ZHYLH201903, Funder: China Ocean University, Tarim University) and the Open Project of Xinjiang Production and Construction Corps Key Laboratory of Protection and Utilization of Biological Resources in Tarim Basin (Funding number: BRZD1902, Funder: Corps Key Laboratory).

Institutional Review Board Statement

Not applicable.

Data Availability Statement

Not applicable.

Conflicts of Interest

The authors declare no conflict of interest.

References

  1. Wang, Y.; Zhao, C. Study in Desert-oasis Ecological Fragile Zone. Arid Land Geogr. 2001, 24, 182–188. [Google Scholar] [CrossRef]
  2. Ma, J. Review on ecological benefit evaluation of shelter forest. Prot. For. Sci. Technol. 2012, 1, 79–82. [Google Scholar] [CrossRef]
  3. Chen, B.; Wang, G.; Peng, S. Role of desert annuals in nutrient flow in arid area of Northwestern China: A nutrient reservoir and provider. Plant Ecol. 2009, 201, 401–409. [Google Scholar] [CrossRef]
  4. Ma, K.; Liu, Y. Measurement methods for biodiversity in ecological communities: Part I—Measurement methods for α diversity (continued). Biodivers. Sci. 1994, 2, 231–239. [Google Scholar] [CrossRef]
  5. Yang, Z.; Qin, F.; Zhang, X.; Li, X.; Niu, X.; Liu, L. Environmental interpretation of herb species diversity under different site types of Hippophae rhamnoides forest in feldspathic sandstone region. Acta Ecol. Sin. 2018, 38, 5132–5140. [Google Scholar] [CrossRef]
  6. Bell, F.W.; Lamb, E.G.; Sharma, M.; Hunt, S.; Anand, M.; Dacosta, J.; Newmaster, S.G. Relative influence of climate, soils, and disturbance on plant species richness in northern temperate and boreal forests. For. Ecol. Manag. 2016, 381, 93–105. [Google Scholar] [CrossRef]
  7. Márialigeti, S.; Tinya, F.; Bidló, A.; Ódor, P. Environmental drivers of the composition and diversity of the herb layer in mixed temperate forests in Hungary. Plant Ecol. 2016, 217, 549–563. [Google Scholar] [CrossRef]
  8. Berger, A.L.; Puettmann, K.J. Overstory composition and stand structure influence herbaceous plant diversity in the mixed aspen forest of northern Minnesota. Am. Midl. Nat. 2000, 143, 111–125. [Google Scholar] [CrossRef]
  9. Chen, Y.; Cao, Y. Response of tree regeneration and understory plant species diversity to stand density in mature Pinus tabulaeformis plantations in the hilly area of the Loess Plateau, China. Ecol. Eng. 2014, 73, 238–245. [Google Scholar] [CrossRef]
  10. Ali, A.; Yan, E.; Chen, H.; Chang, S.; Zhao, Y.; Yang, X.; Xu, M. Stand structural diversity rather than species diversity enhances aboveground carbon storage in secondary subtropical forests in Eastern China. Biogeosciences 2016, 13, 4627–4635. [Google Scholar] [CrossRef]
  11. Cook, J.E. Structural effects on understory attributes in second-growth forests of northern Wisconsin, USA. For. Ecol. Manag. 2015, 347, 188–199. [Google Scholar] [CrossRef]
  12. Li, F.; Pan, P.; Ning, J.; Lai, G.; Ouyang, X.; Xu, H.; Guo, L.; Wu, Z.; Yi, Z. Effects of Stand Spatial Structure on Understory Vegetation Diversity of Aerial Seeding Pinus massoniana Plantations. J. Northeast For. Univ. 2016, 44, 31–35+40. [Google Scholar] [CrossRef]
  13. Zhang, L.; Zhou, P.; Qi, S.; Zhang, D.; Wu, B.; Cui, R. Difference Influence of Spatial Structure of Platycladus orientalis Plantations on Diversity of Understory Herbaceous and Its Correlation Degree. Ecol. Environ. Sci. 2022, 31, 1794–1801. [Google Scholar] [CrossRef]
  14. Liu, Y.; Wang, X.; He, L.; Liu, Z.; Zeng, X.; Sha, H.; He, B.; Jin, Y.; Li, J.; Chen, J.; et al. Effects of spatial structure on understory vegetation and soil properties in Pinus tabuliformis plantation of different succession types in Beijing. Acta Ecol. Sin. 2023, 43, 1959–1970. [Google Scholar] [CrossRef]
  15. Climate Conditions. Series. Available online: http://www.ale.gov.cn/ssgk/qhtj (accessed on 15 June 2023).
  16. Basic Meteorological Observation Data of China’s Surface. Series. Available online: http://data.cma.cn/ (accessed on 15 July 2023).
  17. Le, T. Comparative study on natural mangrove forest stand spatial structure by Tyson polygon and traditional four trees method. J. Cent. South Univ. For. Technol. 2021, 41, 35–42, 53. [Google Scholar] [CrossRef]
  18. Zhang, G.; Ying, H. Analysis and application of polygon side distribution of Voronoi diagram in tree patterns. J. Beijing For. Univ. 2015, 37, 1–7. [Google Scholar] [CrossRef]
  19. Zhao, C.; Li, J.; Li, J. Quantitative Analysis of Forest Stand Spatial Structure Based on Voronoi Diagram & Delaunay Triangulated Network. Sci. Silvae Sin. 2010, 46, 78–84. [Google Scholar]
  20. Tang, M.; Chen, Y.; Shi, Y.; Zhou, G.; Zhao, M. Intraapecific and Interspecific competition analysis of community dominant plant populations based on Voronoi diagram. Acta Ecol. Sin. 2007, 27, 4707–4716. [Google Scholar] [CrossRef]
  21. Song, Y.; Zhang, C.; Cai, T.; Ju, C. Quantitative analysis of spatial structural characteristics of broadleaved Korean pine forest based on Voronoi diagram. J. Beijing For. Univ. 2021, 43, 20–26. [Google Scholar] [CrossRef]
  22. Wang, F. The study of the stand spatial structure based on ArcGIS—A case study in Wuyi mountain Nature Reserve. Master’s Thesis, Nanjing Forestry University, Nanjing, China, 2013. [Google Scholar]
  23. Aguirre, O.; Hui, G.; von Gadow, K.; Jiménez, J. An analysis of spatial forest structure using neighbourhood-based variables. For. Ecol. Manag. 2003, 183, 137–145. [Google Scholar] [CrossRef]
  24. Hui, G.; Albert, M.; Gadow, K. DasUmgebungsmaß als Parameter zur Nachbildung von Bestandesstrukturen. Forstwiss. Cent. Ver. Mit Tharandter Forstl. Jahrb. 1998, 1, 258–266. [Google Scholar] [CrossRef]
  25. Hui, G.; Gado, K. The neighbourhood patiern—A new structure parameter for describing distribution of forest tree position. Sci. Silvae Sin. 1999, 35, 37–42. [Google Scholar]
  26. Hui, G.; Gadow, K.v.; Albert, M. A New Parameter for Stand Spatial Structure Neighbourhood Comparison. For. Res. 1999, 12, 1–6. [Google Scholar]
  27. Alemdag, I. Evaluation of Some Competition Indexes for the Prediction of Diameter Increment in Planted White Spruce; Canadian Forestry Service: Ottawa, ON, Canada, 1978; p. 39. [Google Scholar]
  28. Hegyi, F. A Simulation Model for Managing Jack-Pine Stands in Growth Models for Tree and Stand Simulation; Fries, J., Ed.; Royal College of Forestry: Stockholm, Sweden, 1974; pp. 74–90. [Google Scholar]
  29. Luo, Y. The spatial pattern of coniferous forest in Xinlong Mountain and its strategies in using sun light energy. Acta Ecol. Sin. 1984, 4, 10–20. [Google Scholar]
  30. Cui, C.; Zha, T.; Zhang, X.; Chen, Y.; Gao, L.; Bai, L.; Ma, Z.; Yu, Y. Spatial structure characteristics of plain ecological plantation in Tongzhou District, Beijing, China. Chin. J. Appl. Ecol. 2022, 33, 2088–2096. [Google Scholar] [CrossRef]
  31. Guan, Y.; Zhang, S. A Classification and Comparison of Competition Indices. A Classif. Comp. Compet. Indices 1992, 14, 1–8. [Google Scholar]
  32. Li, C.; Pei, S.; Zhang, L.; Guo, J.; Xin, X. Applicability evaluation of competition indexes for Pinus tabuliformis plantations in Beijing. J. Zhejiang A F Univ. 2019, 36, 1115–1124. [Google Scholar] [CrossRef]
  33. Zhang, L.; Sun, C.; Lai, G. Analysis and Evaluation of Stand Spatial Structure of Platycladus orientalis Ecological Forest in Jiulongshan of Beijing. For. Res. 2018, 31, 75–82. [Google Scholar] [CrossRef]
  34. Lin, F.; Wang, W.; Men, X.; Sun, Y.; Li, G.; Liu, D. Spatial structure optimal of Larix gmelinii plantation. J. Beijing For. Univ. 2021, 43, 68–76. [Google Scholar] [CrossRef]
  35. Kong, F.; Yu, R.; Xu, Z.; Zhou, M. Application of excel in calculation of biodiversity indices. Mar. Sci. 2012, 36, 57–62. [Google Scholar]
  36. Zhang, W.; Qi, Y.; George, S.K. Randomization tests and computational software on statistic significance of community biodiversity and evenness. Biodivers. Sci. 2002, 10, 431–437. [Google Scholar]
  37. Wu, Z. On the Division of Flora in China. ACTA Bot. Yunnanica 1979, 1, 1–20. [Google Scholar]
  38. Wu, J. Basics of Medical Statistics and Application of SPSS Software, 1st ed.; Gansu Culture Publishing House: Gansu, China, 2017; p. 294. [Google Scholar]
  39. López, R.P.; Larrea-Alcázar, D.M.; Teresa, O. Positive effects of shrubs on herbaceous species richness across several spatial scales: Evidence from the semiarid Andean subtropics. J. Veg. Sci. 2009, 20, 728–734. [Google Scholar] [CrossRef]
  40. Li, S. Studies on the Relation between Density and Undergrowth Diversity of Pinus tablulaeformis and Populus davidana Forests in DA WO PU. Master’s Thesis, Hebei Agricultural University, Baoding, China, 2002. [Google Scholar]
  41. Zhu, Y.; Yang, X.; Shi, Z.; Liu, Y.; Zhang, X. The influence of stand factors on species diversity of herb layer in Zhangbei poplar plantations. Chin. J. Ecol. 2018, 37, 2869–2879. [Google Scholar] [CrossRef]
  42. Zhang, Y.; Hu, S.; Li, J.; Lu, J.; Wang, W. Characteristic of root biomass of three main forest types in Xinjiang. Arid Land Geogr. 2013, 36, 269–276. [Google Scholar] [CrossRef]
  43. Di, N. Root Traits Spatial-Temporal Variation and Root-Water Uptake Characteristics and Mechanisms of Populus tomentosa. Master’s Thesis, Beijing Forestry University, Beijing, China, 2019. [Google Scholar]
  44. Cui, R.; Qi, S.; Wu, B.; Zhang, D.; Zhang, L.; Zhou, P.; Ma, N.; Huang, X. The Influence of Stand Structure on Understory Herbaceous Plants Species Diversity of Platycladus orientalis Plantations in Beijing, China. Forests 2022, 13, 1921. [Google Scholar] [CrossRef]
  45. Duan, C.; Wang, J.; Ma, J.; Yuan, S.; Du, Y. Evaluation of Quercus aliena var. acuteserrata forest at the western segment of Qinling Mountain, northwestern China. J. Beijing For. Univ. 2009, 31, 61–66. [Google Scholar] [CrossRef]
  46. Liu, Y.; Yu, X.; Yue, Y.; Gan, J.; Wang, X.; Li, J. Spatial structure of Robinia pseudoacacia plantation in Miyun Reservoir Watershed of Beijing. J. Beijing For. Univ. 2009, 31, 25–28. [Google Scholar] [CrossRef]
  47. Bazzaz, F. Plant species diversity in old-field successional ecosystems in southern Illinois. Ecology 1975, 56, 485–488. [Google Scholar] [CrossRef]
  48. Zhu, G.; Xu, Q.; Lu, Y. Effects of stand spatial structure on species diversity of shrubs in Quercus spp. natural secondary forests in Hunan Province. Acta Ecol. Sin. 2018, 38, 5404–5412. [Google Scholar] [CrossRef]
  49. Li, X.; Tian, L.; Bai, c.; He, L. Investigation and ecological adaptability analysis of typical herbaceous plant resources in the southeast edge of Mu Us Desert. Shaanxi J. Agric. Sci. 2017, 63, 47–54. [Google Scholar]
Figure 1. Sample map of study area.
Diversity 15 01083 g001
Figure 2. Schematic diagram of spatial structural units of forest stands. Note: number 1 represents the object tree, numbers 2 to 6 represent the neighboring trees.
Diversity 15 01083 g002
Figure 3. The Pearson correlation between stand structure and understory herb diversity. Note: ***: p < 0.001; **: p < 0.01; *: p < 0.05.
Diversity 15 01083 g003
Figure 4. Typical correlation between variables. Note: Shannon–Wiener index—X4; Simpson index—X3; Margalef richness index—X1; Pielou evenness index—X2; mixed degree—Y1; competition index—Y2; neighborhood comparison—Y3; and tree height—Y4.
Diversity 15 01083 g004
Table 1. Stand spatial structure parameters.
Stand Spatial Structure ParameterStand Spatial Structure Grade
IIIIIIIVV
Neighborhood comparison (U)0(0, 0.33)[0.33, 0.67](0.67, 1)1
Opening degree (K)(0, 0.2](0.2, 0.3](0.3,0.4](0.4,0.5](0.5, +∞]
Angle scale (W)(0, 0.475)[0.475, 0.517][0.517, +∞]--
Mingling degree (M)0(0, 0.25](0.25, 0.5](0.5, 0.75](0.75, 1.00]
Table 2. Herbaceous plant classification and importance value.
DepartmentGenusPlant NamesImportance Value
Oasis (A)Desert (B)
LeguminosaeGlycyrrhizaGlycyrrhiza uralensis0.084-
AlhagiAlhagi sparsifolia-0.052
GramineaePhragmitesPhragmites australis0.4330.569
EleusineEleusine multiflora0.210-
CompositaeTaraxacumTaraxacum monochlamydeum0.141-
CirsiumCirsium setosum0.121-
SonchusSonchus wightianus0.145-
Sonchus brachyotus0.057-
KareliniaKarelinia caspia-0.261
PolygonaceaePolygonumPolygonum patulum0.057-
RumexRumex acetosa0.323-
AsclepiadaceaeCynanchumCynanchum cathayense0.1470.391
ChenopodiaceaeChenopodiumCastanopsis fissa0.061-
Table 3. Basic characteristics of species diversity indices.
IndexOasis (A)Desert (B)t Test
Mean ± Standard
Deviation
Coefficient of
Variation (%)
Mean ± Standard
Deviation
Coefficient of
Variation (%)
Tp
Shannon–Wiener index1.206 ± 0.27823.02%0.534 ± 0.26549.65%4.1410.001 ***
Simpson index0.658 ± 0.0609.06%0.303 ± 0.16855.49%3.8770.001 ***
Margalef richness index0.761 ± 0.52669.08%0.422 ± 0.17040.28%1.6650.115
Pielou evenness index0.899 ± 0.0717.86%0.573 ± 0.60635.89%2.9030.010 **
Note: ***: p < 0.001; **: p < 0.01.
Table 4. Characteristics of stand structure index.
IndexArea AArea Bt test
Mean ± Standard
Deviation
Coefficient of
Variation (%)
Mean ± Standard
Deviation
Coefficient of
Variation (%)
Tp
Tree height (m)23.32 ± 0.7828.53%17.10 ± 0.2524.3%2.4780.015 **
DBH (cm)39.62 ± 1.7337.06%20.53 ± 0.3936.56%7.5870.000 ***
Mingling degree0.09 ± 0.14155.56%0.07 ± 0.22316.23%0.2100.837
Neighborhood comparison0.50 ± 0.0815.37%0.49 ± 0.0713.30%0.2810.783
Competition index1.40 ± 0.6747.73%3.29 ± 1.9413.11%−2.2790.039 **
Angle scale0.50 ± 0.0234.47%0.51 ± 0.047.70%−0.2650.795
Opening degree2.90 ± 1.9291.51%0.58 ± 0.3153.23%2.5020.025 **
Note: ***: p < 0.001; **: p < 0.01.
Table 5. Typical correlation coefficient and its significance test.
SampleTypical Variable GroupCanonical Correlation Coefficientp
A11.0000.000 **
20.9150.004 *
B10.9470.000 **
20.7100.013 *
Note: **: p < 0.01; *: p < 0.05.
Table 6. Standardization coefficient and cross load coefficient of typical variables.
Variable X1X2X3X4Y1Y2Y3Y4
AStandardization coefficientU1−0.9340.269−0.934−0.959----
V1----0.213−0.984--
Cross-load coefficientU1−0.9400.323−0.934−0.963----
V1----0.244−0.978--
BStandardization coefficientU2−0.810−0.343−0.521−0.561----
V2------0.9710.198
Cross-load coefficientU2−0.766−0.325−0.493−0.531----
V2------0.9200.188
Table 7. Stepwise regression equation of species diversity.
Species Diversity IndexRegression EquationR2pD-W
AShannon–Wiener indexy = 0.911 × CI0.8310.0111.898
Simpson indexy = 0.936 × CI0.8760.0061.552
Margalef richness indexy = 0.852 × C − 0.442 × W0.9460.0121.899
Pielou evenness index y = 0.831 × CI0.6900.0412.588
BShannon–Wiener indexy = −0.634 × U0.4020.0491.023
Simpson indexy = −0.645 × H0.4160.0440.760
Margalef richness indexy = −0.736 × U + 0.466 × M0.7780.0052.157
Pielou evenness index y = −0.677 × H0.4580.0320.957
Note: Competition index—CI, angle scale—W, neighborhood comparison—U, tree height—H, and Durbin–Watson index—D-W.
Disclaimer/Publisher’s Note: The statements, opinions and data contained in all publications are solely those of the individual author(s) and contributor(s) and not of MDPI and/or the editor(s). MDPI and/or the editor(s) disclaim responsibility for any injury to people or property resulting from any ideas, methods, instructions or products referred to in the content.

