Article

Genotypic and Phenotypic Diversity of Endemic Golden Camellias Collected from China

1
Guangxi Key Laboratory of Plant Functional Substances and Resources Sustainable Utilization, Guangxi Institute of Botany, Guilin 541006, China
2
The United Graduate School of Agricultural Sciences, Kagoshima University, Kagoshima 890-0065, Japan
*
Authors to whom correspondence should be addressed.
Diversity 2023, 15(11), 1134; https://doi.org/10.3390/d15111134
Submission received: 6 October 2023 / Revised: 27 October 2023 / Accepted: 1 November 2023 / Published: 6 November 2023
(This article belongs to the Section Plant Diversity)

Abstract

:
Not only are the plants of the golden camellia group examples of high-quality camellia germplasm, but they are also a plant group with rich medicinal and nutritional value, and these plants are used as food, cosmetics and traditional medicine in China. There are approximately 50 species in this group around the world, and more than 30 species of golden camellia plants have been listed in China. The leaves and flowers of these species have similar shapes, and as such, they are often confused as the same species. Our study used simplified genome sequencing technology to construct a phylogenetic tree of plants in the Chinese golden camellia group, and we also described the evolutionary relationships. At the same time, the secondary metabolic indexes of the total phenols, total flavonoids, total anthocyanins and ellagic acid in the leaves were determined, and principal component clustering analysis was also performed. The results showed that the phylogenetic relationship and genetic distance among the plant species of Chinese golden camellia group plants were fully revealed. The cluster analysis of chemical secondary metabolism and genetic phylogenetic trees showed some of the same trends, thereby indicating that secondary metabolism golden camellia can be used as biomarkers for golden camellia. The research results provide phylogenetic information for the genotype and performance diversity of the golden camellia that is regionally distributed in China, as well as provide a theoretical basis for the research and development of potential bioactive substances.

1. Introduction

The Camellia Sect. Chrysantha is a group with yellow flowers in the genus Camellia of the family Theaceae. Its precious and rare yellow gene fills the gap in the yellow camellia that is coveted by horticulturists. It has essential ornamental value and scientific research value. It is known as the “Queen of the Tea Clan”, the “Giant Panda of the Plant World” and the “Fantasy Yellow Flower Tea”. It is also called “Oriental Magic Tea” abroad [1,2,3]. Since golden camellia was discovered, it has been widely used in the hybrid breeding of yellow camellia and experimental research on cultivating excellent new varieties of hybrid camellia. Chinese experts and scholars have developed new varieties “Liaoyan Beauty”, “Nayue Hongyan”, “Xinhuang”, “Jinbei Danxin”, etc. [4,5]; and Japanese horticulturalists have cultivated new varieties such as “Chuhuang”, “Golden Star” and “Kimiko” et al. [6,7], which has greatly enriched the new tea variety market. Golden camellia is not only a high-quality camellia germplasm resource, but also a natural tea drink. It is one of the plants with the richest medicinal and nutritional value. The leaves and flowers of golden camellia are not only rich in active ingredients such as polyphenols, flavonoids, saponins and polysaccharides, but also rich in trace elements such as iron, selenium, copper, zinc, vanadium and natural organic germanium. It also has other important health care effects on the human body [8,9,10]. “Guangxi Zhuang Autonomous Region Zhuang Medicine Quality Standards” (Volume 2) records that golden camellia is slightly bitter and astringent, and it has the functions of clearing away heat and detoxification, diuresis and swelling, lowering blood sugar and cholesterol, preventing tumors, and anti-aging [11,12]. In 2010, the Chinese Ministry of Health approved golden camellia as a new resource of food, and it has been widely developed into scented tea, drinks, medicines, cosmetics, handicrafts, etc. Furthermore, its products have also sold well in domestic and foreign markets [13].
Golden camellia has attracted the research attention of scholars from all walks of life both at home and abroad because of its unique golden petals and rich medicinal value. However, there are many varieties of Sect. Chrysantha, all with different sources and large differences in quality, which is one of the main factors restricting the development of the industry [2]. Sect. Chrysantha plants are mainly distributed in southwest China and northern Vietnam and are divided into two major ecological distributions: karst and non-karst [14]. There are more than 50 species of this group in the world, and more than 30 species of golden camellia plants have been recorded in China. Having said this, there has been a long-standing controversy over the species’ classification [15]. The determination of species in traditional taxonomy is mainly based on the morphological characteristics of plants, such as stems, leaves, flowers and fruits. This approach has the advantages of simplicity, convenience and intuitiveness; however, because environmental conditions can easily affect morphological characteristics, they should not be used for identification. The differences in the morphological characteristics of the Camellia species are particularly minimal, and these characteristics are only suitable for use in the identification of samples with apparent differences between varieties. The flowers and leaves of the Sect. Chrysantha are very especially similar, and the identification between species often needs clarification; therefore, these issues can oftentimes lead to uncertainty or incorrect taxonomy.
Modern molecular techniques provide powerful tools for solving taxonomic problems in plant groups, especially in describing individual species. Many researchers have carried out numerous genetic and taxonomic studies on golden camellia plants using molecular markers such as RAPD, AFLP, SSR, ISSR, cpDNA and nDNA. Tang [16] used RAPD technology to analyze six two-variant golden camellia plants including Camellia nitidissima, Camellia nitidissima var.microcurpa, Camellia tunghinensis, etc. In addition, C.pubipetala was merged into Camellia nitidissima var.microcurpa, and Camellia nitidissima var. phaeopubisperma was incorporated into Camellia nitidissima. Amplified fragment length polymorphism (AFLP) molecular markers were also used for cluster analysis, and it was concluded that Camellia huana is a good species. Furthermore, Camellia ptilosperma, Camellia longruiensis, Camellia longgangensis and Camellia longgangensis var.grandis were merged into Camellia flavida [17]. Xiao [18] used ISSR molecular marker technology to analyze the genetic relationships of 29 golden camellia species from the Golden Camellia Park in Nanning, Guangxi, and they clustered the 29 golden camellia samples into three major groups. Among them, Camellia achrysantha was placed into a separate category, Camellia terminalis and Camellia longzhouensis were grouped into one category and other golden scented teas were grouped into one category. Moreover, Camellia xiashiensis and Camellia micrantha were merged into Camellia limonia; Camellia longgangensis and Camellia ptilosperma were merged into the same species; Camellia longzhouensis was merged into one category; and Camellia chrysanthoides was classified as separate species. Chen [19] used SSR molecular markers to conduct research on the genetic diversity and genetic structure of Camellia chrysanthoides and its related species. Lu [20] used chloroplasts and single-copy-sequence molecular techniques to analyze the phylogeography and conservation genetics of Camellia (Theaceae) in southern Guangxi, China. Wei [21] used phylogenetics to calculate the taxonomic information of yellow camellia plants in the Camellia family in China, and they found that the phylogeny of dd-RAD, RNA-sep and the chloroplast genome in the genus Camellia in China was inconsistent. Furthermore, it was also found that certain developmental trees were not separated or had differences, thus making them difficult to distinguish between, and indicating that hybridization and introgression affect the inconsistency between nuclear genes and the organelle genes of the genus Yellow Camellia. In summary, certain researchers have tried to analyze and study the relationships between plants in the Camellia Scet. Chrysantha family using single molecular markers or incomplete sampling. However, there is still a lack of morphological and molecular plant phylogeny consensus regarding Camellia Scet. Chrysantha in China.
The Camellia Scet.Chrysantha plants are mainly distributed in karst landforms, which have a high degree of habitat heterogeneity, and they have a great impact on the evolution of golden camellia plants [14]. Species migrate from one area to another. Changes in the natural environment cause different changes in plant leaf and flower shapes. Hybridization and penetration interfere with the division of plants. The phenotype of a plant is the sum of the traits that are displayed by plants under certain environmental conditions. It is the result of the interaction between genes and the environment. It is a manifestation of plant adaptation to environmental variation, and it is one of the main factors affecting plant survival. It reflects to a certain extent the genetic characteristics of the species [22]. Therefore, the development of molecular biology and chemical taxonomy may provide a comprehensive solution for the accurate identification and definition of these golden camellias. Chemotaxonomy is the practice of classifying plants based on their chemical composition; furthermore, secondary metabolites and related biosynthetic pathways are often specialized and are common in similar taxa, thus making them useful in taxonomic definition. In fact, as recommended by the Plant Working Group of the Consortium for the Barcode of Life (CBOL), plant barcodes of life have been used to provide information related to the taxonomic classification and phylogeny of closely related and distantly related plant species, and these have been used for the detection and utilization of biodiversity, species identification and other aspects, which are of great significance [23]. The leaf of the golden camellia group is the most important taxonomic organ. The leaf also serves as the chemical composition study site of plants, and it aids in establishing the correlation between the content of its secondary metabolic components and plant classification, which are both of great research value. Using the phytochemical secondary metabolism in combination with plant phylogeny to conduct collaborative research, not only can we systematically study phytochemistry from the big picture of plant phylogeny, but we can also use the evidence of phytochemistry to investigate plant systematic evolution.
Therefore, based on the above reasons, this study uses a combination of molecular biology and chemical taxonomy to carry out research on the newly emerging frontier field of evolutionary biology at the intersection of phytochemistry, plant taxonomy and plant systematics. Reduced-Representation Genome Sequencing (RRGS) technology was used to develop SNP and InDel markers to construct a plant phylogenetic tree of the Chinese golden camellia group; at the same time, spectrophotometry and chromatography were used to determine the total phenolics of the golden camellia group plants. For the determination of the secondary metabolism indicators such as flavonoids, total anthocyanins and ellagic acid, principal component clustering analysis was performed based on the similarities and differences in the plant secondary metabolite profiles. The research aimed to provide phylogenetic information for the genotype and performance diversity of the golden camellia regionally distributed in China. We used a combination of molecular markers and chemical classification to provide the most accurate classification of golden camellia plants (Le, 2023), and we revealed the phylogenetic relationship and genetic distance among the plant species of Chinese golden camellia group plants and used the phylogenetic tree of species to explore the evolution rules of phytochemical characteristics of Camellia Scet.chrysantha. By achieving this, the findings could then be used for the selection of yellow tea varieties and the identification of specific secondary metabolites, as well as help to provide a theoretical basis for the research and development of potential bioactive substances.

2. Materials and Methods

2.1. Genetic Part

2.1.1. Test Materials

According to the work commissioned by the Nanjing Environmental Science Institute of the Ministry of Ecology and Environment, “Investigation and Evaluation of the Current Situation and Protection Effectiveness of golden camellia Plants in Theaceae (837208)”, the distribution range and population of wild resources of all species of golden camellia plant in China were extensively investigated. In this study, 30 species of wild camellias (including varieties) with clear wild resources were selected to detect the interspecific relationship. The samples were collected from Guilin Botanical Garden, Guangxi, China (25°4014.8800 N, 110°170.5700 E), and the sample species were identified by the researcher Wei Xiao of Guangxi Institute of Botany (Table 1). A quantity of 2–3 healthy and young fresh leaves from each plant were collected, three replicates were collected for each species, and they were placed into tea bags and numbered. Finally, the samples were stored in a sealed bag of color-changing silica gel in a dry state for use in dd-RAD sequencing.

2.1.2. DNA Extraction, Enzyme Digestion and Library Construction for Sequencing

The genomic DNA of the 90 samples were extracted using a tissue DNA kit (OmegeBio-Tek, Norcross, GA, USA). The DNA quality was assessed using 1% agarose gel electrophoresis and a Nanodrop 2000 (ThermoFisher, Waltham, MA, USA) spectrophotometer. The DNA was quantified using Qubit3.0 (ThermoFisher) to ensure that each sample met the following criteria: total mass value > 3 μg, concentration > 30 ng/μL and an OD value of 260/an OD value of 280 = 1.80–2.00. This study used dd-RAD technology to construct a RAD-seq library, and we performed 150 paired-end sequences on the Illumina NovaSeq 6000 sequencing platform. The library construction and sequencing were entrusted to Beijing Biomarker Technologies Co., Ltd., Beijing, China.

2.1.3. SNP Calling

The raw data (raw date) were obtained via sequencing on the Illumina NovaSeq 6000 platform, and FastQC software (https://www.bioinformatics.babraham.ac.uk/projects/fastqc/ accessed on 20 April 2023) was used to check the quality of the raw data to ensure that qualified raw data were obtained. The process_radtags program in Stacks v2.54 software was used to filter and correct the original data. The reads with lower quality, which contained adapter sequences, were filtered and deleted. In addition, N (unidentified bases) was determined to obtain high-quality sequencing data (clean data). The population module in Stacks software was used to filter and output the SNP site information, and this was performed according to a minimum allele frequency (MAF) of 0.05, a maximum missing rate (missing) of 0.5 and a maximum observed heterozygosity (maximum observed heterozygosity) of a standard of 0.5 to filter the SNP variant sites in order to remove the abnormal samples and those with high mutation loss rates. This was all conducted to obtain high-quality SNP data for subsequent research on genetic diversity and phylogenetic trees.

2.1.4. Genetics Analysis

Based on SNP, the population structure of the samples was analyzed through admixture 1.3 software, and the clustering was performed via assuming that the number of clusters (K value) of the samples was 1–10. SPAGeDi 2002 software can be used to estimate the relative kinship between two individuals in a natural population. Through using RAxML Version 8 software, a phylogenetic tree of the samples was constructed based on the maximum likelihood method [24]. Then, gcta 1.91.7beta software was used to perform PCA clustering on the samples, which was then combined with the phylogenetic tree and genetic structure diagram obtained from the above analysis to view the stratification of the population. The vcf-tools program was used based on the sliding window method (the window was set to 3 kb) to calculate the expected heterozygosity (He), nucleotide diversity (Nucleotide Diversity, Pi) and the inbreeding coefficient (Inbreeding Coefficient of an Individual Relative to the Subpopulation, Fis). Lastly, the Shannon–Wiener diversity index, shannon_Index, was used for analysis [25,26,27].

2.2. Chemical Profiling

2.2.1. Total Phenolic Content

The total phenols in the ground tea leaves of the golden camellia group were extracted with a 70% methanol aqueous solution in a 70 °C water bath. Folin’s phenol reagent oxidized the -OH group in the tea polyphenols and showed a blue color. The maximum absorption wavelength was 765 nm, and gallic acid was used as a calibration standard to quantify polyphenols [28,29]. The standard curve was as follows: y = 0.0042x + 0.0103, R2 = 0.9992.

2.2.2. Total Flavonoid Content

Flavonoids are the general term for a class of natural compounds with a benzopyran ring structure. The method used in this study utilizes flavonoids to perform a complex reaction with aluminum salts to generate a yellow complex under alkaline conditions, and its flavonoids are measured at a wavelength of 420 nm. The absorbance, within a certain concentration range, was directly proportional to the content of the flavonoids. Compared with the rutin standard, the total flavonoid content in the test substance was determined in comparison with the rutin standard [30,31]. The standard curve was as follows: y = 0.0011x − 0.0175, R2 = 0.9998.

2.2.3. Total Anthocyanin Content

Procyanidins themselves are colorless. We thus placed them in an ampoule and precisely added 6 mL of hydrochloric acid-n-butanol solution (4.2.1) and 0.2 mL of ferric ammonium sulfate solution (4.2.3). This was then mixed well, sealed with sealing pliers and placed—after heating—in boiling water for 40 min; through this process, dark red anthocyanin ions can be generated. Spectrophotometry was used to measure the anthocyanin ions generated during the hydrolysis of proanthocyanidins at a wavelength of 546 nm, and the proanthocyanidin content in the sample was then calculated [32,33]. The standard curve was as follows: y = 0.003x + 0.0076, R2 = 0.9995

2.2.4. Ellagic Acid Content

We accurately weighed 10 g of fresh goldenrod tea leaves. Next, 100 mL of deionized water was added, which was then beat with a high-speed tissue masher. Furthermore, 50 mL of homogenate was taken and an equal volume of absolute ethanol was added. This was then treated under ultrasonic conditions for 20 min and then centrifuged at 10,000 rpm for 10 min. The supernatant was taken and 50 mL of a 50% ethanol solution was added to the precipitate. The above steps were repeated twice; then, the supernatants were combined and set aside at a volume of 200 mL. These were then filtered with 0.45 μm filter membrane and stored at 4 °C for later use. Next, 20 μL of the sample was injected into a ZORBAX SB-C18 column (4.6 × 250 mm, 5 μm) using ethylbenzene-1.2% phosphoric acid (18:82) with a flow rate of 1 mL/min, as well as a DAD lamp with a wavelength of 254 nm for the purpose of detection [34,35]. The peak area on the standard curve was used to calculate the concentration of the ellagic acid in the sample solution (1 μg/mL, 5 μg/mL, 10 μg/mL, 20 μg/mL, 50 μg/mL, 100 μg/mL).

2.2.5. Data Analysis

Each experiment was repeated three times, and the statistics were performed in Excel 2021. The data were compared with the means and standard errors of different variables using SPSS. The independent sample Duncan’s t test was used, and the significance level was p < 0.05. SPSS19.0 statistical software was used to perform cluster analysis [36,37] and a dendrogram was then constructed. Lastly, Origin2021 was used to create a principal component analysis graph [38].

3. Results

3.1. SNP Calling Based on the Reference Genome

The library construction and sequencing of 90 samples (30 species) were completed, and an average of 200,000 tags per sample were obtained. The average sequencing depth was no less than 10×, thus ensuring Q30 reached 80%. A total of approximately 564.31 Mbp of clean reads and 141.78 Gbp of clean data were obtained, with the Q30 average reaching 92.74%. Finally, we filtered and obtained 80,620 sites, including 75,548 SNPs and 5072 InDels. Please see Figure 1.

3.2. Genetic Relationship and Phylogenetic Analysis

A population genetic structure analysis can provide information on the origin and composition of an individual’s lineage, and it is an important genetic relationship analysis tool. Based on SNP, the population structure of the samples was analyzed through admixture software [39], and clustering was performed assuming that the number of clusters (K value) of the samples was 1–10. We performed cross-validation on the clustering results, and we determined the optimal number of clusters based on the valley value of the cross-validation error rate. The clustering situation was outlined with a K value of 1–10 and the cross-validation error rate was set such that it corresponded to each K value. The optimal K value of this project was 1, which means that there is only one ancestral lineage in all samples, that is, 30 camellia species. All were found to belong to the same ancestor. Kinship itself is a relative value that defines the genetic similarity between two specific materials, or indeed the genetic similarity between any materials. The SPAGeDi [40] software can be used to estimate the relative kinship between two individuals in a natural population. It can be seen from the Kinship clustering heat map, in Figure 2a, that Camellia debaoensis, Camellia mingii and Camellia fascicularis have high genetic similarity; the PCA of the three species also clustered together (Figure 2b). The genetic similarity between Camellia nitidissima and Camellia rostrata was found to be high; the genetic distance between Camellia tianeensis and Camellia pingguoensis was similar; the genetic similarity between Camellia hauna and Camellia libelofilamenta was high; the genetic similarity between Camellia wumingensis and Camellia terminalis was even higher; and the PCA also clustered together. Camellia parvipetala, Camellia micrantha and Camellia xiashiensis have high genetic similarity and were clustered together with Camellia limonia and Camellia multipetala. Camellia longzhouensis, Camellia longgangensis var. patens, Camellia perpetua and Camellia achrysantha all have relatively high genetic degrees and were clustered together using PCA.
As can be seen from Figure 2c, based on the maximum likelihood method, a phylogenetic tree of all samples—based on the maximum likelihood method—was constructed, and it intuitively displays the classification of the samples. The phylogeny based on whole-genome data was well resolved, thereby improving the level of resolution to species and within the species, with at least seven reticulation events in the plants of the Chinese Camellia Scet.chrysantha. In the nuclear-dd-RAD tree, Camellia nitidissima, Camellia nitidissima var.microcurpa, Camellia euphlebia, Camellia tunghinensis and Camellia rostrata came together; Camellia limonia, Camellia xiashiensis, Camellia multipetala, Camellia parvipetala and Camellia micrantha came together; Camellia achrysantha, Camellia longzhouensis, Camellia multipetala var. Patens, Camellia perpetua and Camellia quinqueloculosa grouped together; and Camellia debaoensis, Camellia fascicularis, Camellia mingii, Camellia pingguoensis var. terminalis and Camellia wumingensis were grouped together. Furthermore, among them, Camellia debaoensis, Camellia fascicularis and Camellia mingii were found to be closely related. Camellia impressinervis, Camellia longgangensis and Camellia ptilosperma were closely related and were grouped together. Camellia flavida, Camellia huana, Camellia libelofifilamenta, Camellia pingguoensis and Camellia tianeensis were grouped together. Camellia pubipetala and Camellia chrysanthoides were, with their thin leaves, a branch.

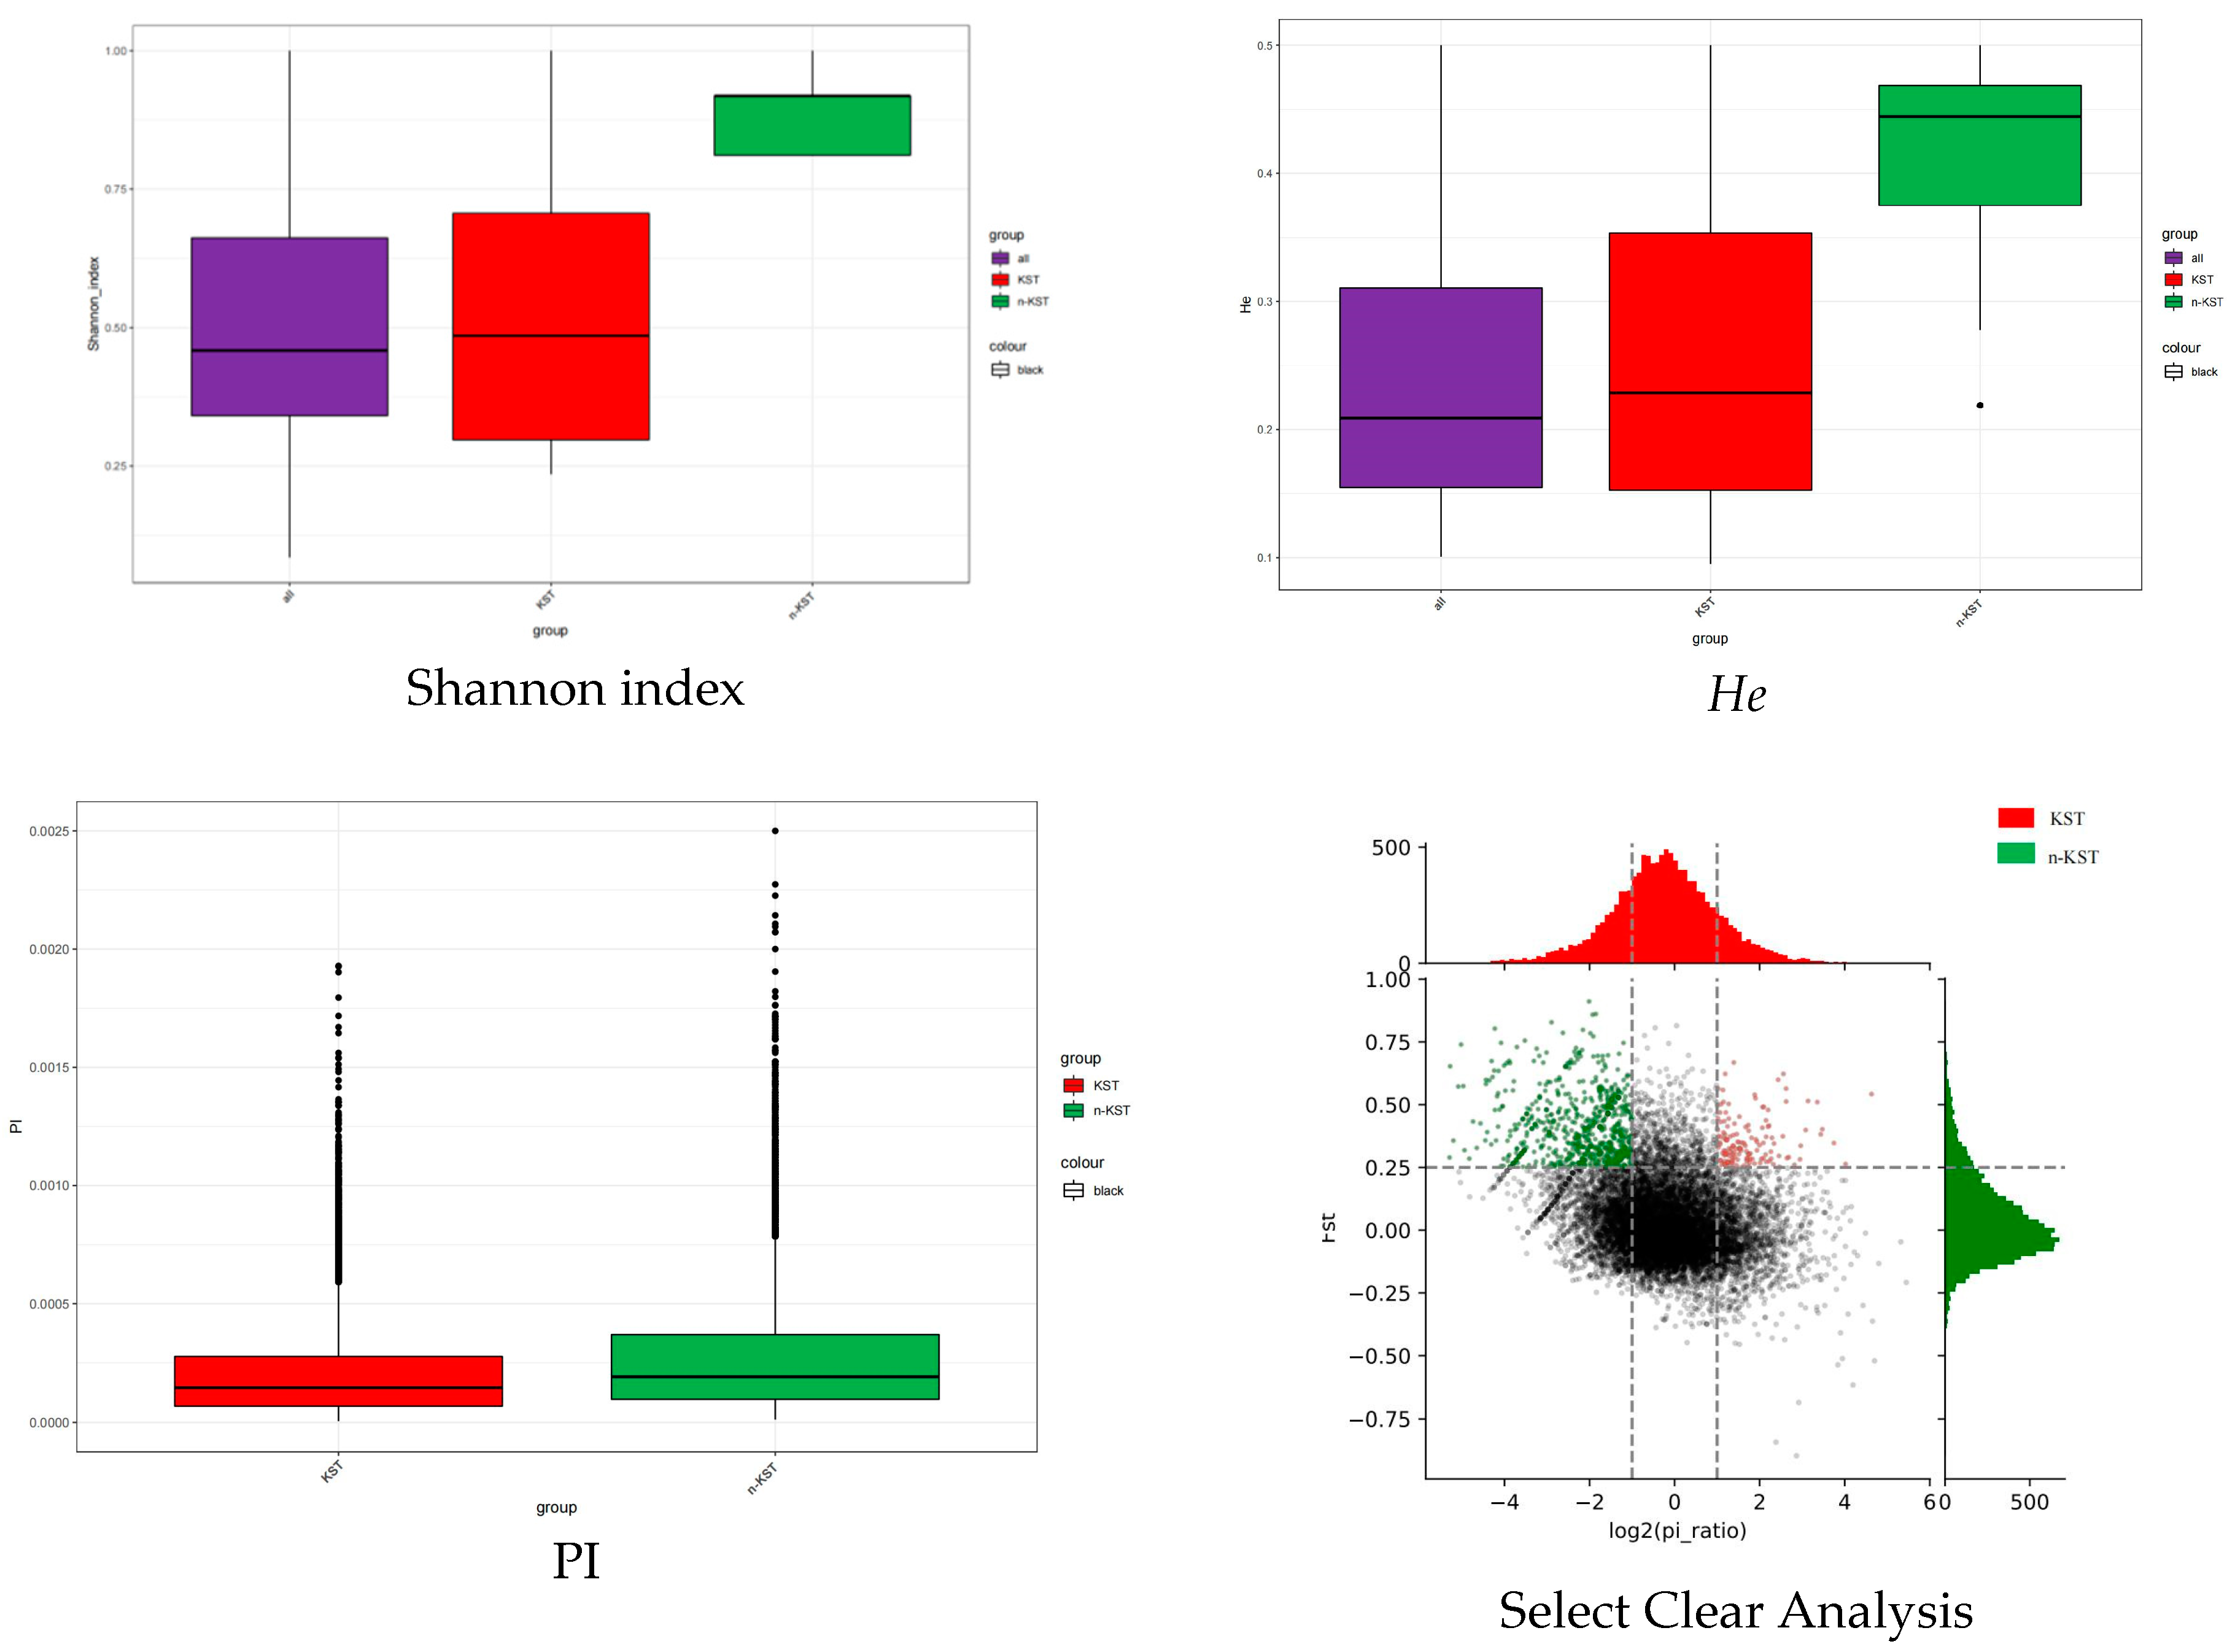
3.3. Comparison of the Genetic Diversity between Karst and Non-Karst

Camellia Scet.Chrysantha plants are widely distributed in karst landforms, and the phenotypic characteristics of plants are affected by the combined effects of genetic genes and the environment. Research on the genetic diversity of golden camellia plant species in karst and non-karst areas will help reveal the factors influencing the phenotypic characteristics of Camellia Scet. Chrysantha plants [25]. The Shannon–Wiener diversity index is an index used to investigate the diversity (α-diversity) of plant communities in local habitats. It can also be used to measure the polymorphism of SNP sites. As can be seen from Figure 3, the genetic diversity index (0.892) in non-karst areas was higher than that in karst areas (0.531). The high genetic diversity of golden camellia was preserved in non-karst areas. The higher the expected heterozygosity value He, the lower the genetic consistency and the richer the genetic diversity of the population. The results showed that the He value (0.259) in karst areas was lower than that in non-karst areas (0.396). The PI values ranged from 0 to 1, with larger values representing higher diversity and smaller values representing lower diversity. The PI value of golden flower tea in karst areas was 0.0002 and that in non-karst areas was 0.00027. Selection elimination analysis was conducted based on two indicators: Fst and PI. The window (3 kb sliding window along the genome) where Fst between different subgroups is greater than 0.25 and log2 (PI ratio) is greater than 1 or less than −1 is subject to strong selection. Regions of stress that are Related to differentiation between different subpopulations, as well as the distribution of genes in these regions, may be associated with the phenotypic differences between the two groups. As can be seen from Figure 3, golden camellia genes in karst areas were selected by the karst natural environment, and polymorphisms were eliminated in order to adapt to the special karst habitats; the genetic diversity of the areas where the species were selected and eliminated was significantly reduced.

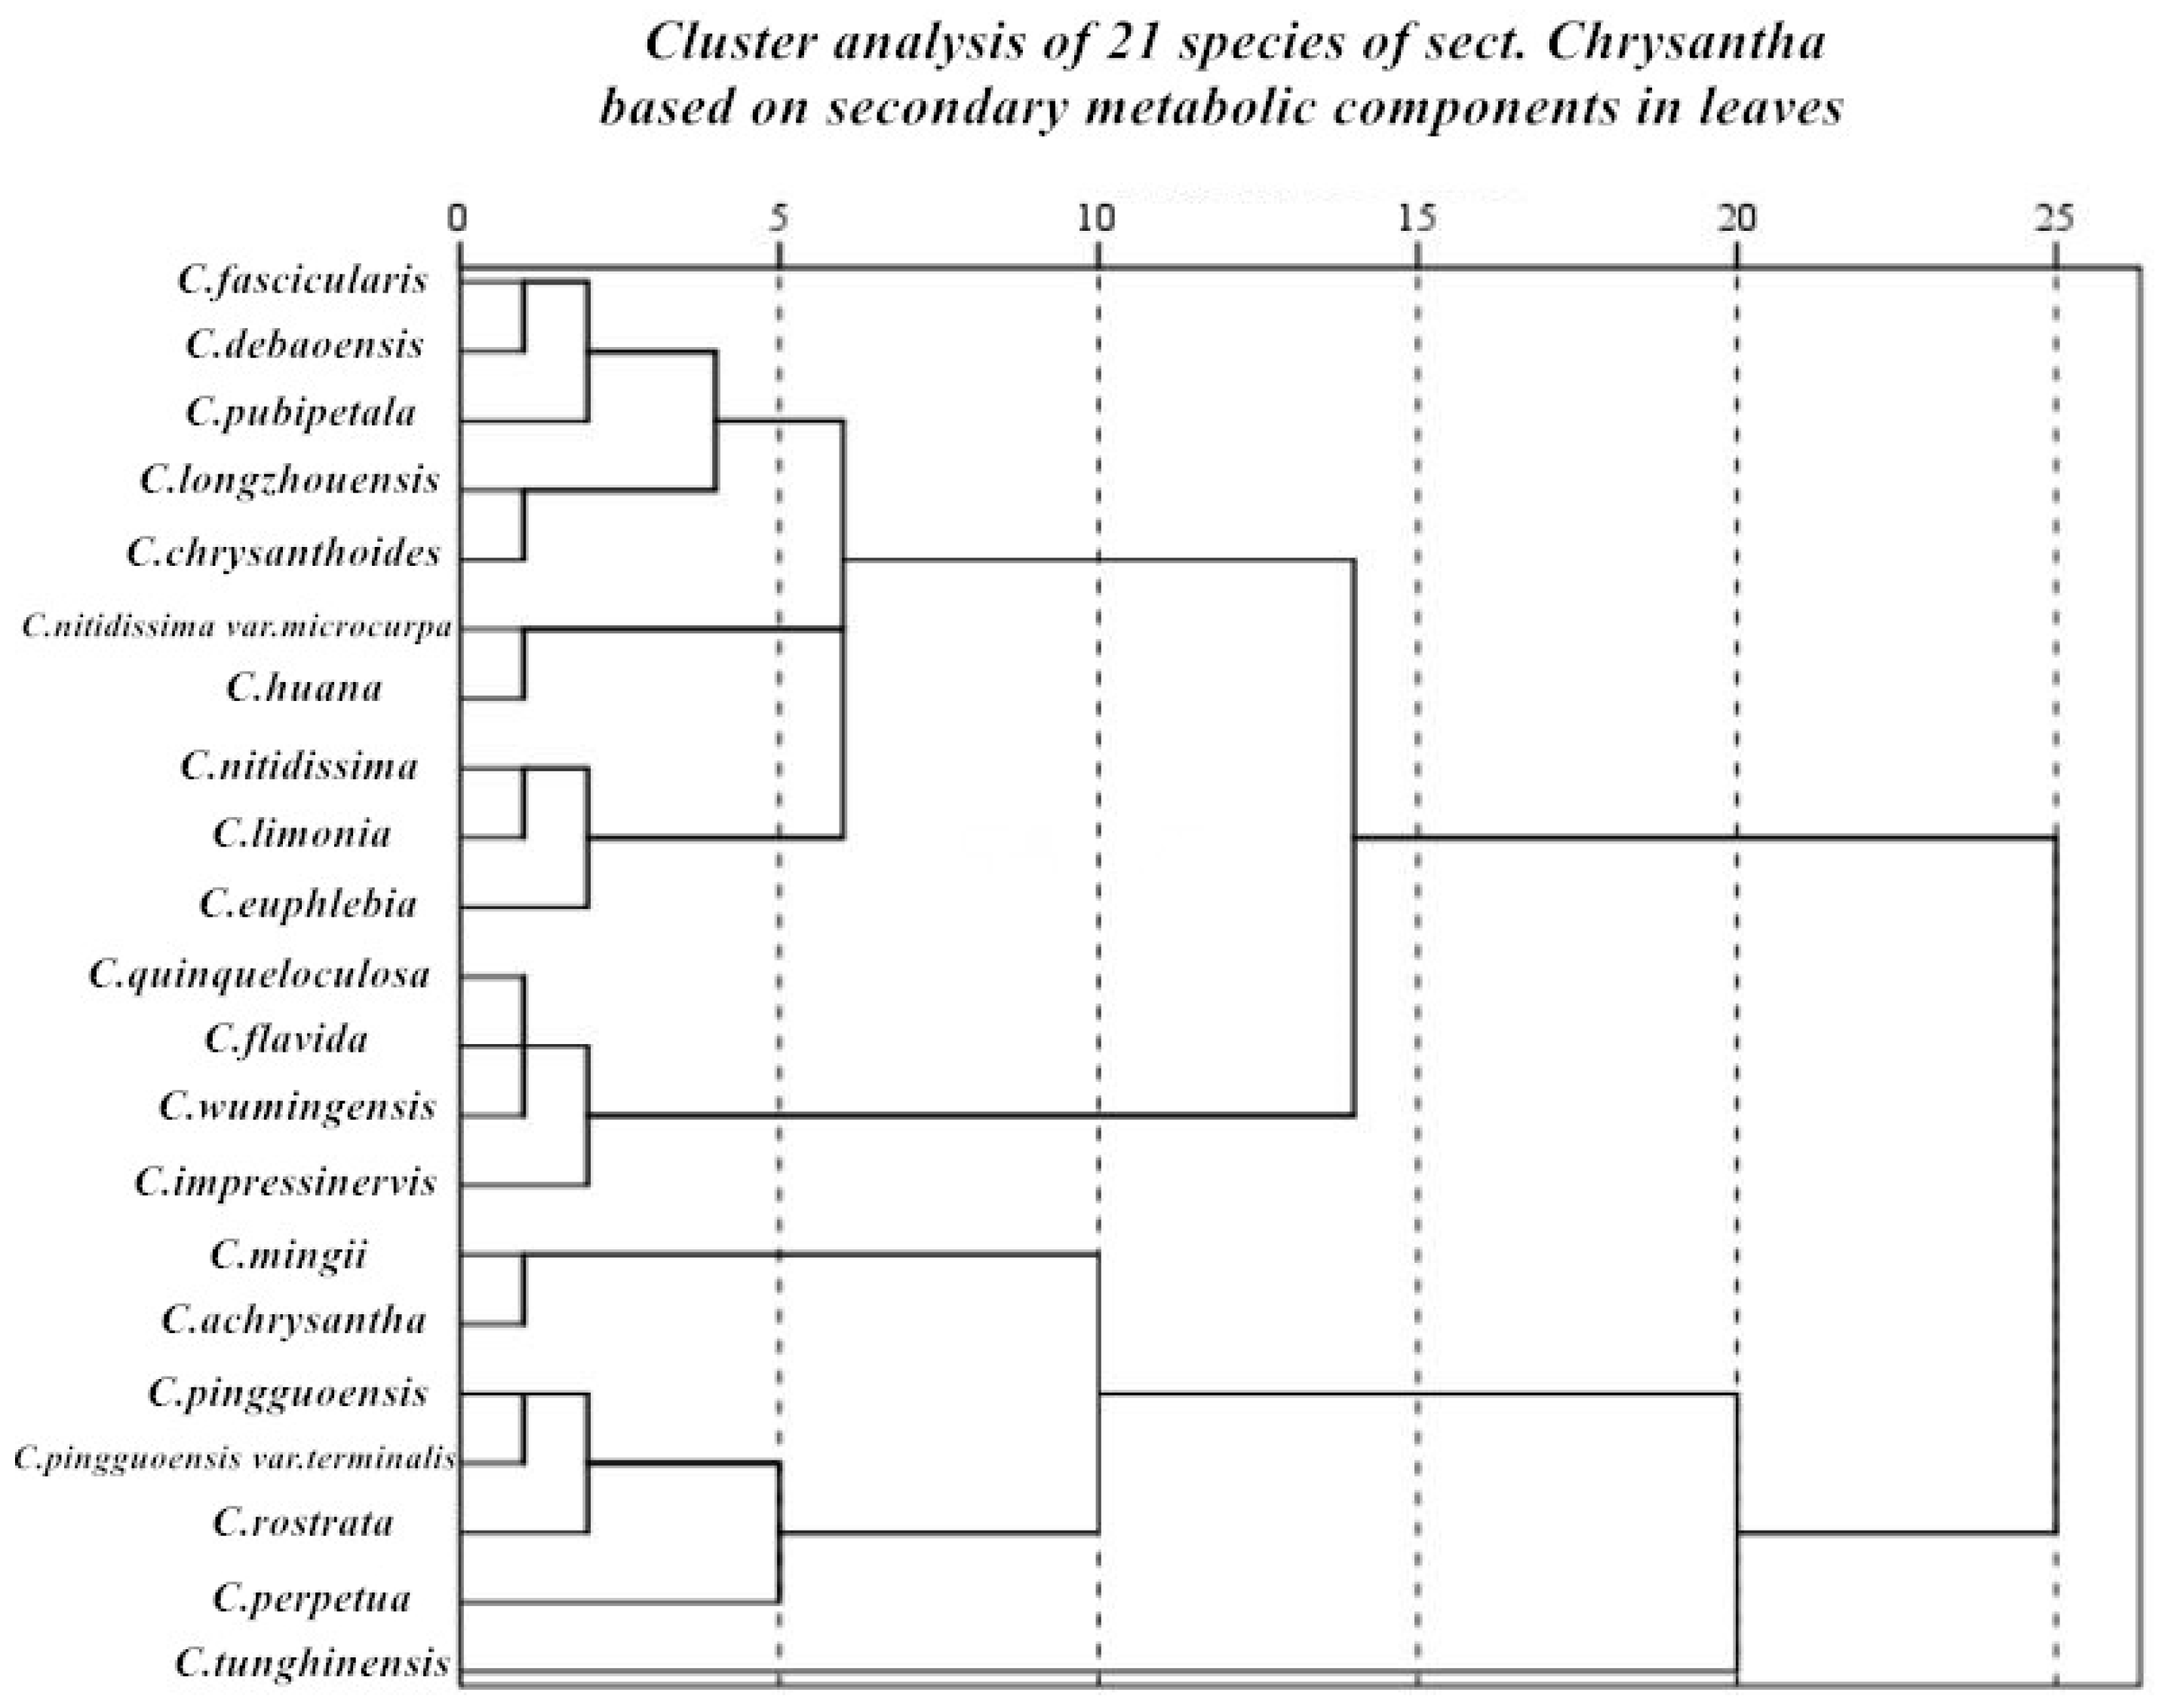
3.4. Chemical Activity and Cluster Analysis of Plant Leaves of Camellia Scet. Chrysantha

3.4.1. Chemical Profile Content Comparative Analysis

Phenols and flavonoids are secondary metabolites of plants that contain at least one aromatic ring and a hydroxyl group; these compounds play an important physiological role in preventing the action of free radicals [41,42]; therefore, they can be used as preventive agents in the human body. They are a good source for treating cardiovascular disease [43,44], cancer [45,46,47], diabetes [48], weight loss and lipid lowering [49,50], and neurodegenerative diseases [51,52]. Using gallic acid and rutin as standards, the total phenolic content (TPC) and total flavonoid content (TFC) of each extract were determined using a colorimetric method with gallic acid and rutin as the standards. The results show that the active ingredients of golden camellia with a karst distribution and non-karst distribution were quite different. The average contents of the total phenols, total flavonoids, total proanthocyanidins and ellagic acid of golden camellia with a karst distribution were 2.339 g/100 g, 0.035 g/100 g, 2.640 g/100 g and 4.891 g/100 g, respectively. These values were all significantly higher than the average contents of the total phenols (1.471), total flavonoids (0.026), total proanthocyanidins (0.616) and total ellagic acid (2.189) in the non-karst distributed golden camellia.
The total phenolic content and total flavonoid content of the leaves of the golden camellia group plants varied greatly. The highest total phenolic content was in Camellia mingii (4.563 ± 0.049 g/100 g), followed by Camellia achrysantha (4.203 ± 0.004 g/100 g). The lowest contents were in Camellia tunghinensis and Camellia huana, both 0.600 g/100 g. In terms of total flavonoids, the performance was inconsistent with the total phenolic content. Among the 21 species of the golden camellia group, the highest total flavonoid content was in Camellia pubipetala (10.718 ± 0.010 g/100 g), followed by Camellia quinqueloculosa (8.133 ± 0.044 g/100 g) and the Camellia flavida (7.013 ± 0.003 g/100 g), and the lowest content was in Camellia tunghinensis (0.368 ± 0.001 g/100 g).
Proanthocyanidin (PC) is a mixture of bioflavonoids with a special molecular structure. Oligomeric proanthocyanidin (OPC) is currently internationally recognized as an effective natural antioxidant that scavenges free radicals in the human body. It is a biological flavonoid with a special molecular structure. Flavonoids are natural antioxidants that are effective in scavenging free radicals in the human body [53,54]. The trend is similar to that of TFC. The highest ones are in Camellia impressinervis (6.560 ± 0.058 g/100 g), Camellia quinqueloculosa (5.720 ± 0.012 g/100 g), Camellia flavida (4.943 ± 0.009 g/100 g) and Camellia pubipetala (4.460 ± 0.058 g/100 g), and the lowest content is Camellia tunghinensis (0.004 ± 0.001 g/100 g).
Ellagic acid is a natural polyphenol component that is widely present in various soft fruits, nuts and other plant tissues. The color reaction between ellagic acid and ferric chloride is one that turns blue; however, when exposed to sulfuric acid, it turns yellow. Ellagic acid has a significant inhibitory effect on chemically induced carcinogenesis and various other cancers, especially on colon cancer, esophageal cancer, liver cancer, lung cancer, tongue and skin tumors, etc. It is mainly used in pharmaceuticals, as well as in additives for health foods and cosmetics, with high potential economic value [55,56,57]. The one with the highest ellagic acid content was found in Camellia limonia (0.090 ± 0.001), followed by Camellia chrysanthoides (0.083 ± 0.003), Camellia achrysantha (0.072 ± 0.001), Camellia perpetua (0.071 ± 0.0003) and then Camellia euphlebia (0.070 ± 0.001). The lowest contents were found in Camellia tunghinensis (0.002 ± 0.0003) and Camellia huana (0.002 ± 0.0011), which also showed a similar trend to the TOC. See Table 2.

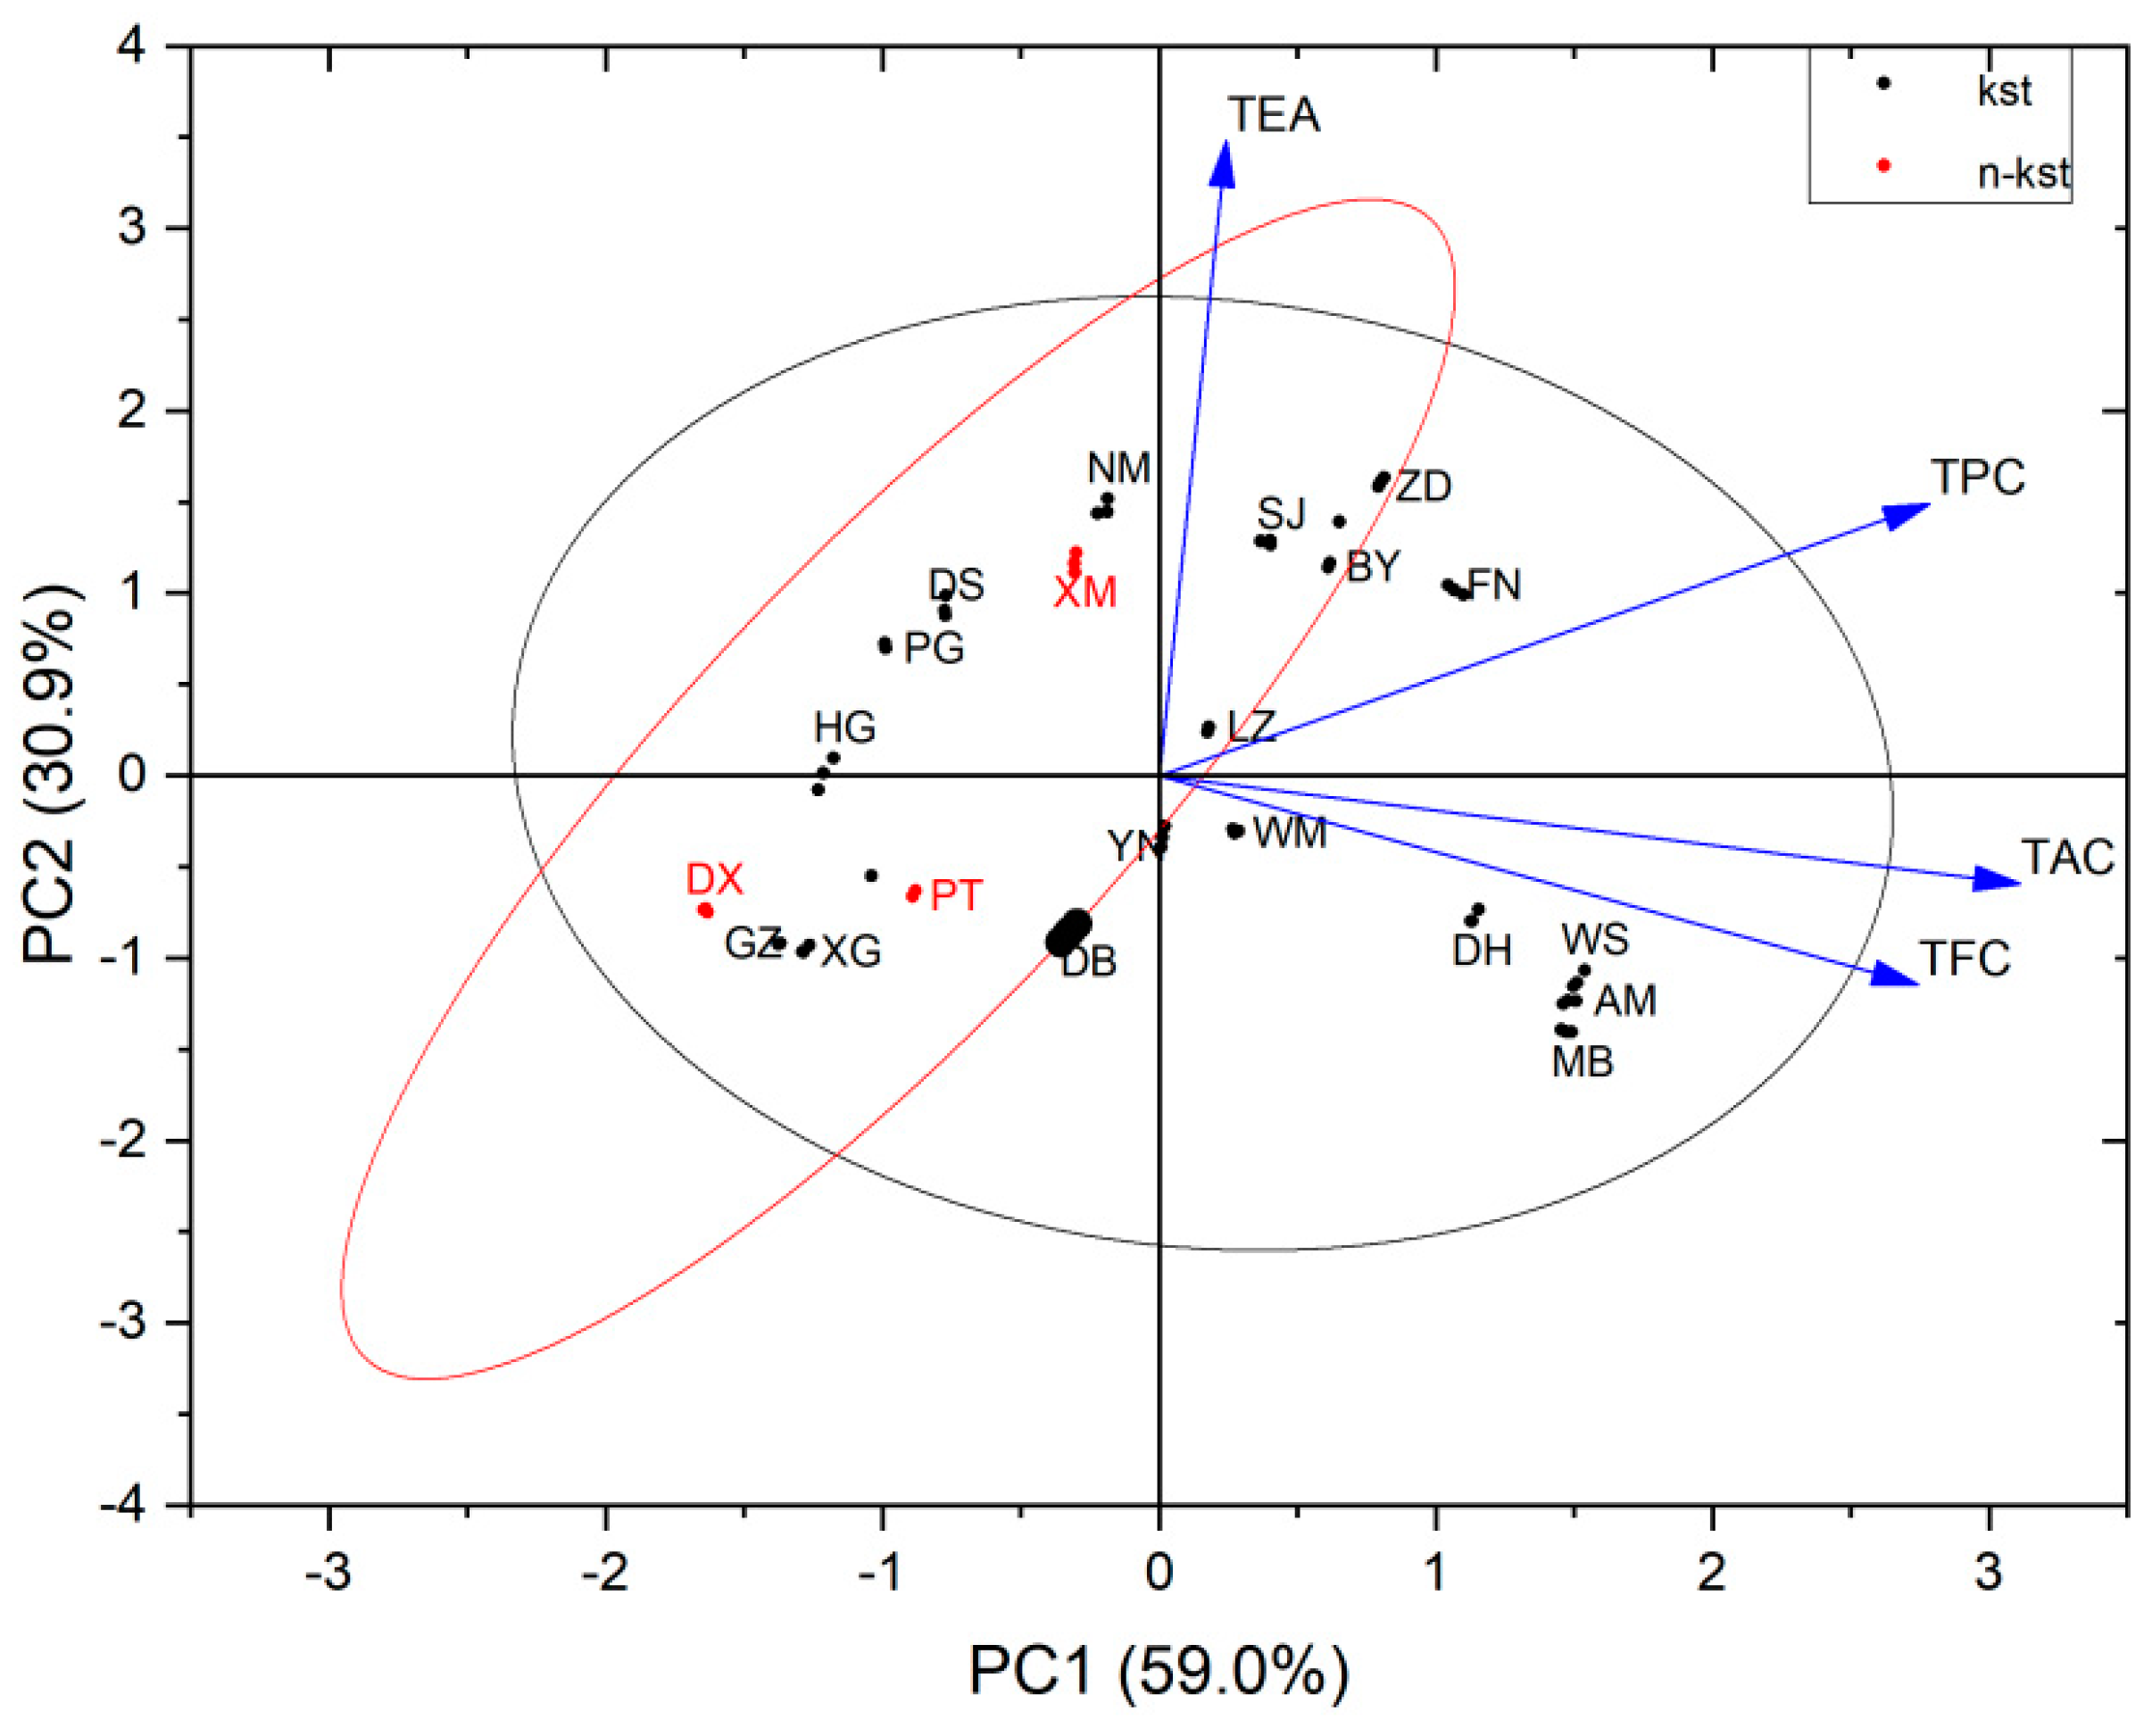
3.4.2. Principal Component Cluster Analysis

As can be seen from Table 3, two principal components were extracted based on the principal component eigenvalue being greater than 1. The first principal component (PC1) had an eigenvalue of 2.359 and a variance contribution rate of 59.0%. The second principal component (PC2) had an eigenvalue of 1.235 and a variance contribution rate of 30.9%. The cumulative variance contribution rate of the two principal components reached 90%, and this reflected 90% of the information of the original evaluation index.
The principal component load matrix reflected the magnitude and direction of the matching action of each evaluation index. As can be seen from the chart, the PCI was mainly integrated into the three indexes of the total phenols, proanthocyanidins and flavonoids, and the variance contribution value reached 59.0%. All of them were positively correlated with PC1, thereby indicating that the higher the content of these three indexes, the greater the PC1 load. The loading values of the total phenols and procyanidins in 21 kinds of golden flower tea were similar, and the loading values of both were higher than that of total flavonoids. In addition, the loading value of the procyanidins in PC1 was higher than that of total phenols, thus indicating that the procyanidins had a greater effect on PC1. Therefore, procyanidins were selected to represent PC1. PC2 mainly synthesized ellagic acid and the total phenol, and the variance contribution value was 30.9%. Both were positively correlated with PC2, thereby indicating that the higher ellagic acid and total phenol contents were, the greater the PC2 load was. The loading value of ellagic acid was significantly higher than that of the total phenol; as such, ellagic acid was chosen to represent PC2. Please see Table 4 and Figure 4.

4. Discussion

4.1. Relationship between Plant Species in Camellia Sect. Chrysantha

dd-RAD technology was used to better classify the plants of the Camellia Sect. Chrysantha; the research results were different from Wei’s grouping of the golden camellia group into 10 reticular events. Because the plants of the Camellia Sect. Chrysantha are all diploid, the hybridization rate between species was relatively low. The high, reproductive barriers were weak, and the hybridization and introgression affected the nuclear gene results of the Camellia Sect. Chrysantha; as such, further verification was needed to accurately infer the grid time. Compared with the results of Wei’s research [21], the species clustering results of the Camellia Sect. Chrysantha were mostly consistent. Camellia nitidissima, Camellia tunghinensis, Camellia nitidissima var. microcurpa and Camellia euphlebia were clustered together; Camellia limonia, Camellia multipetala, Camellia parvipetala and Camellia micrantha were clustered together; Camellia xiashiensis, Camellia pingguoensis var. terminalis and Camellia wumingensis were clustered together; Camellia hauna, Camellia libelofilamenta and Camellia pingguoensis were clustered together; Camellia impressinervis, Camellia longgangensis and Camellia ptilosperma came together; Camellia perpetua, Camellia achrysantha, Camellia quinqueloculosa and Camellia longgangensis var. patens were clustered together; and Camellia chrysanthoides and Camellia pubipetala were clustered together. However, the difference was that our research showed that Camellia longzhouensis grouped with Camellia perpetua, Camellia achrysantha, Camellia quinqueloculosa, Camellia longgangensis var. patens and Camellia longzhouensis. In terms of morphological characteristics, the leaf shape and flower characteristics of Camellia longzhouensis and Camellia longgangensis var. patens were also relatively similar, while the leaf characteristics of Camellia chrysanthoides were found to be quite different from them (and the leaves were also thinner (Figure 5)). Camellia multipetala was a branch with Camellia limonia, Camellia parvipetala and Camellia micrantha. Its flower color was white with yellow, the flowers were small, and the flower characteristics were also found to be relatively similar (Figure 6). The clustering of Camellia rostrata and Camellia nitidissima is inconsistent with the study of Wei [21], which may be related to the number of samples collected. There were particularly few wild resources of Camellia rostrata, and only five strains were found. Based on the simplified genome data, we better interpreted the phylogenetic relationships of the Chinese golden camellia plants, as well as better established their interspecific relationships. Combined with the external morphological analysis results, we provided more information and a scientific basis for the classification of the Chinese Camellia Sect. Chrysantha plants.
Based on the results of dd-RAD, this study showed that the plant species of 30 golden camellia groups were derived from a common ancestor and had the same phenotype. Based on a large number of homologous low-copy nuclear genes, Zhang [58] also confirmed the monophyletism of golden camellia. Since none of the proposed intra-genus parts were monophyletic, rapid diversification may have been the main driving force for the gene tree inconsistencies, which may, in turn, have been influenced by hybridization/introspection, etc. Wei, based on dd-RAD and RNA-seq molecular markers, also detected strong hybridization/introgression signals in the golden camellia group, and the reticular evolution was the main cause of this inconsistent pattern. The topological structure of the phylogenetic tree was found to be inconsistent, which means that the information sites were not comprehensive enough to distinguish the interspecific relationships effectively. In addition, the expression genes of the transcriptomes and metabolomes were inconsistent under different environmental pressure selection. Thus, the phylogenetic comparisons based on selection pressure mechanisms suggested that genes that evolve under different selection forces can provide valuable and complementary information on interspecific relationships and developmental trees [59].

4.2. Effects of the Different Environmental Pressures on the Evolutionary Selection of Camellia Sect. Chrysantha

The smaller the PI value, the lower the nucleic acid diversity of the corresponding population at the location, and the greater the possibility of selection pressure by natural, or other, factors. According to the results, the natural selection pressure faced by the golden camellia group plants distributed in karst areas is greater than that faced by the golden camellia group plants distributed in non-karst areas. According to the expected heterozygosity, He also showed that the polymorphism of golden tea plants in non-karst areas was higher than that in karst areas. The gene of golden camellia in karst areas was selected due to the pressures of the natural environment of karst; likewise, the polymorphism was thus eliminated to adapt to the special habitat of karst. Regional genetic diversity was also significantly reduced through the selective elimination of species. The pressure of different natural environments has caused the inconsistency we see in the gene selection and adaptability of golden camellia, which has affected its evolution and development.

4.3. Principal Component Cluster Analysis

There are still many differences in the interspecific relationships of golden camellia; as such, more evidence is needed to analyze its classification system. The secondary metabolites of plants are also widely used in plant systematics. Li et al. [60] used 25 flavonoid components as chemical markers through which to study the evolutionary relationship of plants in Sect. Camellia. Based on the polyphenol components, Li et al. studied the variety classification and origin of tea trees [61], as well as the relationship between the hybrid offspring of tea trees and their parents. The results showed that the diversity of secondary metabolites in the evolution of seed plants was more influenced by environmental or external factors, while the influence of genetic evolutionary factors was limited. The leaves of golden camellia are its most important taxonomic organ and chemical component research site, and the correlation between the content of secondary metabolic components and plant classification has important research value. Cooperative research was carried out by combining phytochemical secondary metabolism with plant phylogeny, the evolutionary mechanism and plant geography. Not only can phytochemistry be systematically studied from the general pattern of plant phylogeny, but the evidence of phytochemistry can also be used to study plant phylogeny.
Cluster analysis was performed on 21 species of golden camellia using the content of the four effective active ingredients in the leaves of Camellia Sect. Chrysantha plants as parameter combinations (Figure 7). The results showed (Figure 2c) that the dendrogram results were significantly consistent and had a corresponding relationship with the molecular clustering of Camellia Sect. Chrysantha plants. When the distance coefficient was 5, the overall classification could be divided into seven categories. The first category included Camellia fascicularis, Camellia debaoensis, Camellia pubipetala, Camellia longzhouensis and Camellia chrysanthoides; the second category included Camellia nitidissima var. microcurpa and Camellia hauna; the third category included Camellia euphlebia and Camellia nitidissima; and the fourth category included Camellia quinqueloculosa, Camellia flavida, Camellia wumingensis and Camellia impressinervis. These kinds of plant nutrient contents saw the highest relative nutritional value among all the kinds of golden camellia species. Category 5 included Camellia mingii and Camellia achrysantha; Category 6 included Camellia pingguoensisa, Camellia terminalis, Camellia rostrata and Camellia perpetua; and Category 7 included Camellia tunghinensis (which has a relatively low phytonutrient content and a relatively low medicinal value). The research results of the cluster analysis of the active chemical ingredients also proved the classification relationship of dd-RAD—the clustering relationship between Camellia fascicularis and Camellia debaoensis was relatively close; the relationship between Camellia nitidissima, Camellia limonia and Camellia euphlebia was consistent; Camellia wumingensis and Camellia impressinervis were clustered in the same way; and Camellia pingguoensis, Camellia pingguoensis var. terminalis and Camellia pubipetala were clustered together as a whole and were consistent. Based on the cluster analysis of four active ingredients, the similarity rate with Min’s classification system was relatively high [62]. The classification relationship of Camellia nitidissima, Camellia euphlebia and Camellia nitidissima var. microcurpa was similar; moreover, the classification relationship of Camellia flavida and Camellia hauna was also similar. Similarly, Camellia pingguoensis var. terminalis, as a variant of Camellia pingguoensis, can be defined as a species; however, Camellia tunghinensis is a separate category. The diversity and particularity of a species will inevitably lead to a diversity and particularity in the types of phytochemical components. The diversity of the phytochemical components will inevitably lead to a diversity and particularity in biological activities. The distribution of secondary metabolites in the tree of life, if it is selective, will definitely show certain phylogenetic signals [63,64]. Therefore, we can analyze and evaluate the evolutionary relationships between plant groups through the distribution characteristics of secondary metabolites on the evolutionary branches on the plant phylogenetic tree (or tree of life), thereby providing evidence for plant classification and phylogenetic evolution.

5. Conclusions

Compared with previous RAPD, AFLP and SSR molecular marker methods that could not provide sufficient genetic markers and informative loci, the development of SNP markers based on dd-RAD sequencing technology has shown higher feasibility and reliability in taxonomic research on Camellia Sect. Chrysantha, and it is an ideal approach to research that is not limited by the reference genome method. We successfully used dd-RAD sequencing technology to develop 75,548 high-quality SNPs and 5072 InDels from the sample population. Using the SNP genetic information developed with dd-RAD-seq, we conducted a genetic relationship and phylogenetic analysis of 30 species of Camellia Sect. Chrysantha from China. It was found that the Chinese golden camellia group can be divided into seven reticular taxa: Camellia nitidissima, Camellia nitidissima var. microcurpa, Camellia euphlebia, Camellia tunghinensis and Camellia rostrata came together; Camellia limonia, Camellia xiashiensis, Camellia multipetala, Camellia parvipetala and Camellia micrantha came together; Camellia achrysantha, Camellia longzhouensis, Camellia multipetala var. Patens, Camellia perpetua and Camellia quinqueloculosa were grouped together; Camellia debaoensis, Camellia fascicularis, Camellia mingii, Camellia pingguoensis var. terminalis and Camellia wumingensis were grouped together; and, among them, Camellia debaoensis, Camellia fascicularis and Camellia mingii were closely related. Camellia impressinervis, Camellia longgangensis and Camellia ptilosperma were closely related and were grouped together. Camellia flavida, Camellia huana, Camellia libelofifilamenta, Camellia pingguoensis and Camellia tianeensis were grouped together. Camellia pubipetala and Camellia chrysanthoides were one branch. Combined with chemical classification research, a cluster analysis of 21 species of Camellia Sect. Chrysantha also proved the classification relationship of dd-RAD: the first category included Camellia fascicularis, Camellia debaoensis, Camellia pubipetala, Camellia longzhouensis and Camellia chrysanthoides; the second category included Camellia nitidissima var. microcurpa and Camellia hauna; the third category included Camellia euphlebia and Camellia nitidissima; and the fourth category included Camellia quinqueloculosa, Camellia flavida, Camellia wumingensis and Camellia impressinervis. These kinds of plant nutrient contents had the highest relative nutritional value among all of the kinds of golden camellia species studied. The phylogenetic signal refers to the similarity between the related traits that evolved in similar groups on the phylogenetic tree, that is, the correlation of evolution in the similar groups and similarity of traits. The phylogenetic signal can be divided into high and low. When the phylogenetic signal is high, it means that the traits between the similar taxa are similar. According to the phylogenetic information of the genetic and chemical phenotypes, the specific secondary metabolites of golden camellia showed a clustered distribution pattern in specific groups. One group was Camellia pubipetala, Camellia longzhouensis, Camellia chrysanthoides, Camellia debaoensis and Camellia fascicularis; the other group was Camellia quinqueloculosa, Camellia impressinervis, Camellia flavida and Camellia wumingensis. Furthermore, these two groups were categorized according to their leaf parts with high potential medicinal value. The plant groups outlined in this paper have important development potential and application prospects.

Author Contributions

Conceptualization, X.W.; methodology, R.Z.; validation, J.T.; formal analysis, Y.Y. and R.Z.; investigation, S.C. and F.W. (sampling), Y.Y. and Y.J. (sequencing), J.T. (data analysis); writing—original draft preparation, J.T.; writing—review and editing, J.T.; visualization, X.W. and J.T.; supervision, J.T. and R.Z.; funding acquisition, X.W. We also thank the anonymous reviewers for constructive comments. All authors have read and agreed to the published version of the manuscript.

Funding

This study was supported by the projects of the National Natural Science Foundation of China (No. 32160091 and No. 32060248); National key research and development program (No. 2022 YFF1300703); Chinese Academy of Sciences “Light of West China” Program (2022); Guangxi Forestry Science and Technology Promotion Demonstration Project (2023 LYKJ03 and [2022]GT23); Guangxi Key Laboratory of Plant Functional Phytochemicals Research and Sustainable Utilization Independent project (No. ZRJJ2022-2); Guilin Innovation Platform and Talent Plan (20210102-3); and Guilin City Technology Application and Promotion Plan (20220134-3).

Institutional Review Board Statement

Not applicable.

Informed Consent Statement

Not applicable.

Data Availability Statement

All data cited in the study are publicly available.

Conflicts of Interest

The authors declare no conflict of interest. This research was part of the dissertation submitted by the first author in partial fulfilment of a Ph.D. degree. All authors have provided.

References

  1. Wei, X.; Jiang, S.Y.; Jiang, Y.S.; Tang, H.; Cao, H.L. Research progress of rare and endangered plant Camellia nitidissima. Fujian For. Sci. Technol. 2006, 33, 169–174. [Google Scholar]
  2. Gao, H. Construction of Golden Camellia Fingerprint Map and Screening of Excellent Germplasm. Ph.D. Thesis, Minzu University of China, Beijing, China, 2023. [Google Scholar]
  3. Shi, Y.T. Research on the Conservation Genetics of Camellia debaoensis and Camellia mingii Based on Simplified Genome Sequencing Technology. Master’s Thesis, Guangxi Normal University, Guilin, China, 2023. [Google Scholar]
  4. Huang, X.N.; Qi, Y.; Ye, P.M.; Jiang, C.J.; Li, G.E.; Li, Z.H. Research on the Breeding of Two New Golden Camellia Hybrid Varieties. Anhui Agric. Sci. 2021, 16, 54–56+66. [Google Scholar]
  5. Huang, L.D. Registration of new camellia varieties (Part 1). Chin. Flower Gard. 2010, 16, 44–47. [Google Scholar]
  6. Hakoda, N. Pedigree and breeding status of yellow camellia. Rep. Hortic. Cult. Inst. Huiquan Women’s Coll. Hortic. Cult. 2006, 3, 43–69. [Google Scholar]
  7. Nishikawa, H.; Tanabe, R.; Takahashi, K. Deep mountain landscape and golden tea growing environment in Kye Hung County, North Central Vietnam. Landsc. Tech. Rep. Collect. 2023, 2, 42–43. [Google Scholar]
  8. Tang, J.M.; Shi, Y.C.; Liao, Y.Q.; Fan, J.S.; Wei, J.Q.; Wen, X.Y.; Wei, X. Analysis of nutritional components of Camellia nitidissima. Guihaia 2017, 37, 1176–1181. [Google Scholar]
  9. Chen, Y.X.; Lv, S.J.; Wei, J.B. Research progress on the chemical composition and pharmacological effects of Camellia nitidissima. Guangxi Tradit. Chin. Med. 2013, 1, 4–6. [Google Scholar]
  10. Niu, G.J.; Xin, J.H.; Zhu, S.; Wang, W.H.; Chen, Q.Y.; Liang, Y.C. Determination of active ingredients and antioxidant activity of Camellia nitidissima. J. For. Environ. 2015, 35, 165–168. [Google Scholar]
  11. Cao, F.; Fan, L.L. Research progress of Golden Camellia. China Pharm. Ind. 2013, 22, 95–96. [Google Scholar]
  12. Deng, G.Y.; Yang, Z.D.; Lu, T.L. Overview of research on yellow Camellia in China. Guangxi Agric. Biosci. 2000, 19, 126–130. [Google Scholar]
  13. lden Flower Tea series of tea snacks sell well at home and abroad. Mod. Mark. (Bus. Ed.) 2015, 8, 26.
  14. Zhu, X.L.; Tang, J.M.; Qin, H.Z.; Bai, K.D.; Chen, Z.Y.; Zou, R.; Chai, S.F. Contrasting Adaptation Mechanisms of Golden Camellia Species to Different Soil Habitats Revealed by Nutrient Characteristics. Agronomy 2022, 12, 1511. [Google Scholar] [CrossRef]
  15. Ye, C.X.; Xu, Z.R. Research on golden camellia Formation. J. Sun Yat-Sen Univ. Nat. Sci. Ed. 1992, 31, 68–77. [Google Scholar]
  16. Tang, S.Q.; Shi, S.H.; Chen, Y.Q.; Qu, L.H.; Zhang, H.D. RAPD analysis and taxonomic significance of Golden Camellia and related species. J. Sun Yat-Sen Univ. (Nat. Sci. Ed.) 1998, 4, 29–33. [Google Scholar]
  17. Tang, S.Q.; Du, L.F.; Wang, Y. AFLP analysis of the golden camellia Camellia genus. Wuhan Bot. Res. 2004, 22, 44–48. [Google Scholar]
  18. Xiao, Z.; Li, J.Y.; Li, Z.H.; Huang, L.D.; Fan, A.Q.; Jiang, C.J. Using ISSR analysis of genetic relationships among Camellia species. For. Sci. Res. 2014, 1, 71–76. [Google Scholar]
  19. Chen, H.L. Study on the Genetic Diversity and Genetic Structure of Camellia chrysanthoides and Its Related Species. Master’s Thesis, Guangxi Normal University, Guilin, China, 2019. [Google Scholar]
  20. Lu, X.L.; Chen, H.L.; Wei, S.J.; Tang, S.Q. Chloroplast and nuclear DNA analyses provide insight into the phylogeography and conservation genetics of Camellia nitidissima (Theaceae) in southern Guangxi, China. Tree Genet. Genomes 2022, 16, 8. [Google Scholar] [CrossRef]
  21. Wei, S.J.; Liufu, Y.Q.; Zheng, H.W.; Chen, H.L.; Lai, Y.C.; Liu, Y.; Tang, S.Q. Using phylogenomics to untangle the taxonomic incongruence of yellow-flowered Camellia species (Theaceae) in China. J. Syst. Evol. 2022, 61, 748–763. [Google Scholar] [CrossRef]
  22. Zhang, Y.Z. Distribution Patterns of Secondary Metabolites in the Tree of Life of Seed Plants. Ph.D. Thesis, Yunnan University, Kunming, China, 2020. [Google Scholar]
  23. Le, V.A.; Mai Nga, T.X.; Nhi Nguyen, T.; Nguyen, K.O. Genotypic and Phenotypic Diversity of Endemic Golden Camellias Collected from the North of Vietnam. Chem. Biodivers. 2023, 20, e202200843. [Google Scholar]
  24. Alexander, D.H.; Novembre, J.; Lange, K. Fast model-based estimation of ancestry in unrelated individuals. Genome Res. 2009, 19, 1655–1664. [Google Scholar] [CrossRef]
  25. Zhu, X.L.; Zou, R.; Qin, H.Z.; Chai, S.F.; Tang, J.M.; Li, Y.Y.; Wei, X. Genome-wide diversity evaluation and core germplasm extraction in ex situ conservation: A case of golden Camellia tunghinensis. Evol. Appl. 2023, 16, 1519–1530. [Google Scholar] [CrossRef] [PubMed]
  26. Kang, H.M.; Sul, J.H.; Service, S.K.; Zaitlen, N.A.; Kong, S.Y.; Freimer, N.B.; Sabatti, C.; Eskin, E. Variance component model to account for sample structure in genome-wide association studies. Nat. Genet. 2010, 42, 348–354. [Google Scholar] [CrossRef] [PubMed]
  27. Lipka, A.E.; Tian, F.; Wang, Q.; Peiffer, J.; Li, M.; Bradbury, P.J.; Gore, M.A.; Buckler, E.S.; Zhang, Z. GAPIT: Genome association and prediction integrated tool. Bioinformatics 2012, 28, 2397–2399. [Google Scholar] [CrossRef] [PubMed]
  28. Bradbury, P.J.; Zhang, Z.; Kroon, D.E.; Casstevens, T.M.; Ramdoss, Y.; Buckler, E.S. TASSEL: Software for association mapping of complex traits in diverse samples. Bioinformatics 2007, 23, 2633–2635. [Google Scholar] [CrossRef]
  29. Zhang, W.P.; Zhang, Z.Y.; Wang, Y.P.; Jiang, W. Study on extraction process of polyphenols in Camellia nitidissima. Chin. Cosmet. 2003, 2, 114–120. [Google Scholar]
  30. Piyawan, P.; Pensri, T.; Chutharat, T.; Kaewta, D.; Víctor, C. Development of a Digital Microscope Spectrophotometric System for Determination of the Antioxidant Activity and Total Phenolic Content in Teas. Anal. Lett. 2021, 54, 2727–2735. [Google Scholar]
  31. Zhang, P.; Yu, B.; Zou, C.P.; Huang, L.; Zhao, C.Y.; Sun, Y.B. Research progress on biological functions and extraction and separation methods of flavonoids in Camellia sinensis. Guangdong Agric. Sci. 2019, 46, 13–20. [Google Scholar]
  32. Wang, L.L.; Lin, Q.X.; Song, Z.S.; Chen, L. Spectrophotometric determination of total flavonoid content in tea. J. Tea 2021, 25, 740–750. [Google Scholar]
  33. Wu, Y.Y.; Hou, D.Y.; Hui, R.H. Determination of proanthocyanidin content in Tie Guanyin tea and tea stem. J. Anshan Norm. Univ. 2012, 2, 30–33. [Google Scholar]
  34. Ortega Vidal, J.; Ruiz Martos, L.S.S.; Altarejos, J. Proantho cyanidins in Pruning Wood Extracts of Four European Plum (Prunus domestica L.) Cultivars and Their hLDHA Inhibitory Activity. Chem. Biodivers. 2023, 20, e202200931. [Google Scholar] [CrossRef]
  35. Deng, W.J. Study on the conversion law of free ellagic acid and the determination method of raspberry content. Pharm. Today 2023, 6, 431–434. [Google Scholar]
  36. Wang, J.L.; Zhao, L.Y.; Wu, W.L.; Li, W.L.; Zhang, C.H. Change law of ellagic acid in blackberry fruit and its correlation with quality index. South. Chin. Fruit Trees 2023, 3, 154–159. [Google Scholar]
  37. Wang, A.; Huang, X.L.; Liang, X.J.; Wei, X.J.; Li, K.X.; Ma, J.L. Comparison of leaf active ingredient content of 11 species of Camellia sinensis group. Econ. For. Res. 2018, 1, 110–114. [Google Scholar]
  38. Li, X.M.; Li, C.N.; Lu, J.S.; Huang, Z.W.; Cui, X.Q.; Zhang, Z.B.; Bu, C.Y. Analysis and evaluation of flower active components of six yellow Camellia group plants. Food Res. Dev. 2020, 21, 33–37. [Google Scholar]
  39. Zhu, C.H.; Tang, J.M.; Jiang, H.L.; Zou, R.; Qin, H.Z.; Chai, S.F.; Wei, X. Evaluation of nutritional value of Guangxi Yuliang Tiankeng characteristic plant stem Huashan pomelo. J. Guangxi Acad. Sci. 2020, 1, 109–116. [Google Scholar]
  40. Hardy, O.J.; Vekemans, X. SPAGeDi: A versatile computer program to analyse spatial genetic structure at the individual or population levels. Molecular ecology notes. Mol. Ecol. Notes 2002, 2, 618–620. [Google Scholar] [CrossRef]
  41. Wei, X.; Haung, X.X.; Jiang, Y.S.; Tang, H.; Qi, X.X.; Chen, Z.Y. Comparison of the antioxidant activity of three plant extracts from the Golden Camellia group. Chin. J. Tradit. Chin. Med. 2011, 36, 639–641. [Google Scholar]
  42. Jiang, L.N.; Li, J.Y.; Fan, Z.Q.; Tong, R.; Mo, R.H.; Li, Z.; Jiang, C.J. Analysis of polyphenol components in flowers of Golden Camellia plants. For. Sci. Res. 2020, 33, 117–126. [Google Scholar]
  43. Zhang, H.L.; Yu, Q.T.; Wu, Q.X.; Qin, X.M. Research on online screening of antioxidant substances and in vivo antioxidant activity of Yellow Camellia flavonoids based on the action of iron ions combined with high-performance liquid chromatography. Nat. Prod. Res. Dev. 2022, 32, 719–726. [Google Scholar] [CrossRef]
  44. Yan, D.M.; Yao, A.D. Research on the antioxidant properties of Camellia nitidissima polyphenols. J. Henan Univ. Technol. Nat. Sci. Ed. 2009, 30, 42–45. [Google Scholar]
  45. Duan, X.X.; Tang, X.L.; Su, J.J.; Wang, Y.; Li, Y.; Yang, C.; Fu, J.Y. Study on the inhibitory effect of Camellia nitidissima on liver cancer induced by diethylnitrosamine in rats. J. Med. Res. 2006, 35, 14–16. [Google Scholar]
  46. Nong CLChen, Y.X.; He, X.K.; Wei, J.B. Experimental study on the in vitro anti-tumor activity of total flavonoids of Camellia nitidissima. Chin. J. Cancer Prev. Treat. 2013, 4, 324–327. [Google Scholar]
  47. Wang, Z.L.; Guo, Y.J.; Zhu, Y.Y.; Chen, L.; Wu, T.; Liu, D.B.; Du, H.Z. Study on the mechanism of the effective part of Camellia nitidissima inhibiting epidermal growth factor receptor (EGFR) against non-small cell lung cancer. China J. Tradit. Chin. Med. 2021, 46, 5362–5371. [Google Scholar]
  48. Tian, X.C.; Qin, X.M.; Lin, H.J.; Yang, J.Z.; Wei, L. Study on the physical and chemical properties of Camellia nitidissima polysaccharides. J. Chin. Food Sci. 2011, 8, 47–52. [Google Scholar]
  49. Wei, L.; Qin, X.M.; Lin, H.J.; Ning, E.C.; Yang, H. Study on the hypolipidemic function of Camellia nitidissima polysaccharide. Food Sci. Technol. 2008, 33, 247–249. [Google Scholar]
  50. Zhang, H.L. Effect and Mechanism of Golden Camellia Flavonoids on Food-Borne Obesity. Ph.D. Thesis, Guangdong Ocean University, Zhanjiang, China, 2020. [Google Scholar]
  51. Tsoi, B.; Gao, C.; Yan, S.Y.; Du, Q.H.; Yu, H.; Li, P.; Shen, J.G. Camellia nitidissima Chi extract promotes adult hippocampal neurogenesis and attenuates chronic corticosterone-induced depressive behaviours through regulating Akt/GSK3β/CREB signaling pathway. J. Funct. Foods 2022, 95, 105119. [Google Scholar] [CrossRef]
  52. An, L.; Zhang, W.; Ma, G.W.; Wang, Y.S. Neuroprotective effects of Camellia nitidissima Chi leaf extract in hydrogen peroxide-treated human neuroblastoma cells and its molecule mechanisms. Food Sci. Nutr. 2022, 8, 4782–4793. [Google Scholar] [CrossRef] [PubMed]
  53. Zhang, Y.W.; Zhao, L.; Tan, W. Advances in the application of plant proanthocyanidins. Chin. Fruits Veg. 2023, 7, 24–28+41. [Google Scholar]
  54. Liu, H.; Sun, J.; Fei, X.W.; Yu, H.L.; Cui, Y.F.; Song, L.L. Research progress on physiological efficacy and analysis of proanthocyanidins. Food Res. Dev. 2023, 12, 211–217. [Google Scholar]
  55. Zeng, W.; Gu, Z.L. Research progress on the pharmacological effects of ellagic acid. J. Chang. Inst. Technol. 2023, 2, 72–77. [Google Scholar]
  56. Yu, W.D.; Liu, M.; Song, P. Research progress on biological activity and analysis of ellagic acid. Bioprocessing 2023, 21, 83–90. [Google Scholar]
  57. Xia, M.L.; Yin, Y.X.; Xiao, Y.T.; Zheng, S.Z.; Tan, B.; Wang, L.; Chen, J.S. Research progress on the physiological functions of ellagic acid and its application in animal production. Feed. Res. 2023, 11, 149–154. [Google Scholar]
  58. Zhang, Q.; Folk, R.A.; Mo, Z.Q.; Ye, H.; Zhang, Z.Y.; Peng, H.; Yu, X.Q. Phylotranscriptomic analyses reveal deep gene tree discordance in Camellia (Theaceae). Mol. Phylogenetics Evol. 2023, 188, 107912. [Google Scholar] [CrossRef] [PubMed]
  59. Endashaw, T.; Gurja, B.; Abdulfatai, T.; Jianlin, H.; Olivier, H. Whole Genome Resequencing Reveals Genetic Diversity and Selection Signatures of Ethiopian Indigenous Cattle Adapted to Local Environments. Diversity 2023, 15, 540. [Google Scholar]
  60. Li, J.B.; Hashimoto, F.; Shimizu, K. Chemical taxonomy of red flowered wild Camellia species based on floral anthocyanins. Phytochemistry 2013, 85, 99–106. [Google Scholar] [CrossRef]
  61. Li, J.-H.; Nesumi, A.; Shimizu, K.; Sakata, Y.; Liang, M.-Z.; He, Q.-Y.; Zhou, H.-J.; Hashimoto, F. Chemosystematics of tea trees based on tea leaf polyphenols as phenetic markers. Phytochemistry 2010, 71, 1342–1349. [Google Scholar] [CrossRef]
  62. Min, T.L.; Zhang, W.J. Taxonomic issues of the Ancient Tea Group and golden camellia Group. Yunnan Bot. Res. 1993, 1, 1–15. [Google Scholar]
  63. Wu, Q. Study on the Phylogeny of Camellia and the Variation of Its Characteristic Secondary Metabolites. Ph.D. Thesis, Anhui Agricultural University, Hefei, China, 2023. [Google Scholar]
  64. Zhong, C.S.; Lin, Y.L.; Liu, S.C.; Chen, Y.; Lai, Z.X. Research progress on secondary metabolites of Camellia nitidissima. Hortic. Seedl. 2014, 7, 58–62. [Google Scholar]
Figure 1. The distribution of 75548 SNPs on the genome.
Diversity 15 01134 g001
Figure 2. Genetic distance correlation heat map and a systematic classification tree.
Diversity 15 01134 g002
Figure 3. Comparison of genetic diversity of golden camellia taxa distributed in karst and non-karst areas.
Diversity 15 01134 g003
Figure 4. Principal component analysis diagram of four active ingredients.
Diversity 15 01134 g004
Figure 5. Comparison of biological characteristics of Camellia longzhouensis, Camellia longgangensis var. Patens, Camellia quinqueloculosa, Camellia chrysanthoides.
Diversity 15 01134 g005
Figure 6. Comparison of floral characteristics of Camellia multipetala, Camellia limonia, Camellia parvipetala, Camellia micrantha.
Diversity 15 01134 g006
Figure 7. Cluster analysis on 21 species of Camellia Sect. Chrysantha.
Diversity 15 01134 g007
Table 1. Sample collection information and place of origin.
Nm.Scientific NameCodePlace of OriginHabitat In Situ
1Camellia achrysanthaZDGuangxiKarst
2Camellia chrysanthoidesBYGuangxiKarst
3Camellia debaoensisDBGuangxiKarst
4Camellia euphlebiaXMGuangxiNon-Karst
5Camellia fascicularisYNYunnanKarst
6Camellia flavidaDHGuangxiKarst
7Camellia huanaGZGuangxi/GuizhouKarst
8Camellia impressinervisAMGuangxiKarst
9Camellia libelofifilamentaLRGuangxi/GuizhouKarst
10Camellia limoniaNMGuangxiKarst
11Camellia longgangensisNGGuangxiKarst
12Camellia longzhouensisLZGuangxiKarst
13Camellia micranthaXHGuangxiKarst
14Camellia mingiiFNYunnan/GuangxiKarst
15Camellia multipetalaDDGuangxiKarst
16Camellia multipetala var. patensZMGuangxiKarst
17Camellia nitidissimaPTGuangxiNon-Karst
18Camellia nitidissima var. microcurpaXGGuangxiKarst
19Camellia parvipetalaXBGuangxiNon-Karst
20Camellia perpetuaSJGuangxiKarst
21Camellia pingguoensisPGGuangxiKarst
22Camellia pingguoensis var. terminalisDSGuangxiKarst
23Camellia ptilospermaMZGuangxiKarst
24Camellia pubipetalaMBGuangxiKarst
25Camellia quinqueloculosaWSGuangxiKarst
26Camellia rostrataHGGuangxiKarst
27Camellia tianeensisTEGuangxiKarst
28Camellia tunghinensisDXGuangxiNon-Karst
29Camellia wumingensisWMGuangxiKarst
30Camellia xiashiensisXSGuangxiKarst
Table 2. Total phenolic content (TPC), total flavonoid content (TFC), total anthocyanin content (TAC) and ellagic acid content (TEA) in methanolic extracts of 21 golden camellias.
SpeciesTPCg/100 gTEAg/100 gTACg/100 gTFCg/100 g
C. mingii4.563 ± 0.049 m0.048 ± 0.001 g3.950 ± 0.006 n4.064 ± 0.003 i
C. fascicularis1.603 ± 0.009 d0.036 ± 0.001 ef1.743 ± 0.005 i6.970 ± 0.012 o
C. wumingensis2.310 ± 0.015 g0.024 ± 0.0003 cd3.450 ± 0.006 m4.661 ± 0.002 l
C. tunghinensis0.600 ± 0.012 a0.002 ± 0.0003 a0.004 ± 0.001 a0.368 ± 0.001 a
C. rostrata1.217 ± 0.045 b0.028 ± 0.001 de0.479 ± 0.001 c1.083 ± 0.003 b
C. quinqueloculosa3.220 ± 0.047 k0.001 ± 0.0003 a5.720 ± 0.012 q8.133 ± 0.044 s
C. pubipetala2.807 ± 0.003 i0.002 ± 0.001 ab4.460 ± 0.058 o10.718 ± 0.010 t
C. pingguoensis1.403 ± 0.004 c0.039 ± 0.017 fg0.790 ± 0.005 d1.530 ± 0.003 c
C. pingguoensis var. terminalis1.803 ± 0.003 e0.061 ± 0.001 h0.937 ± 0.002 e1.874 ± 0.010 d
C. perpetua3.253 ± 0.029 k0.071 ± 0.0003 h2.430 ± 0.005 k4.437 ± 0.033 j
C. nitidissima var. microcurpa0.617 ± 0.017 a0.002 ± 0.0003 ab0.213 ± 0.009 b2.594 ± 0.004 f
C. nitidissima1.410 ± 0.006 c0.006 ± 0.0003 ab0.801 ± 0.006 d2.614 ± 0.002 f
C. longzhouensis2.405 ± 0.003 h0.045 ± 0.0003 fg2.282 ± 0.002 j5.352 ± 0.002 m
C. limonia2.070 ± 0.035 f0.090 ± 0.001 i1.315 ± 0.003 g4.573 ± 0.001 k
C. impressinervis2.810 ± 0.006 i0.002 ± 0.0003 a6.560 ± 0.058 s7.590 ± 0.006 q
C. huana0.600 ± 0.006 a0.002 ± 0.0011 ab0.004 ± 0.0003 a2.2763 ± 0.003 e
C. flavida3.016 ± 0.017 j0.011 ± 0.001 ab4.943 ± 0.009 p7.013 ± 0.003 p
C. euphlebia2.403 ± 0.004 h0.070 ± 0.001 h1.044 ± 0.001 f3.587 ± 0.007 h
C. debaoensis1.403 ± 0.004 c0.014 ± 0.001 bc1.467 ± 0.005 h5.838 ± 0.002 n
C. chrysanthoides2.805 ± 0.006 i0.083 ± 0.003 i3.276 ± 0.018 l5.840 ± 0.026 n
C. achrysantha4.203 ± 0.004 l0.072 ± 0.001 h3.500 ± 0.012 m3.497 ± 0.012 g
Notes: different letters in the same column represent results with a statistical difference, according to Student’s t-test (p < 0.05).
Table 3. Variance analysis of active ingredient contents in 21 species of Sect. Chrysantha leaves.
Principal Component NumberEigenvaluePercentage of Variance (%)Cumulative (%)
12.35958.98458.983
21.23530.88089.864
30.3358.36498.228
40.0711.772100
Table 4. Principal component load matrix and component score coefficient matrix of the active ingredient.
Active Ingredient IndexFactor Load ValueComponent Score Coefficient Matrix
F1F2F1F2
TPC0.9030.3360.9030.336
TEA0.1820.9250.1820.925
TAC0.958−0.1200.958−0.120
TFC0.701−0.5100.701−0.510
Disclaimer/Publisher’s Note: The statements, opinions and data contained in all publications are solely those of the individual author(s) and contributor(s) and not of MDPI and/or the editor(s). MDPI and/or the editor(s) disclaim responsibility for any injury to people or property resulting from any ideas, methods, instructions or products referred to in the content.

