Abstract
Dokdo, a volcanic island located in offshore waters, is significantly influenced by various currents and the island effect resulting from upwelling events. Despite these factors, there is a limited understanding of the seasonal changes in phytoplankton populations and their relationship with the environmental factors in the waters around Dokdo, even during dramatic shifts in phytoplankton dynamics. We focused on seasonal oceanographic features over three years (2018, 2019, and 2020) to understand the phytoplankton community structure and seasonal species succession. Winter, characterized by thorough mixing, results in high nutrient levels, leading to increased phytoplankton biomass. The dominance of the large-sized diatom Chaetoceros spp. contributes to relatively low diversity (H’: 1.14 ± 0.31). In contrast to the typical coastal waters, spring exhibits dominance by the small nano-flagellates and Cryptomonas spp. associated with a lack of surface nutrients due to increased water temperature. Summer, characterized by strong stratification, shows low phytoplankton biomass but high Chl. a concentrations, possibly influenced by picoplankton and the emergence of dinoflagellates, such as Gyrodinium sp. and Katodinium sp., which increases diversity (H’: 2.18 ± 0.28). In autumn, there is typically a phytoplankton bloom, but in 2019, an unusually low biomass occurred. This was likely due to the intrusion of deep, cold water from the bottom and low-salinity Changjiang diluted water (CDW) from the surface, increasing the water’s stability. This, in turn, led to nutrient depletion, contributing to a rise in diversity (H’: 1.14 ± 0.31). These environmentally complex waters around Dokdo result in a distinct pattern of biodiversity indices, with the highest in summer and the lowest in winter, differing from typical temperate waters. In conclusion, this research highlights the substantial influence of distinctive oceanographic features and nutrient dynamics on the phytoplankton biomass and biodiversity in the Ulleung Basin and Dokdo region. Understanding these patterns is vital for the effective management of marine ecosystems and fisheries resources, emphasizing the necessity for continued long-term monitoring in the vicinity of the Dokdo area.
1. Introduction
Phytoplankton, as primary producers, play a crucial role as the foundational component of the marine food chain, contributing significantly to fishery resources. Given the fundamental role that phytoplankton play in the lower-level ecosystem, it is essential to conduct research that accurately reflects the community composition and seasonal distribution of phytoplankton to comprehensively evaluate the distinct value and ecological function of marine ecosystems. The seasonal dynamics of phytoplankton blooms and species succession are intricately influenced by a combination of both bottom-up environmental factors, such as temperature, light availability, and nutrient loading, and top-down control factors, notably zooplankton grazing [1,2,3]. Regular monitoring of these biotic and abiotic factors provides valuable insights into assessing the patterns of phytoplankton population dynamics within a specific region [4,5].
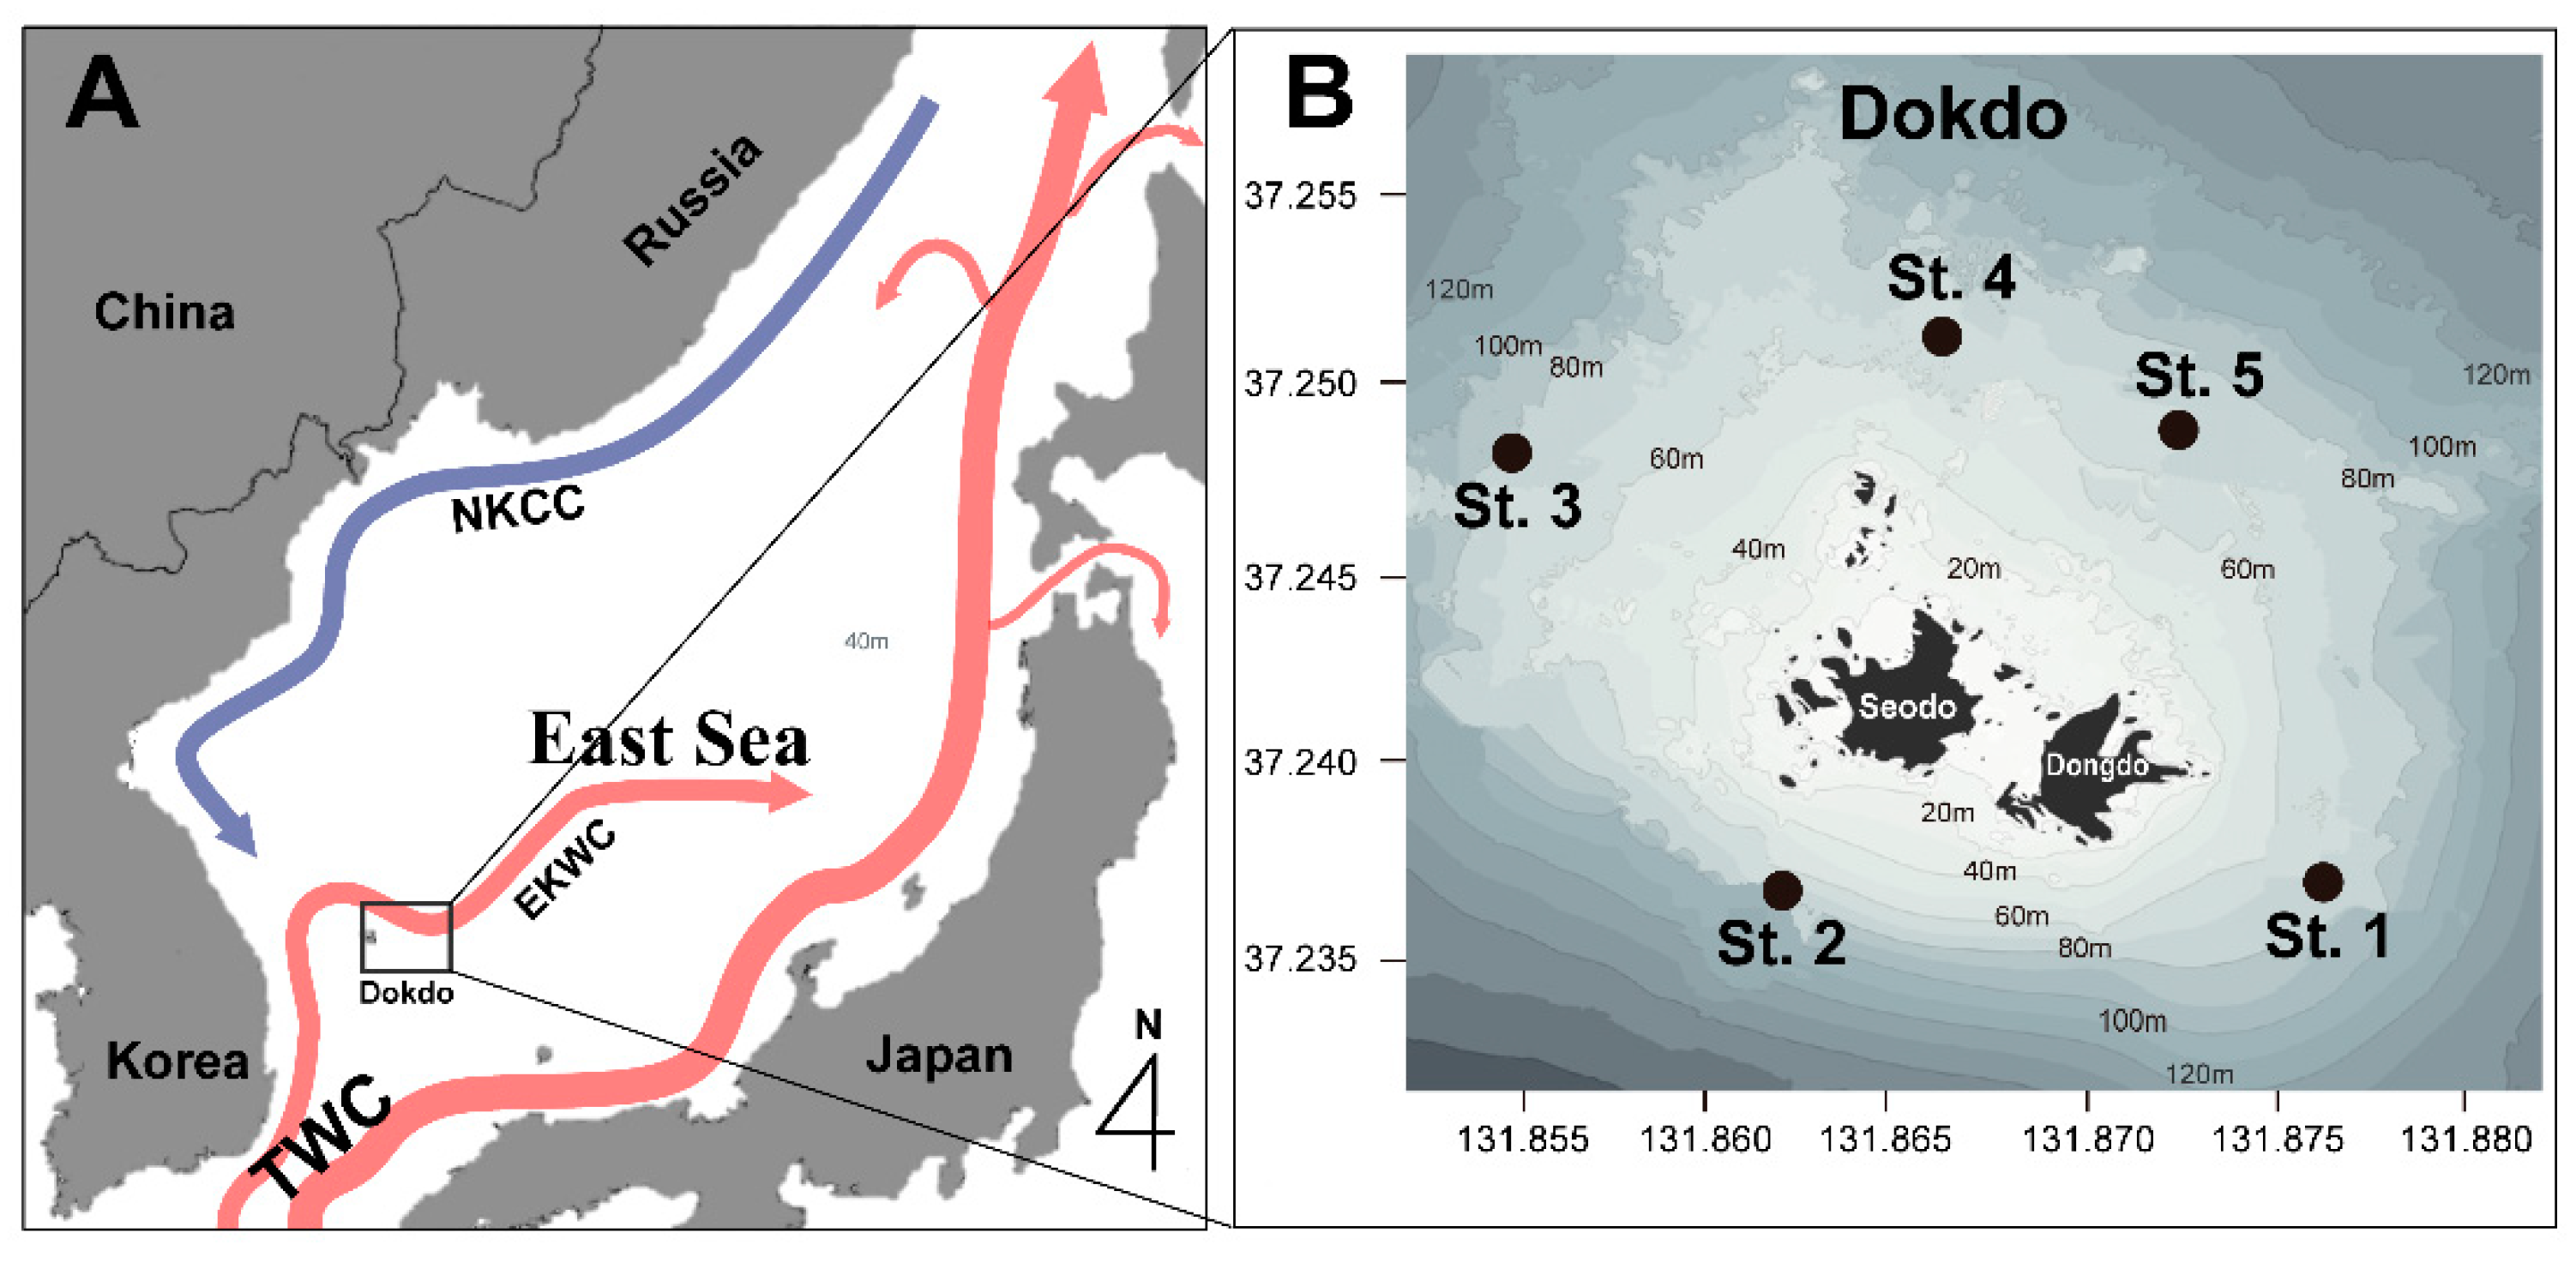
In general, temperate seas tend to have a distinct phytoplankton response to seasonal fluctuations in abiotic environmental factors [4,6,7,8]. Nutrient depletion in surface waters due to stratification during summers and low temperatures and light levels during winters are reasons for the lack of blooms that occur in spring and fall [6,8,9,10]. However, the Ulleung Basin in the East Sea, where our study area of Dokdo (Island) is located, is influenced by a complex interplay of ocean currents, including the North Korean Cold Current (NKCC) flowing from the north, the East Korean Warm Current (EKWC) rising from the south, eddies near Ulleungdo (Island), and coastal upwelling around Ulleungdo and Dokdo [11,12] (Figure 1). This oceanographic complexity, through bottom-up processes, as well as the introduction of suspended organisms via currents around Dokdo, can cause changes in phytoplankton diversity as well as variations that differ from the seasonal successions of phytoplankton in typical-temperature seas [13,14]. With depths of 2000 m and a variety of currents, the East Sea is a small ocean that is well suited to understanding the response of phytoplankton to climate change trends.

Figure 1.
A schematic map of the study area showing the main ocean currents (A): the northward flowing East Korea Warm Current (EKWC), the southward flowing North Korea Cold Current (NKCC), and the Tsushima Warm Current (TWC). The locations of the sampling stations in the waters around Dokdo (B) in the offshore area of Korea.
However, it is not easily accessible and is subject to the influences of weather and wave conditions that can change rapidly in the waters around Dokdo due to its unique geographical and oceanographic attributes. Moreover, access to this area requires permission, which poses limitations on long-term monitoring studies. The Korea Institute of Ocean Science and Technology (KIOST) has been conducting studies in the Ulleung Basin, including Ulleungdo and Dokdo, as a hub for systematic research in marine physics, chemistry, and biology since 2000. While some studies have explored the response of phytoplankton to physical characteristics in the Ulleung Basin [8,15,16], as well as phytoplankton population dynamics and photosynthetic pigments around Ulleungdo and Dokdo [17,18,19], most of these investigations have been limited to short-term studies, and there has been a lack of periodic research centered around Dokdo.
In this study, we aimed to elucidate the seasonal variation in phytoplankton communities, including biodiversity indices in the offshore waters around Dokdo, and understand their relationship with environmental factors based on a three-year survey from 2018 to 2020. This study is anticipated to contribute to the accumulation of ecological data for predicting fluctuations in phytoplankton in the waters around Dokdo and supporting the establishment of sustainable utilization plans for Dokdo.
2. Materials and Methods
This study was conducted in the waters around Dokdo, including East and West Dokdo, which extend from 37°14.1′ to 37°15.1′ latitude and 131°51.2′ to 131°52.5′ longitude. Dokdo is located approximately 87.4 km east of Ulleungdo and about 220 km from Pohang, marking the easternmost point of the Republic of Korea (Figure 1). We used research vessels from the Korea Institute of Ocean Science and Technology (KIOST), namely the R/V Jangmok and R/V Eeodo, to conduct seasonal surveys four times over three years in 2018, 2019, and 2020 (in February, May or June, August, and October). During the survey periods, temperature and salinity measurements were taken at the surface, intermediate, and deep layers using a CTD (SBE911plus, Sea-Bird Electronics, Inc., Washington, DC, USA) attached to the research vessels. Surface water samples were collected using a bucket, while samples from the intermediate and deep layers (3–5 m above the seabed) were collected using a 10 L PVC Niskin sampler (General Oceanics, Miami, FL, USA) attached to a Rosette Multi-sampler.
To analyze the concentrations of inorganic nutrients, 0.5 L of each water sample was immediately filtered through a 47 mm diameter GF/F filter (Whatman, Middlesex, UK) and placed in acid-cleaned polyethylene bottles, followed by the addition of HgCl2. The filtered seawater was stored at −20 °C in the dark until laboratory analysis. Ammonia, nitrate, nitrite, phosphate, and silicate concentrations were determined using a flow injection autoanalyzer (Quattro 39; Seal Analytical, Fareham, Hampshire, UK). All nutrient concentrations were calibrated using reference materials for nutrients in seawater (KANSO Technos Co., Ltd., Osaka, Japan). For the analysis of phytoplankton composition, 0.5 L of seawater was sampled and fixed with 0.5% Lugol’s solution at all stations. The fixed samples were concentrated to approximately 50 mL by decanting the supernatant. A Sedgewick-Rafter counting chamber and a light microscope (Carl Zeiss; 37081 Gottingen, Germany) were then used to identify and quantify phytoplankton at 100×, 200×, and 400× magnifications.
Measures of phytoplankton diversity for each sample were determined based on the number of species in the samples from the surface, middle, and bottom layers using the Shannon–Weaver diversity index (H’) and Pielou’s evenness index (J’), a measure of the similarity in the numbers of different species:
where Pi is the total number of individuals in a species, and S is the total number of species. In addition, Margalef’s richness index (d), which accounts for sampling bias, was calculated as follows:
where n is the total number of individuals in the sample.
J′ = H′/ln(S)
d = (S − 1)/ln(n)
For the phytoplankton community analysis, cluster analysis (group average) and non-metric multidimensional scaling (MDS) ordination, based on the Bray–Curtis similarity index, were performed on species abundance data using Primer version 5 software. The statistical significance was determined with a p-value below 0.05. Differences in abiotic and biotic factors, including phytoplankton abundance and biodiversity indices, among three vertical depths (see below), were assessed using the non-parametric Kruskal–Wallis test, followed by the non-parametric Mann–Whitney U-test and was performed with the Bonferroni correction for post hoc pairwise comparisons (p = 0.017, corresponding to p < 0.05/3) using SPSS version 25 (Chicago, IL, USA). To investigate the relationships between the dominant phytoplankton community and the environmental factors, including temperature, salinity, ammonia, nitrate + nitrite, phosphate, and silicate, principal component analysis (PCA) was employed in R version 4.2.1. with the functions of prcomp and biplot, along with the package of ellipse to determine the 95% confidence regions.
3. Results
3.1. Abiotic Factors
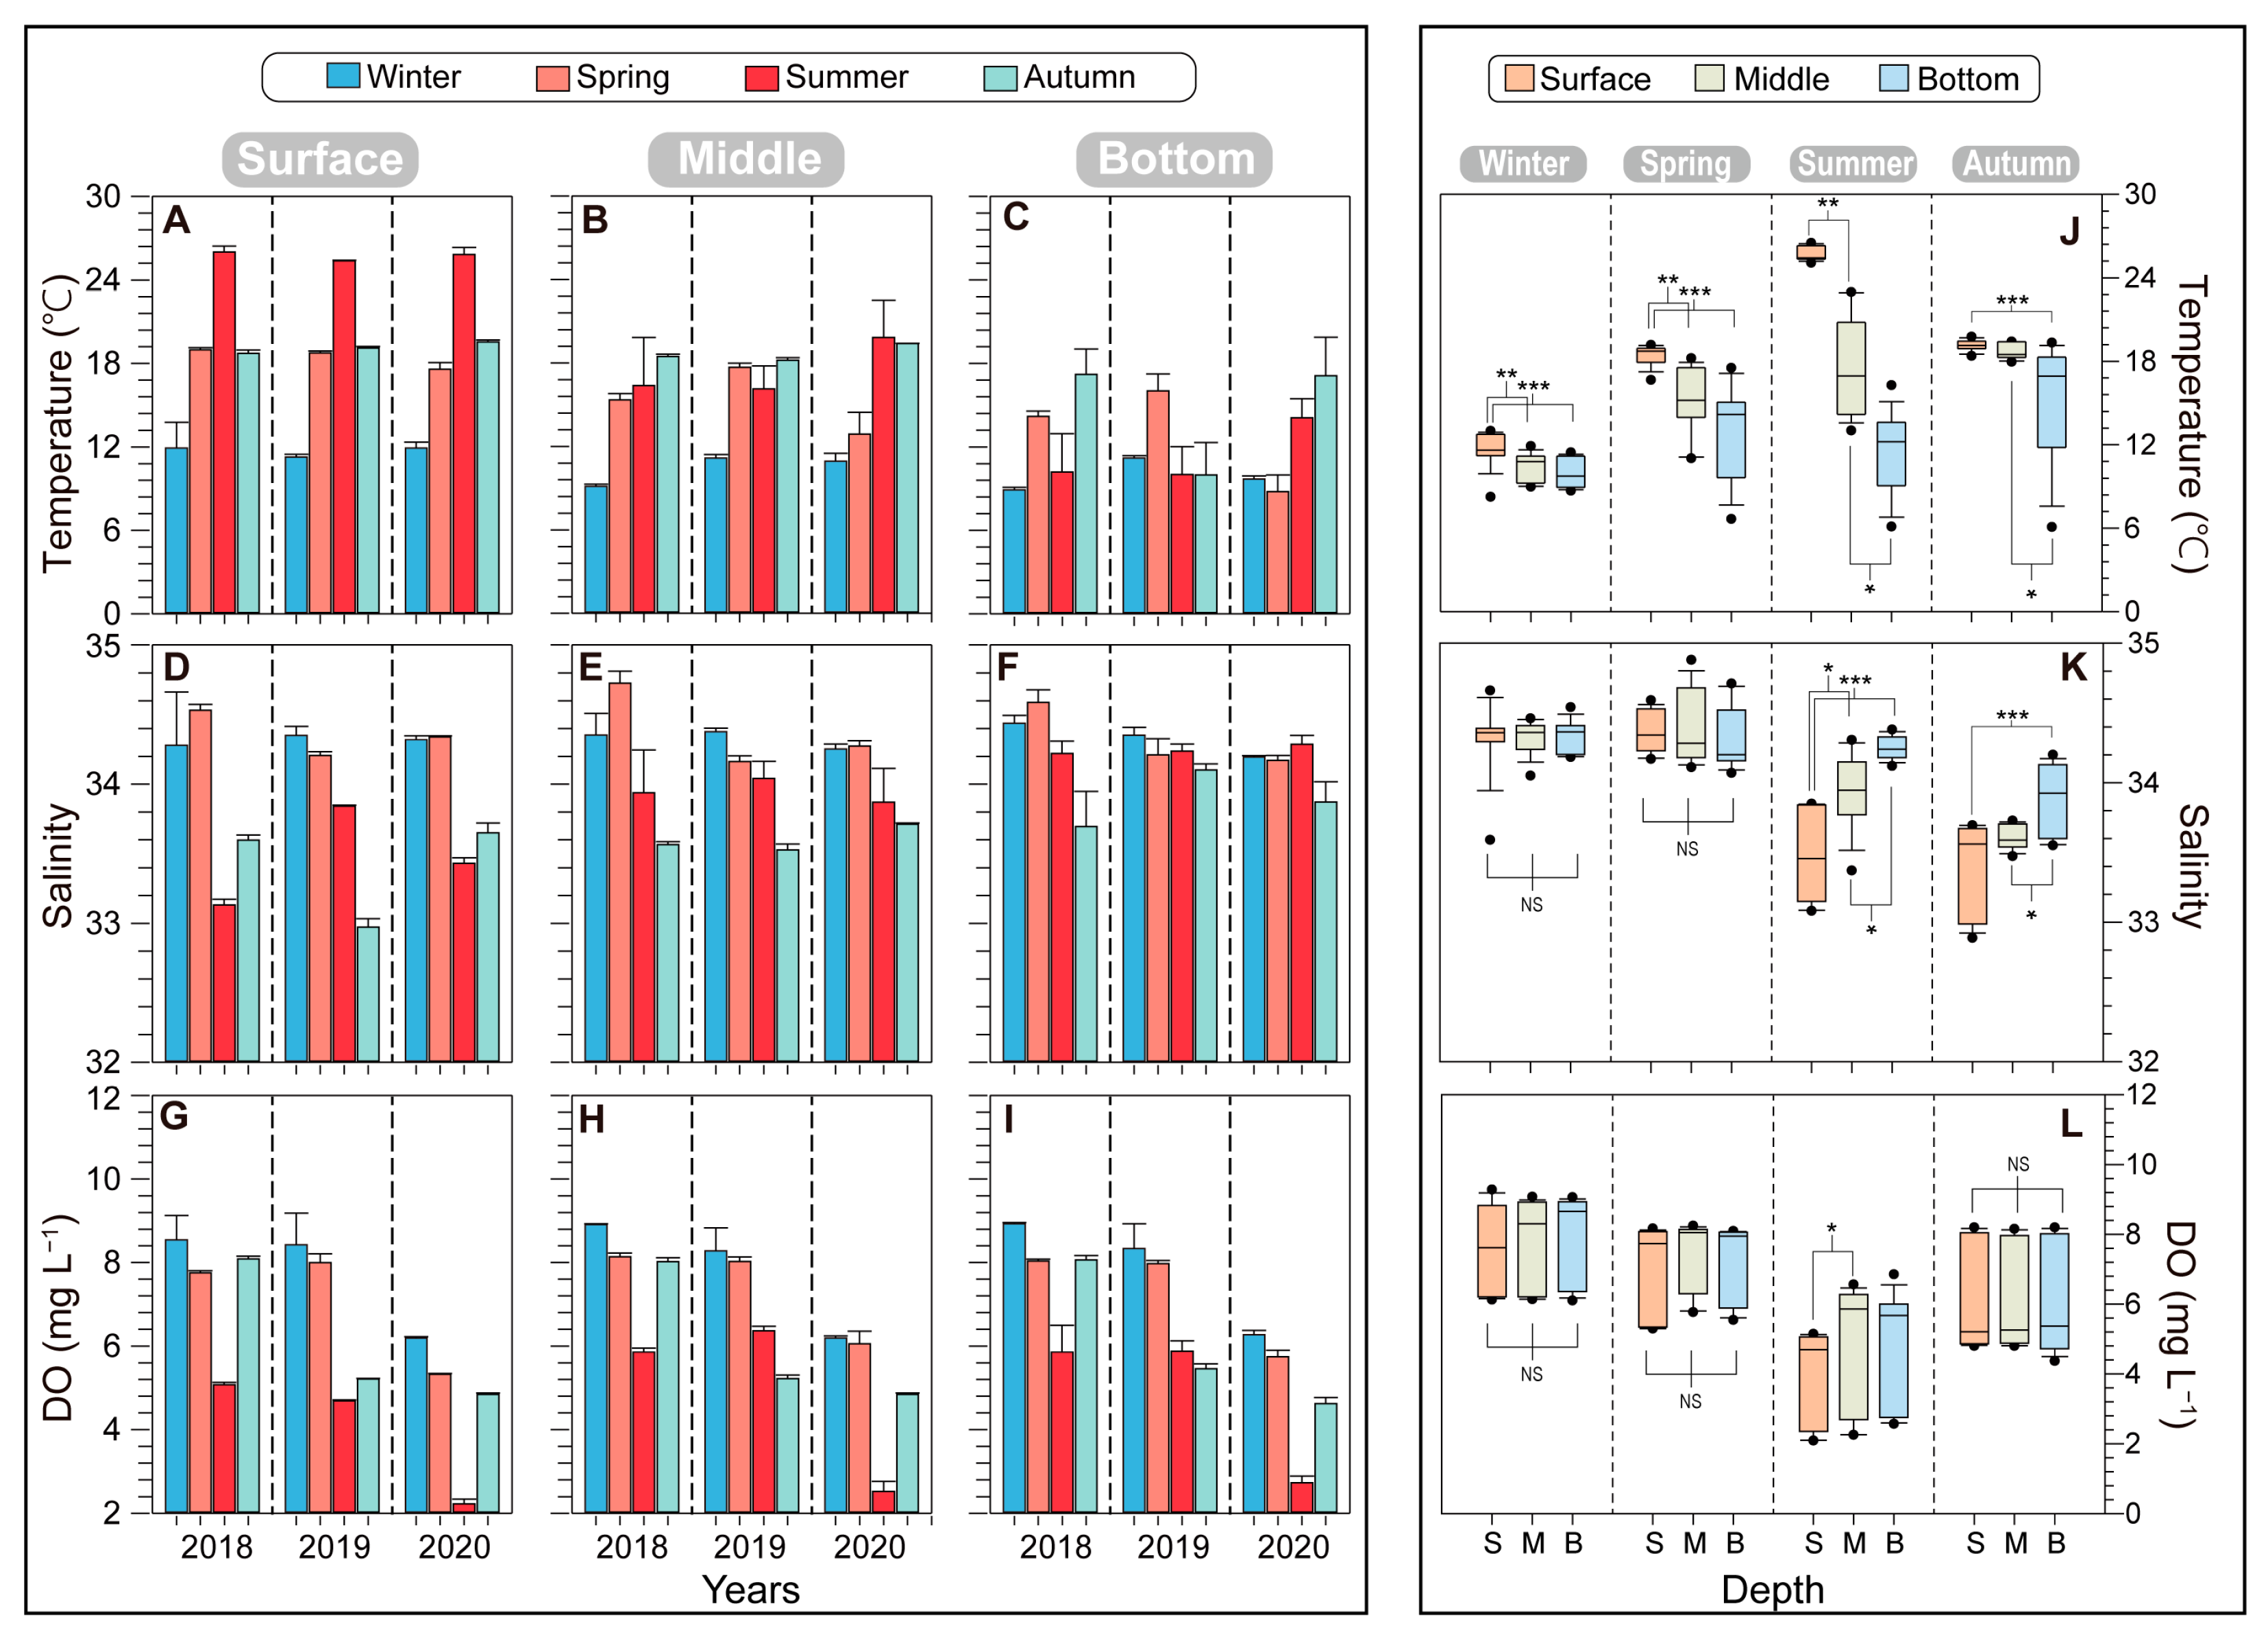
The lowest temperatures were recorded during winter, while the highest occurred in summer, reflecting the typical seasonal pattern observed in temperate oceans. In winter, the surface water temperature was consistently around 11.71 ± 0.38 °C over the three years. The surface water temperature gradually increased from spring (18.44 ± 0.75 °C) to summer (25.73 ± 0.34 °C), and there was a significant difference between these two seasons (p < 0.001). During autumn, the surface temperature was 19.13 ± 0.40 °C. Notably, in autumn 2019, the bottom layer temperature dropped to 10 °C, which was significantly lower than in the other two autumn seasons (17.21 °C in 2018 and 17.11 °C in 2020) (Figure 2A–C). Salinity ranged from 32.97 to 34.72 over the three years, displaying an increasing trend from the surface to the bottom layers. Surface salinity was relatively low in summer and autumn and high in winter and spring. The depth-dependence of salinity was more pronounced during summer. Seasonally, dissolved oxygen (DO) levels were lower in summer and higher in winter (winter: 7.79 ± 0.06 mg L−1; spring: 7.23 ± 0.19 mg L−1; summer: 4.58 ± 0.50 mg L−1; winter: 6.04 ± 0.01 mg L−1) (Figure 2G–I). The DO levels did not significantly differ among water depths; however, the variations were distinct based on the year and season.

Figure 2.
Seasonal variations in environmental factors, including temperature (A–C), salinity (D–F), and dissolved oxygen (DO; G–I), at different depths of five stations from 2018 to 2020 in the vicinity of Dokdo. The error bars represent the variations among the five stations. The boxplots are comparisons of temperature (J), salinity (K), and DO (L) by depth combining three years of data. Asterisks indicate significant differences between treatments (* p < 0.05, ** p < 0.01, *** p < 0.001).
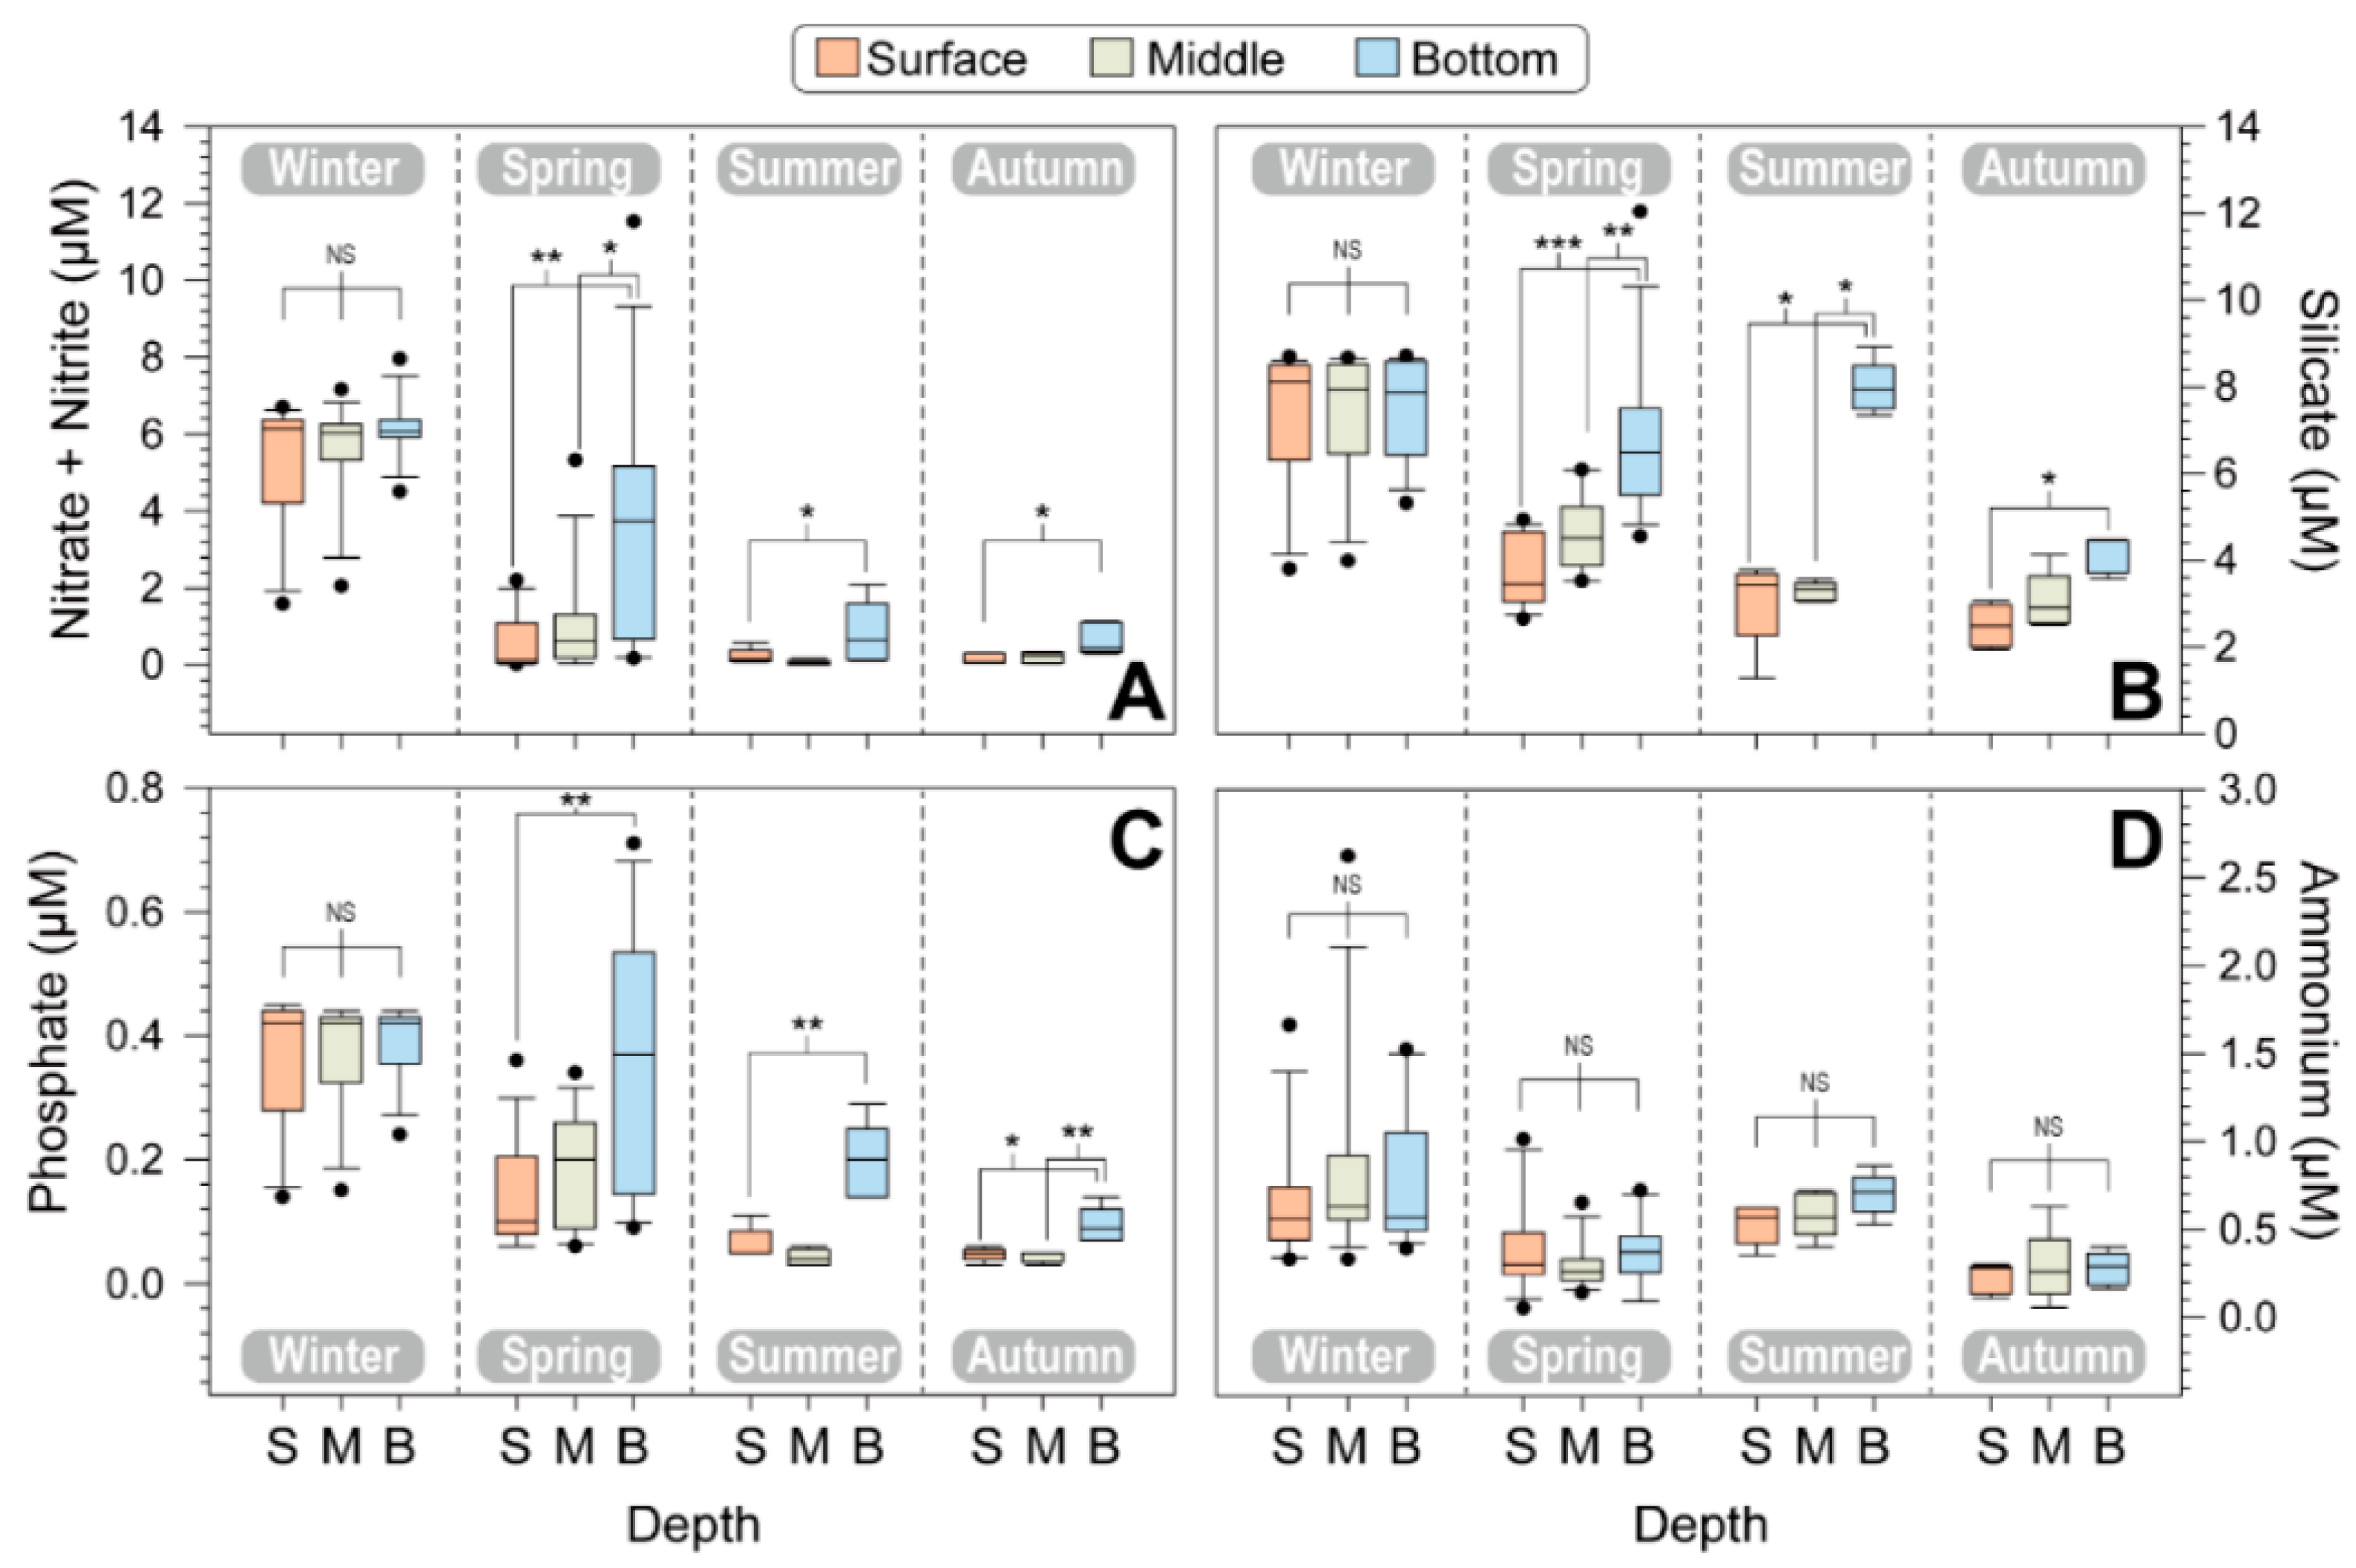
The major nutrients, including nitrate + nitrite, silicate, phosphate, and ammonium, did not exhibit significant differences during the winter across the three water columns (p > 0.05; Kruskal–Wallis test), indicating that the water was vertically mixed (Figure 3), and their concentrations were significantly higher in winter compared to other seasons.
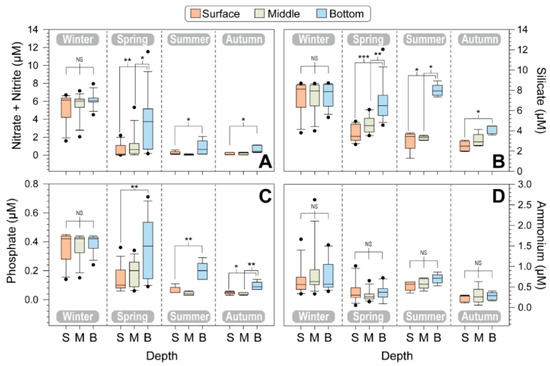
Figure 3.
Seasonal variations in nutrients, including nitrate + nitrite (A), silicate (B), phosphate (C), and ammonium (D), at different depths of five stations. The boxplot shows the surface, middle, and bottom layers for each season and different water depths. The error bars represent the variations among the five stations. Asterisks indicate significant differences between treatments (* p < 0.05, ** p < 0.01, *** p < 0.001).
The surface nitrate + nitrite concentration was 5.31 ± 1.83 μM in winter, 0.53 ± 0.77 μM in spring, 0.22 ± 0.20 μM in summer, and 0.15 ± 0.14 μM in autumn. Specifically, the surface nitrate + nitrite concentration decreased from spring to summer and remained at low levels in autumn. The surface silicate concentration was high in winter, while its concentration was relatively low from spring to summer. Silicate levels were high in the bottom layer during all four seasons. The phosphate concentration ranged from 0.03 μM (lower limit of detection) to 0.71 μM. The average phosphate concentrations at the surface were 0.37 μM in winter, 0.14 μM in spring, 0.06 μM in summer, and 0.05 μM in autumn. Although the phosphate levels were low in the surface layer of the euphotic zone, they were relatively high in the bottom layers, especially during summer and autumn. Notably, ammonium levels were detected at low levels, and there were no significant vertical profile differences among the three water layers during all four seasons (p > 0.05).
3.2. Biotic Factors in Microcosms
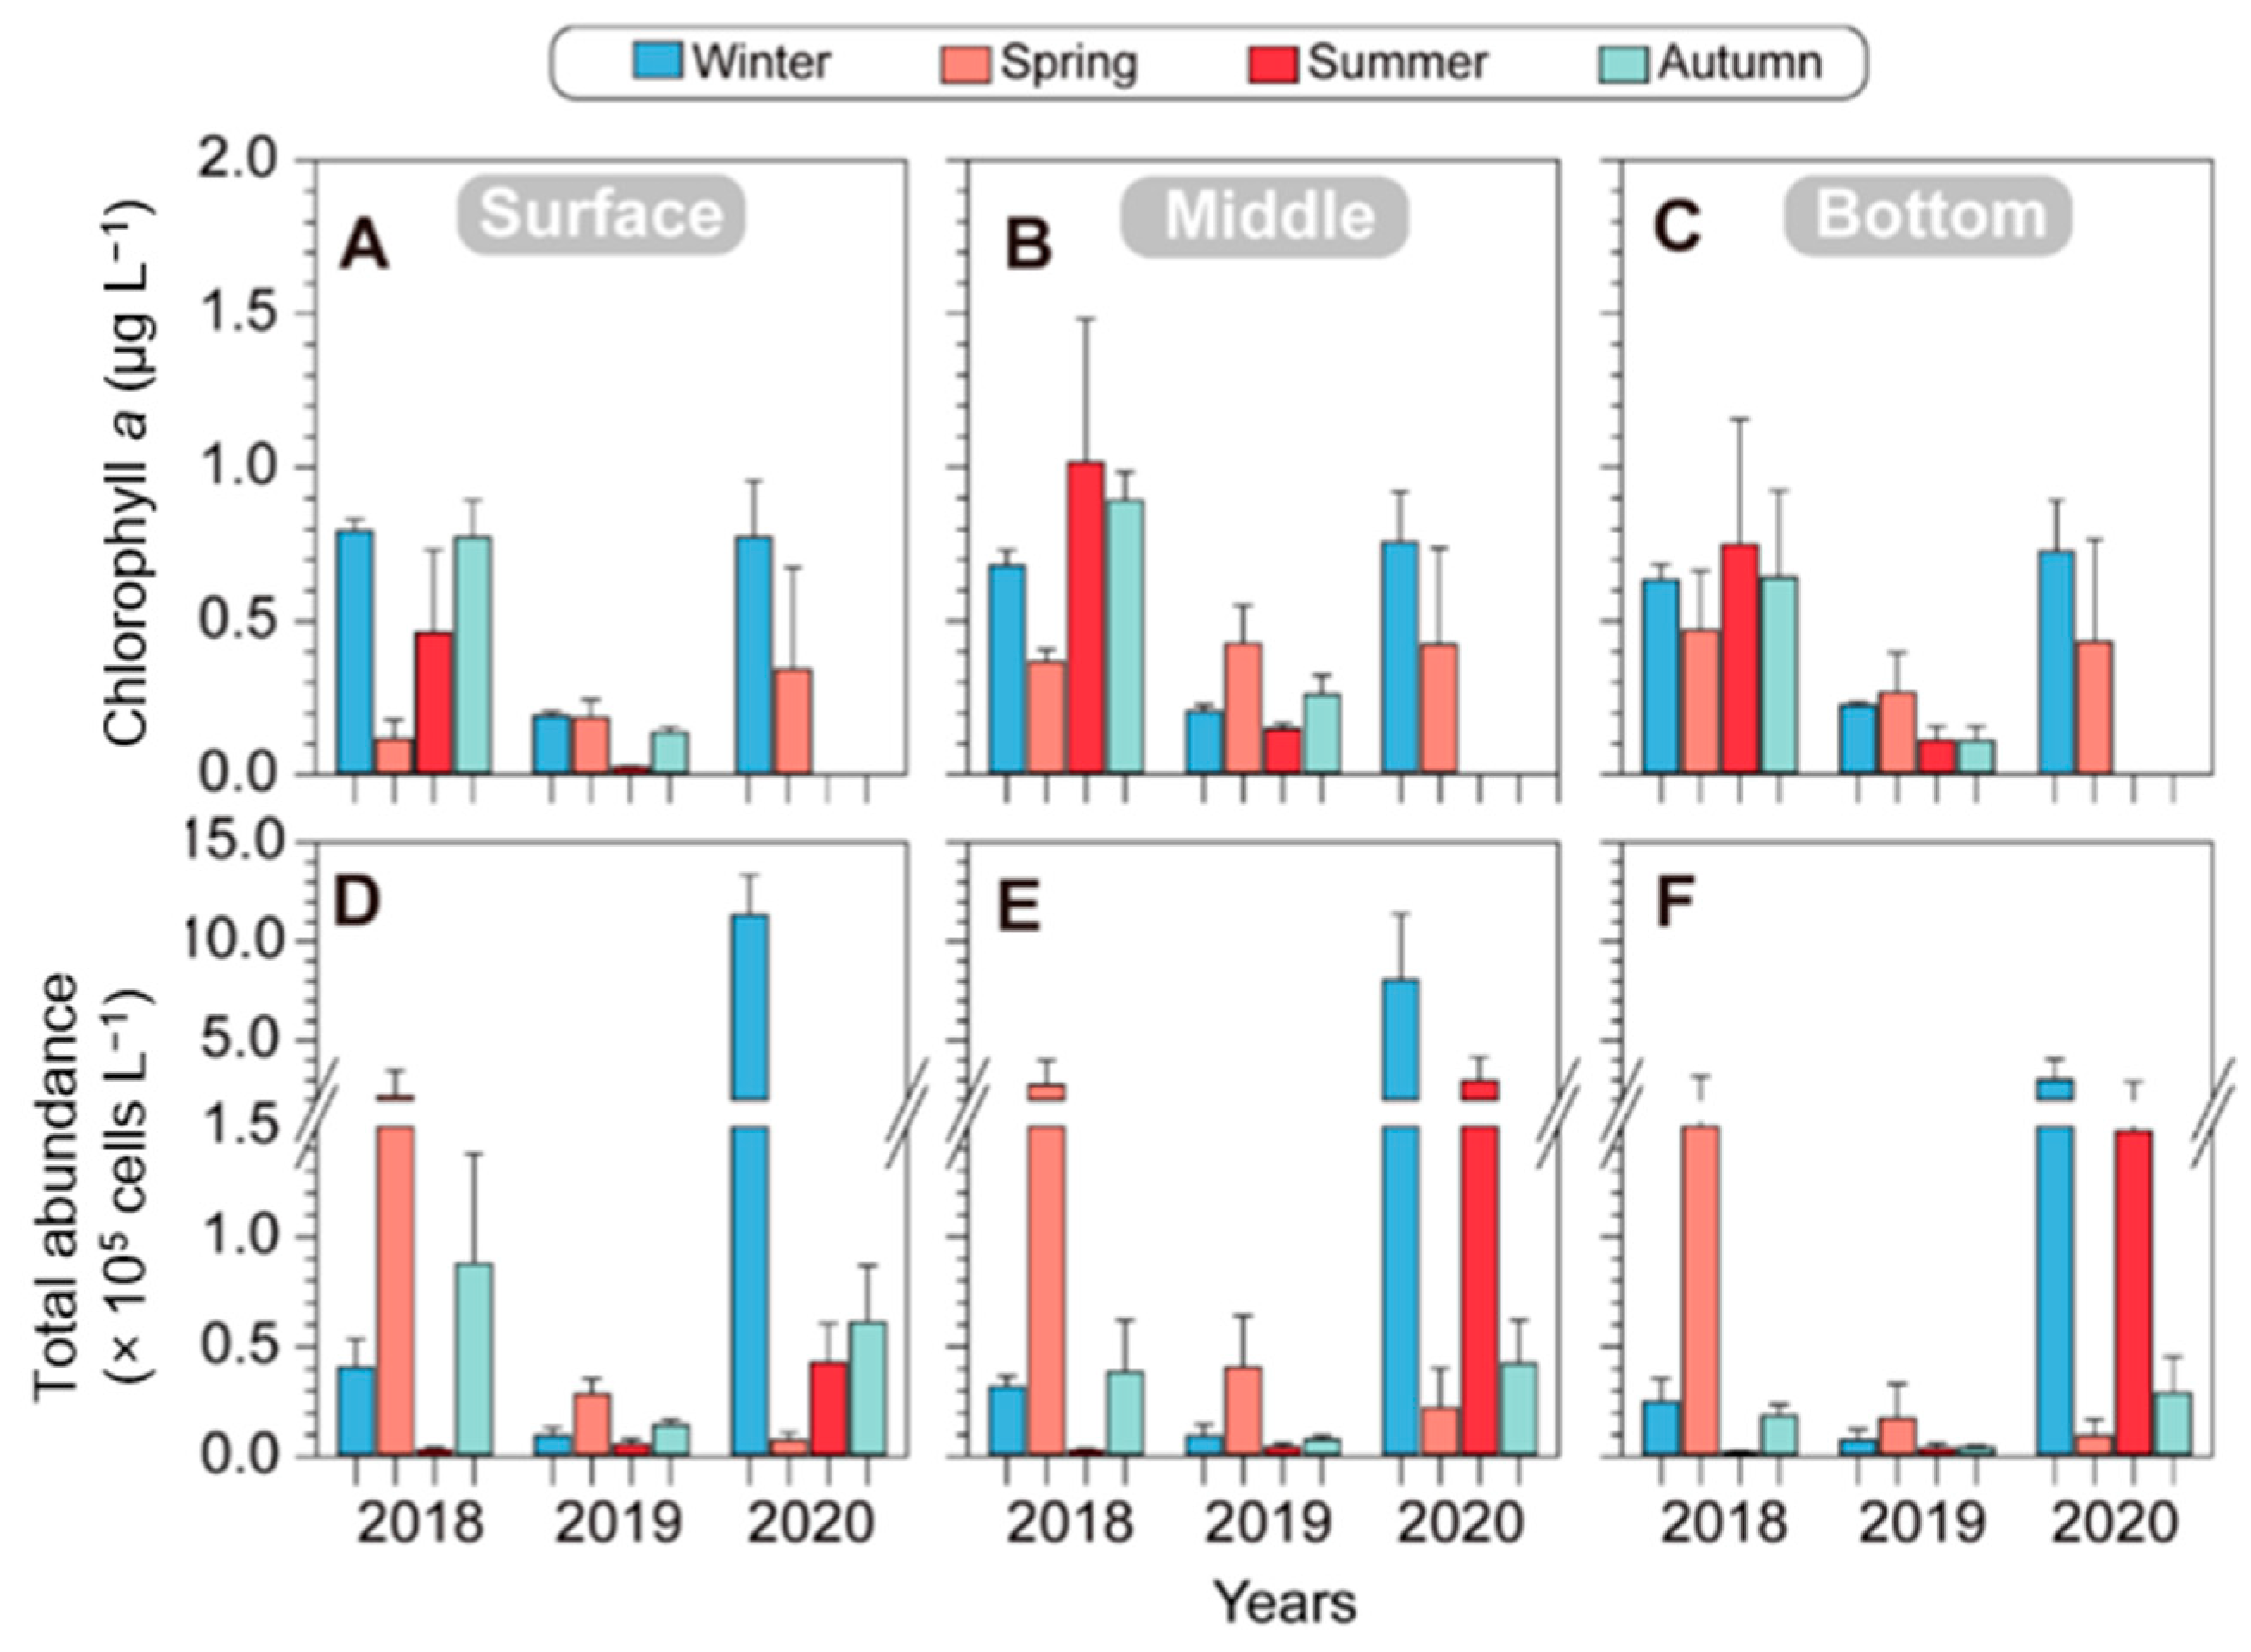
Over the course of three years, the surface Chl. a concentration exhibited variations, measuring 0.62 ± 0.38 μg L−1 in winter, 0.22 ± 0.13 μg L−1 in spring, 0.24 ± 0.31 μg L−1 in summer, and 0.46 ± 0.45 μg L−1 in autumn. In 2018, there was high spatial variation in the Chl. a concentration across the surface, middle, and bottom layers during winter. Conversely, the Chl. a concentration in the surface layer during spring was low, at 0.12 ± 0.06 μg L−1. Interestingly, from spring to summer, Chl. a concentrations increased in the middle layer (from 0.37 ± 0.04 μg L−1 in spring to 1.02 ± 0.47 μg L−1 in summer) and the bottom layer (from 0.47 ± 0.19 μg L−1 in spring to 0.75 ± 0.41 μg L−1 in summer). However, during autumn, the Chl. a levels remained relatively high at all three water depth layers (Figure 4A–C; left). In 2019, the Chl. a concentrations during all four seasons were relatively low, and notably, during summer and autumn, they were low even in the middle and lower layers. In 2020, the Chl. a levels were consistently high across the surface, middle, and bottom layers during the winter seasons, resembling the Chl. a levels observed in winter 2018.

Figure 4.
Seasonal changes in environmental factors of chlorophyll a (A–C) and total phytoplankton abundances (D–F) in different depths of five stations from 2018 to 2020 in the vicinity of Dokdo. The error bars represent the variations in five stations.
Phytoplankton blooms occurred seasonally, with significant spring blooms in 2018 and 2019 and winter blooms in 2020. The seasonal variation in the phytoplankton cell density in 2018 exhibited relatively higher values in the middle layer during the spring (2.74 ± 1.27 × 10⁵ cells L−1) but lower values in the middle and lower layers during the summer and autumn of the same year. In 2019, the overall phytoplankton cell density remained low in all seasons. However, in 2020, it reached the highest cell density during the winter in the surface layer (11.33 ± 2.05 × 10⁵ cells L−1), maintaining high values across all depth layers. Notably, during the spring, the phytoplankton cell density was low in all depth layers; however, it showed a high density again during the summer. Overall, there are similar trends of increase and decrease in both the chlorophyll and phytoplankton cell densities. However, a specific observation was noted in the summer of 2018 and 2020, when the chlorophyll levels were high while the phytoplankton cell density remained low. This is likely attributed to differences in the chlorophyll content based on phytoplankton (Figure 4). Over the course of three years in the offshore waters around Dokdo, diatoms in the phytoplankton class were observed on five occasions (winter, summer, and autumn in 2018; autumn in 2019; and summer in 2020) (Figure 5).
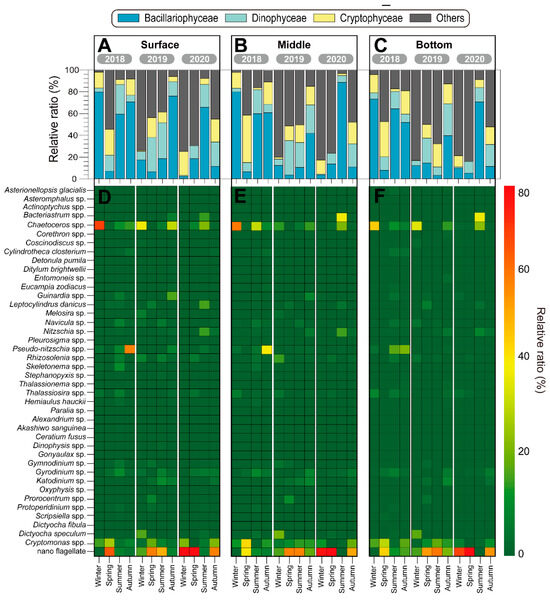
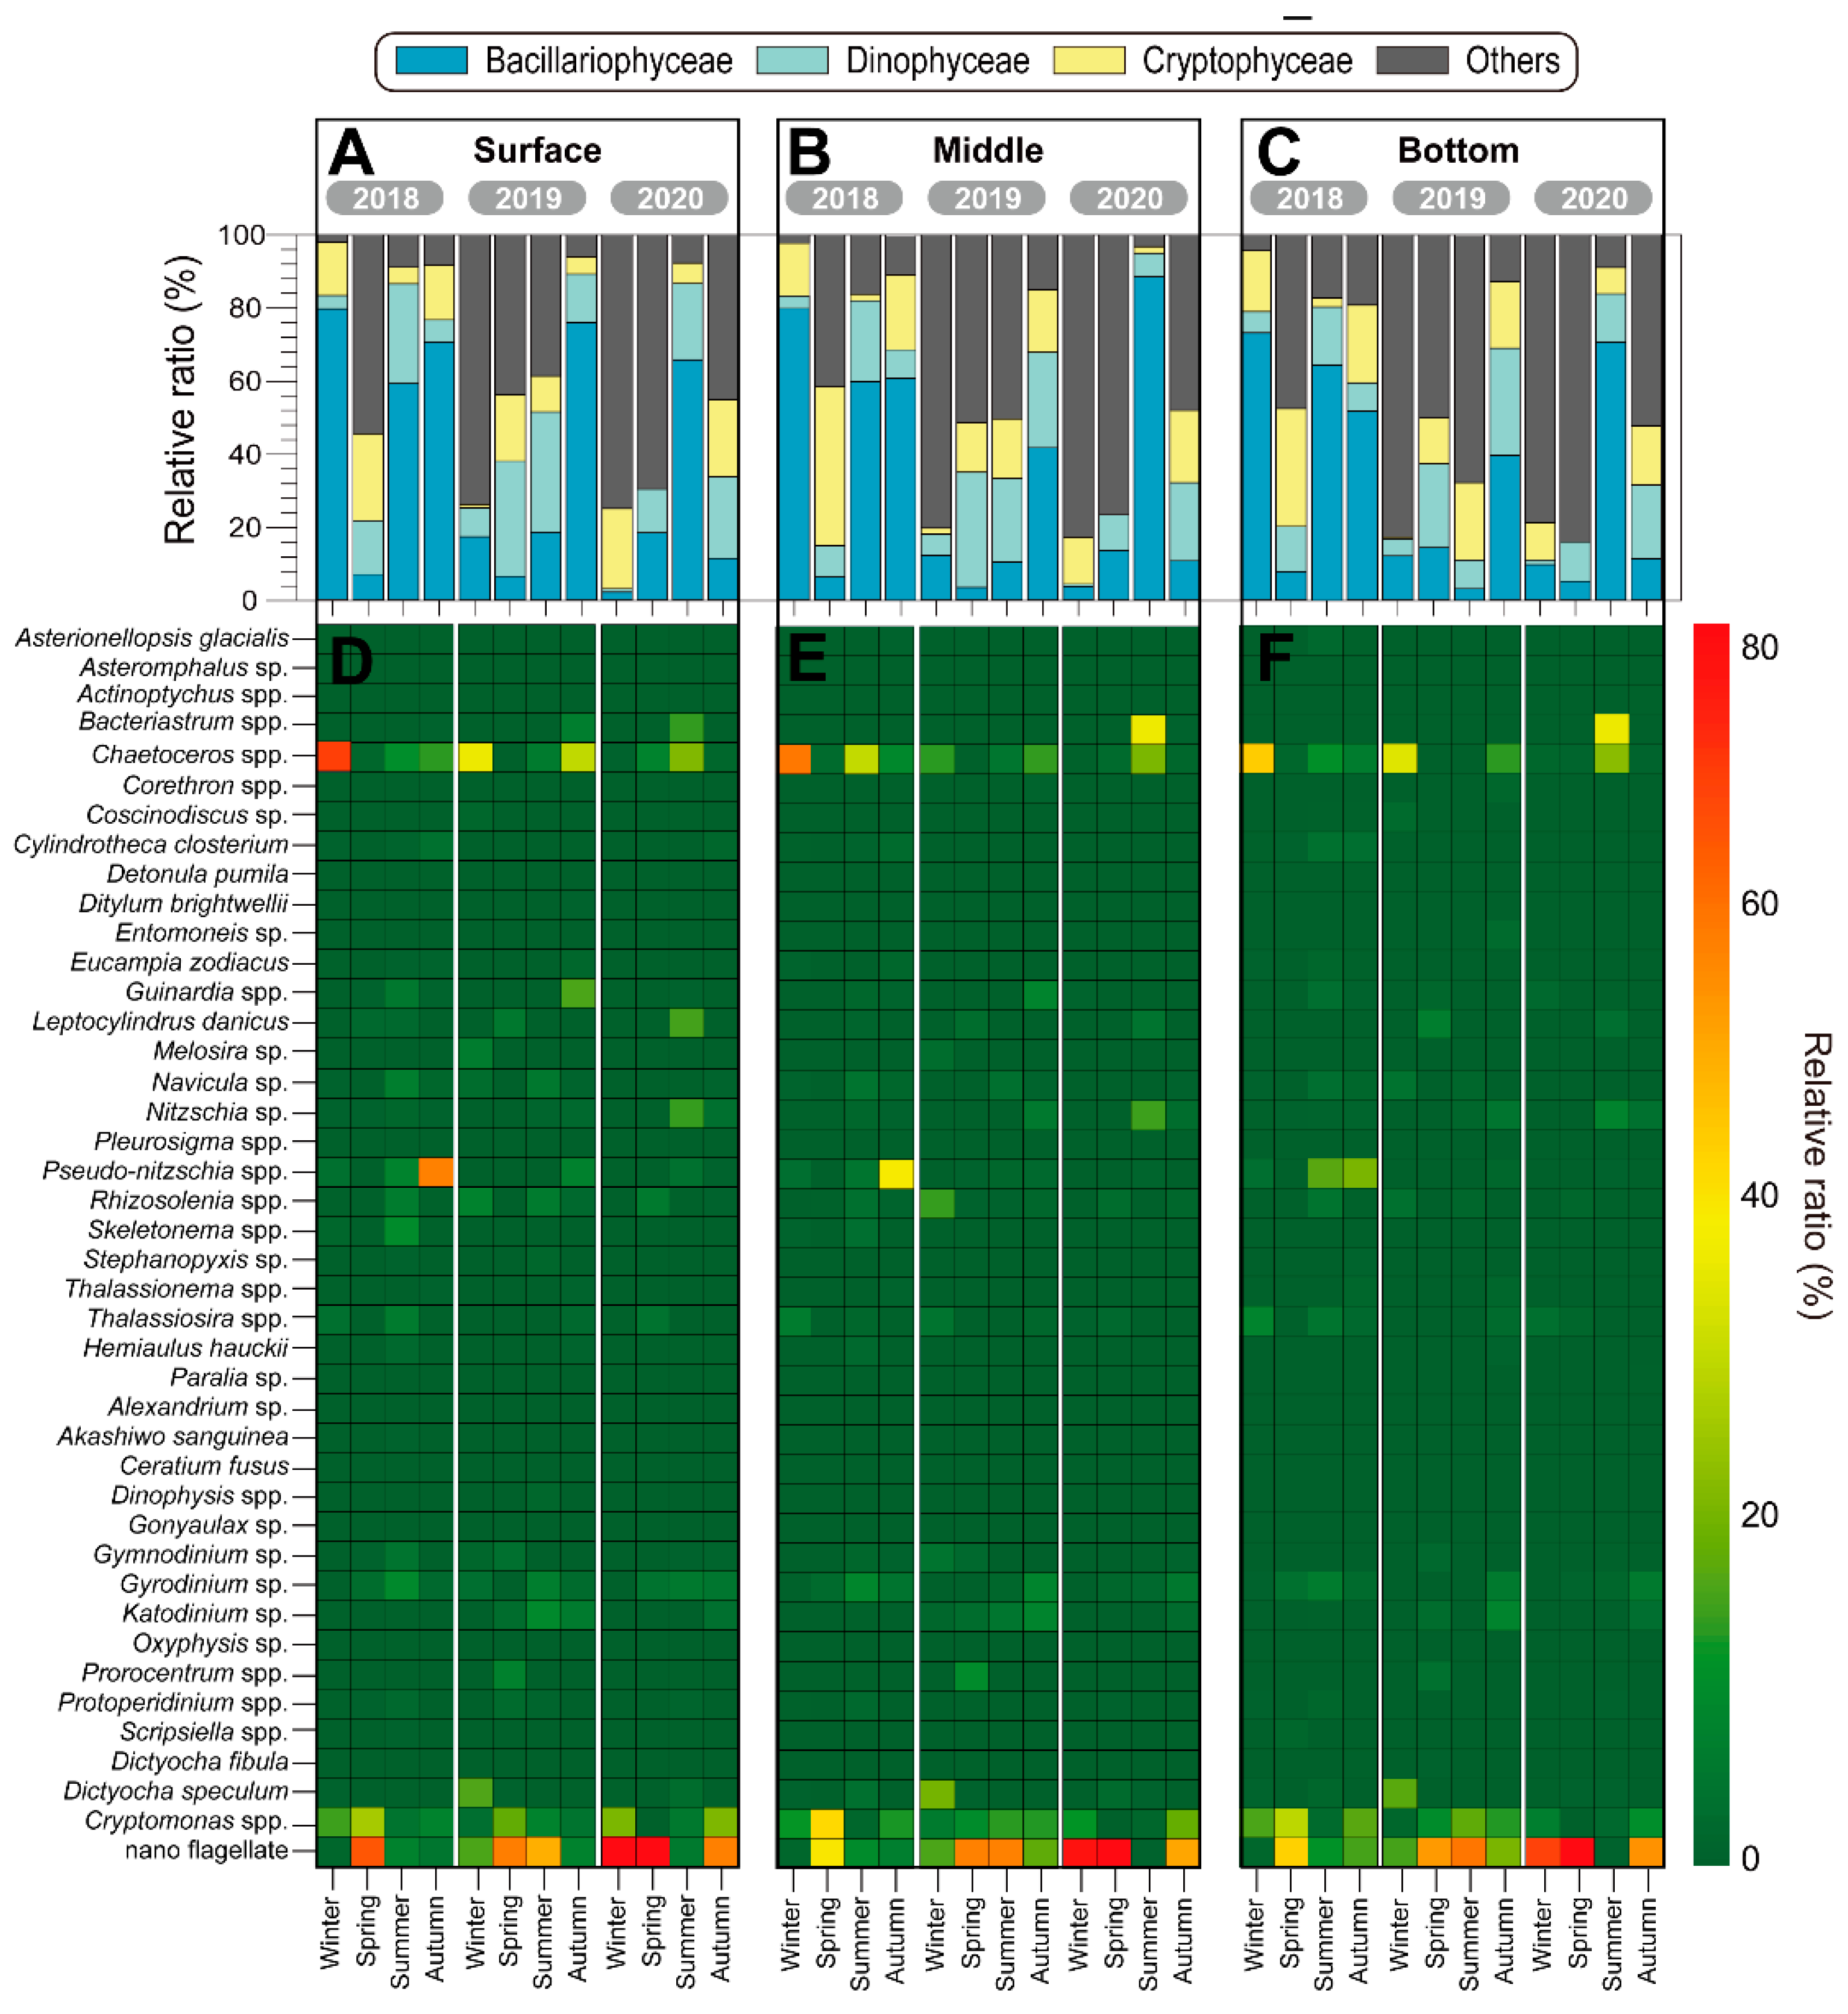
Figure 5.
Temporal changes in the relative contribution of different taxonomic ratio (A–C) and relative ratio of different species (D–F) from 2018 to 2019 in the vicinity of Dokdo Island.
Specifically, in the blooms of 2018 and 2020, there was a significant increase in small nano-flagellates. In 2018, nano-flagellates dominated during the winter (77.6%), summer (61.3%), and autumn (61.2%) seasons. In 2020, they were dominant during the summer (75.1%). Interestingly, as the depth increased, there was a trend of increasing nano-flagellates, particularly in the bottom layers. Dinophyceae and cryptophyceae were present at relatively low levels and in minor groups during the three years. In 2018, during the winter season, Chaetoceros spp. dominated across all water layers (S = 66.7%; M = 64.2%; B = 54.1%). In the spring, nano-flagellates dominated, ranging from 45.2% to 62.6% across all water layers, with Cryptomonas spp. particularly increased in the middle layer at 47.3%. During the summer, there was a slightly different vertical distribution of dominant species, and this season exhibited low Chl. a and total phytoplankton abundance. The vertical dominant species profiles showed Chaetoceros spp. dominating in the surface and middle layers at 11.4% and 34.8%, respectively, while Pseudo-nitzschia spp. showed a high prevalence of 21.6% in the bottom layer. Similarly, during the autumn season, Pseudo-nitzschia spp. dominated in all water layers. However, their proportion decreased from the surface to the bottom layers (S = 56.2%; M = 44.6%; B = 26.3%), while at the same time, the proportion of Cryptomonas spp. increased (S = 8.7%; M = 15.5%; B = 21.8%) (Figure 5D–F; left). In the year 2019, during the winter, Chaetoceros spp. dominated the surface (36.9%) and bottom layers (42.4%), while Dictyocha fibula dominated the middle layer at 23.8%. In addition, in the autumn, nano-flagellates dominated in all seasons and all water layers, except for the surface layer where Chaetoceros spp. dominated at 31.0% (Figure 5D–F; middle). In 2020, similar to previous years, nano-flagellates remained the dominant species; however, there was an increase in the abundance of Bacteriastrum spp., which dominated in the middle (41.6%) and bottom layers (44.8%) during the summer (Figure 5D–F; right). Overall, the diversity (H’) in the surface layer is significantly higher than that of the middle layers during summer (p < 0.001). In the spring of 2018, richness (d) and number of species (S) exhibited an unusual pattern due to the blooming of nano-flagellates and Cryptomonas spp. (Figure 6).
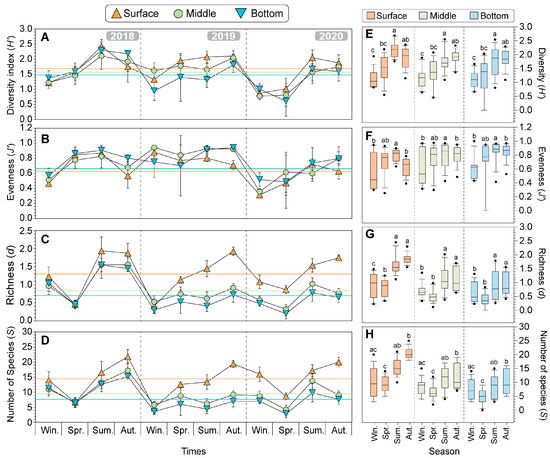
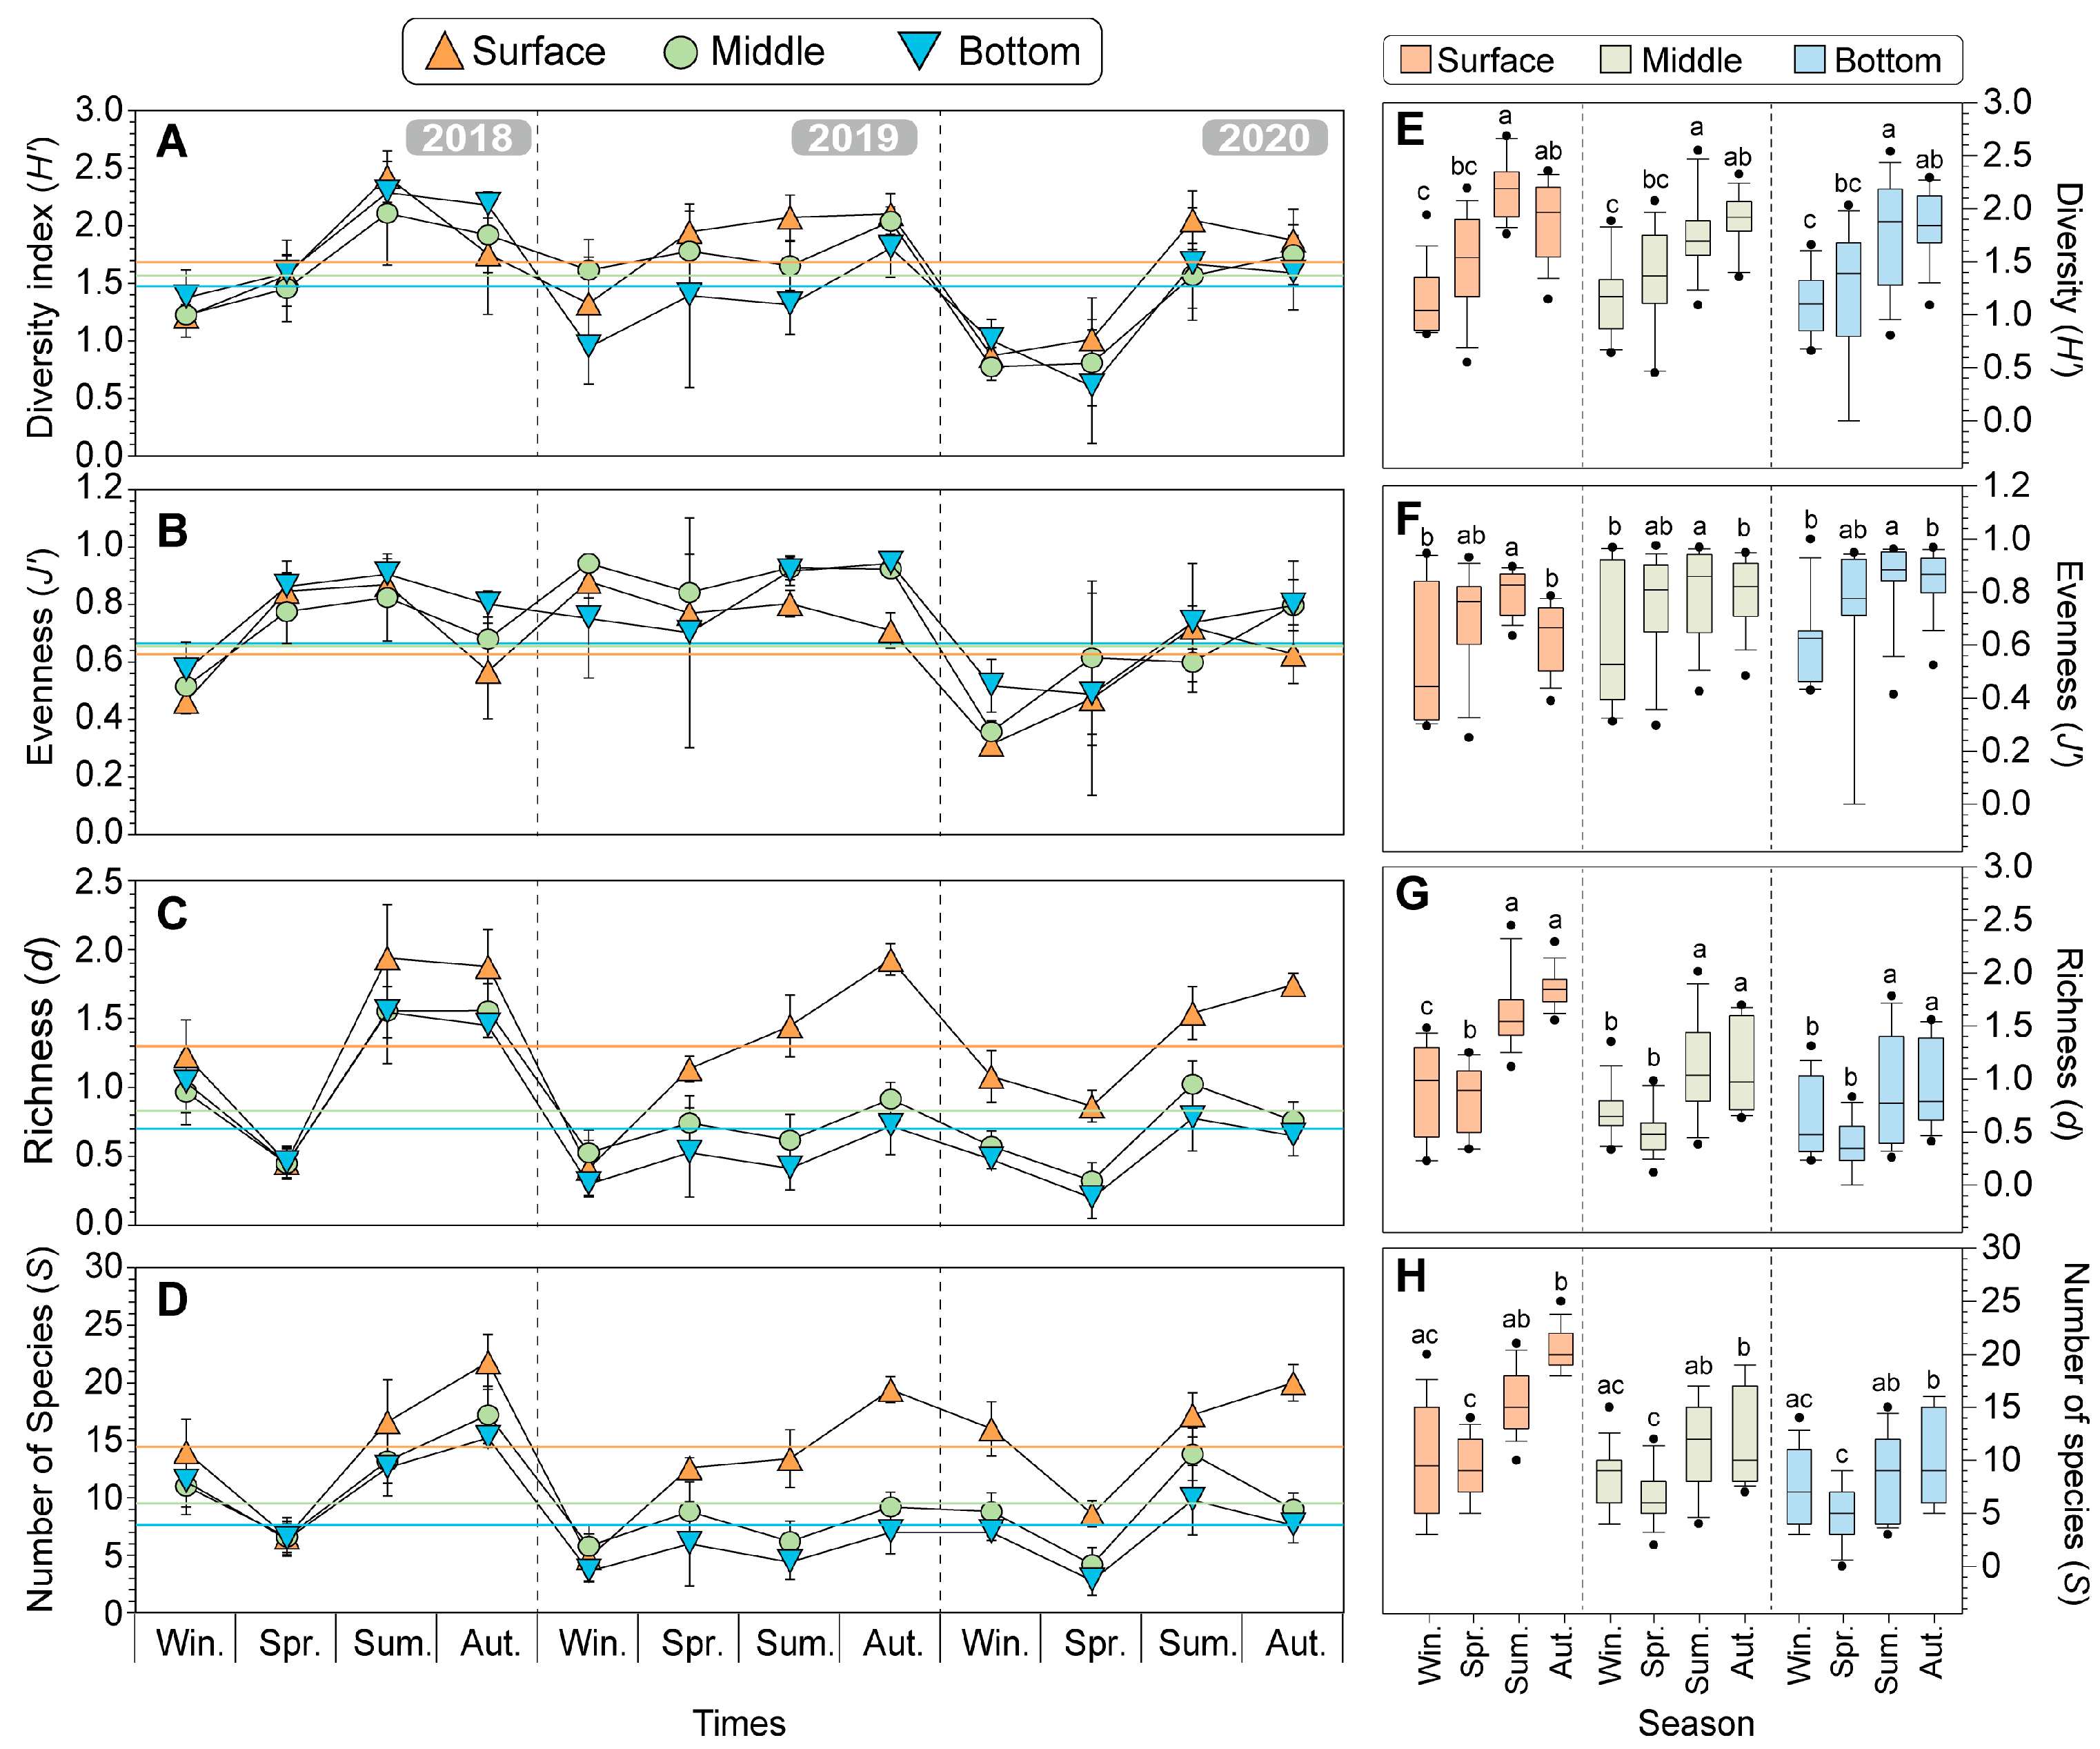
Figure 6.
Seasonal changes in biodiversity indices of diversity (H’) (A), evenness (J’) (B), richness (d) (C), and number of species (S) (D) from 2018 to 2020 in the offshore water of Dokdo. The different colored symbols represent each depth of the data (Orange triangle: surface, light green circle: middle, light blue inverted triangle: bottom). The colored lines represent the average values in the three years in each different water depth. To compare differences in seasonal biodiversity indices, the boxplot combines three years of data by depth for diversity (H’) (E), evenness (J’) (F), richness (d) (G), and number of species (S) (H). The different letters indicate significant differences using the non-parametric Kruskal–Wallis test, followed by the non-parametric Mann–Whitney U-test and the Bonferroni correction for post hoc pairwise comparisons (p = 0.017, corresponding to p < 0.05/3).
Over the three years, the average values of diversity indices were generally higher following the order of the surface, middle, and bottom layers, while d was higher in the bottom, middle, and surface layers. Specifically, the vertical profile of the mean diversity (H’) (1.68 ± 0.49), mean richness (d) (1.30 ± 0.54), and the mean number of species (S) (14.25 ± 5.37) in the surface layers is higher than that of H’ (1.48 ± 0.49), mean d (0.71 ± 0.43), and S (7.82 ± 3.76) of the bottom layers. Conversely, the mean evenness (J’) (0.67 ± 0.18) in the surface layers is lower than that of the bottom layer (0.75 ± 0.15). In addition, the seasonal trends in H’ and J’ show a decreasing pattern during winter but an increasing trend during spring to summer and then a slight decrease during autumn (Figure 6A–D). Overall, the vertical profiles of the diversity indices have no significant differences in the layers. However, they were classified into two groups (winter-spring and summer-autumn) and showed clear significant differences according to seasons (Figure 6E–H).
Seasonally, in the surface layer, the H’ was highest in summer (2.18 ± 0.28) and lowest in winter (1.14 ± 0.31), showing significant differences between these two seasons (Figure 6E; p < 0.001; Kruskal–Wallis test). The J’ showed a similar trend to H’ (p < 0.05) (Figure 6F). The d was clearly classified into two groups, with the winter-autumn group showing higher values compared to the other group (summer: 1.64 ± 0.34, autumn: 1.85 ± 0.18) (Figure 6G; p < 0.01). The S was highest in autumn (20.40 ± 1.96) and lowest in spring (9.27 ± 2.84) (Figure 6H; p < 0.001). These results show that the seasonal variations were similarly observed in both the middle layers and bottom layers.
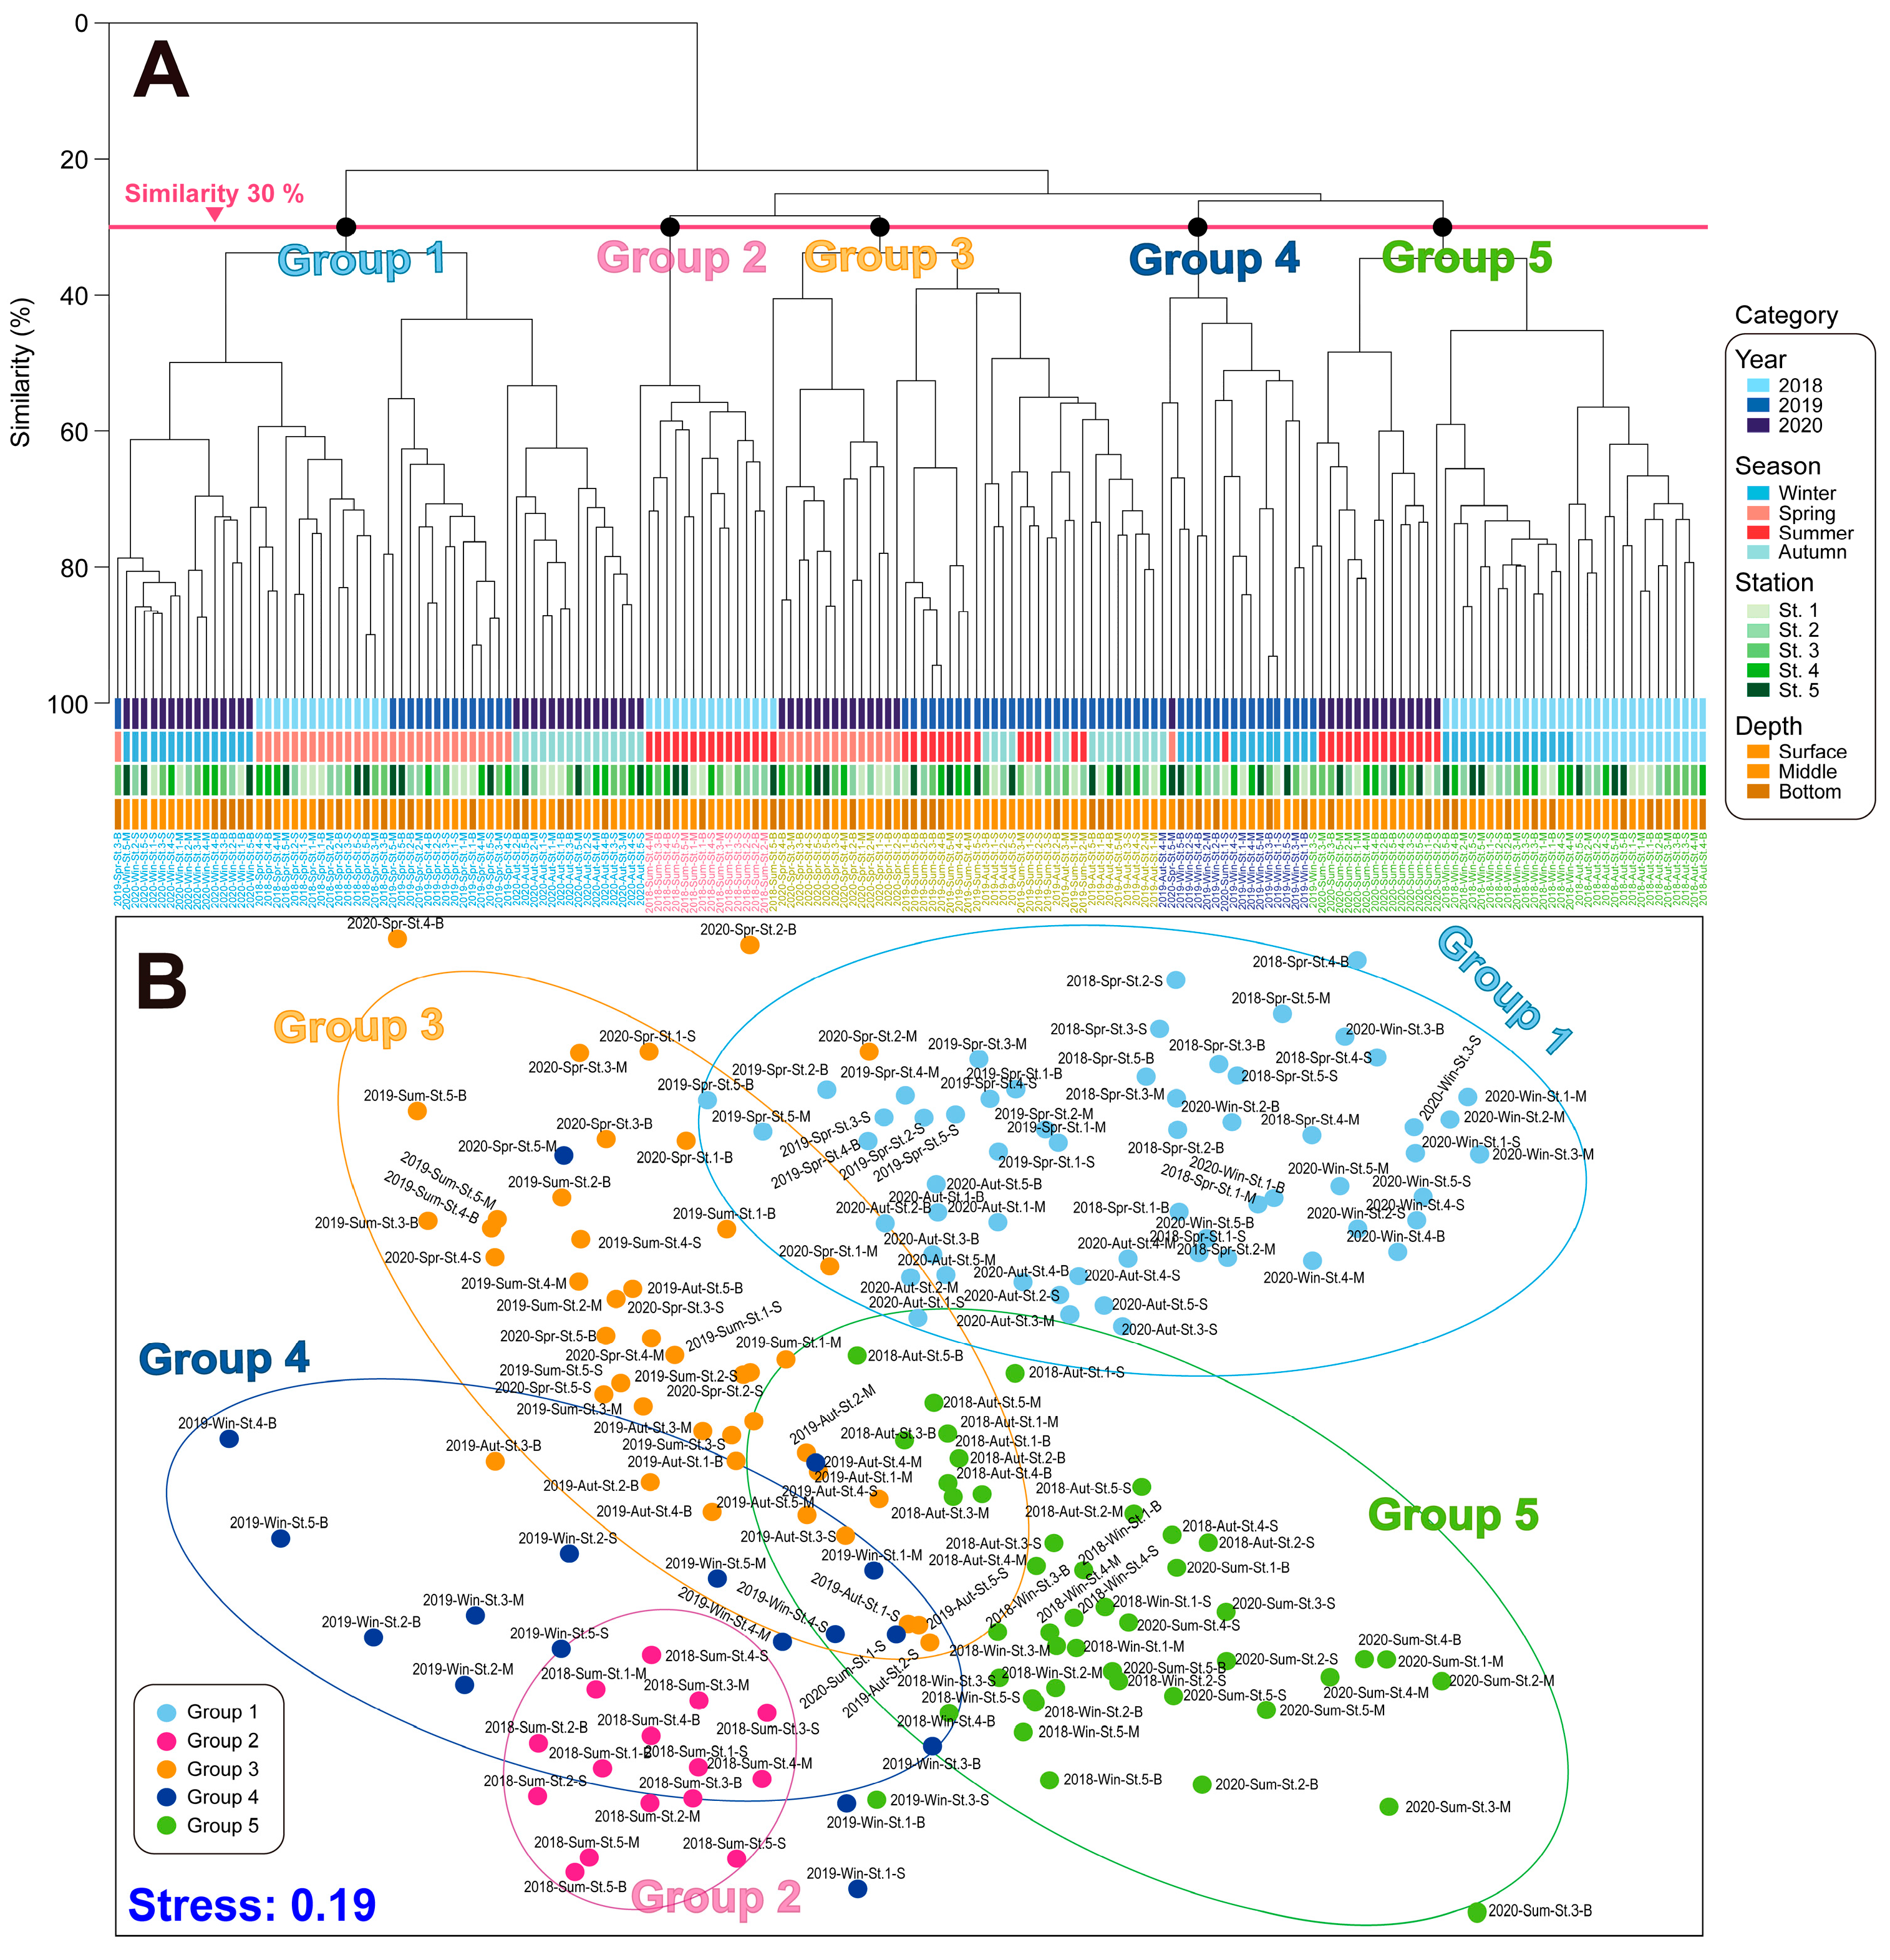
Cluster analysis and non-metric MDS were performed on the phytoplankton composition and quantification data of phytoplankton for each season (Figure 7). Based on the cluster analysis and MDS, the phytoplankton community structures were separated into five significant groups based on a 30% similarity. Overall, the phytoplankton community from 2018 to 2020 was divided into five distinct groups based on cluster analysis and multidimensional scaling. Group 1 was characterized by relatively low temperatures, including the spring of 2018 and 2019, as well as the autumn and winter of 2020, and was dominated by diatoms such as the Chaetoceros spp., in addition to nano-flagellates. Group 2 corresponded to the summer of 2018, characterized by high water temperatures and the dominance of small dinoflagellates. Group 3 included the summer and autumn of 2019, in addition to the spring of 2020. Group 4 represented the winter of 2019, characterized by the dominance of nano-flagellates, together with a low proportion of Cryptophyceae. Finally, Group 5 was characterized by the winter and autumn of 2018 and the summer of 2020.

Figure 7.
Cluster (A) and MDS (B) analyses based on phytoplankton community structures in the vicinity water of Dokdo island. The lines indicate a 30% similarity. Win: winter, Spr: spring, Sum: summer, and Aut: autumn.
4. Discussion
In the Ulleung Basin, which includes our study sites around Dokdo, the presence of a quasi-stationary anticyclonic eddy has been widely documented [11,13,20,21]. This eddy is influenced by the complex interplay of the North Korean Cold Current (the NKCC flowing down from the north) and the East Korean Warm Current (the EKWC rising from the south. The eddy, known as the Ulleung Warm Eddy (UWE), may be generated by the diffusion of negative vorticity within the western boundary current [20,22] and serves as an important pathway for the southward flow from the western Japan Basin, along with the Dokdo Cold Eddy, which forms to the southwest of Dokdo [20]. As a result, the UWE area has relatively high productivity despite being located in oligotrophic waters. This is due to the complex water-mixing processes related to seasonal ocean–atmosphere interactions and the ocean current systems (including the Tsushima Warm Current (TWC), EKWC, NKCC, and eddies). Therefore, our study focuses on the seasonal changes in the phytoplankton community structure related to oceanographic features in the offshore oligotrophic waters of Dokdo, which play an important role in regulating the food web and significantly contribute to fishery resources.
In the vicinity of Dokdo, the entire water column in winter experiences thorough mixing due to strong winds and low-temperature weather, resulting in high nutrient levels in the euphotic layer. This high nutrient condition leads to an increase in the phytoplankton biomass, even in the cold season when water temperatures are around 11 °C. Interestingly, during the winter of 2018 and 2019, Chl. a concentrations were relatively high, while phytoplankton abundance was low. This disparity indicates the dominance of large-sized phytoplankton. At that time, the diatom Chaetoceros spp. was dominant in the whole water column (Figure 5), and this diatom positively correlated with nutrients in the PCA analysis (Figure 8). Lee et al. [14] reported that Chaetoceros species, such as C. socialis, tend to thrive under low water temperatures when nutrients are abundant in the euphotic layers of the East Sea, Korea. Additionally, Thompson et al. [3] and Lee et al. [14] reported that the influx of abundant nutrients into the euphotic layers during winter mixing coincided with a high biomass and reproduction of diatoms. In addition, the predominant of this diatom in winter led to a relatively lower diversity (H’) in the whole water layer compared to other seasons (Figure 6). These findings suggest that even at low water temperatures, the dominance of one species, based on abundant nutrients, contributes significantly to the increase in biomass but may lead to a decrease in diversity.
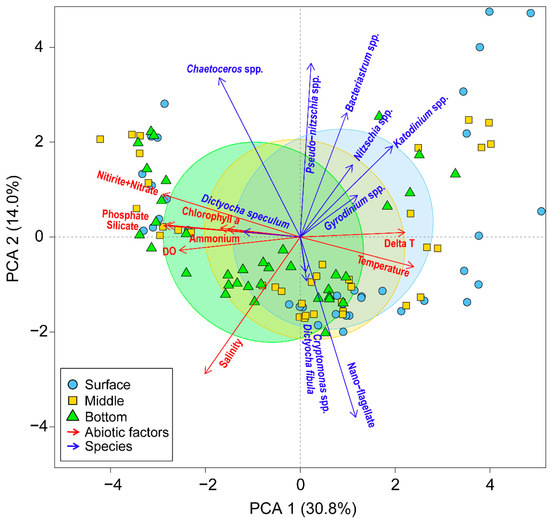
Figure 8.
Principal component analysis of the relationships between environmental variables (red arrows) and dominant species (blue arrows) from 2018 to 2020 in the vicinity waters of Dokdo Island. The symbol indicates the vertical depth in the surface (blue cycle), middle (yellow square), and bottom (green triangle) layers. Delta T represents the water temperature difference between surface and bottom water.
In contrast to winter, the abundance of phytoplankton was high despite relatively low Chl. a concentrations during spring. Common to all three years, the dominant phytoplankton were small nano-flagellates and Cryptomonas spp. This shift in dominant species led to an increase in diversity (H’) compared to winter. Many researchers have reported that phytoplankton blooms in temperate waters result from rapid growth in spring, fueled by the nutrients supplied during the winter season [1,3,8]. In addition, according to the nutrient addition experiments conducted in the area adjacent to Dokdo [8], small-sized phytoplankton significantly increased when nitrate was added in spring. Small-sized microalgae have an advantage in nutrient uptake due to their high surface area relative to volume [23,24]. The nutrient concentrations in surface water were lower in spring compared to winter, which was significantly different from the bottom waters (p < 0.05). This indicates that increased surface water temperatures in the spring formed a thermocline, and the increased phytoplankton gradually depleted surface nutrients, which is a suitable environment for the thriving of small nano-flagellates.
In summer, the water column around Dokdo is generally stratified, and the resulting lack of surface nutrients leads to a low phytoplankton biomass [14,15]. However, in the summer of 2018, Chl. a concentrations were high, while phytoplankton abundance was very low (Figure 4). Picoplankton, which are less than 2 μm, are difficult to observe under a microscope due to their small cell size; however, they play an important role in marine ecosystems related to primary production [25,26]. Actually, under the low-nutrient conditions of the East Sea below 0.5 μM in DIN, the dominance of picoplankton, including Prochlorococcus and Synechococcus, has been reported [27,28,29]. In particular, this picoplankton was dominant under DIN-limited conditions in the surface waters of the East Sea [19]. These results suggest that the difference in the Chl. a concentrations and abundance of phytoplankton in our observation might be caused by picoplankton. In addition, this season was specifically isolated as Group 2 in the cluster analysis (Figure 7). Moreover, the dinoflagellates Katodinium and Gyrodinium were positively correlated with the water temperature difference between surface and bottom water (delta T in Figure 8), which may indirectly represent the strength of the stratification. This relationship indicates the results of the ecological strategy of the diel vertical migration (DVM) employed by dinoflagellates to overcome the strong development of summer stratification. Studies by Jephson and Carlsson [30] and de Souza et al. [31] have demonstrated that nutrient levels in the water column can strongly affect the vertical distribution of phytoplankton. Unlike other seasons where the dominance of nano-flagellate or diatoms was observed, the diversity (H’) during summer was significantly the highest due to the emergence of various dinoflagellates. Consequently, these findings suggest that the unique oceanographic features and nutrient dynamics observed seasonally play a crucial role in determining the current patterns of phytoplankton biomass and species diversity.
It is well-documented that the second phytoplankton bloom often occurs in autumn in temperate waters [1,3,6,10]. In this study, the surface water temperature during autumn was 19.13 ± 0.40 °C over three years, with no significant year-to-year variations. On the other hand, the bottom water temperature was around 10 °C in 2019, which was significantly lower than the other years at around 17 °C. Consequently, in 2019, Chl. a concentration and phytoplankton abundances were abnormally low. This low water temperature in the bottom layer represents the introduction of a cold-water mass. Sin et al. [32] have demonstrated that a cold-water inflow from the deep sea at a depth of 1700 m has a significant impact on marine organisms, such as sea urchins, owing to the topographical characteristics of volcanic islands, including Ulleungdo and Dokdo. This influx of cold water strengthens the stability of the water column in the autumn, which can lead to a reduction in surface nutrient loading. Interestingly, at that time, the salinity was relatively low in the offshore waters, below 33.8, which is related to the influence of the low-salinity water mass from the combination of the TWC and low-salinity Changjiang diluted water (CDW) described by Rho [33]. This water is transported from the East China Sea to the southern Korean coastal waters during the summer monsoon season in China and Korea, and during this process, most of the nutrients are depleted. Thus, these findings suggest that the increased water stability, resulting from the combined impact of the inflow of cold water from the bottom and low-salinity CDW from the surface, caused a low-nutrient environment, resulting in a dramatically low phytoplankton biomass in 2019. Additionally, the absence of high nutrient levels may have contributed to an increase in diversity during autumn (Figure 6) by preventing the dominance of a single organism in the environment.
In conclusion, the changing environmental conditions by seasons have driven the dominance of various phytoplankton, including picoplankton, nano-flagellates, Cryptomonas, and diatoms such as Chaetoceros and Pseudo-niztschia. These variations are significantly influenced by unique hydrodynamic circulation, intrusion of deep cold water, and low-salinity CDW in the waters around Dokdo. These environmental changes result in a distinct pattern of biodiversity indices, with the highest in summer and the lowest in winter, differing from typical temperate seas. Furthermore, the three-year cluster analysis did not reveal a clear seasonal pattern of phytoplankton communities, indicating the complexity of the planktonic ecosystem around Dokdo. These findings emphasize the importance of continuous long-term monitoring of phytoplankton communities for a better understanding of the marine ecosystem and for managing fishery resources based on seasonal phytoplankton fluctuations in the environmentally complex waters of Dokdo, including the East Sea, Republic of Korea.
Author Contributions
Conceptualization, M.L. and C.H.L.; Data curation, Y.-B.K.; Funding acquisition, C.H.P. and S.H.B.; Investigation, M.L., Y.-B.K., J.H.K. and Y.K.L.; Project administration, C.H.P.; Supervision, S.H.B.; Visualization, C.H.L.; Writing—original draft, S.H.B. All authors have read and agreed to the published version of the manuscript.
Funding
This research was supported by a project on the sustainable research and development of Dokdo (PG53501), which is funded by the Ministry of Oceans and Fisheries, Republic of Korea. This research was also supported by the development of original technology to verify the factors influencing barren ground on the East Sea coast according to climate change (PEA0116) by the Korea Institute of Ocean Science and Technology.
Data Availability Statement
The data presented in this study are available on request from the corresponding author. The data are attributed to the project (PG53501) and therefore not publicly available without permission.
Acknowledgments
We would like to acknowledge the captains of the international commercial ships for their invaluable contribution in making the sampling process possible.
Conflicts of Interest
The authors declare no conflict of interest.
References
- Townsend, D.W.; Keller, M.D.; Sieracki, M.E.; Ackleson, S.G. Spring phytoplankton blooms in the absence of vertical water column stratification. Nature 1992, 360, 59–62. [Google Scholar] [CrossRef]
- Mozetič, P.; Francé, J.; Kogovšek, T.; Talaber, I.; Malej, A. Plankton trends and community changes in a coastal sea (northern Adriatic): Bottom-up vs. top-down control in relation to environmental drivers. Estuar. Coast. Shelf Sci. 2012, 115, 138–148. [Google Scholar] [CrossRef]
- Thompson, P.A.; Bonham, P.I.; Swadling, K.M. Phytoplankton blooms in the Huon Estuary, Tasmania: Top-down or bottom-up control? J. Plankton Res. 2008, 30, 735–753. [Google Scholar] [CrossRef]
- Kim, T.; Yoon, J.-H. Seasonal variation of upper layer circulation in the northern part of the East/Japan Sea. Cont. Shelf Res. 2010, 30, 1283–1301. [Google Scholar] [CrossRef]
- Takahashi, M. Phytoplankton production during a summer coastal upwelling in the East China Sea. Contin. Shelf Res. 2004, 24, 1321–1338. [Google Scholar]
- Cushing, D.H. A difference in structure between ecosystems in strongly stratified waters and in those that are only weakly stratified. J. Plankton Res. 1989, 11, 1–13. [Google Scholar] [CrossRef]
- Paerl, H.W.; Rudek, J.; Mllin, M.A. Stimulation of phytoplankton production in coastal waters by rainfall inputs: Nutritional and trophic implications. Mar. Biol. 1990, 107, 247–254. [Google Scholar] [CrossRef]
- Carstensen, J.; Klais, R.; Cloern, J.E. Phytoplankton blooms in estuarine and coastal waters: Seasonal patterns and key species. Estuar. Coast. Shelf Sci. 2015, 162, 98–109. [Google Scholar] [CrossRef]
- Yoo, S.; Park, J. Why is the southwest the most productive region of the East Sea/Sea of Japan? J. Mar. Syst. 2009, 78, 301–315. [Google Scholar] [CrossRef]
- Kim, D.-S.; Kim, K.-H.; Shim, J.-H.; Yoo, S.-J. The effect of anticyclonic eddy on nutrients and chlorophyll during spring and summer in the Ulleung Basin, East Sea. Sea 2007, 12, 280–286. [Google Scholar]
- Isoda, Y.; Saitoh, S. The northward intruding eddy along the East coast of Korea. J. Oceanogr. 1993, 49, 443–458. [Google Scholar] [CrossRef]
- Park, K.-A.; Ullman, D.S.; Kim, K.; Chung, J.Y.; Kim, K.-R. Spatial and temporal variability of satellite-observed subpolar front in the East/Japan Sea. Deep Sea Res. Part I Oceanogr. Res. Pap. 2007, 54, 453–470. [Google Scholar] [CrossRef]
- Lie, H.J.; Cho, C.H. Seasonal circulation patterns of the Yellow and East China Seas derived from satellite-tracked drifter trajectories and hydrographic observations. Prog. Oceanogr. 2016, 146, 121–141. [Google Scholar] [CrossRef]
- Lee, M.; Ro, H.; Kim, Y.B.; Park, C.H.; Baek, S.H. Relationship of spatial phytoplankton variability during spring with eutrophic inshore and oligotrophic offshore waters in the East Sea, including Dokdo, Korea. J. Mar. Sci. Eng. 2021, 9, 1455. [Google Scholar] [CrossRef]
- Lee, M.; Kim, J.H.; Kim, Y.-B.; Park, C.H.; Shin, K.; Baek, S.H. Specific oceanographic characteristics and phytoplankton responses influencing the primary production around the Ulleung Basin area in spring. Acta Oceanol. Sin. 2020, 39, 107–122. [Google Scholar] [CrossRef]
- Kwak, J.H.; Lee, S.H.; Hwang, J.; Suh, Y.S.; Je Park, H.; Chang, K.I.; Kang, C.K. Summer primary productivity and phytoplankton community composition driven by different hydrographic structures in the East/Japan Sea and the Western Subarctic Pacific. J. Geophys. Res. Oceans 2014, 119, 4505–4519. [Google Scholar] [CrossRef]
- Lee, M.; Kim, Y.B.; Park, C.H.; Baek, S.H. Characterization of seasonal phytoplankton pigments and functional types around offshore island in the East/Japan Sea, based on HPLC pigment analysis. Sustainability 2022, 14, 5306. [Google Scholar] [CrossRef]
- Choi, D.H.; Noh, J.H.; An, S.M.; Choi, Y.R.; Lee, H.; Ra, K.; Kim, D.; Rho, T.K.; Lee, S.H.; Kim, K.T.; et al. Spatial distribution of cold-adapted Synechococcus during spring in seas adjacent to Korea. Algae 2016, 31, 231–241. [Google Scholar] [CrossRef]
- Hyun, M.J.; Won, J.; Choi, D.H.; Lee, H.; Lee, Y.; Lee, C.M.; Noh, J.H. A CHEMTAX Study Based on Picoeukaryotic Phytoplankton Pigments and Next-Generation Sequencing Data from the Ulleungdo–Dokdo Marine System of the East Sea (Japan Sea): Improvement of Long-Unresolved Underdetermined Bias. J. Mar. Sci. Eng. 2022, 10, 1967. [Google Scholar] [CrossRef]
- Mitchell, D.A.; Watts, D.R.; Wimbush, M.; Teague, W.J.; Tracey, K.L.; Book, J.W.; Chang, K.I.; Suk, M.S.; Yoon, J.H. Upper circulation patterns in the Ulleung Basin. Deep. Sea Res. Part II Top. Stud. Oceanogr. 2005, 12, 1617–1638. [Google Scholar] [CrossRef]
- Lee, J.Y.; Kang, D.J.; Kim, I.N.; Rho, T.K.; Lee, T.S.; Kang, C.K.; Kim, K.R. 2009. Spatial and temporal variability in the pelagic ecosystem of the East Sea (Sea of Japan): A review. J. Mar. Syst. 2009, 78, 288–300. [Google Scholar] [CrossRef]
- Kim, C.H.; Yoon, J.H. A numerical modeling of the upper and the intermediate layer circulation in the East Sea. J. Oceanogr. 1999, 55, 327–345. [Google Scholar] [CrossRef]
- Litchman, E.; Klausmeier, C.A.; Schofield, O.M.; Falkowski, P.G. The role of functional traits and trade-offs in struc-turing phytoplankton communities: Scaling from cellular to ecosystem level. Ecol. Lett. 2007, 10, 1170–1181. [Google Scholar] [CrossRef] [PubMed]
- Raven, J.A. The twelfth tansley lecture. Small is beautiful: The picophytoplankton. Funct. Ecol. 1998, 12, 503–513. [Google Scholar] [CrossRef]
- Deonarine, S.N.; Gobler, C.J.; Lonsdale, D.J.; Caron, D.A. Role of zooplankton in the onset and demise of harmful brown tide blooms (Aureococcus anophagefferens) in US mid-Atlantic estuaries. Aquat. Microb. Ecol. 2006, 44, 181–195. [Google Scholar] [CrossRef]
- Li, W.K. Annual average abundance of heterotrophic bacteria and Synechococcus in surface ocean waters. Limnol. Oceanogr. 1998, 43, 1746–1753. [Google Scholar] [CrossRef]
- Choi, D.H.; Noh, J.H. Phylogenetic diversity of Synechococcus strains isolated from the East China Sea and the East Sea. FEMS Microbiol. Ecol. 2009, 69, 439–448. [Google Scholar] [CrossRef]
- Huang, S.; Wilhelm, S.W.; Harvey, H.R.; Taylor, K.; Jiao, N.; Chen, F. Novel lineages of Prochlorococcus and Synechococcus in the global oceans. ISME J. 2012, 6, 285–297. [Google Scholar] [CrossRef]
- Shim, J.M.; Yun, S.H.; Hwang, J.D.; Jin, H.G.; Lee, Y.H.; Kim, Y.S.; Yun, S.C. Seasonal variability of picoplankton around Ullneung Island. J. Environ. Sci. Int. 2008, 17, 1243–1253. [Google Scholar] [CrossRef]
- Jephson, T.; Carlsson, P. Species-and stratification-dependent diel vertical migration behaviour of three dinoflagellate species in a laboratory study. J. Plankton Res. 2009, 31, 1353–1362. [Google Scholar] [CrossRef]
- de Souza, K.B.; Jephson, T.; Hasper, T.B.; Carlsson, P. Species-specific dinoflagellate vertical distribution in temperature-stratified waters. Mar. Biol. 2014, 161, 1725–1734. [Google Scholar] [CrossRef]
- Sin, E.; Min, W.G.; Kim, Y.-B.; Kim, T.W. Respiration of the sea urchin Mesocentrotus nudus in response to large temperature fluctuations. Mar. Environ. Res. 2019, 144, 178–185. [Google Scholar] [CrossRef] [PubMed]
- Rho, T.-K.; Kim, Y.-B.; Park, J.-I.; Lee, Y.-W.; Im, D.-H.; Kang, D.-J.; Lee, T.-S.; Yoon, S.-T.; Kim, T.-H.; Kwak, J.-H. Plankton community response to physico-chemical forcing in the Ulleung Basin, East Sea during summer 2008. Ocean Polar Res. 2010, 32, 269–289. [Google Scholar] [CrossRef]

Disclaimer/Publisher’s Note: The statements, opinions and data contained in all publications are solely those of the individual author(s) and contributor(s) and not of MDPI and/or the editor(s). MDPI and/or the editor(s) disclaim responsibility for any injury to people or property resulting from any ideas, methods, instructions or products referred to in the content. |
© 2023 by the authors. Licensee MDPI, Basel, Switzerland. This article is an open access article distributed under the terms and conditions of the Creative Commons Attribution (CC BY) license (https://creativecommons.org/licenses/by/4.0/).