
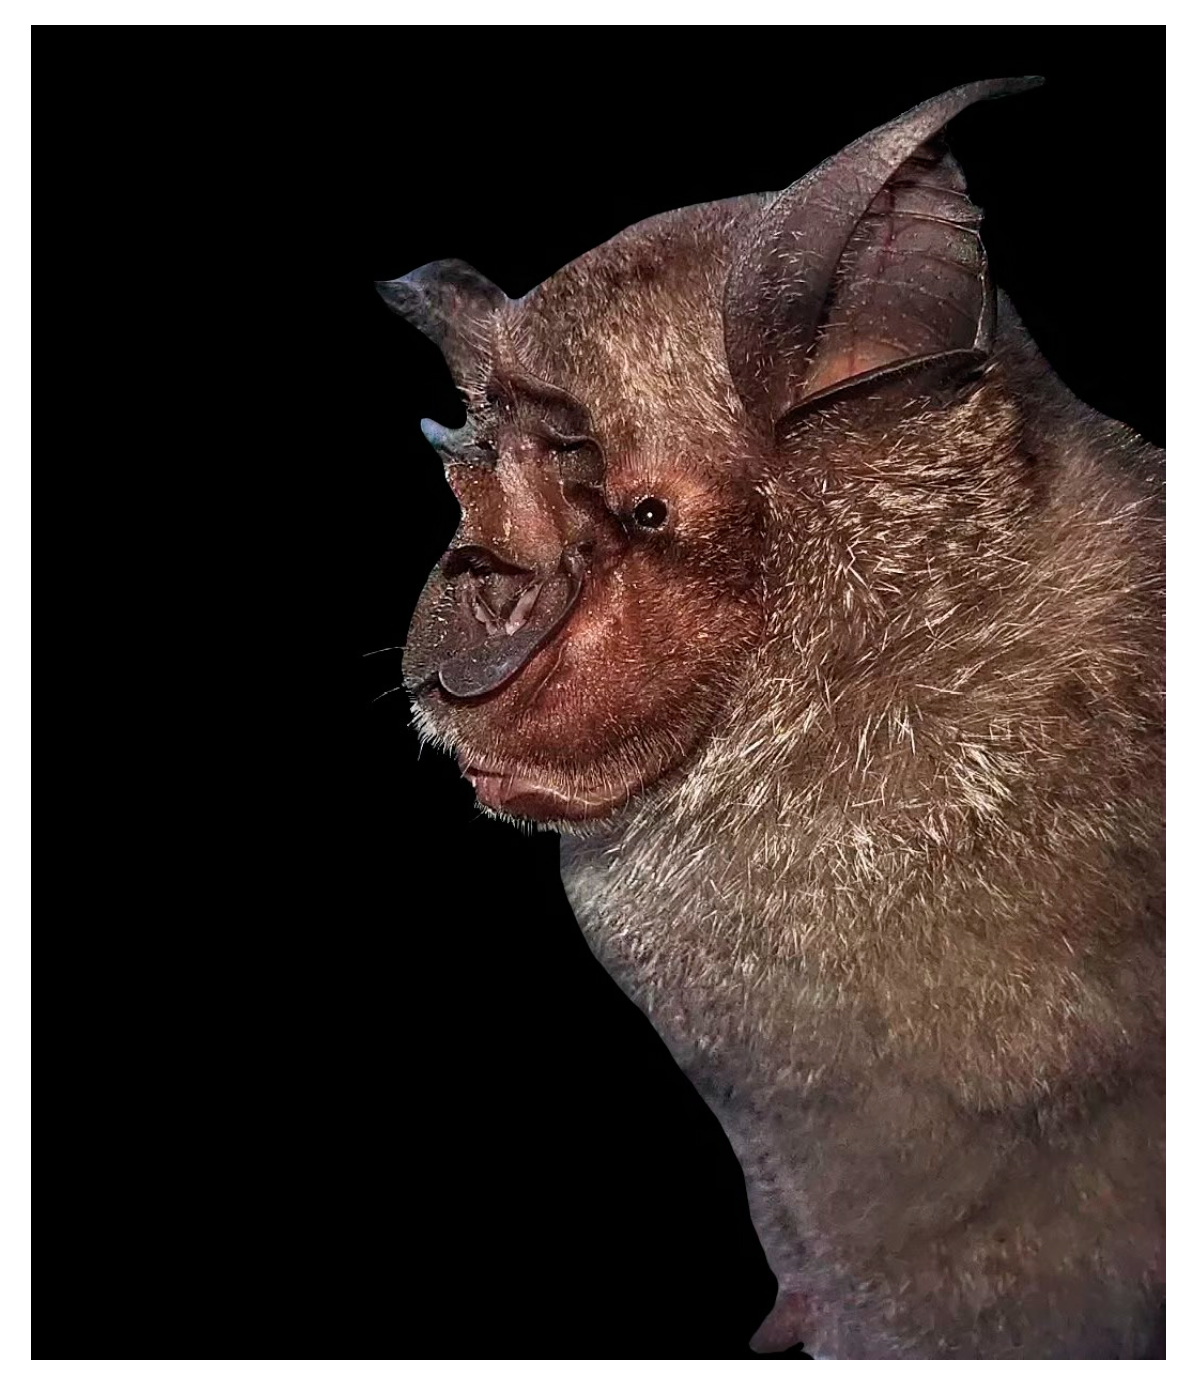
Mapping Potential Regions of Human Interaction with Acuminate Horseshoe Bats (Rhinolophus acuminatus) in Thailand
 , and
, and
Abstract
:1. Introduction
2. Materials and Methods
2.1. Study Area
2.2. Data Sources
2.2.1. Bat Occurrence Data
2.2.2. Environmental Variables
2.2.3. Urbanization
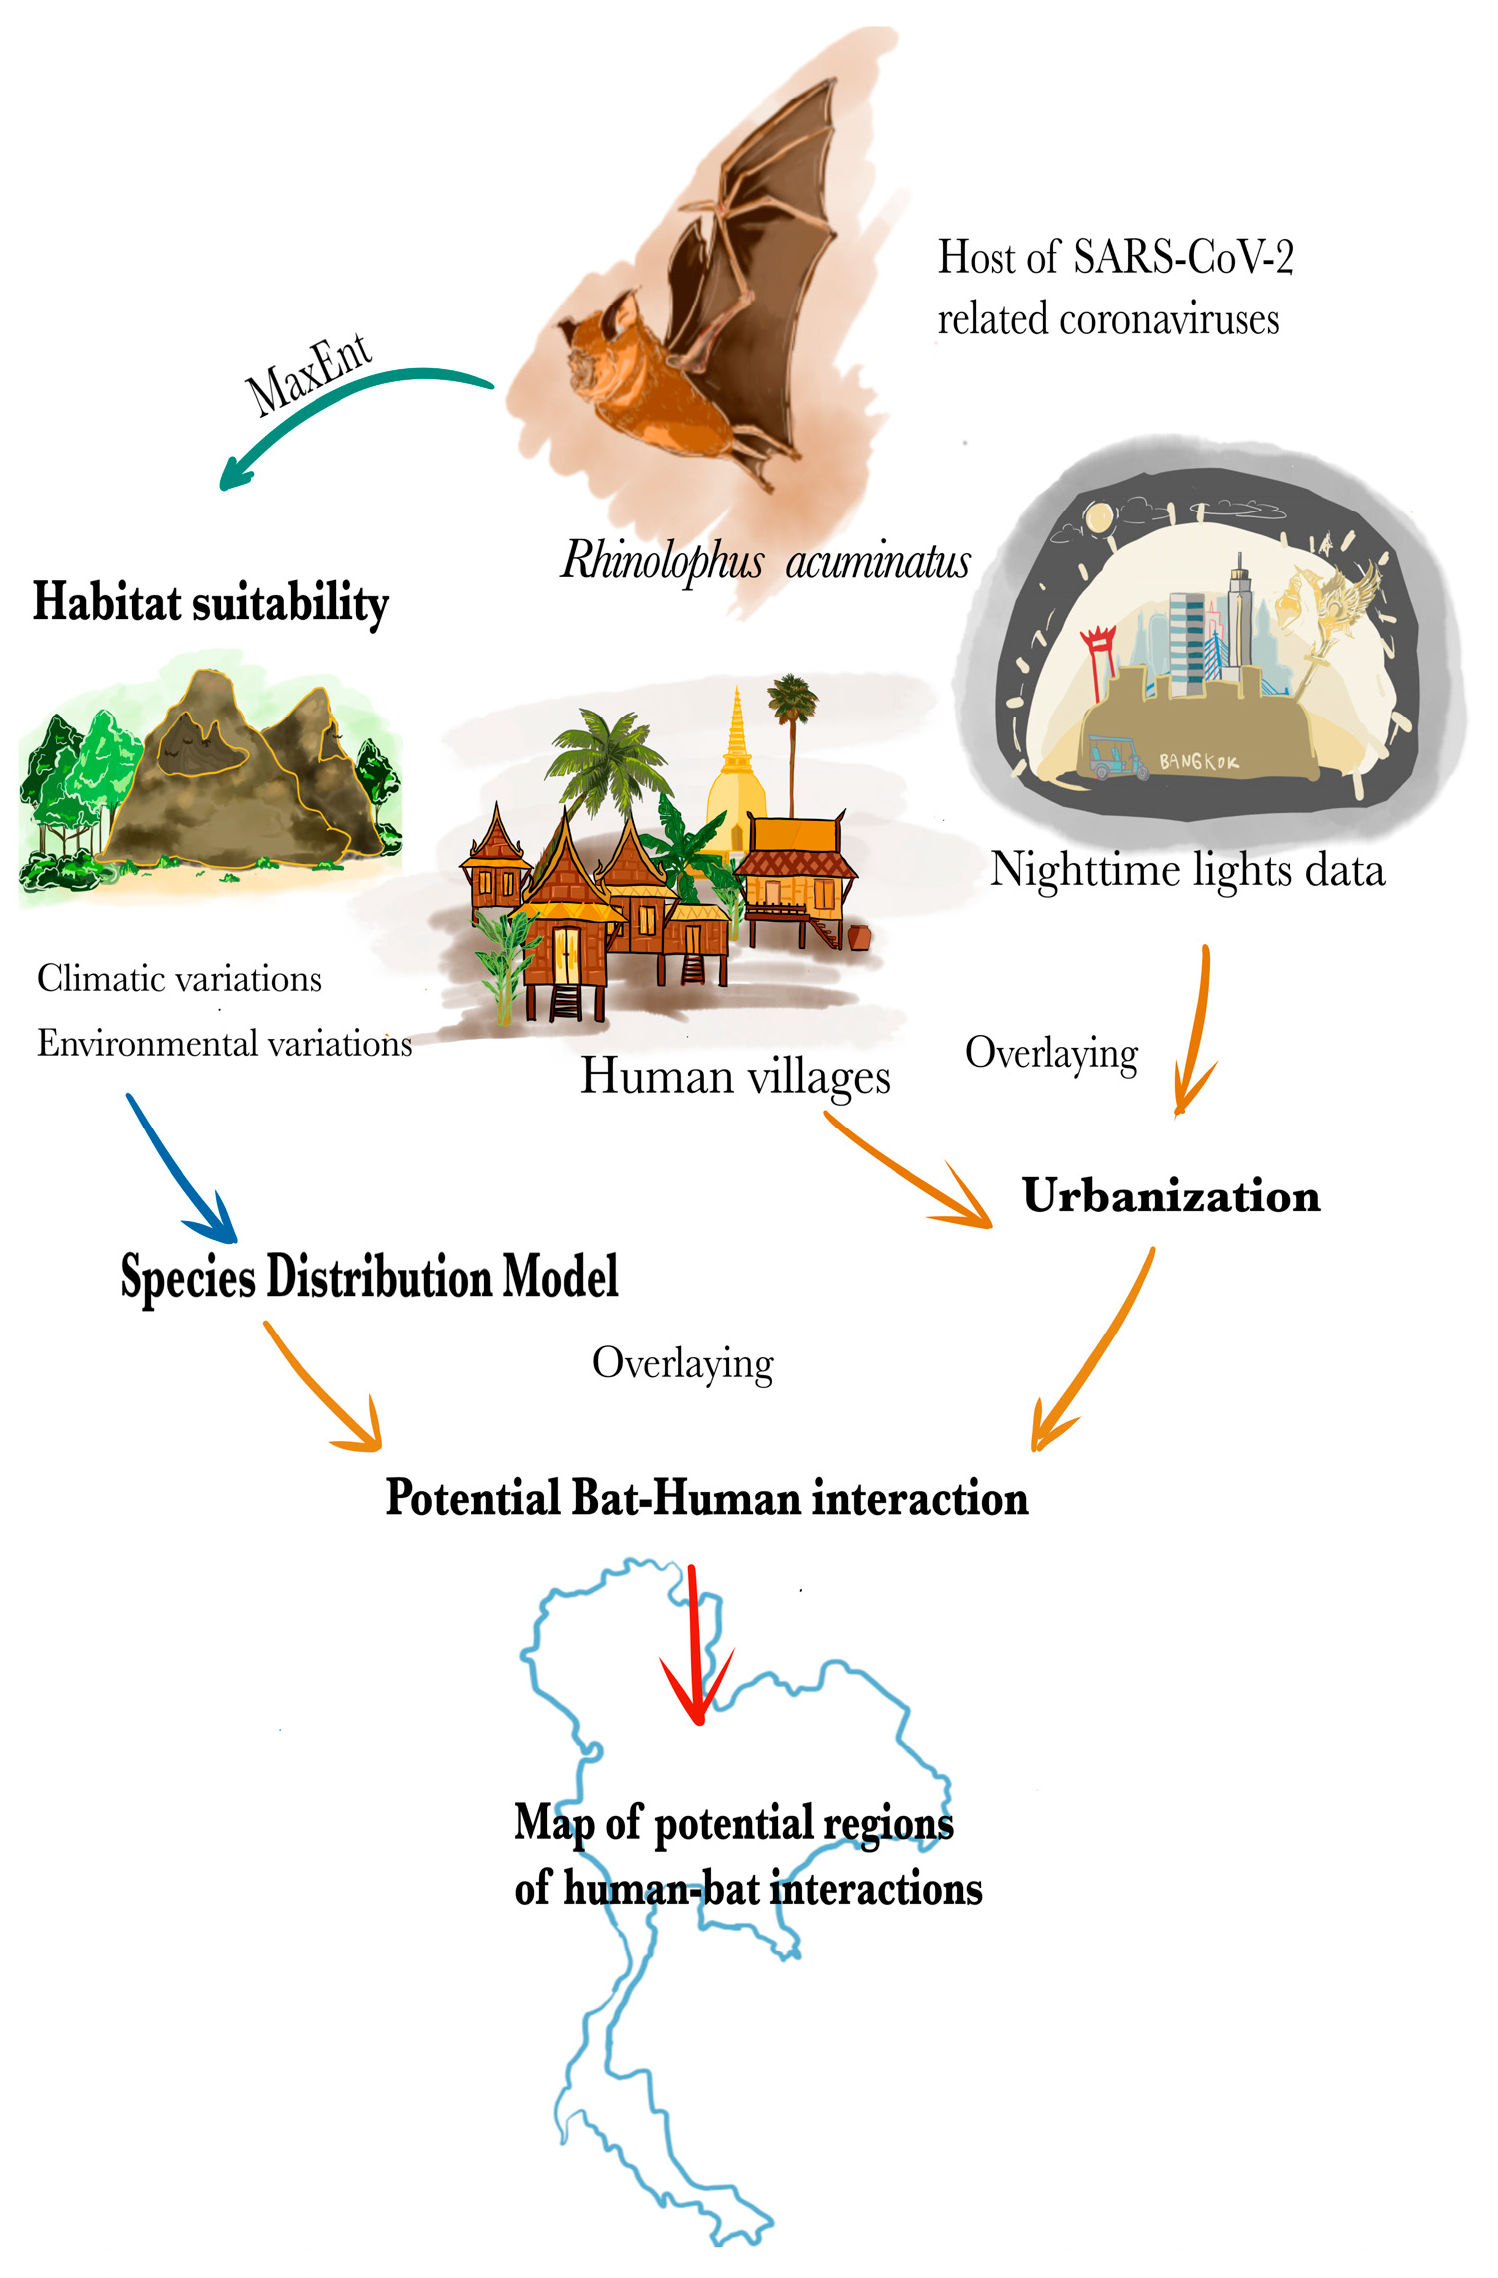
2.3. Methods
2.3.1. Species Distribution Modeling
2.3.2. Mapping the Potential Risk of Human–Bat Interactions Based on Bat Distribution
3. Results
3.1. Evaluation of the Model Accuracy and Variable Contribution
3.2. Habitat Suitability Modeling of Rhinolophus acuminatus
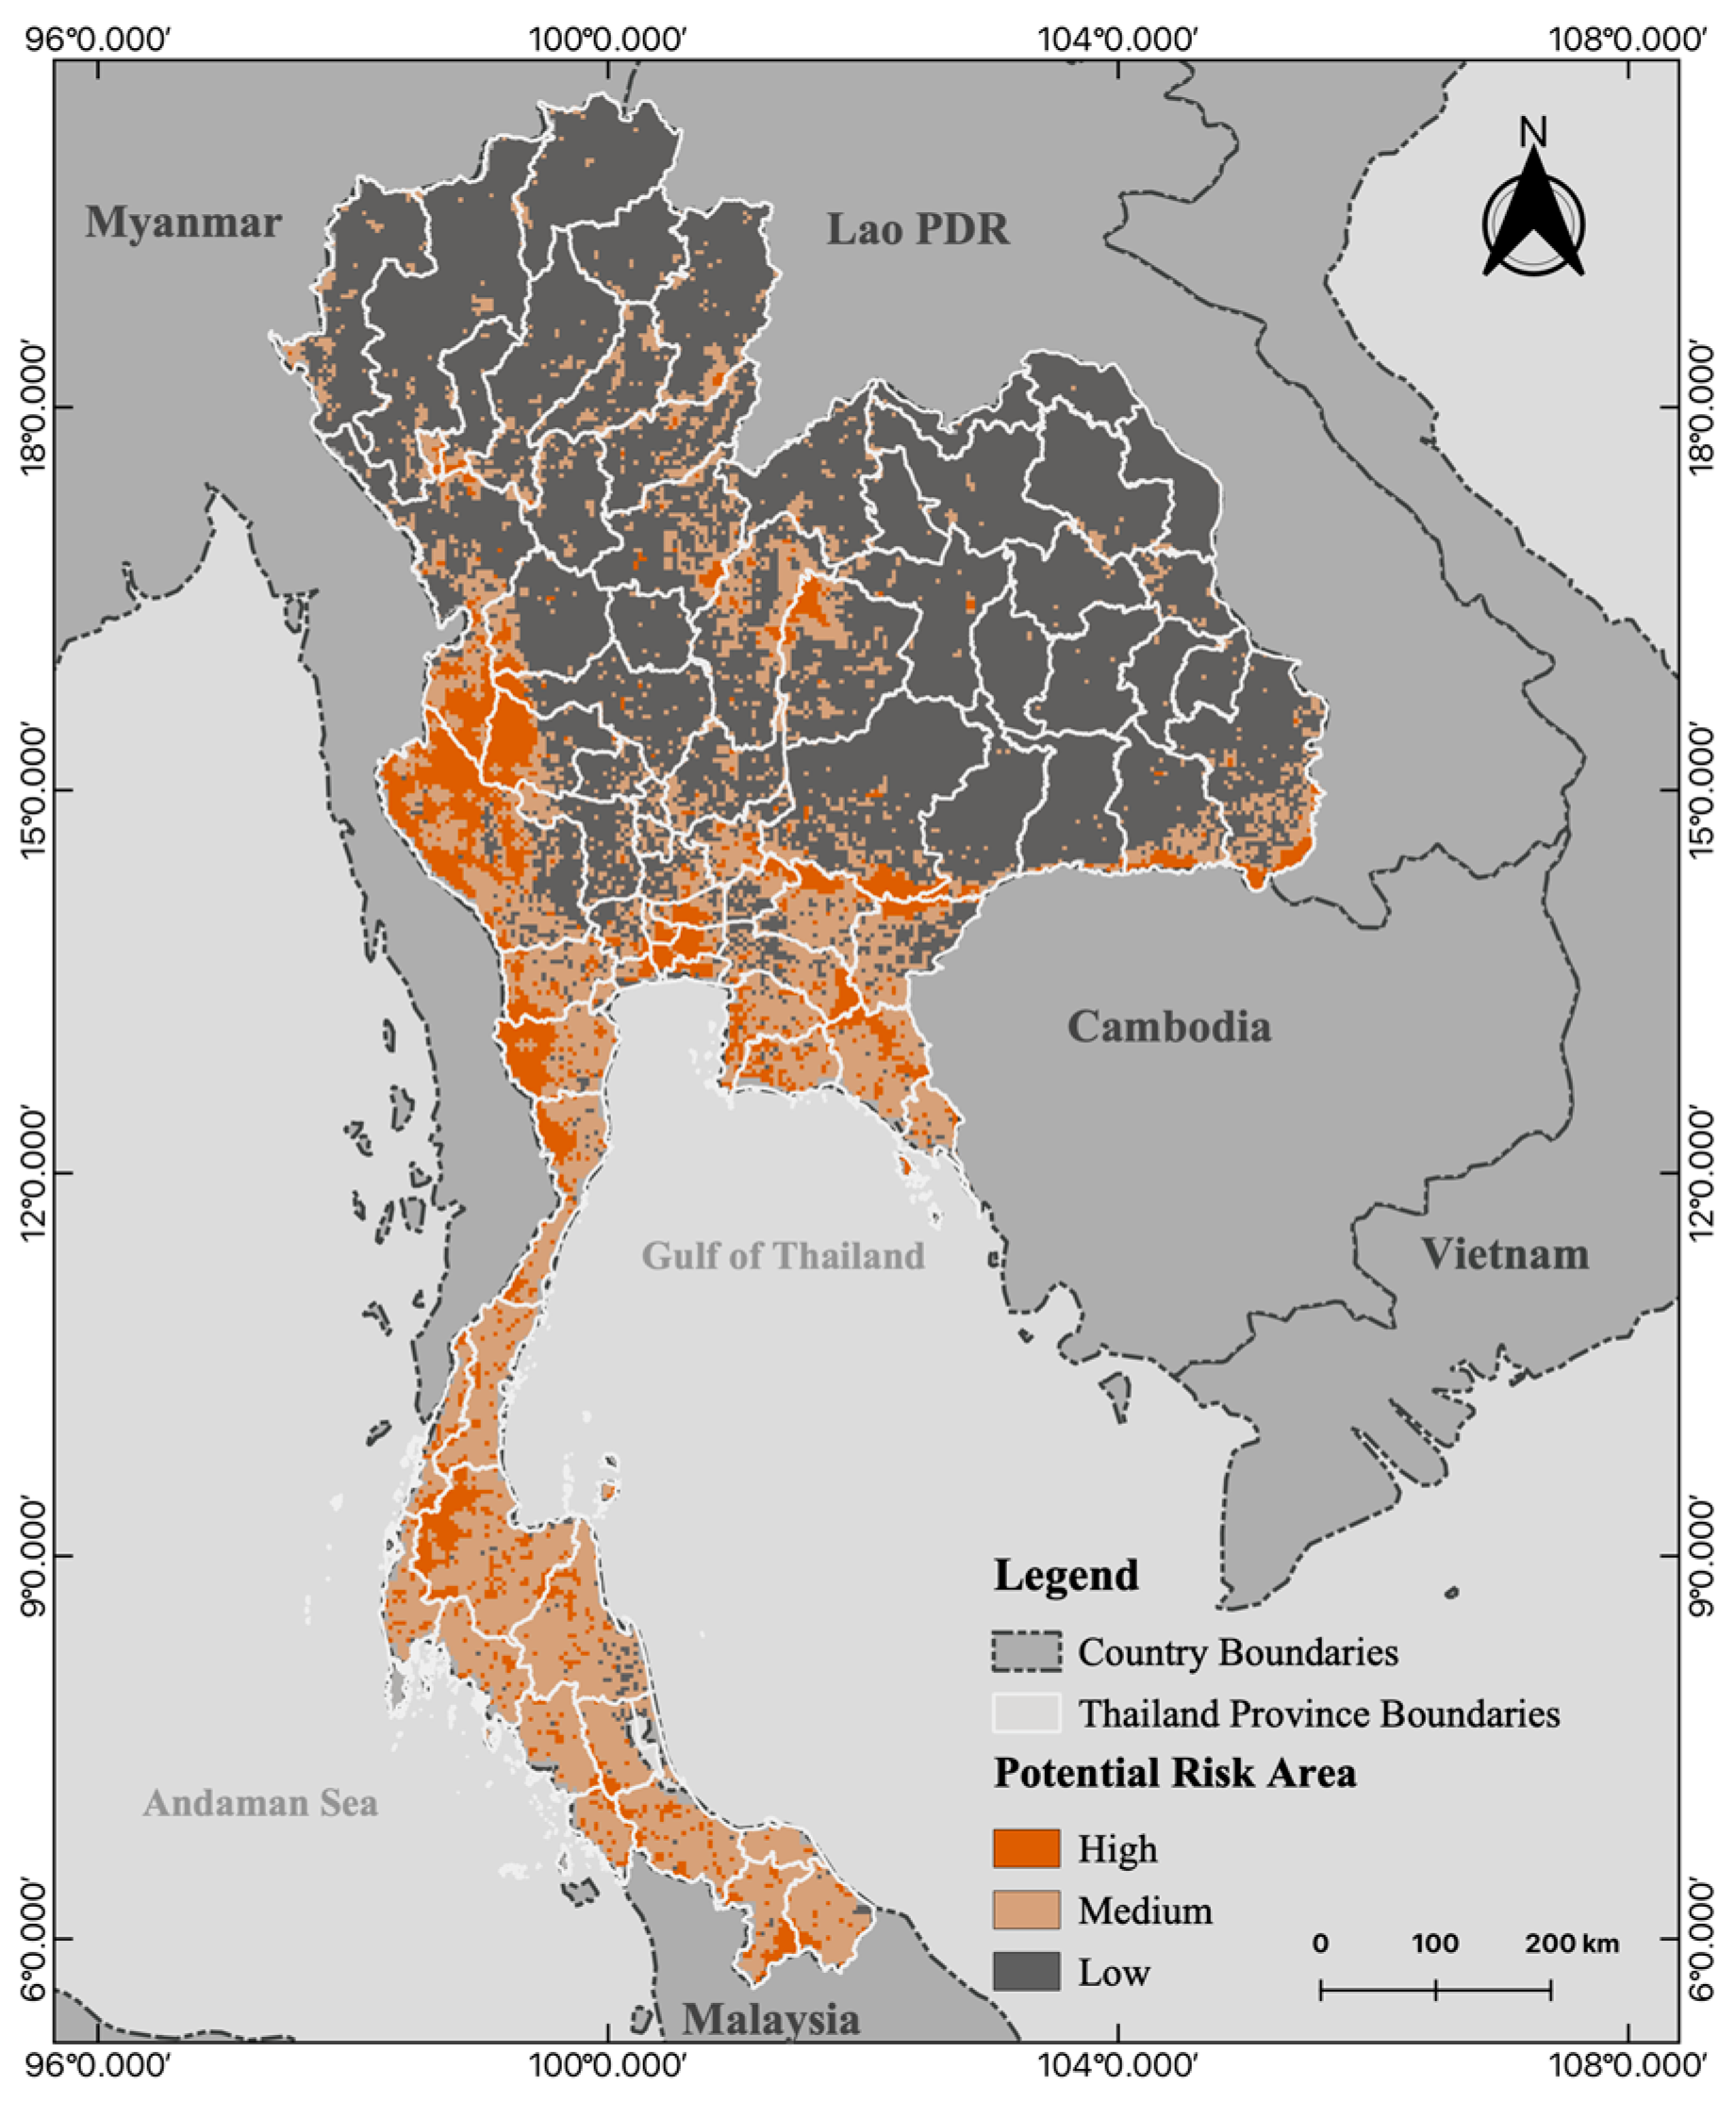
3.3. Mapping the Potential Risk of Human–Bat Interaction
4. Discussion
5. Conclusions
Supplementary Materials
Author Contributions
Funding
Institutional Review Board Statement
Informed Consent Statement
Data Availability Statement
Acknowledgments
Conflicts of Interest
References
- Origin of SARS-CoV-2. Available online: https://www.who.int/publications-detail-redirect/origin-of-sars-cov-2 (accessed on 1 December 2022).
- Wang, C.; Horby, P.W.; Hayden, F.G.; Gao, G.F. A Novel Coronavirus Outbreak of Global Health Concern. Lancet 2020, 395, 470–473. [Google Scholar] [CrossRef]
- WHO Coronavirus (COVID-19) Dashboard. Available online: https://covid19.who.int (accessed on 1 December 2022).
- Naseer, S.; Khalid, S.; Parveen, S.; Abbass, K.; Song, H.; Achim, M.V. COVID-19 Outbreak: Impact on Global Economy. Front. Public Health 2023, 10, 1009393. [Google Scholar] [CrossRef] [PubMed]
- Latinne, A.; Hu, B.; Olival, K.J.; Zhu, G.; Zhang, L.; Li, H.; Chmura, A.A.; Field, H.E.; Zambrana-Torrelio, C.; Epstein, J.H.; et al. Origin and Cross-Species Transmission of Bat Coronaviruses in China. Nat. Commun. 2020, 11, 4235. [Google Scholar] [CrossRef]
- Lytras, S.; Hughes, J.; Martin, D.; Swanepoel, P.; De Klerk, A.; Lourens, R.; Kosakovsky Pond, S.L.; Xia, W.; Jiang, X.; Robertson, D.L. Exploring the Natural Origins of SARS-CoV-2 in the Light of Recombination. Genome Biol. Evol. 2022, 14, evac018. [Google Scholar] [CrossRef]
- Li, W.; Shi, Z.; Yu, M.; Ren, W.; Smith, C.; Epstein, J.H.; Wang, H.; Crameri, G.; Hu, Z.; Zhang, H.; et al. Bats Are Natural Reservoirs of SARS-like Coronaviruses. Science 2005, 310, 676–679. [Google Scholar] [CrossRef] [PubMed]
- Zhou, P.; Yang, X.-L.; Wang, X.-G.; Hu, B.; Zhang, L.; Zhang, W.; Si, H.-R.; Zhu, Y.; Li, B.; Huang, C.-L.; et al. A Pneumonia Outbreak Associated with a New Coronavirus of Probable Bat Origin. Nature 2020, 579, 270–273. [Google Scholar] [CrossRef]
- Zhou, H.; Ji, J.; Chen, X.; Bi, Y.; Li, J.; Wang, Q.; Hu, T.; Song, H.; Zhao, R.; Chen, Y.; et al. Identification of Novel Bat Coronaviruses Sheds Light on the Evolutionary Origins of SARS-CoV-2 and Related Viruses. Cell 2021, 184, 4380–4391.e14. [Google Scholar] [CrossRef]
- Delaune, D.; Hul, V.; Karlsson, E.A.; Hassanin, A.; Ou, T.P.; Baidaliuk, A.; Gámbaro, F.; Prot, M.; Tu, V.T.; Chea, S.; et al. A Novel SARS-CoV-2 Related Coronavirus in Bats from Cambodia. Nat. Commun. 2021, 12, 6563. [Google Scholar] [CrossRef]
- Hassanin, A.; Tu, V.T.; Curaudeau, M.; Csorba, G. Inferring the Ecological Niche of Bat Viruses Closely Related to SARS-CoV-2 Using Phylogeographic Analyses of Rhinolophus Species. Sci. Rep. 2021, 11, 14276. [Google Scholar] [CrossRef]
- Lau, S.K.P.; Luk, H.K.H.; Wong, A.C.P.; Li, K.S.M.; Zhu, L.; He, Z.; Fung, J.; Chan, T.T.Y.; Fung, K.S.C.; Woo, P.C.Y. Possible Bat Origin of Severe Acute Respiratory Syndrome Coronavirus 2. Emerg. Infect. Dis. 2020, 26, 1542–1547. [Google Scholar] [CrossRef]
- Letko, M.; Seifert, S.N.; Olival, K.J.; Plowright, R.K.; Munster, V.J. Bat-Borne Virus Diversity, Spillover and Emergence. Nat. Rev. Microbiol. 2020, 18, 461–471. [Google Scholar] [CrossRef]
- Wacharapluesadee, S.; Tan, C.W.; Maneeorn, P.; Duengkae, P.; Zhu, F.; Joyjinda, Y.; Kaewpom, T.; Chia, W.N.; Ampoot, W.; Lim, B.L.; et al. Evidence for SARS-CoV-2 Related Coronaviruses Circulating in Bats and Pangolins in Southeast Asia. Nat. Commun. 2021, 12, 972. [Google Scholar] [CrossRef]
- Csorba, G.; Ujhelyi, P.; Thomas, N. Horseshoe Bats of the World (Chiroptera, Rhinolophidae); Alana Books: Shropshire, UK, 2003; ISBN 978-0-9536049-1-3. [Google Scholar]
- Burgin, C. Rhinolophus Acuminatus Peters 1871; Lynx Edicion: Barcelona, Spain, 2019. [Google Scholar] [CrossRef]
- Thong, V.D.; Thanh, H.T.; Soisook, P.; Csorba, G. The IUCN Red List of Threatened Species; IUCN Rhinolophus Acuminatus: Gland, Switzerland, 2019. [Google Scholar]
- Kanphan, S.; Wongwai, A.; Soisuk, P. Cave-Dwelling Bats of Thailand, 1st ed.; Wildlife Research Division, Department of National Parks, Wildlife and Plant Conservation: Bangkok, Thailand, 2015; ISBN 978-616-316-356-1. [Google Scholar]
- Plowright, R.K.; Parrish, C.R.; McCallum, H.; Hudson, P.J.; Ko, A.I.; Graham, A.L.; Lloyd-Smith, J.O. Pathways to Zoonotic Spillover. Nat. Rev. Microbiol. 2017, 15, 502–510. [Google Scholar] [CrossRef]
- Ellwanger, J.H.; Chies, J.A.B. Zoonotic Spillover: Understanding Basic Aspects for Better Prevention. Genet. Mol. Biol. 2021, 44, e20200355. [Google Scholar] [CrossRef]
- Jaberg, C.; Guisan, A. Modelling the Distribution of Bats in Relation to Landscape Structure in a Temperate Mountain Environment. J. Appl. Ecol. 2001, 38, 1169–1181. [Google Scholar] [CrossRef]
- Razgour, O.; Rebelo, H.; Di Febbraro, M.; Russo, D. Painting Maps with Bats: Species Distribution Modelling in Bat Research and Conservation. Hystrix Ital. J. Mammal. 2016, 27. [Google Scholar] [CrossRef]
- Peterson, A.T. (Ed.) Ecological Niches and Geographic Distributions; Monographs in Population Biology; Princeton Univ. Press: Princeton, NJ, USA, 2011; ISBN 978-1-4008-4067-0. [Google Scholar]
- Loh, E.H.; Zambrana-Torrelio, C.; Olival, K.J.; Bogich, T.L.; Johnson, C.K.; Mazet, J.A.K.; Karesh, W.; Daszak, P. Targeting Transmission Pathways for Emerging Zoonotic Disease Surveillance and Control. Vector Borne Zoonotic Dis. 2015, 15, 432–437. [Google Scholar] [CrossRef]
- Olson, S.H.; Benedum, C.M.; Mekaru, S.R.; Preston, N.D.; Mazet, J.A.K.; Joly, D.O.; Brownstein, J.S. Drivers of Emerging Infectious Disease Events as a Framework for Digital Detection. Emerg. Infect. Dis. 2015, 21, 1285–1292. [Google Scholar] [CrossRef]
- Allen, T.; Murray, K.A.; Zambrana-Torrelio, C.; Morse, S.S.; Rondinini, C.; Di Marco, M.; Breit, N.; Olival, K.J.; Daszak, P. Global Hotspots and Correlates of Emerging Zoonotic Diseases. Nat. Commun. 2017, 8, 1124. [Google Scholar] [CrossRef]
- Hassell, J.M.; Begon, M.; Ward, M.J.; Fèvre, E.M. Urbanization and Disease Emergence: Dynamics at the Wildlife–Livestock–Human Interface. Trends Ecol. Evol. 2017, 32, 55–67. [Google Scholar] [CrossRef]
- Suwannarong, K.; Balthip, K.; Kanthawee, P.; Suwannarong, K.; Khiewkhern, S.; Lantican, C.; Ponlap, T.; Bupha, N.; Amonsin, A. Bats and Belief: A Sequential Qualitative Study in Thailand. Heliyon 2020, 6, e04208. [Google Scholar] [CrossRef]
- Thai Meteorological Department. Available online: http://www.aws-observation.tmd.go.th/main/main?menuId=&pageId= (accessed on 10 December 2022).
- Enfield, N.J.; Comrie, B. (Eds.) Mainland Southeast Asian Languages: State of the Art and New Directions. In Languages of Mainland Southeast Asia; De Gruyter: Berlin, Germany, 2015; pp. 1–28. ISBN 978-1-5015-0843-1. [Google Scholar]
- World Bank Group; Asian Development Bank. Climate Risk Country Profile: Thailand; World Bank: Washington, DC, USA, 2021. [Google Scholar]
- World Bank Climate Change Knowledge Portal. Available online: https://climateknowledgeportal.worldbank.org/ (accessed on 12 November 2023).
- World Population Prospects–Population Division–United Nations. Available online: https://population.un.org/wpp/ (accessed on 12 November 2023).
- GBIF.org. GBIF Occurrence Download. Available online: https://www.gbif.org/occurrence/download/0001775-230918134249559 (accessed on 20 September 2023).
- Wildlife Yearbook. Available online: https://www.dnp.go.th/wildlife/indexpageall.htm (accessed on 10 December 2022).
- Sanborn, C.C. The Mammals of the Rush Watkins Zoological Expedition to Siam. Nat. Hist. Bull. Siam Soc. 1952, 15, 1–20. [Google Scholar]
- Hill, J.E. Kitti Thonglongya Bats from Thailand and Cambodia. Bull. Br. Mus. Nat. Hist. Zool. 1972, 22, 171–196. [Google Scholar]
- Harada, M.; Minezawa, M.; Takada, S.; Yenbutra, S.; Nunpakdee, P.; Ohtani, S. Karyological Analysis of 12 Species of Bats from Thailand. Caryologia 1982, 35, 269–278. [Google Scholar] [CrossRef]
- Hood, C.S.; Schlitter, D.A.; Iliopoulou-Georgudaki, J.; Yenbutra, S.; Baker, R.J. Chromosomal Studies of Bats (Mammalia: Chiroptera) from Thailand. Ann. Carnegie Mus. 1988, 57, 99–109. [Google Scholar] [CrossRef]
- Arnuphapprasert, A.; Riana, E.; Ngamprasertwong, T.; Wangthongchaicharoen, M.; Soisook, P.; Thanee, S.; Bhodhibundit, P.; Kaewthamasorn, M. First Molecular Investigation of Haemosporidian Parasites in Thai Bat Species. Int. J. Parasitol. Parasites Wildl. 2020, 13, 51–61. [Google Scholar] [CrossRef]
- Aiello-Lammens, M.E.; Boria, R.A.; Radosavljevic, A.; Vilela, B.; Anderson, R.P. spThin: An R Package for Spatial Thinning of Species Occurrence Records for Use in Ecological Niche Models. Ecography 2015, 38, 541–545. [Google Scholar] [CrossRef]
- R Core Team. R: A Language and Environment for Statistical Computing; R Foundation for Statistical Computing: Vienna, Austria, 2023; Available online: https://www.R-project.org/ (accessed on 1 December 2022).
- Franklin, J. Mapping Species Distributions: Spatial Inference and Prediction, 1st ed.; Cambridge University Press: Cambridge, UK, 2010; ISBN 978-0-521-87635-3. [Google Scholar]
- McGowan, N.E.; Roche, N.; Aughney, T.; Flanagan, J.; Nolan, P.; Marnell, F.; Reid, N. Testing Consistency of Modelled Predictions of the Impact of Climate Change on Bats. Clim. Change Ecol. 2021, 2, 100011. [Google Scholar] [CrossRef]
- Hansen, M.C.; Potapov, P.V.; Moore, R.; Hancher, M.; Turubanova, S.A.; Tyukavina, A.; Thau, D.; Stehman, S.V.; Goetz, S.J.; Loveland, T.R.; et al. High-Resolution Global Maps of 21st-Century Forest Cover Change. Science 2013, 342, 850–853. [Google Scholar] [CrossRef]
- Hansen, M.C.; Potapov, P.V.; Pickens, A.H.; Tyukavina, A.; Hernandez-Serna, A.; Zalles, V.; Turubanova, S.; Kommareddy, I.; Stehman, S.V.; Song, X.-P.; et al. Global Land Use Extent and Dispersion within Natural Land Cover Using Landsat Data. Environ. Res. Lett. 2022, 17, 034050. [Google Scholar] [CrossRef]
- Cave Database and Cave Locations|Caves & Caving in Thailand. Available online: https://www.thailandcaves.shepton.org.uk/cave-co-ordinates (accessed on 16 December 2022).
- Tanalgo, K.C.; Tabora, J.A.G.; De Oliveira, H.F.M.; Haelewaters, D.; Beranek, C.T.; Otálora-Ardila, A.; Bernard, E.; Gonçalves, F.; Eriksson, A.; Donnelly, M.; et al. DarkCideS 1.0, a Global Database for Bats in Karsts and Caves. Sci. Data 2022, 9, 155. [Google Scholar] [CrossRef]
- Bandara, A.P.M.J.; Madurapperuma, B.D.; Edirisinghe, G.; Gabadage, D.; Botejue, M.; Surasinghe, T.D. Bioclimatic Envelopes for Two Bat Species from a Tropical Island: Insights on Current and Future Distribution from Ecological Niche Modeling. Diversity 2022, 14, 506. [Google Scholar] [CrossRef]
- Festa, F.; Ancillotto, L.; Santini, L.; Pacifici, M.; Rocha, R.; Toshkova, N.; Amorim, F.; Benítez-López, A.; Domer, A.; Hamidović, D.; et al. Bat Responses to Climate Change: A Systematic Review. Biol. Rev. 2023, 98, 19–33. [Google Scholar] [CrossRef]
- Global Climate and Weather Data–WorldClim 1 Documentation. Available online: https://www.worldclim.org/data/index.html (accessed on 16 December 2022).
- Escobar, L.E.; Lira-Noriega, A.; Medina-Vogel, G.; Townsend Peterson, A. Potential for Spread of the White-Nose Fungus (Pseudogymnoascus Destructans) in the Americas: Use of Maxent and NicheA to Assure Strict Model Transference. Geospat. Health 2014, 9, 221. [Google Scholar] [CrossRef]
- Booth, T.H. Checking Bioclimatic Variables That Combine Temperature and Precipitation Data before Their Use in Species Distribution Models. Austral Ecol. 2022, 47, 1506–1514. [Google Scholar] [CrossRef]
- Fick, S.E.; Hijmans, R.J. WorldClim 2: New 1-km Spatial Resolution Climate Surfaces for Global Land Areas. Int. J. Climatol. 2017, 37, 4302–4315. [Google Scholar] [CrossRef]
- He, C.; Liu, Z.; Tian, J.; Ma, Q. Urban Expansion Dynamics and Natural Habitat Loss in China: A Multiscale Landscape Perspective. Glob. Change Biol. 2014, 20, 2886–2902. [Google Scholar] [CrossRef]
- Ma, T.; Zhou, C.; Pei, T.; Haynie, S.; Fan, J. Quantitative Estimation of Urbanization Dynamics Using Time Series of DMSP/OLS Nighttime Light Data: A Comparative Case Study from China’s Cities. Remote Sens. Environ. 2012, 124, 99–107. [Google Scholar] [CrossRef]
- Wang, N.; Li, S.-Y.; Yang, X.-L.; Huang, H.-M.; Zhang, Y.-J.; Guo, H.; Luo, C.-M.; Miller, M.; Zhu, G.; Chmura, A.A.; et al. Serological Evidence of Bat SARS-Related Coronavirus Infection in Humans, China. Virol. Sin. 2018, 33, 104–107. [Google Scholar] [CrossRef]
- Menachery, V.D.; Yount, B.L.; Debbink, K.; Agnihothram, S.; Gralinski, L.E.; Plante, J.A.; Graham, R.L.; Scobey, T.; Ge, X.-Y.; Donaldson, E.F.; et al. A SARS-like Cluster of Circulating Bat Coronaviruses Shows Potential for Human Emergence. Nat. Med. 2015, 21, 1508–1513. [Google Scholar] [CrossRef]
- Ge, X.-Y.; Li, J.-L.; Yang, X.-L.; Chmura, A.A.; Zhu, G.; Epstein, J.H.; Mazet, J.K.; Hu, B.; Zhang, W.; Peng, C.; et al. Isolation and Characterization of a Bat SARS-like Coronavirus That Uses the ACE2 Receptor. Nature 2013, 503, 535–538. [Google Scholar] [CrossRef]
- Elvidge, C.D.; Zhizhin, M.; Ghosh, T.; Hsu, F.-C.; Taneja, J. Annual Time Series of Global VIIRS Nighttime Lights Derived from Monthly Averages: 2012 to 2019. Remote Sens. 2021, 13, 922. [Google Scholar] [CrossRef]
- Dou, Y.; Liu, Z.; He, C.; Yue, H. Urban Land Extraction Using VIIRS Nighttime Light Data: An Evaluation of Three Popular Methods. Remote Sens. 2017, 9, 175. [Google Scholar] [CrossRef]
- Levin, N.; Zhang, Q. A Global Analysis of Factors Controlling VIIRS Nighttime Light Levels from Densely Populated Areas. Remote Sens. Environ. 2017, 190, 366–382. [Google Scholar] [CrossRef]
- Phillips, S.J.; Anderson, R.P.; Schapire, R.E. Maximum Entropy Modeling of Species Geographic Distributions. Ecol. Model. 2006, 190, 231–259. [Google Scholar] [CrossRef]
- Elith, J.; Phillips, S.J.; Hastie, T.; Dudík, M.; Chee, Y.E.; Yates, C.J. A Statistical Explanation of MaxEnt for Ecologists: Statistical Explanation of MaxEnt. Divers. Distrib. 2011, 17, 43–57. [Google Scholar] [CrossRef]
- Guidigan, M.L.G.; Azihou, F.; Idohou, R.; Okhimamhe, A.A.; Fandohan, A.B.; Sinsin, B.; Adet, L. Modelling the Current and Future Distribution of Kigelia Africana under Climate Change in Benin, West Africa. Model. Earth Syst. Environ. 2018, 4, 1225–1238. [Google Scholar] [CrossRef]
- Phillips, S.J. A Brief Tutorial on Maxent. Available online: http://biodiversityinformatics.amnh.org/open_source/maxent/ (accessed on 29 August 2023).
- Swets, J.A. Measuring the Accuracy of Diagnostic Systems. Science 1988, 240, 1285–1293. [Google Scholar] [CrossRef]
- Rulli, M.C.; D’Odorico, P.; Galli, N.; Hayman, D.T.S. Land-Use Change and the Livestock Revolution Increase the Risk of Zoonotic Coronavirus Transmission from Rhinolophid Bats. Nat. Food 2021, 2, 409–416. [Google Scholar] [CrossRef]
- Gibb, R.; Redding, D.W.; Chin, K.Q.; Donnelly, C.A.; Blackburn, T.M.; Newbold, T.; Jones, K.E. Zoonotic Host Diversity Increases in Human-Dominated Ecosystems. Nature 2020, 584, 398–402. [Google Scholar] [CrossRef]
- Jenks, G.F. The Data Model Concept in Statistical Mapping. Int. Yearb. Cartogr. 1967, 7, 186–190. [Google Scholar]
- Muylaert, R.L.; Kingston, T.; Luo, J.; Vancine, M.H.; Galli, N.; Carlson, C.J.; John, R.S.; Rulli, M.C.; Hayman, D.T.S. Present and Future Distribution of Bat Hosts of Sarbecoviruses: Implications for Conservation and Public Health. Proc. R. Soc. B 2022, 289, 20220397. [Google Scholar] [CrossRef]
- Kunz, T.H.; Fenton, M.B. Bat Ecology; University of Chicago Press: Chicago, IL, USA, 2005; ISBN 978-0-226-46207-3. [Google Scholar]
- Czenze, Z.J.; Naidoo, S.; Kotze, A.; McKechnie, A.E. Bat Thermoregulation in the Heat: Limits to Evaporative Cooling Capacity in Three Southern African Bats. J. Therm. Biol. 2020, 89, 102542. [Google Scholar] [CrossRef] [PubMed]
- Encyclopedia of Caves and Karst Science; Taylor and Francis: Chicago, IL, USA, 2014; ISBN 978-0-203-48385-5.
- Voigt, C.; Kingston, T. (Eds.) Bats in the Anthropocene: Conservation of Bats in a Changing World; Springer Open: Cham, Switzerland; New York, NY, USA, 2016; ISBN 978-3-319-25218-6. [Google Scholar]
- Leivers, S.J.; Meierhofer, M.B.; Pierce, B.L.; Evans, J.W.; Morrison, M.L. External Temperature and Distance from Nearest Entrance Influence Microclimates of Cave and Culvert-roosting Tri-colored Bats (Perimyotis Subflavus). Ecol. Evol. 2019, 9, 14042–14052. [Google Scholar] [CrossRef]
- Rainho, A.; Palmeirim, J.M. The Importance of Distance to Resources in the Spatial Modelling of Bat Foraging Habitat. PLoS ONE 2011, 6, e19227. [Google Scholar] [CrossRef]
- Lundy, M.; Montgomery, I.; Russ, J. Climate Change-linked Range Expansion of Nathusius’ Pipistrelle Bat, Pipistrellus Nathusii (Keyserling & Blasius, 1839). J. Biogeogr. 2010, 37, 2232–2242. [Google Scholar] [CrossRef]
- Frick, W.F.; Reynolds, D.S.; Kunz, T.H. Influence of Climate and Reproductive Timing on Demography of Little Brown Myotis Myotis lucifugus. J. Anim. Ecol. 2010, 79, 128–136. [Google Scholar] [CrossRef]
- Adams, R.A.; Hayes, M.A. Water Availability and Successful Lactation by Bats as Related to Climate Change in Arid Regions of Western North America. J. Anim. Ecol. 2008, 77, 1115–1121. [Google Scholar] [CrossRef]
- Prajakjitr, A.; Bumrungsri, S. The Relationship between the Proportion of Moths in Diet and Call Frequency of Bats in Superfamily Rhinolophoidea in Bala Forest, Hala-Bala Wildlife Sanctuary, Narathiwat Province; Prince of Songkla University: Songkhla, Thailand, 2008. [Google Scholar]
- Diengdoh, V.L.; Ondei, S.; Hunt, M.; Brook, B.W. Predicted Impacts of Climate Change and Extreme Temperature Events on the Future Distribution of Fruit Bat Species in Australia. Glob. Ecol. Conserv. 2022, 37, e02181. [Google Scholar] [CrossRef]
- Royal Forest Department. Thailand Forest Areas. Available online: http://forestinfo.forest.go.th/Content.aspx?id=1 (accessed on 15 July 2023).
- Vizzuality Thailand Deforestation Rates & Statistics|GFW. Available online: https://www.globalforestwatch.org/dashboards/country/THA (accessed on 15 July 2023).
- Bhandari, R.; Xue, W.; Virdis, S.G.P.; Winijkul, E.; Nguyen, T.P.L.; Joshi, S. Monitoring and Assessing Urbanization Progress in Thailand between 2000 and 2020 Using SDG Indicator 11.3.1. Sustainability 2023, 15, 9794. [Google Scholar] [CrossRef]
- Rydell, J. Exploitation of Insects around Streetlamps by Bats in Sweden. Funct. Ecol. 1992, 6, 744. [Google Scholar] [CrossRef]
- Wacharapluesadee, S.; Duengkae, P.; Rodpan, A.; Kaewpom, T.; Maneeorn, P.; Kanchanasaka, B.; Yingsakmongkon, S.; Sittidetboripat, N.; Chareesaen, C.; Khlangsap, N.; et al. Diversity of Coronavirus in Bats from Eastern Thailand. Virol. J. 2015, 12, 57. [Google Scholar] [CrossRef]
- Pramod, R.K.; Nair, A.V.; Tambare, P.K.; Chauhan, K.; Kumar, T.V.; Rajan, R.A.; Mani, B.M.; Asaf, M.; Pandey, A.K. Reverse Zoonosis of Coronavirus Disease-19: Present Status and the Control by One Health Approach. Vet. World 2021, 2817–2826. [Google Scholar] [CrossRef]
- Olival, K.J.; Cryan, P.M.; Amman, B.R.; Baric, R.S.; Blehert, D.S.; Brook, C.E.; Calisher, C.H.; Castle, K.T.; Coleman, J.T.H.; Daszak, P.; et al. Possibility for Reverse Zoonotic Transmission of SARS-CoV-2 to Free-Ranging Wildlife: A Case Study of Bats. PLoS Pathog. 2020, 16, e1008758. [Google Scholar] [CrossRef]
- Crossing the Species Barrier: COVID-19, an Example of Reverse Zoonosis. Available online: https://www.woah.org/en/crossing-the-species-barriers-covid-19-an-example-of-reverse-zoonosis/ (accessed on 14 November 2023).
- Kunz, T.H.; Braun De Torrez, E.; Bauer, D.; Lobova, T.; Fleming, T.H. Ecosystem Services Provided by Bats: Ecosystem Services Provided by Bats. Ann. N. Y. Acad. Sci. 2011, 1223, 1–38. [Google Scholar] [CrossRef]


| Variable | Permutation Importance (%) |
|---|---|
| Temperature seasonality (BIO4) | 41.1 |
| Distance from caves | 14.7 |
| Precipitation in the driest month (BIO14) | 10.5 |
| Annual temperature range (BIO7) | 8.4 |
| Isothermality (BIO3) | 6 |
| Land cover | 5.5 |
| Precipitation seasonality (BIO15) | 3.1 |
| Max temperature in the warmest month (BIO5) | 2.8 |
| Mean temperature in the coldest quarter (BIO11) | 1.6 |
| Forest canopy height | 1.4 |
| Annual precipitation (BIO12) | 1.1 |
| Min temperature in the coldest month (BIO6) | 1 |
| Elevation | 0.8 |
| Annual mean temperature (BIO1) | 0.7 |
| Precipitation in the wettest quarter (BIO16) | 0.5 |
| Mean temperature in the warmest quarter (BIO10) | 0.4 |
| Precipitation in the driest quarter (BIO17) | 0.1 |
| Mean diurnal range (BIO2) | 0.1 |
| Predicted Habitat Suitability | Current (km2) (%) | 2050 (km2) (%) | 2070 (km2) (%) |
|---|---|---|---|
| Unsuitable | 191,422.14 (37.84%) | 212,850.73 (42.08%) | 224,768.10 (44.43%) |
| Less suitable | 135,393.76 (26.76%) | 120,124.62 (23.75%) | 110,076.71 (21.76%) |
| Moderately suitable | 50,314.41 (9.94%) | 44,137.94 (8.72%) | 44,890.79 (8.87%) |
| Highly suitable | 128,698.55 (25.44%) | 128,669.48 (25.43%) | 126,048.18 (24.921%) |
Disclaimer/Publisher’s Note: The statements, opinions and data contained in all publications are solely those of the individual author(s) and contributor(s) and not of MDPI and/or the editor(s). MDPI and/or the editor(s) disclaim responsibility for any injury to people or property resulting from any ideas, methods, instructions or products referred to in the content. |
© 2023 by the authors. Licensee MDPI, Basel, Switzerland. This article is an open access article distributed under the terms and conditions of the Creative Commons Attribution (CC BY) license (https://creativecommons.org/licenses/by/4.0/).
Share and Cite
Sirichan, N.; Chaiyes, A.; Sánchez, C.A.; Wacharapluesadee, S.; Srikulnath, K.; Duengkae, P. Mapping Potential Regions of Human Interaction with Acuminate Horseshoe Bats (Rhinolophus acuminatus) in Thailand. Diversity 2023, 15, 1216. https://doi.org/10.3390/d15121216
Sirichan N, Chaiyes A, Sánchez CA, Wacharapluesadee S, Srikulnath K, Duengkae P. Mapping Potential Regions of Human Interaction with Acuminate Horseshoe Bats (Rhinolophus acuminatus) in Thailand. Diversity. 2023; 15(12):1216. https://doi.org/10.3390/d15121216
Chicago/Turabian StyleSirichan, Nutthinee, Aingorn Chaiyes, Cecilia A. Sánchez, Supaporn Wacharapluesadee, Kornsorn Srikulnath, and Prateep Duengkae. 2023. "Mapping Potential Regions of Human Interaction with Acuminate Horseshoe Bats (Rhinolophus acuminatus) in Thailand" Diversity 15, no. 12: 1216. https://doi.org/10.3390/d15121216