Next Article in Journal
Investigating the Potential Utility of Environmental DNA to Provide a Relative Abundance Index for the Depleted Teleost, Mulloway, Argyrosomus japonicus
Previous Article in Journal
Forest Disturbances Threatening Cypripedium calceolus Populations Can Improve Its Habitat Conditions
Previous Article in Special Issue
Reproductive Behaviours and Potentially Associated Sounds of the Mottled Grouper Mycteroperca rubra: Implications for Conservation
 
 
diversity-logo
Article Menu

Article Menu

Article

Cetaceans in the Mediterranean Sea: Encounter Rate, Dominant Species, and Diversity Hotspots

by
Guido Gnone
1,*,
Michela Bellingeri
2,3,
Sabina Airoldi
4,
Joan Gonzalvo
4,
Léa David
5,
Nathalie Di-Méglio
5,
Ana M. Cañadas
6,
Aylin Akkaya
7,
Tim Awbery
8,
Barbara Mussi
9,
Ilaria Campana
10,
Marta Azzolin
11,12,13,
Ayhan Dede
14,15,
Arda M. Tonay
14,15,
Clara Monaco
16,17,
Giuliana Pellegrino
18,
Paola Tepsich
19,
Aurelie Moulins
19,
Antonella Arcangeli
20,
Hélène Labach
21,
Aviad P. Scheinin
22,23,
Yaly Mevorach
22,
Roberto Carlucci
3,24,
Francesca C. Santacesaria
25,
Carla A. Chicote
26,
Manel Gazo
27,
Beatriz Tintore
28,
Jessica Alessi
29,
Alberta Mandich
30,
Luca Bittau
31,
Bruno Diaz Lopez
32,
Caroline Azzinari
33,
Gabriella La Manna
34,35,
Daniela Silvia Pace
36,37,
Donatella Decandia
38,
Alberto Castelli
39,
Silvio Nuti
40,
Marie-Catherine Santoni
41,
Alessandro Verga
42,
Nicolas Tomasi
43,
Cristina Giacoma
12,
Matteo Costantino
13,
Marta Falabrino
44 and
Arianna Azzellino
45
add Show full author list remove Hide full author list
1
Acquario di Genova, Area Porto Antico, Ponte Spinola, 1, 16128 Genova, Italy
2
Fondazione Acquario di Genova ONLUS, Area Porto Antico, Ponte Spinola, 1, 16128 Genova, Italy
3
CoNISMa, Piazzale Flaminio, 9, 00196 Roma, Italy
4
Tethys Research Institute, Viale G.B. Gadio, 2, 20121 Milano, Italy
5
EcoOcean Institut, 18 Rue des Hospices, 34090 Montpellier, France
6
Marine Geospatial Ecology Laboratory, Nicholas School of Environment, Duke University, Durham, NC 27708, USA
7
DMAD-Marine Mammals Research Association, 19 Mayis ahallesi Kaptan Arif Sokak Mehtap Apt. 54 Dukkan 20-1/1A, Kadikoy, 34738 Istanbul, Türkiye
8
Scottish Association for Marine Science (SAMS), Oban PA37 1QA, UK
9
Oceanomare Delphis Onlus, Viale Rimembranze, 14, 47924 Rimini, Italy
10
Accademia del Leviatano Onlus, Via dell’Ospedaletto, 53/55, Fiumicino, 00054 Rome, Italy
11
Department of Life Sciences and System Biology, University of Torino, Via Accademia Albertina, 13, 10123 Torino, Italy
12
Gaia Research Institute Onlus, Corso Moncalieri, 68B, 10133 Torino, Italy
13
Thalassa, Via Pietro Giuria 6/BIS, 10125 Torino, Italy
14
Faculty of Aquatic Sciences, Istanbul University, Onaltı Mart Şehitleri Cad. No 2, Fatih, 34134 İstanbul, Türkiye
15
Turkish Marine Research Foundation (TUDAV), P.O. Box 10, Beykoz, 34820 İstanbul, Türkiye
16
Associazione Marecamp, Lungomare Scardamiano, 1, Aci Castello, 95021 Catania, Italy
17
Dipartimento di Agricoltura, Alimentazione e Ambiente, Università di Catania, Via Santa Sofia, 100, 95123 Catania, Italy
18
Ketos, Corso Italia, 58, 95127 Catania, Italy
19
Fondazione CIMA, Via A. Magliotto, 2, 17100 Savona, Italy
20
Institute for Environmental Protection and Research, Via Vitaliano Brancati, 48, 00144 Roma, Italy
21
MIRACETI, Place des Traceurs de Pierres, La Couronne, 13500 Martigues, France
22
Morris Kahn Research Station, Department of Marine Biology, Leon H. Charney School of Marine Sciences, University of Haifa, 199 Aba Koushy Ave., Mount Carmel, Haifa 3498838, Israel
23
Delphis (NGO), Ort St. 1, Ashdod 7724219, Israel
24
Department of Biosciences, Biotechnologies and Environment, Università degli Studi di Bari Aldo Moro, Piazza Umberto I, 1, 70121 Bari, Italy
25
Jonian Dolphin Conservation, Corso Vittorio Emanuele II, 1, 74123 Taranto, Italy
26
SUBMON, Carrer d’Ortigosa, 14, 08003 Barcelona, Spain
27
Department of Evolutionary Biology, Ecology and Environmental Sciences, University of Barcelona, Diagonal, 643, 08028 Barcelona, Spain
28
Archipelagos Institute of Marine Conservation, Mesokampos-Pythagoreio, 83103 Samos, Greece
29
MeRiS-Mediterraneo Ricerca e Sviluppo APS, Via Genova, 5, 92026 Favara, Italy
30
Dipartimento di Scienze della Terra, dell’Ambiente e della Vita, University of Genoa, Corso Europa, 26, 16132 Genova, Italy
31
SEA ME Sardinia, Via delle Ginestre, 6, 07024 La Maddalena, Italy
32
Bottlenose Dolphin Research Institute, Av. de Beiramar, 192, 36980 O Grove, Spain
33
Association BREACH, 11 Rue des Matins Bleus, 66300 Ponteilla, France
34
Mareterra Onlus, St. S’Anna Pollina, 160, 07041 Alghero, Italy
35
Dipartimento di Scienze Chimiche, Fisiche, Matematiche e Naturali, Università di Sassari, Via Piandanna, 4, 07100 Sassari, Italy
36
Department of Environmental Biology, Sapienza University of Rome, Piazzale Aldo Moro, 5, 00185 Roma, Italy
37
Unit of Capo Granitola, Institute of Anthropogenic Impacts and Sustainability in the Marine Environment (IAS), National Research Council, Via del Mare, Torretta Granitola, 3, 91021 Trapani, Italy
38
Associazione CRAMA, Via Principe di Piemonte, 2, 07046 Porto Torres, Italy
39
Dipartimento di Biologia, Università di Pisa, Via Derna, 1, 56126 Pisa, Italy
40
CE.TU.S Cetacean Research Centre, Villa Borbone, Via dei Tigli, 55049 Viareggio, Italy
41
Office de l’Environnement de la Corse, Réserve Naturelle des Bouches de Bonifacio, 14 Avenue J. Nicoli, 20250 Corte, France
42
Golfo Paradiso Whale Watching, Via Piero Schiaffino, 14/5, 16032 Camogli, Italy
43
Association CARI Corse, lotissement A Strenna, Route du Calvaire, 20250 Corte, France
44
WWF Switzerland, Piazza Indipendenza, 6, 6500 Bellinzona, Switzerland
45
Politecnico di Milano, Piazza Leonardo da Vinci, 32, 20133 Milano, Italy
*
Author to whom correspondence should be addressed.
Diversity 2023, 15(3), 321; https://doi.org/10.3390/d15030321
Submission received: 21 October 2022 / Revised: 3 February 2023 / Accepted: 5 February 2023 / Published: 22 February 2023
(This article belongs to the Special Issue Biodiversity Conservation in Mediterranean Sea)

Abstract

:
We investigated the presence and diversity of cetaceans in the Mediterranean Sea, analysing the data collected by 32 different research units, over a period of 15 years (2004–2018), and shared on the common web-GIS platform named Intercet. We used the encounter rate, the species prevalence, and the Shannon diversity index as parameters for data analysis. The results show that cetacean diversity, in the context of the Mediterranean basin, is generally quite low when compared with the eastern Atlantic, as few species, namely the striped dolphin, the bottlenose dolphin, the fin whale, and the sperm whale, dominate over all the others. However, some areas, such as the Alboran Sea or the north-western Mediterranean Sea, which includes the Pelagos Sanctuary (the Specially Protected Area of Mediterranean Interest located in the northern portion of the western basin), show higher levels of diversity and should be considered hotspots to be preserved. Primary production and seabed profile seem to be the two main drivers influencing the presence and distribution of cetaceans, with the highest levels of diversity observed in areas characterized by high levels of primary production and high bathymetric variability and gradient. This collective work underlines the importance of data sharing to deepen our knowledge on marine fauna at the scale of the whole Mediterranean Sea and encourages greater efforts in the networking process, also to accomplish the requirements of the Marine Strategy Framework Directive, with particular reference to Descriptor 1: biological diversity is maintained.

1. Introduction

The Mediterranean is a semi-enclosed sea, embedded between Eurasia and Africa and connected to the Atlantic Ocean through a natural, 59-km wide channel, the Strait of Gibraltar. It is an oligotrophic sea [1,2], with a low level of primary productivity and biomass compared with the Atlantic, but owing to its geological history and particular conformation, it is believed to host a high level of biodiversity, with more than 17,000 reported marine species, of which about one-fifth are considered endemic [3].
About 6–5.3 million years ago, during the Messinian, the connection channel with the Atlantic closed as a result of the movements of continental masses, causing a partial or nearly complete desiccation of the Mediterranean basin—the Messinian salinity crisis [4,5]. It is believed that, because of this upheaval, most of the species that populated the Mediterranean Sea have disappeared, with the relative collapse of biodiversity. Subsequently, in the early Pliocene, the channel reopened and the basin was re-colonized by Atlantic species, including cetaceans [3,6].
At present, the regular presence of nine species of cetaceans, all of Atlantic origin, is reported by the monitoring and research campaigns that have been conducted in the area [7]. Among odontocetes, the striped dolphin (Stenella coeruleoalba), the common bottlenose dolphin (Tursiops truncatus), the common dolphin (Delphinus delphis), the Risso’s dolphin (Grampus griseus), the long-finned pilot whale (Globicephala melas), and the rough-toothed dolphin (Steno bredanensis), belonging to the family Delphinidae, as well as the Cuvier’s beaked whale (Ziphius cavirostris) and the sperm whale (Physeter macrocephalus), belonging to the family Ziphiidae and Physeteridae respectively, are considered resident alongside the fin whale (Balaenoptera physalus), belonging to the family Balaenopteridae, which is the only regularly sighted mysticete. Four more species, namely, the killer whale (Orcinus orca), the false killer whale (Pseudorca crassidens), the minke whale (Balaenoptera acutorostrata), and the humpback whale (Megaptera novaeangliae), are considered occasional visitors to the Mediterranean basin [7,8,9,10,11,12].
The Black Sea harbour porpoise (Phocoena phocoena relicta, Phocoenidae) is a subspecies of harbour porpoise that inhabits the Black Sea and the neighbouring waters of the Marmara Sea [13,14] and is rarely seen in the northern Aegean Sea [15]. It is considered to be a relict species, once distributed throughout the Mediterranean Sea [16,17]. The presence of Phocoena phocoena relicta in the Black Sea suggests that, in the past, the Mediterranean had hosted a higher biodiversity in terms of cetacean species. With reference to modern times, it is believed that the common dolphin, assessed as quite rare in Mediterranean waters [18], may once have been abundant (perhaps the most abundant species in the basin) and experienced a sudden decrease following the middle of the last century (but the trend could have started earlier) [19,20]. It is not known, however, whether other species have experienced similar trends, following the progressive increase in both direct and indirect anthropogenic pressures. Moreover, some species, such as the long-finned pilot whale or the Cuvier’s beaked whale, although considered regularly present in the Mediterranean, have a limited distribution and their sighting outside some specific areas is quite exceptional [21,22]. The lack of historical data, even relatively recently, does not allow comparison with the pre-industrial period and prevents us from knowing whether these species were once more abundant and widespread than today or whether the Mediterranean Sea, owing to its naturally oligotrophic conditions, offers only a few areas compatible with their survival.
The aim of the study is to update the current knowledge on cetacean presence and diversity in the Mediterranean Sea, in order to detect changes and define a baseline for future comparative assessments. The analysis concerns data collected by many different research units over a period of 15 years, focusing on species encounter rates, prevalence, and diversity.

2. Material and Methods

The data were collected by 32 research groups operating in the Mediterranean Sea over a period of 15 years (i.e. from 2004 to 2018). Most of the data were then shared on the web-GIS platform Intercet (https://www.intercet.it/, accessed 1 October 2022), while some were later included in the common dataset (see Table 1 for details). The investigated area includes the Alboran Sea; the Gulf of Lion and the Ligurian Sea; the Tyrrhenian Sea; the waters around Sicily and the Sicily Strait; the northern Ionian Sea, along the Italian and Greek coasts; the Adriatic Sea; the Aegean Sea, along the coast of Türkiye; the Turkish Straits System, consisting of the Marmara Sea, Istanbul, and Çanakkale Straits; and the eastern Mediterranean Sea, off the coast of Israel, Lebanon, and Syria (Table 1, Figure 1).
Data were collected using different research platforms (rubber dinghies, sailboats and motorsailers, whale watching boats, and ferries) and the sampling effort was performed mainly from May to September, in favourable weather conditions (sea state <4 in the Douglas scale), following random tracks or fixed line transects.
As the aim of the work was to map the diversity of species in the sampled areas, we only considered the sighting positions and the species identification as baseline data for our analysis, neglecting the group size, as it varies according to the individual species’ sociality. Including the group size in the analysis could thus severely reduce the diversity index, underestimating the presence of the species that aggregate in small groups. Furthermore, group size can be quite difficult to estimate, especially for those species that form large aggregations, introducing a major bias in the analysis.
The sampling tracks of the different research groups were mapped using the software ArcGIS Desktop 10.5 (ESRI), and the sampling effort was measured within a grid of 20 × 20 km cells as in the work of Mannocci and co-authors [23].
The common dataset was used to measure the overall cetacean species encounter rate, the species prevalence, and the Shannon diversity index (see below) in the three main bathymetric domains of the sampled areas (see Figure 1): the continental shelf (0–200 m), the continental slope (200–2000 m), and the pelagic waters over the abyssal plain (>2000 m).

2.1. Encounter Rate

The encounter rate (ER) is an indicator of the sighting success in relation to the sampling effort in standard conditions and is calculated as the number of sightings over the distance travelled in kilometres.
ER = sightings/kms
The ER is a simple and immediate index to measure the presence of different cetacean species in the study area. As the effort is the same for all the species potentially present, the resulting ER is normalized. It should be noted that the ER is susceptible to the sighting conditions and the kind of vessel used for sampling, with particular reference to the height of the sighting point (and the resulting visual horizon), so it should be used with some caution.
We first measured the species ER on the original dataset (as it was), in aggregate form and on an annual basis, according to the above-described bathymetric domains (0–200 m, 200–2000 m, >2000 m), without any preliminary analysis and possible adjustment connected to the different research platforms used.
Before mapping the ER, we performed a critical analysis of the sighting success obtained by the different research vessels, classifying them into three main categories, based on the height of the observation point above sea level: (A) dedicated vessels with height <4.5 m (including rubber dinghy and sail boats); (B) dedicated vessels with height between 4.75 and 10.5 m (including research boats and whale watching vessels); and (C) ships with height between 12.5 and 29 m (including ferries).
The Wilcoxon signed rank test was used to compare the ER of the striped dolphin (considered the most common species in the offshore domains) among different platforms within the same grid cells for each subzone (paired data test). In the case of statistical significance, a weight was used to make the encounter rates between platforms comparable. The ER was then calculated for each sampled cell (20 × 20 km) of the grid with an effort greater than the diagonal of the cell (effort ≥ 28 km) to mitigate possible bias due to limited effort, as in the work of [24].

2.2. Species Prevalence

By “species prevalence”, we mean the proportion of sightings of a given species out of the total number of sightings. The prevalence can thus range from 0 (no sightings of the selected species in the area considered) to 1 (all sightings concern the selected species). Unlike the ER, this analysis does not provide information on the sighting success of the species in a given area, but only about its prevalence over the other species.

2.3. Shannon Diversity Index

The Shannon index (usually denoted as H) is one of most popular indices used to measure the diversity of species [25]. The index is given by the following formula:
H = −Σpi * ln(pi)
where pi is the proportion, within the entire community, of the species i.
It should be considered that the Shannon index does not take into account the sampling effort, which is the same for all the species monitored and is thus “self-normalized”. This makes it easier to compare different contexts in terms of diversity, but the Shannon index, like the “species prevalence”, does not provide any information on the density. An area with few sightings, but equally distributed among the different species, thus has a higher diversity index than an area in which the same species are sighted with greater success (in relation to the sampling effort), but where some of them tend to prevail over the others.
The above-described analyses (encounter rate, species prevalence, and Shannon index) were performed for each sampling cell of the grid. The results obtained were referred to the centroid and processed with a Kernel density analysis [26]. The Kernel density analysis calculates a magnitude-per-unit area from point or polyline features using a Kernel function to fit a smoothly tapered surface to each point and produces a map of the relative density, represented by a colour gradient. Some of the Kernel density parameters can be set to obtain a more detailed or smoothed picture. The following Kernel density parameters have been set to produce our maps.
Kernel density parameters (ER and prevalence maps for single species): cell size x, y = 5 × 5 km; radius ≈ 30 km; criterion for division into classes: natural breaks.
Kernel density parameters (ER for all aggregated species and Shannon index): cell size x, y = 5 × 5 km; radius ≈ 40 km; criterion for division into classes: natural breaks.
The natural breaks algorithm aims to identify natural groupings of data to create interval classes. The resulting classes will be such that there will be maximum variance between individual classes and minimum variance within each class.
The Shannon index (together with the encounter rate) was also used to compare the diversity of cetaceans, in the bathymetric domains already described (0–200 m, 200–2000 m, and >2000 m), in eight subzones of the Mediterranean (Figure 1): M1 (corresponding to the Alboran Sea), M2 (corresponding to the north-western Mediterranean Sea), M3 (corresponding approximately to the Tyrrhenian Sea), M4 (corresponding approximately to the Strait of Sicily), M5 (corresponding approximately to the Ionian Sea and Gulf of Corinth), M6 (corresponding to the Adriatic Sea), M7 (corresponding to the Aegean Sea), and M8 (corresponding to the eastern Mediterranean Sea).
Diversity indexes and encounter rates have been tested through generalised linear models (GLMs, see below), also allowing to account for the heterogeneity of the effort coverage:
y i j k = μ + x e f f o r t + α i + β j + α β i j + ε i j k
where
yijk: kth encounter rate/diversity index;
μ: true overall mean;
xeffort: covariate to account for the effort coverage;
αi: effect of geographical subzones i, such that αi = μiμ (Factor A, see Figure 1);
βj: effect of depth classes j, such that βj = μjμ (Factor B);
μi: true population mean for the ith level of Factor A;
μj: true population mean for the jth level of Factor B;
αβij: geographic zone * depth classes interaction term;
εijk: error for the kth observation.
In pairwise multiple comparisons of factors, the Bonferroni correction was applied to adjust the significance level.
Finally, we selected the research units that have carried out at least five consecutive sampling years in the continental slope domain (eight units in total) and we analysed their datasets separately, looking for possible temporal trends in the H index through the Spearman’s rank correlation test. We selected data collected in the continental slope domain (200–2000 m), as the diversity on the continental shelf domain (0–200 m) may be too low to detect possible trends, while only two units collected data in the pelagic domain (>2000 m).

3. Results

The common dataset includes a total of 795,989 km of sampling effort, carried out by the different research units between 2004 and 2018 (Table 1, Figure 1). The sampling surveys were not equally distributed within the Mediterranean Sea, but tended to be concentrated in some geographical areas, such as the northern portion of the Alboran Sea, the Pelagos Sanctuary, the waters around Sicily and the Sicily Channel, the Ionian Sea (in the Gulf of Taranto and along the coast of Greece), the central portion of the Adriatic Sea, the Aegean Sea (along the coast of Türkiye), and the eastern Mediterranean Sea (along the coast of Türkiye, Israel, Lebanon, and Syria). Only few data came from the southwest, while no sampling effort was available in the southeast. From a seasonal point of view, the sampling effort was mainly concentrated from May to September, while little data were collected in the other months (Figure 2).
Figure 3 displays the effort per sampling cell of 20 × 20 km, which represents the basis for the following ER maps, processed using the Kernel density analysis. The effort is higher in the coastal areas and in correspondence to the ferry tracks that cross the Pelagos area, whereas in the other areas (and in the other bathymetric domains), it is usually lower and more homogeneous. This effort has produced a total of 17,763 sightings, referable to 12 different cetacean species (Table 1, Figure 4).
Among the 12 species sighted, 9 were regularly observed in the study areas (Table 2): the striped dolphin (Stenella coeruleoalba), with 8954 sightings (50.4%); the common bottlenose dolphin (Tursiops truncatus), with 4043 sightings (22.8%); the common dolphin (Delphinus delphis) with 695 sightings (3.9%); the Risso’s dolphin (Grampus griseus), with 239 sightings (1.3%); the long-finned pilot whale (Globicephala melas), with 294 sightings (1.7%); the Black Sea harbour porpoise (Phocoena phocoena relicta), which was sighted only in the Marmara Sea, close to the Istanbul Strait (Bosphorus), with 26 sightings (0.1%); the Cuvier’s beaked whale (Ziphius cavirostris), with 312 sightings (1.8%); the sperm whale (Physeter macrocephalus), with 1001 sightings (5.6%); and the fin whale (Balaenoptera physalus), with 2196 sightings (12.4%). The other three species, the Minke whale (Balaenoptera acutorostrata), the Sowerby’s beaked whale (Mesoplodon bidens), and the rough-toothed dolphin (Steno bredanensis), were sighted on only one occasion and should be considered occasional, at least in the areas surveyed by the research units. These latter species were not included in the subsequent analysis (see Figures S1–S9 of the Supplementary Materials for maps of sighting distribution per species).
Analysing the whole dataset (“All data” column in Table 2), the four most sighted species (striped dolphin, bottlenose dolphin, fin whale, and sperm whale) account for about 91% of sightings. Particularly, on the continental shelf (0–200 m), only two species (bottlenose dolphin and striped dolphin) represent about 91% of sightings; on the continental slope (200–2000 m), five species (striped dolphin, sperm whale, fin whale, bottlenose dolphin, and common dolphin) account for about 92%, while in the pelagic waters (>2000 m), the sightings of the striped dolphin and fin whale account for about 90%. In Figure 5, the ER of the species in the bathymetric domains is reported, together with the respective sampling effort. The total ER is lowest on the continental shelf (0–200 m) and highest in pelagic waters >2000 m. The continental slope (200–2000 m) shows a more equal composition of species, suggesting a higher diversity. In relation to the ER of individual species, the bottlenose dolphin and the striped dolphin prevail on the continental shelf (0–200 m) and on the offshore domains (200–2000 m; >2000 m), respectively; the fin whale shows a clear preference for pelagic waters >2000 m; while the sperm whale is sighted with similar ER both on the continental slope (200–2000 m) and in pelagic waters (>2000 m).
The analysis of the annual ER shows how the species distribution, in the three bathymetric domains, is quite consistent over time, at least with regards to the dominant species, confirming the reliability of the general pattern. In the pelagic waters, however, the ER shows significant annual variations, which could be partially due to the low (and heterogeneous) effort performed over time in this bathymetric domain (see Figures S10 and S11A–C of the Supplementary Materials).

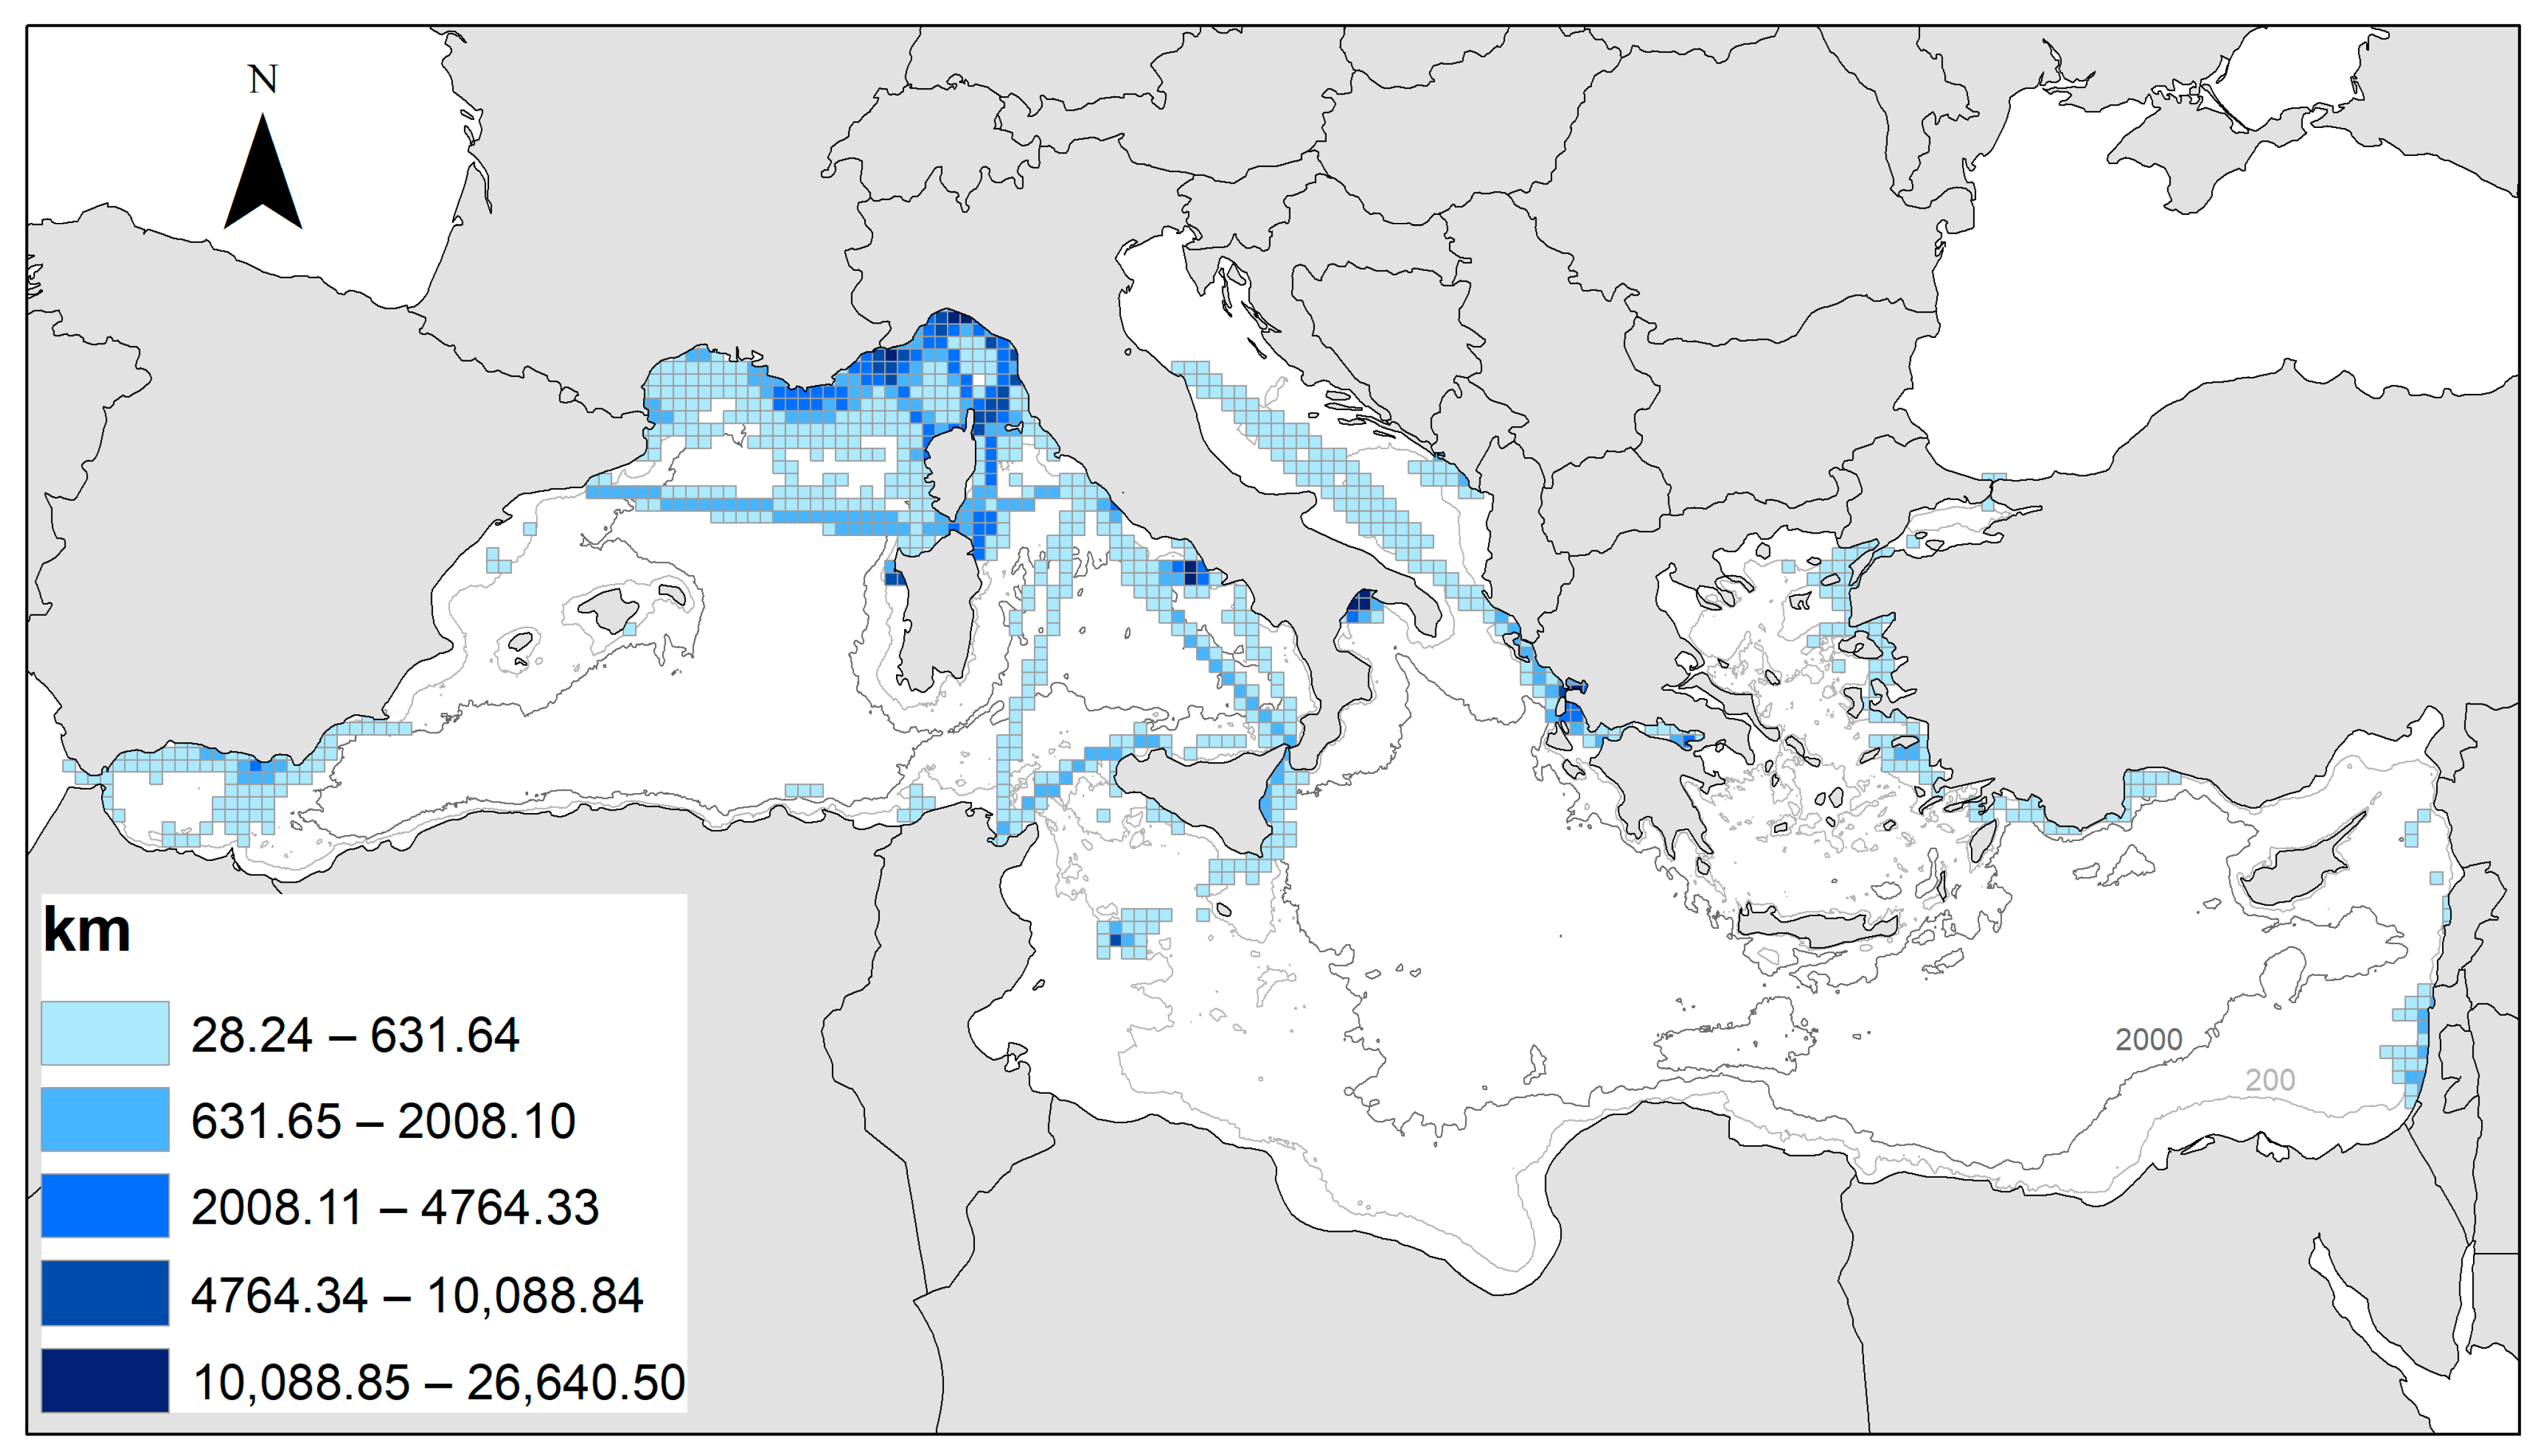
3.1. Mapping the Species ER and Prevalence

Before mapping the species ER, we performed a critical analysis of the sighting success per vessel category in the different subzones, as identified in Figure 1 (see also Figure S12 of the Supplementary Materials). Overall, Wilcoxon signed rank test was not found to be significant for all subzones, except for M1 (Alboran Sea), where a significant difference (p-value < 0.05) was found between category A (dedicated vessels with height <4.5 m) and B (dedicated vessels with height between 4.75 and 10.5 m), with the latter producing a much higher striped dolphin encounter rate (Table 3).
As the effort performed by the category A vessels across the whole basin was far greater (A = 495,822 km; B = 58,329 km; C = 245,886 km), we normalized the effort of the category B to A in subzone M1 (where the effort performed by the two types of platforms was almost the same, see Figure S13 of the Supplementary Materials) to make the encounter rate comparable across the study areas.
In the following figures (Figure 6, Figure 7, Figure 8, Figure 9, Figure 10, Figure 11, Figure 12 and Figure 13), the ER map is presented for each species together with the relative prevalence map, in order to facilitate comparison. The ER and prevalence of the Black Sea harbour porpoise were not mapped, as this species was only sighted in the Istanbul Strait area and in the immediately adjacent waters of the Marmara Sea.

3.2. Encounter Rate and Shannon Diversity Index in the Mediterranean Sea

The Shannon index map is presented below, alongside with the map showing the ER for all species together (Figure 14). The diversity index has its maximum values in the Alboran Sea (in the westernmost area of the basin) and seems to decrease moving eastward inside the Mediterranean. This very general pattern shows exceptions, possibly connected to local favourable conditions. In the Aegean Sea, for example, the Shannon index looks higher than in the Adriatic Sea, where it shows its minimum levels.

3.3. Comparison between Subzones

The overall encounter rate was analysed through a GLM with survey effort as a covariate and subzone and depth class as factors (Figure 15). The effort covariate was not found to be significant (p-value > 0.05), while geographical subzones (F: 23.2, df1: 7, df2: 854), depth class (F: 5.6, df1: 2) and their interaction (F: 6.2, df1: 9) were all found to be highly significant (p-value: 0.001). The ER in subzone M1 was found to be significantly higher than in all other subareas, both on the continental shelf (0–200 m) and along the continental slope (200–2000 m). The M2 subzone was found to have an ER higher than the M3 and M4 subzones in the pelagic domain (>2000 m) and subzones M3, M6, and M8 along the continental slope (200–2000 m). In all the other subzones, the differences were not significant.
Regarding the Shannon index (Figure 16), the GLM analysis results showed effort to be a significant covariate (F: 65.6, df1: 1, df: 854—p-value < 0.001), as with the factors depth class, subzone, and their interaction (p-value < 0.001). The subzone was found to be the most significant factor (F: 21.6, df1: 7) with respect to the depth class (F: 8.4, df1: 7) and the subzone * depth interaction (F: 6.9, df1: 9).
The pairwise multiple comparisons revealed that the maximum value for the diversity index was found in subzone M1, with the second largest in M2. Concerning the depth classes, the continental shelf (0–200 m) was found to have a lower biodiversity with respect to the others (p-value < 0.01). The significant interaction between subzones and depth classes is related to the fact that, in some subzones (e.g., M3 and M4), the biodiversity difference between the continental and the other depth classes is not significant (p-value > 0.05).
Temporal trends in the Shannon index were also analysed for eight selected datasets, having a multiannual data series in the bathymetric district of the continental slope (200–2000 m). No significant temporal trend was found in the analysed datasets (Spearman’s rank correlation test, p-value > 0.05, see Figure 17).

4. Discussion and Conclusions

According to the analyses performed on the common dataset, the diversity of cetaceans in the Mediterranean Sea is rather low when compared with the adjacent Atlantic waters [27,28]. Two species prevail over all of the others and alone account for over 73% of all sightings: the bottlenose dolphin, in the bathymetric domain of the continental shelf (0–200 m), and the striped dolphin, in both the bathymetric domain of the continental slope (200–2000 m) and the pelagic one (>2000 m). Among the large cetaceans, only two species, the sperm whale and the fin whale, are regularly sighted on a Mediterranean scale, the first in the continental slope and pelagic domains and the second mainly in the pelagic one. These four species alone account for over 90% of all sightings (Table 2) and their dominance in the sighting composition appears to be rather stable over the sampling period, confirming the general pattern (see Figures S10 and S11 in the Supplementary Materials).
The dominance of the striped dolphin, bottlenose dolphin, sperm whale, and fin whale is also clear from the encounter rate and prevalence maps (Figure 6, Figure 7, Figure 8, Figure 9, Figure 10, Figure 11, Figure 12 and Figure 13). The bottlenose dolphin and the striped dolphin have a wide distribution, including nearly all the study areas sampled (each one in its preferred bathymetric domain). The sperm whale and the fin whale also show quite a wide distribution, but limited to the western basin (with a few exceptions for the sperm whale), at least with regards to the sampled areas. The sperm whale seems to find its preferred habitat at the lower edge of the continental slope, while the fin whale finds it in the pelagic waters >2000 m, in agreement with previous studies [29]. The preference of these two species for pelagic waters could explain their low presence in the Alboran Sea, which has a maximum depth of 1500 m and an average depth of 450 m.
The remaining species show a more heterogeneous distribution, often restricted to (or most prevalent in) the western basin (such as the pilot whale and the Risso’s dolphin), fragmented (such as the Risso’s dolphin) or limited to a few specific areas (such as the pilot whale and the Cuvier’s beaked whale).
As a general pattern, the encounter rate of most species seems to decrease from the Alboran Sea, where most of the species are sighted with good success (in agreement with [30]), moving eastwards within the Mediterranean basin. This pattern, however, has considerable local variations; in the subzone M2 (north-western Mediterranean Sea), for example, the encounter rate of most species is relatively high, confirming that this is an important area for the presence of cetaceans, in agreement with previous findings [29,31,32].
Given the above general pattern, the common dolphin shows a peculiar distribution. The encounter rate is higher in the middle depth waters of the Alboran Sea; decreases in the central Mediterranean, where this species is mainly sighted in pelagic waters (usually a few individuals, mixed with large groups of striped dolphins); and increases in the Aegean Sea, where the common dolphin seems to find its preferred habitat at the upper edge of the continental slope, close to the platform, contributing to the local diversity of species (Figure 8A). The prevalence map (Figure 8B) shows an inverse pattern to that of the striped dolphin (Figure 6B), with prevalence levels apparently increasing from north to south and from west to east. This pattern of distribution seems to support the hypothesis of a potential competition with the dominant species of the pelagic waters, the striped dolphin, and possibly also with the dominant species of the continental shelf domain—the bottlenose dolphin (Figure 7B). “Sandwiched” between these two dominant species, the common dolphin would seem to have difficulty finding its habitat space in the current context of the Mediterranean Sea (but, on the same subject, see also [33]).
The diversity map, elaborated through the Shannon index (Figure 14B), is quite consistent with the map of the encounter rate, at least in the general pattern; the diversity index is at a maximum in the Alboran Sea and seems to decrease moving eastwards in the Mediterranean. At the same time, the diversity index shows the lowest values in the domain of the continental shelf, which is dominated by the bottlenose dolphin, except for the Alboran Sea and the Aegean Sea, where the distribution of the common dolphin partially overlaps the distribution of the bottlenose dolphin, in agreement with previous studies [30,34,35,36]. All of the other species seem to find their habitat outside the continental shelf, where the greatest bathymetric gradient allows them to find the most favourable ecological conditions, in terms of presence and abundance of prey too, again in agreement with previous findings [30,32,37,38,39,40].
The comparison between subzones seems to confirm the general pattern and its exceptions. The Shannon index decreases moving eastwards within the Mediterranean Sea, and the Alboran Sea and the north-western Mediterranean show the highest levels of both encounter rate and diversity (Figure 15 and Figure 16).
We could not look for possible temporal trends of diversity in the aggregated dataset, as the contribution coming from the different study areas could have produced false trends. However, when we examined the annual Shannon index in the datasets of eight research units (Figure 17), we did not find any temporal trend. This result suggests that the cetacean diversity in the Mediterranean basin, although rather low, is relatively stable, at least within the period examined.
The low cetacean diversity of the Mediterranean Sea is probably related to the context of general oligotrophy [1,2]. The Shannon index shows the maximum levels in the Alboran Sea, which has a higher primary production if compared with the average of the Mediterranean Sea [41,42]; it decreases in areas where the primary production is lower, such as the Tyrrhenian Sea, to rise again in areas where the primary production increases, such as the north-western Mediterranean Sea (see Figure 18), in agreement with previous observations [10,32,37,43].
The correlation between the Shannon diversity index and primary production (measured as chlorophyll concentration) appears quite evident from Figure 18 and is indeed statistically significant according to further in-depth investigations (see Supplementary Materials, Figures S14 and S15), both in the continental slope domain (200–2000 m) and in the pelagic one (>2000 m).
However, if the primary production does represent a limiting factor of cetacean diversity, other parameters seem to play an important role. The diversity index is significantly higher in the offshore domains, which seem to offer favourable conditions for a greater number of species. Marine areas with a diversified seabed profile, including more bathymetric habitats, show higher levels of diversity, while in areas with a monotonous bathymetric profile, such as the Northern Adriatic Sea, the diversity index is low (despite the primary production being relatively high, see Figure 18). In the Gulf of Lion, a wide embayment bordering the pelagic waters of the north-western Mediterranean Sea (rich in diversity), the Shannon index drops sharply to zero. The Gulf of Lion is highly productive, thanks to the direct supply of nutrients from the Rhone, but lies almost entirely on the continental shelf, with an average depth of about 250 m [44]. Within the 200 m isobath marking the border of the shelf, only one species of cetacean, the bottlenose dolphin, has been sighted, so the diversity index marks zero (Figure 14).
High primary production, favoured by the riverine nutrient inflow and/or by local upwelling phenomena [45], and the presence of diversified bathymetric habitats seem to be the main oceanographic and physiographic variables in favour of a greater level of diversity.
This double dependence of cetacean diversity from both physiographic and productive parameters had already been hypothesised by Gannier [37]. However, Gannier measured a low level of diversity in the north-western basin, when compared with other Mediterranean areas, such as the Tyrrhenian and the Ionian Sea, in disagreement with our findings. According to the author, this could be due to the high dominance of the striped dolphin in the area. The research from Gannier was based on a much smaller dataset (379 sightings in the whole Mediterranean Sea) and included only delphinids in the diversity analysis (striped dolphin, common bottlenose dolphin, common dolphin, Risso’s dolphin, and long-finned pilot whale). This different approach is probably sufficient to justify the difference in the results obtained, as we know that the fin whale, the sperm whale, and the Cuvier’s beaked whale are regularly observed in the north-western Mediterranean Sea. However, it cannot be excluded that, since Gannier’s research campaign (1997–2001), there may have been some changes in cetacean composition and diversity within the subzones examined. Azzellino and co-authors, for example, analysing the data collected within the Pelagos Sanctuary from 2004 to 2014, found marked positive trends in three of the five species studied (striped dolphin, Cuvier’s beaked whale, and sperm whale), while the other two (Risso’s dolphin and fin whale) showed a negative trend [46].
The results of our research are consistent with a previous study that considered cetacean diversity over the seas surrounding Italy based on the data derived from aerial surveys with a systematic effort design [47], confirming the importance and the reliability of the present common dataset, based on multi-platform sampling activity, to improve the knowledge over large basin-wide areas.
Our findings are also quite consistent with the result of the ACCOBAMS (Agreement on the Conservation of Cetaceans of the Black Sea, Mediterranean Sea and Contiguous Atlantic Area) Aerial Survey Initiative (ASI), at least with regards to the presence and distribution of the dominant species of the offshore domains, such as the striped dolphin and the fin whale [48]. Comparisons are more difficult when referring to species that are preferably sighted on the continental shelf (such as the bottlenose dolphin) or have a limited distribution to specific areas (such as the pilot whale) and/or surface elusive behaviour (such as the Cuvier’s beaked whale), and thus can escape aerial surveys. As our aim was to map the diversity of cetaceans in the Mediterranean Sea, a larger dataset, aggregating data from many different sampling areas, can highlight the presence of non-dominant species, contributing to the identification of potential biodiversity hotspots. We believe that these results need to be integrated with those coming from systematic monitoring campaigns to improve the state of knowledge and fill the gaps, also in relation to the descriptor 1 (biological diversity is maintained) of the Marine Strategy Framework Directive [49].

Conservation Remarks

The analyses carried out on the common dataset confirm the importance of some areas, already listed as “Important Marine Mammal Areas” (IMMAs), as diversity hotspots for cetaceans, such as the Alboran Sea [50], the north-western Mediterranean Sea [51], the Campanian and Pontine Archipelago [52], and the Waters of Ischia and Ventotene [53]. The results obtained also seem to confirm the importance of Eastern Sicily and the Strait of Messina (candidate Important Marine Mammal Areas (cIMMA)), whose designations as IMMA are being evaluated, and the Caprera canyon, in the northern Tyrrhenian Sea (Areas of Interest (AoI)), whose candidacy for IMMA is still pending [54]. The Aegean Sea is confirmed as an important area for the presence of the common dolphin, evidence that should be highlighted for future conservation actions.
The results obtained in this collective research effort underline the importance of data sharing to better understand the distribution and ecology of cetaceans. As far as we know, our common dataset is the largest ever analysed in aggregate form in the context of the Mediterranean Sea, but there are still large portions of the basin for which no data were available (e.g., the eastern basin, in its southern portion and in the pelagic area) and this could lead to an underestimation of cetacean diversity. In fact, although it is believed that the western basin hosts a greater diversity in terms of cetacean fauna [3], some species, such as the rough-toothed dolphin (Steno bredanensis), seem to find their main distribution range in the eastern basin [9]. The gaps also include important biodiversity hotspots located in the eastern basin, such as the Hellenic Trench, which is considered an Important Marine Mammal Area (IMMA), especially for deep divers such as the sperm whale and Cuvier’s beaked whale [55]. It is thus crucial to increase the sampling effort in poorly covered areas, in order to complete the picture and identify all possible biodiversity hotspots to be preserved (see also [22]).
Furthermore, the data analysed refer mainly to the spring–summer period (see Figure 2), as this is the best period for data collection in terms of weather condition and daylight hours. The general picture could change if referring to different seasons, especially for highly mobile species such as the fin whale [56].
In a context generally poor in diversity, where primary production is most likely an important limiting factor, it is worth asking what the impact of climate change and the consequent alteration of meteorological phenomena could be (e.g., rainfall regime, rate of evaporation, and so on). The oligotrophy of the Mediterranean Sea has been attributed to the anti-estuarine circulation of the Strait of Gibraltar, which causes an export of nutrients to the Atlantic [2,57]. The Mediterranean thus relies on the main rivers for its supply, as in the case of the Rhone, which contributes to the productivity of the north-western Mediterranean, and of the Po in the Adriatic Sea [32,58,59], but, according to Ludwig et al. [60], in 2050, the Mediterranean could have lost more than one-fourth of the freshwater flow from rivers compared with 1960, mainly because of climate change. In the sub-basins of the north, the flux of nitrates is predicted to decrease in the future, as a consequence of climate change, population decrease, and implementation of antipollution measures. As cetacean diversity appears to be greater in areas with higher primary production, a significant decrease in river nutrient intake could lead to a downward trend in diversity in the Mediterranean Sea.
In the macroscale scenario described, governed by physiography and primary production, human activities, such as fishing and maritime traffic, can play an important role as drivers of change at the local level [44]. This study may represent a robust baseline assessment to detect future changes.

Supplementary Materials

The following supporting information can be downloaded at: https://www.mdpi.com/article/10.3390/d15030321/s1, Figure S1: Sighting points of the striped dolphin (Stenella coeruleoalba); Figure S2: Sighting points of the common bottlenose dolphin (Tursiops truncatus); Figure S3: Sighting points of the common dolphin (Delphinus delphis); Figure S4: Sighting points of the Risso’s dolphin (Grampus griseus); Figure S5: Sighting points of the long-finned pilot whale (Globicephala melas); Figure S6: Sighting points of the Cuvier’s beaked whale (Ziphius cavirostris); Figure S7: Sighting points of the sperm whale (Physeter macrocephalus); Figure S8: Sighting points of the fin whale (Balaenoptera physalus); Figure S9: Sighting points of the Black Sea harbour porpoise (Phocoena phocoena relicta), Minke whale (Balaenoptera acutorostrata), Sowerby’s beaked whale (Mesoplodon bidens) and rough-teethed dolphin (Steno bredanensis); Figure S10: The annual ER of the 9 regularly observed species (all the data of the common dataset); Figure S11: The annual ER of the 9 regular species in the 3 bathymetric domains; Figure S12: Map of the study subzones; Figure S13: Effort distribution among platforms in the different subzones analysed; Figure S14: Correlation between Chlorophyll and Shannon index in the bathymetric domain of the continental slope (200–2000 m); Figure S15: Correlation between Chlorophyll and Shannon index in the pelagic domain (>2000 m).

Author Contributions

Conceptualization, G.G., M.B., M.F. and A.A. (Arianna Azzellino); Methodology, G.G., M.B. and A.A. (Arianna Azzellino); Formal Analysis, G.G., M.B. and A.A. (Arianna Azzellino); Data curation, G.G., M.B., S.A., J.G., L.D., N.D.-M., A.M.C., A.A. (Aylin Akkaya), T.A., B.M., I.C., M.A., A.D., A.M.T., C.M., G.P., P.T., A.M. (Aurelie Moulins), A.A. (Antonella Arcangeli), H.L., A.P.S., Y.M., R.C., F.C.S., C.A.C., M.G., B.T., A.M. (Alberta Mandich), J.A., L.B., B.D.L., C.A., G.L.M., D.S.P., D.D., A.C., S.N., M.-C.S., A.V., N.T., C.G., M.C., M.F. and A.A. (Arianna Azzellino); Investigation, G.G., M.B., S.A., J.G., L.D., N.D.-M., A.M.C., A.A. (Aylin Akkaya), T.A., B.M., I.C., M.A., A.D., A.M.T., C.M., G.P., P.T., A.M. (Aurelie Moulins), A.A. (Antonella Arcangeli), H.L., A.P.S., Y.M., R.C., F.C.S., C.A.C., M.G., B.T., A.M. (Alberta Mandich), J.A., L.B., B.D.L., C.A., G.LM., D.S.P., D.D., A.C., S.N., M.-C.S., A.V., N.T., C.G., M.C., M.F. and A.A. (Arianna Azzellino); Writing—Original Draft Preparation, G.G.; Writing—Review and Editing, G.G., M.B., S.A., J.G., L.D., N.D.-M., A.M.C., A.A. (Aylin Akkaya), T.A., B.M., I.C., M.A., A.D., A.M.T., C.M., G.P., P.T., A.M. (Aurelie Moulins), A.A. (Antonella Arcangeli), H.L., A.P.S., Y.M., R.C., F.C.S., C.A.C., M.G., B.T., A.M. (Alberta Mandich), J.A., L.B., B.D.L., C.A., G.LM., D.S.P., D.D., A.C., S.N., M.-C.S., A.V., N.T., C.G., M.C., M.F. and A.A. (Arianna Azzellino); Supervision, G.G., M.B., R.C. and A.A. (Arianna Azzellino); Project Administration, G.G., M.B. and M.F.; Funding Acquisition, G.G., R.C. and M.F. All authors have read and agreed to the published version of the manuscript.

Funding

We received support from the Blue Planet Virginia Böger Stiftung X.X. foundation, which funded the TursioMed project. The research that led to these results was also supported by the European Commission DG Environment, which funded the ABIOMMED project (Support coherent and coordinated assessment of biodiversity and measures across Mediterranean for the next 6-year cycle of MSFD implementation).

Institutional Review Board Statement

Ethical review and approval were waived for this study as the data collection activity, based on sighting and photo-identification, does not involve any direct contact with the animals and no significant impact.

Informed Consent Statement

Not applicable.

Data Availability Statement

The data used for this research are displayed on the Intercet platform (https://www.intercet.it/), except for the data provided by University La Sapienza, Jonian Dolphin Conservation, Archipelagos Inst. of Marine Conservation (see Table 1).

Acknowledgments

We thank the Blue Planet Virginia Böger Stiftung X.X. foundation for supporting the TursioMed project, giving a fundamental impetus to the long-term networking program that made this scientific work possible. The results of the present research are also an output of the ABIOMMED project (support coherent and coordinated assessment of biodiversity and measures across Mediterranean for the next 6-year cycle of MSFD implementation), an EU research project funded under DG EN9/M6FD 2020. Thanks to the many researchers who contributed to the field work: Caterina Lanfredi and Valentina De Santis (Tethys Research Institute), Miriam Paraboschi (Accademia del Leviatano), Mario Tringali (Ketos), Massimiliano Rosso (Fondazione CIMA), Frank Dhermain (MIRACETI), Giulia Cipriano (Università degli Studi di Bari Aldo Moro and CoNISMa), Carmelo Fanizza (Jonian Dolphin Project), Anastasia Miliou and Thodoris Tsimpidis (Archipelagos), Georges Azzinari (Association BREACH), Fabio Ronchetti (Mareterra Onlus), Martina Gregorietti, Cristina Luperini, Cecilia Mancusi (ARPAT), and Livio Favaro (University of Torino). We would also like to thank Cybelle Planète, SCS, and Participe Futur for their contribution to the data collection, in partnership with EcoOcean Institut. The research activity of Tethys Research Institute in the Gulf of Ambracia was carried out with the support of Ocean Care. Dataset from Fondazione CIMA has been collected in collaboration with Corsica Ferries - Sardinia Ferries and in part with fund supports from Pelagos FRANCE (Conv.11-011-83400) and Interreg Italy-France "Maritime" SICOMAR plus. We specially thank all CETASMUS participants for their contribution to the data collection, in partnership with Fondazione CIMA. We thank all the partners of GIONHA (Governance and Integrated Observation of Marine Natural Habitat) sharing their data on the Intercet Platform: Regione Liguria, Regione Toscana, Regione Sardegna, Provincia di Livorno, Cooperativa Pelagos, and Area Marina Protetta Tavolara-Punta Coda Cavallo. We thank the anonymous reviewers whose remarks helped improve the quality of the paper during the review process. Special thanks to Daniele Zanzi for his interest and friendship.

Conflicts of Interest

The authors declare no conflict of interest.

References

  1. Pujo-Pay, M.; Conan, P.; Oriol, L.; Cornet-Barthaux, V.; Falco, C.; Ghiglione, J.-F.; Goyet, C.; Moutin, T.; Prieur, L. Integrated survey of elemental stoichiometry (C, N, P) from the western to eastern Mediterranean Sea. Biogeosciences 2011, 8, 883–899. [Google Scholar] [CrossRef]
  2. Tanhua, T.; Hainbucher, D.; Schröder, K.; Cardin, V.; Álvarez, M.; Civitarese, G. The Mediterranean Sea system: A review and an introduction to the special issue. Ocean Sci. Discuss. 2013, 10, 581–617. [Google Scholar] [CrossRef]
  3. Coll, M.; Piroddi, C.; Steenbeek, J.; Kaschner, K.; Ben Rais Lasram, F.; Aguzzi, J.; Ballesteros, E.; Bianchi, C.N.; Corbera, J.; Dailianis, T.; et al. The biodiversity of the Mediterranean Sea: Estimates, patterns and threats. PLoS ONE 2010, 5, e11842. [Google Scholar] [CrossRef]
  4. Hsü, K.J.; Ryan, W.B.F.; Cita, M.B. Late Miocene desiccation of the Mediterranean. Nature 1973, 242, 240–244. [Google Scholar] [CrossRef]
  5. Krijgsman, W.; Hilgen, F.J.; Raffi, I.; Sierro, F.J.; Wilson, D.S. Chronology, causes and progression of the Messinian salinity crisis. Nature 1999, 400, 652–655. [Google Scholar] [CrossRef]
  6. Bianchi, C.N.; Morri, C.; Chiantore, M.; Montefalcone, M.; Parravicini, V.; Rovere, A. Mediterranean Sea biodiversity between the legacy from the past and a future of change. In Life in the Mediterranean Sea: A Look at Habitat Changes; Stambler, N., Ed.; Nova Science Publishers, Inc.: New York, NY, USA, 2012. [Google Scholar]
  7. Notarbartolo di Sciara, G.; Tonay, A.M. Conserving Whales, Dolphins and Porpoises in the Mediterranean Sea, Black Sea and Adjacent Areas: An ACCOBAMS Status Report, 2021; ACCOBAMS: Monaco, 2021. [Google Scholar]
  8. Notarbartolo di Sciara, G. Cetacean species occurring in the Mediterranean and Black Seas. In Cetaceans of the Mediterranean and Black Seas: State of Knowledge and Conservation Strategies; A report to the ACCOBAMS Secretariat; Notarbartolo di Sciara, G., Ed.; ACCOBAMS: Monaco, 2002; Section 3; 17p. [Google Scholar]
  9. Boisseau, O.; Lacey, C.; Lewis, T.; Moscrop, A.; Danbolt, M.; McLanaghan, R. Encounter rates of cetaceans in the Mediterranean Sea and contiguous Atlantic area. J. Mar. Biol. Assoc. UK 2010, 90, 1589–1599. [Google Scholar] [CrossRef]
  10. Arcangeli, A.; Campana, I.; Bologna, M.A. Influence of seasonality on cetacean diversity, abundance, distribution and habitat use in the western Mediterranean Sea: Implications for conservation. Aquat. Conserv. Mar. Freshw. Ecosyst. 2017, 27, 995–1010. [Google Scholar] [CrossRef]
  11. Panigada, S.; Lauriano, G.; Donovan, G.; Pierantonio, N.; Cañadas, A.; Vázquez, J.A.; Burt, L. Estimating cetacean density and abundance in the Central and Western Mediterranean Sea through aerial surveys: Implications for management. Deep Sea Res. Part II Top. Stud. Oceanogr. 2017, 141, 41–58. [Google Scholar] [CrossRef]
  12. Pace, D.S.; Giacomini, G.; Campana, I.; Paraboschi, M.; Pellegrino, G.; Silvestri, M.; Alessi, J.; Angeletti, D.; Cafaro, V.; Pavan, G.; et al. An integrated approach for cetacean knowledge and conservation in the central Mediterranean Sea using research and social media data sources. Aquat. Conserv. Mar. Freshw. Ecosyst. 2019, 29, 1302–1323. [Google Scholar] [CrossRef]
  13. Gaskin, D.E. The harbour porpoise Phocoena phocoena (L.): Regional populations, status, and information on direct and indirect catches. Rep. Int. Whal. Comm. 1984, 34, 569–586. [Google Scholar]
  14. Öztürk, B.; Öztürk, A.A. On the biology of the Turkish straits system. Bull. Inst. Oceanogr. Numero Spec. 1996, 17, 205–217. [Google Scholar]
  15. Cucknell, A.C.; Frantzis, A.; Boisseau, O.; Romagosa, M.; Ryan, C.; Tonay, A.M.; Alexiadou, P.; Öztürk, A.A.; Moscrop, A. Harbour porpoises in the Aegean Sea, Eastern Mediterranean: The species’ presence is confirmed. Mar. Biodivers. Rec. 2016, 9, 1–13. [Google Scholar] [CrossRef]
  16. Frantzis, A.; Gordon, J.; Hassidis, G.; Komnenou, A. The enigma of the harbour porpoise presence in the Mediterranean Sea. Mar. Mamm. Sci. 2001, 17, 937–944. [Google Scholar] [CrossRef]
  17. Fontaine, M.C. Chapter Eleven—Harbour Porpoises, Phocoena phocoena, in the Mediterranean Sea and Adjacent Regions: Biogeographic Relicts of the Last Glacial Period. Adv. Mar. Biol. 2016, 75, 333–358. [Google Scholar] [CrossRef]
  18. Bearzi, G.; Genov, T.; Natoli, A.; Gonzalvo, J.; Pierce, G.J. Delphinus delphis (Inner Mediterranean subpopulation) (errata version published in 2022). In The IUCN Red List of Threatened Species; International Union for Conservation of Nature and Natural Resources: Gland, Switzerland, 2002; p. e.T189865869A210844387. [Google Scholar] [CrossRef]
  19. Cagnolaro, L. Profilo sistematico e tipologico delle raccolte di cetacei attuali dei musei italiani. Suppl. Museol. Sci. 1996, 13, 193–212. [Google Scholar]
  20. Cagnolaro, L.; Podestà, M.; Affronte, M.; Agnelli, P.; Cancelli, F.; Capanna, E.; Carlini, R.; Cataldini, G.; Cozzi, B.; Insacco, G. Collections of extant cetaceans in Italian museums and other scientific institutions. A comparative review. Nat. Hist. Sci. 2012, 153, 145–202. [Google Scholar] [CrossRef]
  21. Verborgh, P.; Gauffier, P.; Esteban, R.; Giménez, J.; Cañadas, A.; Salazar-Sierra, J.M.; de Stephanis, R. Conservation Status of Long-Finned Pilot Whales, Globicephala melas, in the Mediterranean Sea. Adv. Mar. Biol. 2016, 75, 173–203. [Google Scholar] [CrossRef]
  22. Podestà, M.; Azzellino, A.; Cañadas, A.; Frantzis, A.; Moulins, A.; Rosso, M.; Tepsich, P.; Lanfredi, C. Cuvier’s beaked whale, Ziphius cavirostris, distribution and occurrence in the Mediterranean Sea: High-use areas and conservation threats. Adv. Mar. Biol. 2016, 75, 103–114. [Google Scholar] [CrossRef]
  23. Mannocci, L.; Roberts, J.J.; Halpin, P.N.; Authier, M.; Boisseau, O.; Bradai, M.N.; Cañadas, A.; Chicote, C.; David, L.; Di-Méglio, N.; et al. Assessing cetacean surveys throughout the Mediterranean Sea: A gap analysis in environmental space. Sci. Rep. 2018, 8, 3126. [Google Scholar] [CrossRef]
  24. Gnone, G.; Bellingeri, M.; Paraboschi, M.; Campana, I.; Alessi, J.; Nuti, S.; Salvioli, F.; Tepsich, P.; Rosso, M.; Moulins, A.; et al. TursioMed: Final Scientific Report. The final scientific report of the TursioMed project, funded by Blue Planet Virginia Böger Stiftung X.X. 2021; unpublished work. [Google Scholar]
  25. Shannon, C.E. A mathematical theory of communication. Bell Syst. Tech. J. 1948, 27, 379–423 and 623–656. [Google Scholar] [CrossRef]
  26. Silverman, B.W. Density Estimation for Statistics and Data Analysis; Chapman and Hall: New York, NY, USA, 1986. [Google Scholar]
  27. Correia, A.M.; Tepsich, P.; Rosso, M.; Caldeira, R.; Sousa-Pinto, I. Cetacean occurrence and spatial distribution: Habitat modelling for offshore waters in the Portuguese EEZ (NE Atlantic). J. Mar. Syst. 2015, 143, 73–85. [Google Scholar] [CrossRef]
  28. Correia, A.M.; Gandra, M.; Liberal, M.; Valente, R.; Gil, Á.; Rosso, M.; Pierce, G.J.; Sousa-Pinto, I. A dataset of cetacean occurrences in the Eastern North Atlantic. Sci. Data 2019, 6, 177. [Google Scholar] [CrossRef]
  29. Panigada, S.; Notarbartolo di Sciara, G.; Zanardelli Panigada, M.; Airoldi, S.; Borsani, J.F.; Jahoda, M. Fin whales (Balaenoptera physalus) summering in the Ligurian Sea: Distribution, encounter rate, mean group size and relation to physiographic variables. J. Cetacean Res. Manag. 2005, 7, 137–145. [Google Scholar]
  30. Cañadas, A.; Sagarminaga, R.; Garcia-Tiscar, S. Cetacean distribution related with depth and slope in the Mediterranean waters off southern Spain. Deep Sea Res. 2002, 49, 2053–2073. [Google Scholar] [CrossRef]
  31. Panigada, S.; Zanardelli, M.; Mackenzie, M.; Donovan, C.; Melin, F.; Hammond, P.S. Modelling Habitat Preferences for Fin Whales and Striped Dolphins in the Pelagos Sanctuary (Western Mediterranean Sea) with Physiographic and Remote Sensing Variables. Remote Sens. Environ. 2008, 112, 3400–3412. [Google Scholar] [CrossRef]
  32. Notarbartolo di Sciara, G.; Agardy, T.; Hyrenbach, D.; Scovazzi, T.; van Klaveren, P. The Pelagos Sanctuary for Mediterranean marine mammals. Aquat. Conserv. Mar. Freshw. Ecosyst. 2008, 18, 367–391. [Google Scholar] [CrossRef]
  33. Bearzi, G. Delphinus delphis (Mediterranean subpopulation). In The IUCN Red List of Threatened Species; International Union for Conservation of Nature and Natural Resources: Gland, Switzerland, 2003; p. e.T41762A10557372. [Google Scholar] [CrossRef]
  34. Frantzis, A.; Alexiadou, P.; Paximadis, G.; Politi, E.; Gannier, A. Current knowledge of the cetacean fauna of the Greek Seas. J. Cetacean Res. Manag. 2003, 5, 219–232. [Google Scholar]
  35. Gnone, G.; Bellingeri, M.; Molinari, Y.; Dhermain, F.; Labach, H.; Díaz López, B.; David, L.; Di Meglio, N.; Azzinari, G.; Azzinari, C.; et al. The Seabed makes the dolphins: Physiographic features shape the size and structure of the bottlenose dolphin geographical units. J. Mar. Sci. Eng. 2022, 10, 1036. [Google Scholar] [CrossRef]
  36. Pace, D.S.; Panunzi, G.; Arcangeli, A.; Moro, S.; Jona-Lasinio, G.; Martino, S. Seasonal distribution of an opportunistic apex predator (Tursiops truncatus) in marine coastal habitats of the Western Mediterranean Sea. Front. Mar. Sci. 2022, 9, 939692. [Google Scholar] [CrossRef]
  37. Gannier, A. Summer distribution and relative abundance of delphinids in the Mediterranean Sea. Rev. D’ecologie Terre Société Natl. Prot. Nat. 2005, 60, 223–238. [Google Scholar] [CrossRef]
  38. Azzellino, A.; Gaspari, S.; Airold, S.; Nani, B. Habitat use and preferences of cetaceans along the continental slope and the adjacent pelagic waters in the western Ligurian Sea. Deep Sea Res. Part I Oceanogr. Res. Pap. 2008, 55, 296–323. [Google Scholar] [CrossRef]
  39. Pace, D.S.; Arcangeli, A.; Mussi, B.; Vivaldi, C.; Ledon, C.; Lagorio, S.; Giacomini, G.; Pavan, G.; Ardizzone, G. Habitat suitability modeling in different sperm whale social groups. J. Wildl. Manag. 2018, 82, 1062–1073. [Google Scholar] [CrossRef]
  40. Awbery, T.; Akkaya, A.; Lyne, P.; Rudd, L.; Hoogenstrijd, G.; Nedelcu, M.; Kniha, D.; Erdoğan, M.A.; Persad, C.; Amaha Öztürk, A.; et al. Spatial Distribution and Encounter Rates of Delphinids and Deep Diving Cetaceans in the Eastern Mediterranean Sea of Turkey and the Extent of Overlap With Areas of Dense Marine Traffic. Front. Mar. Sci. 2022, 9, 860242. [Google Scholar] [CrossRef]
  41. Videau, C.; Sournia, A.; Prieur, L.; Fiala, M. Phytoplankton and primary production characteristics at selected sites in the geostrophic Almeria-Oran front system (SW Mediterranean Sea). J. Mar. Syst. 1994, 5, 235–250. [Google Scholar] [CrossRef]
  42. Morán, X.A.G.; Estrada, M. Short-term variability of photosynthetic parameters and particulate and dissolved primary production in the Alboran Sea (SW Mediterranean). Mar. Ecol. Prog. Ser. 2001, 212, 53–67. [Google Scholar] [CrossRef]
  43. Aïssi, M.; Arcangeli, A.; Crosti, R.; Daly Yahia, M.N.; Loussaief, B.; Moulins, A.; Pellegrino, G.; Rosso, M.; Tringali, L.M.; Tepsich, P. Cetacean occurrence and spatial distribution in the central Mediterranean Sea using ferries as platform of observation. Russ. J. Mar. Biol. 2015, 41, 343–350. [Google Scholar] [CrossRef]
  44. IUCN-MMPATF. Shelf of the Gulf of Lyon IMMA Factsheet. IUCN Joint SSC/WCPA Marine Mammal Protected Areas Task Force. 2017. Available online: https://www.marinemammalhabitat.org/portfolio-item/shelf-gulf-lion/ (accessed on 9 August 2022).
  45. Ricci, P.; Carlucci, R.; Capezzuto, F.; Carluccio, A.; Cipriano, G.; D’Onghia, G.; Maiorano, P.; Sion, L.; Tursi, A.; Libralato, S. Contribution of Intermediate and High Trophic Level Species to Benthic-Pelagic Coupling: Insights From Modelling Analysis. Front. Mar. Sci. 2022, 9, 887464. [Google Scholar] [CrossRef]
  46. Azzellino, A.; Airoldi, S.; Lanfredi, C.; Podestà, M.; Zanardelli, M. Cetacean response to environmental and anthropogenic drivers of change: Results of a 25-year distribution study in the northwestern Mediterranean Sea. Deep Sea Res. Part II Top. Stud. Oceanogr. 2017, 146, 104–117. [Google Scholar] [CrossRef]
  47. Azzellino, A.; Fossi, M.C.; Gaspari, S.; Lanfredi, C.; Lauriano, G.; Marsili, L.; Panigada, S.; Podestà, P. An index based on the biodiversity of cetacean species to assess the Environmental Status of marine ecosystems. Mar. Environ. Res. 2014, 100, 94–111. [Google Scholar] [CrossRef]
  48. ACCOBAMS. Estimates of Abundance and Distribution of Cetaceans, Marine Mega-Fauna and Marine Litter in the Mediterranean Sea from 2018–2019 Surveys; Panigada, S., Boisseau, O., Canadas, A., Lambert, C., Laran, S., McLanaghan, R., Moscrop, A., Eds.; ACCOBAMS Survey Initiative Project: Monaco, 2021; p. 177. [Google Scholar]
  49. DIRECTIVE 2008/56/EC of the European Parliament and of the Council, 17 June 2008. Establishing a framework for community action in the field of marine environmental policy (Marine Strategy Framework Directive). Off. J. Eur. Union 2008, 164, 19–40.
  50. IUCN-MMPATF. Alborán Sea IMMA. Full Accounts of Mediterranean IMMA Factsheet. IUCN Joint SSC/WCPA Marine Mammal Protected Areas Task Force. 2017. Available online: https://www.marinemammalhabitat.org/wp-content/uploads/imma-factsheets/Mediterranean/Alboran-Sea-Mediterranean.pdf (accessed on 9 August 2022).
  51. IUCN-MMPATF. North West Mediterranean Sea, Slope and Canyon system IMMA Factsheet. IUCN Joint SSC/WCPA Marine Mammal Protected Areas Task Force. 2017. Available online: https://www.marinemammalhabitat.org/portfolio-item/north-western-mediterranean-sea-slope-canyon-system/ (accessed on 9 August 2022).
  52. IUCN-MMPATF. Campanian and Pontino Archipelagos IMMA. Full Accounts of Mediterranean IMMA Factsheet. IUCN Joint SSC/WCPA Marine Mammal Protected Areas Task Force. 2017. Available online: https://www.marinemammalhabitat.org/portfolioitem/campanian-and-pontino-archipelagos/ (accessed on 18 August 2022).
  53. IUCN-MMPATF Waters of Ischia and Ventotene IMMA Factsheet. IUCN Joint SSC/WCPA Marine Mammal Protected Areas Task Force. 2017. Available online: https://www.marinemammalhabitat.org/portfolioitem/waters-ischia-ventotene/ (accessed on 18 October 2022).
  54. IMMA E-ATLAS. Available online: https://www.marinemammalhabitat.org/imma-eatlas/ (accessed on 18 October 2022).
  55. IUCN-MMPATF. Hellenic Trench IMMA. Full Accounts of Mediterranean IMMA Factsheet. IUCN Joint SSC/WCPA Marine Mammal Protected Areas Task Force. 2017. Available online: https://www.marinemammalhabitat.org/portfolioitem/hellenic-trench/ (accessed on 9 August 2022).
  56. Panigada, S.; Donovan, G.P.; Druon, J.N.; Lauriano, G.; Pierantonio, N.; Pirotta, E.; Zanardelli, M.; Zerbini, A.N.; Notarbartolo di Sciara, G. Satellite tagging of Mediterranean fin whales: Working towards the identification of critical habitats and the focussing of mitigation measures. Sci. Rep. 2017, 7, 3365. [Google Scholar] [CrossRef] [PubMed]
  57. Huertas, I.E.; Ríos, A.F.; García-Lafuente, J.; Navarro, G.; Makaoui, A.; Sánchez-Román, A.; Rodriguez-Galvez, S.; Orbi, A.; Ruíz, J.; Pérez, F.F. Atlantic forcing of the Mediterranean oligotrophy. Glob. Biogeochem. Cycles 2012, 26, GB2022. [Google Scholar] [CrossRef]
  58. Béthoux, J.P. Le phosphore et l’azote en Méditerranée, bilans et fertilité potentielle. Mar. Chem. 1981, 10, 141–158. [Google Scholar] [CrossRef]
  59. Estrada, M. Primary production in the northwestern Mediterranean. Sci. Mar. 1996, 60, 55–64. [Google Scholar]
  60. Ludwig, W.; Bouwman, A.F.; Dumont, E.; Lespinas, F. Water and nutrient fluxes from major Mediterranean and Black Sea rivers: Past and future trends and their implications for the basin-scale budgets. Glob. Biogeochem. Cycles 2010, 24, GB0A13. [Google Scholar] [CrossRef]
Figure 1. The sampling tracks performed by the research partners (2004–2018, 795,989 km in total). The isobaths represented (200 m, 2000 m) identify the three main bathymetric domains analysed: 0–200 m, 200–2000 m, >2000 m.
Diversity 15 00321 g001
Figure 2. The cumulative sampling effort performed by the research units per month.
Diversity 15 00321 g002
Figure 3. The sampling effort (km) performed by the research units per sampling cell (20 × 20 km).
Diversity 15 00321 g003
Figure 4. In the period analysed (2004–2018), a total 17,763 sightings, consisting of 12 different cetacean species, were recorded by the research units.
Diversity 15 00321 g004
Figure 5. The ER of the nine regularly observed species in the three bathymetric domains (left axis) and the sampling effort (black bars, right axis). Tt: Tursiops truncatus; Sc: Stenella coeruleoalba; Dd: Delphinus delphis; Gg: Grampus griseus; Gm: Globicephala melas; Ppr: Phocoena phocoena relicta; Zc: Ziphius cavirostris; Pm: Physeter macrocephalus; Bp: Balaenoptera physalus.
Diversity 15 00321 g005
Figure 6. The encounter rate map (A) and the prevalence map (B) of the striped dolphin (Stenella coeruleoalba), processed through Kernel density analysis. The striped dolphin was sighted in all areas of sampling, with a clear preference for the waters outside the continental shelf (>200 m), even very close to the coastline and in semi-closed contexts, provided there was the right water depth (such as in the Gulf of Corinth, Greece). Its ER is higher in the western basin, specifically in the Alboran Sea and in the north-western Mediterranean. The striped dolphin shows a high prevalence in most of the sampled offshore waters (B), confirming its status as a dominant species of the offshore domains. However, in the Alboran Sea, its prevalence is relatively low (despite the high ER), probably due to the coexistence of other species (Kernel density parameters: cell size x, y = 5 × 5 km; radius ≈ 30 km; criterion for division into classes: natural breaks).
Diversity 15 00321 g006aDiversity 15 00321 g006b
Figure 7. The encounter rate map (A) and the prevalence map (B) of the bottlenose dolphin (Tursiops truncatus), processed through Kernel density analysis. The bottlenose dolphin was sighted in almost all of the sampling areas (and in all the bathymetric domains), with a clear preference for the waters of the continental shelf (<200 m), as well as on sea shoals and around the islands. Its preference for the habitat of the continental shelf, where the bottlenose dolphin is the dominant species, is very evident from the prevalence map too (B). This pattern of distribution is less obvious in the Alboran Sea, where the bottlenose dolphin shares the continental shelf with the common dolphin (see Figure 8) and is sighted with good success over the continental slope too (Kernel density parameters: cell size x, y = 5 × 5 km; radius ≈ 30 km; criterion for division into classes: natural breaks).
Diversity 15 00321 g007aDiversity 15 00321 g007b
Figure 8. The encounter rate map (A) and the prevalence map (B) of the common dolphin (Delphinus delphis), processed through Kernel density analysis. The common dolphin was sighted in most of the areas sampled (except for the Adriatic Sea), with a very diverse and ubiquitous distribution. Its ER is maximum in the Alboran Sea, where this species seems to find its favoured habitat in the waters of the continental shelf and slope. In the Ligurian and Tyrrhenian Sea, its ER is much lower, and this species seems to prefer the open waters outside the continental shelf (>200 m). In the Aegean Sea, the ER increases and the common dolphin seems to find its privileged habitat at the upper edge of the continental slope, close to the platform. The prevalence map (B) shows an inverse pattern to that of the striped dolphin (Figure 6B), with prevalence levels increasing from north to south and from west to east (Kernel density parameters: cell size x, y = 5 × 5 km; radius ≈ 30 km; criterion for division into classes: natural breaks).
Diversity 15 00321 g008aDiversity 15 00321 g008b
Figure 9. The encounter rate map (A) and the prevalence map (B) of the Risso’s dolphin (Grampus griseus), processed through Kernel density analysis. The Risso’s dolphin was sighted in most of the sampling areas of the west basin, with a scattered distribution. The ER is maximum in the Alboran Sea and lower inside the Mediterranean. The Risso’s dolphin shows a clear preference for the waters outside the continental shelf (>200 m) and a slight preference for the waters of the continental slope (200–2000 m). The prevalence map (B) shows the same scattered pattern and, in the Alboran Sea, the prevalence is relatively low (despite the high ER), probably because of the coexistence of other species (Kernel density parameters: cell size x, y = 5 × 5 km; radius ≈ 30 km; criterion for division into classes: natural breaks).
Diversity 15 00321 g009aDiversity 15 00321 g009b
Figure 10. The encounter rate map (A) and the prevalence map (B) of the long-finned pilot whale (Globicephala melas), processed through Kernel density analysis. The pilot whale was only sighted in some of the sampled areas, always in the western basin, specifically in the Alboran Sea (where this species has the maximum ER), in the western portion of the Pelagos Sanctuary, and in the western adjacent waters. It shows a clear preference for waters outside the continental shelf (>200 m) and a slight preference for the waters of the continental slope (200–2000 m). The prevalence map (B) confirms this pattern of presence and distribution limited to the two above-described areas (Kernel density parameters: cell size x, y = 5 × 5 km; radius ≈ 30 km; criterion for division into classes: natural breaks).
Diversity 15 00321 g010aDiversity 15 00321 g010b
Figure 11. The encounter rate map (A) and the prevalence map (B) of the Cuvier’s beaked whale (Ziphius cavirostris), processed through Kernel density analysis. The Cuvier’s beaked whale was only sighted in some of the sampled areas, mainly (but not only) in the western basin. The ER is maximum in the Alboran Sea, in the central portion of the Pelagos Sanctuary, and in a few relatively small areas such as in the northeast of Sardinia (the so-called canyon system of Caprera, Italy) and in the Bay of Antalya (Türkiye). This species shows a clear preference for waters outside the continental shelf (>200 m) and a slight preference for the waters of the continental slope (200–2000 m). The prevalence map (B) confirms this pattern of presence and distribution limited to a few specific areas (Kernel density parameters: cell size x, y = 5 × 5 km; radius ≈ 30 km; criterion for division into classes: natural breaks).
Diversity 15 00321 g011aDiversity 15 00321 g011b
Figure 12. The encounter rate map (A) and the prevalence map (B) of the sperm whale (Physeter macrocephalus), processed through Kernel density analysis. The sperm whale was sighted mainly in the western basin and in a few spots of the eastern basin. Contrary to what is observed in most other cetacean species, the ER of the sperm whale in the Alboran Sea is not that high. This species seems more successfully sighted in the Pelagos Sanctuary (and western adjacent waters) and in the Campania archipelago (Italy). The sperm whale shows a clear preference for waters outside the continental shelf (>200 m) and a slight preference for the waters of the continental slope (200–2000 m). The prevalence map (B) confirms this pattern of presence and distribution within the Mediterranean basin (Kernel density parameters: cell size x, y = 5 × 5 km; radius ≈ 30 km; criterion for division into classes: natural breaks).
Diversity 15 00321 g012aDiversity 15 00321 g012b
Figure 13. The encounter rate map (A) and the prevalence map (B) of the fin whale (Balaenoptera physalus), processed through Kernel density analysis. The fin whale was sighted only in the western basin and in the Strait of Sicily, around the island of Lampedusa. Contrary to what is observed in most other cetacean species, the ER of the fin whale in the Alboran Sea is quite low. This species is successfully sighted in the Pelagos Sanctuary (and western adjacent waters) and in a relatively small area in the northeast of Sardinia (the so-called canyon system of Caprera). Even if it can be sighted over the continental shelf as well (like the Tunisian platform, around the island of Lampedusa), the fin whale shows a clear preference for pelagic waters >2000 m. The prevalence map (B) confirms this pattern of distribution and the preference for pelagic waters (Kernel density parameters: cell size x, y = 5 × 5 km; radius ≈ 30 km; criterion for division into classes: natural breaks).
Diversity 15 00321 g013aDiversity 15 00321 g013b
Figure 14. The map of the total encounter rate (A) and the map of the cetacean diversity according to the Shannon index (B). As a general pattern, both the ER and diversity index have their maximum values in the Alboran Sea (in the westernmost area of the basin) and they seem to decrease moving eastwards inside the Mediterranean (Kernel density parameters: cell size x, y = 5 × 5 km; radius ≈ 40 km; criterion for division into classes: natural breaks).
Diversity 15 00321 g014
Figure 15. GLM estimated marginal means for geographical subzone and depth class (encounter rate).
Diversity 15 00321 g015
Figure 16. GLM estimated marginal means for geographical subzone and depth class (Shannon index). Estimated means are corrected for the effort covariate.
Diversity 15 00321 g016
Figure 17. The Shannon index was calculated on an annual basis (bottom) in eight different research units, operating in the respective study areas from 2004 to 2018 (top). In the datasets analysed, no significant trend was found (Spearman’s rank correlation test, p-value > 0.05). ARC: Alnilam Research and Conservation; CIMA: Fondazione CIMA; FADG: Fondazione Acquario di Genova; EOI: EcoOcean Institut; JDC: Jonian Dolphin Conservation; UNIPI: University of Pisa; OMD: Oceanomare Delphis Onlus; TRI: Tethys Research Institute.
Diversity 15 00321 g017aDiversity 15 00321 g017b
Figure 18. Chlorophyll concentration (mg.m−3) (average value for 2016). Data source: https://data.marine.copernicus.eu (accessed 20 December 2022).
Diversity 15 00321 g018
Table 1. Research groups, study area, and sampling period for the common dataset analysed. The subzones (M1, M2, M3, M4, M5, M6, M7, and M8) refer to the areas identified in Figure 1.
Research GroupStudy AreaSubzoneSampling PeriodSampling Effort (km)N SightingsData Source
Alnilam Research and ConservationAlboran SeaM12004–201127,9701396Intercet
SUBMONCataloniaM22010–2018150422Intercet
Association BREACHGulf of LionM22013–2016370048Intercet
EcoOcean Institut (and partners *)Gulf of Lion, French Riviera, Corsica WM22005–201548,7351835Intercet
Accademia del Leviatano (FLT Med Network)NW MediterraneanM22012–201557,5671006Intercet
Tethys Research Institute—CSRLiguria W, French RivieraM22004–201883,3772661Intercet
Fondazione CIMA (FLT Med Network)Ligurian SeaM22008–201346,6902057Intercet
Fondazione Acquario di GenovaE LiguriaM22004–201867,4561177Intercet
University of Genoa—DISTAVEastern Liguria, TuscanyM22005–200815,51349Intercet
CE.TU.S Cetacean Research CentreTuscanyM22004–201823,580507Intercet
ARPATTuscanyM22010–2011285126Intercet
Association CARINorthern CorsicaM22013–201513015Intercet
MIRACETIGulf of Lion, French Riviera, CorsicaM22004–201837,359665Intercet
Office de l’Environnement de la CorseStrait of BonifacioM22009–2012324942Intercet
SEA ME Sardinia onlusNortheast SardiniaM22011–20134291507Intercet
Bottlenose Dolphin Research InstituteNortheast SardiniaM22004–20138586334Intercet
Associazione CRAMANorthwest SardiniaM22010, 201637612Intercet
MareTerra OnlusNE Sardinia, LampedusaM22012–201611,853218Intercet
University of Pisa (FLT Med Network)Northern Tyrrhenian SeaM22008–201671,147653Intercet
University La SapienzaEastern Tyrrhenian SeaM32017–201883315Data owner
Oceanomare Delphis OnlusEastern Tyrrhenian SeaM32004–201654,7721083Intercet
Ketos (FLT Med Network)Tyrrhenian Sea, Strait of SicilyM3, M42004–201753,260673Intercet
MeRiS-Mediterraneo Ricerca e Sviluppo APSStrait of SicilyM42016, 201815319Intercet
University of Torino—DBIOSLampedusa (Strait of Sicily)M42004–20067650209Intercet
Jonian Dolphin ConservationGulf of Taranto (NW Ionian Sea)M52009–201752,505893Data owner
Tethys Research Institute—IDPGulf of AmbraciaM52004–201646,749859Intercet
ThalassaIonian GreeceM52004–201812,302203Intercet
Gaia Res. Institute and University of Torino—DBIOS (FLT Med Network)NE Ionian Sea and Adriatic SeaM5–M62014–201823,642123Intercet
DMAD—Marine Mammals Research AssociationSoutheast Adriatic, Bosphorus, Aegean Sea, Eastern MediterraneanM72011–20185727229Intercet
Archipelagos Inst. of Marine ConservationAegean SeaM72017–2018405195Data owner
Istanbul University and Turkish Marine Research FoundationAegean Sea, Eastern MediterraneanM7–M82005–20086901117Intercet
Morris Kahn Res. Station, Un. of HaifaEastern MediterraneanM82017–2018896035Intercet
TOTAL 795,98917,763
* Cybelle Planète, SCS and Participe Futur.
Table 2. Sighting distribution of the nine regularly observed species in the bathymetric domains (0–200 m, 200–2000 m, >2000 m).
SpeciesN Sightings
All Data0–200 m200–2000 m>2000 m
Stenella coeruleoalba8954 (50.4%)450 (10.0%)5446 (65.8%)3058 (61.4%)
Tursiops truncatus4043 (22.8%)3622 (80.6%)389 (4.7%)32 (0.6%)
Balaenoptera physlaus2196 (12.4%)92 (2.0%)673 (8.1%)1431 (28.7%)
Physeter macrocephalus1001 (5.6%)5 (0.1%)717 (8.7%)279 (5.6%)
Delphinus delphis695 (3.9%)288 (6.4%)360 (4.3%)47 (0.9%)
Ziphius cavirostris312 (1.8%)1 (0.02%)277 (3.3%)34 (0.7%)
Globicephala melas294 (1.7%)0 (0.0%)238 (2.9%)56 (1.1%)
Grampus griseus239 (1.3%)10 (0.2%)182 (2.2%)47 (0.9%)
Phocoena phocoena relicta26 (0.1%)26 (0.6)0 (0.0%)0 (0.0%)
Total17,760449482824984
Table 3. The striped dolphin ER obtained by category A (dedicated vessels with height <4.5 m) and B (dedicated vessels with height between 4.75 and 10.5 m) in subzone M1 (Alboran Sea). The ER obtained by category B is about double that of category A.
Alboran SeaA (<4.5 m)B (4.75–10.5 m)C (12–29 m)
N cells8484NA
Total effort (km)10,66414,990NA
Average ER (±SE)0.0104 (±0.002)0.0224 (±0.004)NA
Disclaimer/Publisher’s Note: The statements, opinions and data contained in all publications are solely those of the individual author(s) and contributor(s) and not of MDPI and/or the editor(s). MDPI and/or the editor(s) disclaim responsibility for any injury to people or property resulting from any ideas, methods, instructions or products referred to in the content.

