Abstract
In 2015, we initiated a country-wide coral reef ecosystem-monitoring program in the Dominican Republic (DR) to establish biodiversity baselines against which trends in the most important components of coral reef ecosystem’s structure and function could be tracked. Replicate transects were set at a 10 m depth at each of the 12 coral reef sites within 6 DR regions in 2015, 2017, 2019, and 2022. We quantified the species-level abundances of adult and juvenile corals, reef fishes, sea urchins, lionfishes, and algal functional groups. Country-wide, coral cover and reef fishes have declined. The steepest declines occurred for reefs that had been among the best in the Caribbean in 2015. However, by 2022, adult and juvenile coral, parrotfish, and other herbivores had declined, and macroalgae had increased. The declines in north-shore coral abundance corresponded with the observed disturbances from coral bleaching, hurricanes, and disease. The capacity of reefs to recover from such disturbances has been compromised by abundant and increasing macroalgae that have likely contributed to north-shore declines in juvenile corals. Country-wide, the abundance of all reef fish species has declined below those of other regions of the Caribbean. Improved management of fishing pressure on coral reefs would likely yield positive results.
1. Introduction
Never have scleractinian-dominated coral reefs been as threatened as they are today. Corals die because of hurricanes, ocean warming, disease, and over-growing seaweed. In most cases, factors that kill corals cannot be stopped by current human interventions. As a result, the best hope is to manage coral reefs for efficient and rapid recovery from those events [1,2,3]. While there may be a general agreement that management for coral reef recovery is necessary, how to do it and how to monitor changes require serious consideration. Specifically, managers and policy makers need to know not only the status of a coral reef and the factors important to them but also how they are trending. With such information, managers can determine how best to use their limited resources available to aid in coral reef recovery.
It is widely recognized that coral reefs are among the world’s most endangered ecosystems, and this is especially true in the Caribbean, where trends in declining herbivores, increasing algae, and declining coral effectively lock coral reefs in a degraded algal state [1,3,4,5,6]. Until recently, reef recovery from disturbances in the Caribbean was unknown [2,3,4,5]. In fact, too little is known about where and why reef condition is declining for most of a country’s coral reefs. While studying the trends in coral reefs is necessary, some studies focused on only a few locations within an island or a country, e.g., [4]. It is likely that different factors drive reef condition at different locations within a country or an island. It is possible that different factors in different regions may affect changes to coral reefs that will not be evident at a single site.
What is needed are assessments of the rates of decline or recovery of reefs over time and space. This informs managers where the most urgent action should be taken so they can mitigate the decline or improve the prospects for recovery. Effective action taken early can prevent the coral reef ecosystem from becoming “locked” into a coral-free state [4,5]. It is important to learn from reefs that are healthier than others. For example, recent studies determined that coral reefs in the eastern Caribbean, where fishing had been limited, were healthier and had more juvenile corals than reefs with unconstrained fishing practices [3,6]. Several Caribbean islands have effectively limited fishing pressure—especially on herbivorous parrotfish [7]. One of those islands, Bonaire (Dutch Antilles), thrives today and has highly resilient coral reefs that have fully recovered from a severe coral bleaching event in 2010 [3]. To achieve such recovery resilience requires conditions in which coral larvae can settle and grow to become juvenile corals, and injured corals can recover. If the juvenile corals survive and grow, they improve the recovery of the coral reef ecosystem [3,8,9].
Here, we report on the status and seven-year trends in 12 coral reefs distributed among 6 regions within three sectors along the Dominican Republic (DR) coastline (Figure 1). We monitored the prime drivers and indicators of coral reef health. A driver is a factor that contributes to or causes a change in coral reef structure or function. Heavy emphasis was placed on the drivers that allow a reef to be healthy, thrive, or recover following a disturbance. We measured the trends in key variables among the replicated samples at a 10 m depth in identical locations during each monitoring period. Specifically, we sought to determine the trends in the abundance of reef coral, macroalgae, parrotfish, and juvenile corals. We also censused Diadema sea urchins, other herbivorous fishes such as surgeonfishes, and carnivorous fishes. This study provides not only the status of the DR’s coral reefs in 2022 but specifically how and where they have changed since our first survey in 2015.
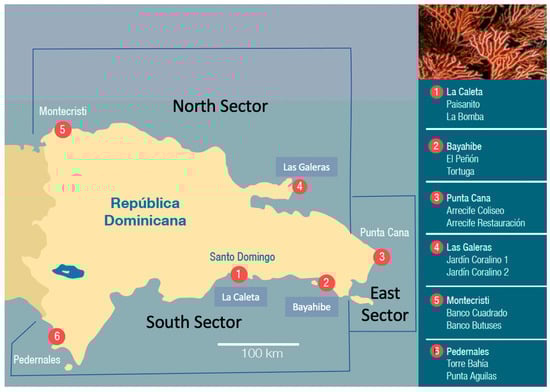
Figure 1.
Six monitored regions (numbered in the figure and panel to the right). Each region contained two monitoring sites (listed in panel to the right). Regions were further subdivided into north, east, and south sectors.
2. Methods
We established 12 coral reef monitoring sites, distributed among 6 regions from near the southern border with Haiti to the eastern-most region to near the northern border with Haiti (Figure 1). All sites had well-developed coral reefs that were used for diving and fishing. Most coral reefs were well-developed bank-barrier reefs. Most unique were those at the Montecristi region, where reef development was 10 km from the shore.
For our monitoring, we used a modified Atlantic and Gulf Rapid Reef Assessment (AGRRA) protocol [10] to quantify sessile benthic community structure at each site. At each site, at a 10 m water depth, replicate 10 m transect lead lines were placed on the reef (n = 4 per reef). We recorded the number of centimeters on each transect intercepted by live coral (measured for each coral species), sponges, gorgonians, and benthic algae (measured by functional group such as algal turfs, encrusting coralline algae (Corallinales), and noncoralline (peyssonnelid) crusts, and macroalgae). Benthic macroalgae were further subdivided into erect corticated macrophytes [11] and specific genera Lobophora and Halimeda because of their damaging effects on reef corals [12,13]. Canopy heights were measured to the nearest millimeter for all nonencrusting algae. The percent cover of each benthic organism (per transect) was determined by summing the centimeters intercepted by the organism and then dividing that total by the length of the transect. Transect sampling was further stratified to only include hard substrates (i.e., sand channels were excluded from our analysis). Macroalgal biomass was inferred by quantifying the algal volume, which is the product of percent cover and canopy height, also called “algal index” [6].
We also used a variety of methods to quantify other reef-dwelling organisms. Juvenile coral densities were quantified by deploying 25 cm × 25 cm quadrats at 5 locations (0, 2.5, 5, 7.5, and 10 m marks) adjacent to each 10 m transect. Quadrats were placed on the reef substrata largely devoid of adult corals (that is, <25% cover of live corals). Operationally, we defined juvenile corals as those less than 40 mm in maximum diameter. Each juvenile coral was identified to the species level and measured to the nearest millimeter. The sea urchin D. antillarum was censused by surveying belt transects (2 m wide) centered on the 10 m long transect used for quantifying sessile benthic organisms. Thus, within each belt transect, we surveyed a 20 m2 area. We measured the test size of each urchin encountered to the nearest millimeter. Fish population density and body sizes were quantified for all large fishes (that is, excluding small planktivores, such as chromis, and all blennies and gobies) using replicate 30 m × 4 m belt transects [14]. This involved attaching a spool with 30 m of line to dead coral and swimming slowly, recording all large vagile species including most predatory and herbivorous fishes. On the return swim, smaller, less vagile species were recorded. The biomass of each fish species (per transect) was determined using published length–weight relationships [15], and http://fishbase.se (accessed on 1 February 2023).
3. Results and Discussion
For any coral reef, coral abundance is the single most important component; however, the status of corals and coral reefs depends on many other factors. Patterns in coral abundance over time show variability at all levels from single transects, to reef sites, regions, sectors, and the entire country. All error bars reflect the standard error. Below, we summarize the trends in the important components of coral ecosystem structure and function, both geographically and spatially. The details for all monitored variables at each station for each year are provided in the Supplemental Information (Figure S1). Monitoring was conducted March 2015, May 2017 and 2019, and June 2022.
3.1. Trends in Corals, Their Drivers, and the Next Generation
Country-wide coral abundance has declined by nearly 5% since 2015 (Figure 2A). While coral abundances among sites in the South Sector were variable, they showed no net trend (Figure 2B). In contrast, coral cover in most North Sector sites declined (Figure 2C). By averaging all coral cover percentage data among sites in the North, South, and East Sectors (Figure 2D), we found regionally relevant patterns. Consistently low coral abundance predominated in the East Sector (Punta Cana). The East Sector lacks connectivity to coral larval sources due to the Mona Passage oceanographic barrier [16]. It is uniquely isolated by easterly trade winds that create long-shore currents to the north and south shores. The monitored reefs along the south shore generally averaged more abundant corals over the period but without any distinct temporal trend. In contrast, coral cover along the north shore (especially in the Montecristi region) have consistently declined from their high values in 2015.
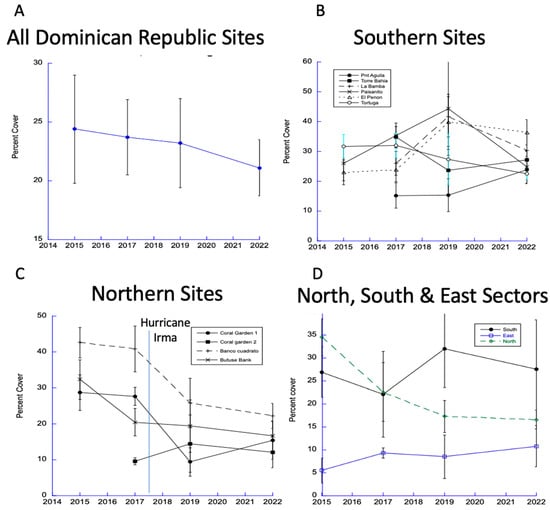
Figure 2.
Trends in coral cover from all DR sites (A), in the south (B), and in the north (C). Data from North, South, and East Sectors show strong and protracted declines in coral cover in the North Sector (D).
Next, we considered the interactions that may limit the abundance of coral. Recently, disease-related mortality has affected numerous coral species throughout the Caribbean. Most concerning is the recently introduced Stony Coral Rapid Tissue Loss (SCTL) disease [16]. A recent study in the Dominican Republic quantified all coral diseases as well as other agents of mortality in the last few years [17,18]. The coral disease study was held near or on our study sites (Figure 1). We examined the changes in coral abundance between 2019 and 2022 to determine if the disease outbreaks corresponded with changes in coral abundance. We found no relationship country-wide. However, among the southern sites (Figure 2B), Tortuga was observed to have the highest disease percentage in 2019 and continuing in 2022. That site went from highest percent cover of coral along the south shore in 2015 to lowest percent in 2022 (i.e., from 32% to 22%). It is possible that the disease is just starting. By June 2022, we did not detect significant country-wide losses in coral abundance resulting from disease.
Chief among the other agents of mortality is macroalgae, which have been shown to out-compete and poison adult coral [12,13] and to prevent the recruitment of juvenile corals [9,19]. To determine if corals are limited by macroalgae, we pooled all data from all transects for all years to determine the maximum coral cover that can coexist with macroalgae (Figure 3A) and conducted a similar analysis using all juvenile coral quadrat data (Figure 3B). In both cases, there was a significant negative relationship. In a similar analysis, we determined that the maximum abundance of macroalgae was inversely correlated with the abundance of parrotfishes (Figure 3C).
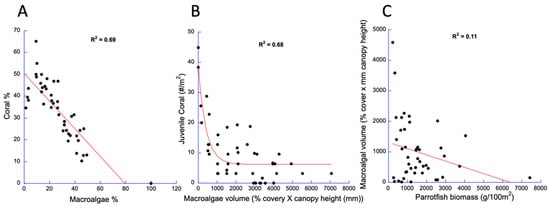
Figure 3.
Support for strong drivers that limit the abundances of important components of the DR’s coral reef ecosystems. Coral cover (A) and juvenile coral density (B) were limited by macroalgae cover (N = 180, 10 m transects, N = 895, 625 cm2 quadrats, respectively) and macroalgae limited by parrotfish abundance N = 360, 120 m2 belt transects (C). Data pooled from all surveys from all years.
Given the importance of parrotfishes as herbivores, their trends are most important. Parrotfish (Labridae: Scarinae) abundance was greatest in the North and South Sectors in 2015 and 2017 but declined by 2019 and remained relatively low during 2022 (Figure 4A). A similar pattern was reported for another important family of herbivores: the surgeonfishes (acanthurids) (Figure 4B).
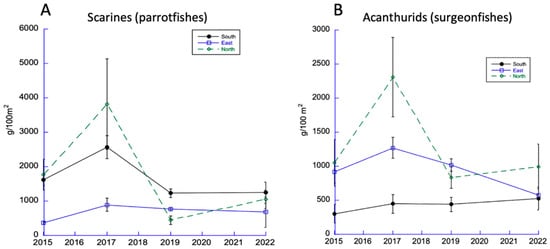
Figure 4.
Trends in dominant DR herbivorous fishes (parrotfishes (A) and surgeonfishes (B)).
Macroalgae have dominated reefs in the East Sector since monitoring began (Figure 5). This has created a hostile environment for corals. The South and North Sectors have less macroalgae; in 2022, algal abundance was increasing in the North and declining in the South Sector (discussed below). We monitored the abundance of crustose coralline algae but found no significant changes among sites in the North or South Sectors.
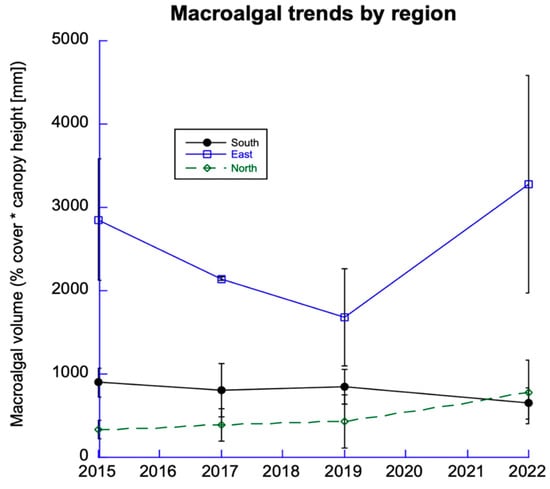
Figure 5.
Trends in macroalgae. Data from 12 sites among 6 DR regions from the 3 sectors.
Juvenile corals are important for the recovery of damaged coral reefs. While there has been no net change in the abundance of juvenile corals since 2015 in the East and South Sectors, the North Sector has shown a consistent decline since 2017 (Figure 6).
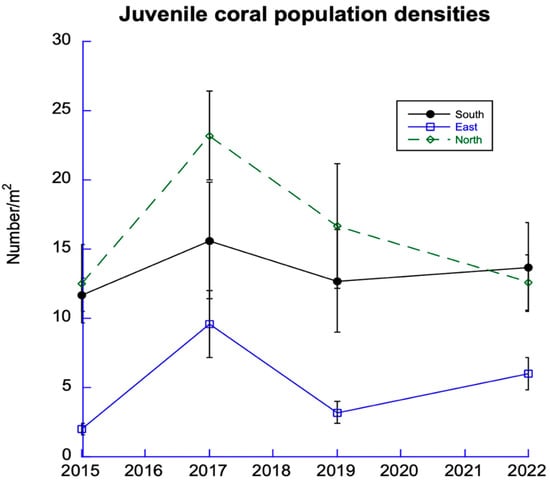
Figure 6.
Trends in juvenile corals. Data from 12 sites among 6 DR regions from the 3 sectors.
3.2. Trends in Interactions among Fish Species, Their Prey, and Ecosystem Feedback
Fish assemblages play important roles in the health of coral reefs. All fishes declined in abundance following the 2017 survey and have not recovered (Figure 7A). The steepest decline was recorded in the North Sector. Since 2019, the fish biomass total has been significantly less than published accounts for the eastern Caribbean archipelago [6].
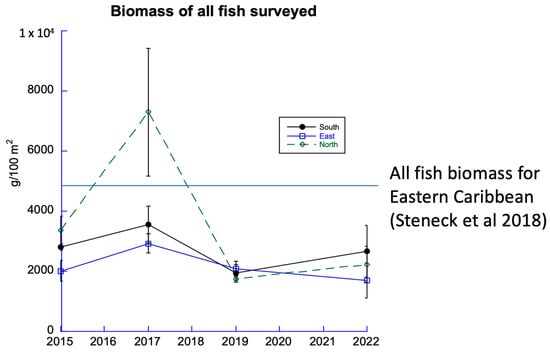
Figure 7.
Biomass of all fish from all transects, 2015 to 2022. The horizontal line illustrates the biomass of all fish surveyed for the Eastern Caribbean [6].
Fishing and hurricanes may have caused the decline in reef fish biomass (Figure 7). Illegal hookah spearfishing occurs in most of the DR, but it is more intense on the north coast (Figure 8A,B), resulting in large quantities and great diversity of reef fish being taken (Figure 8C). After our monitoring in May of 2017, Hurricanes Irma (Figure 9A) and Maria (Figure 9B) damaged coral reefs along the north shore. The observed destruction of branching corals may have flattened the reefs, thereby reducing available nursery habitats for recruiting fishes [20]; see photographs in Figure S2.
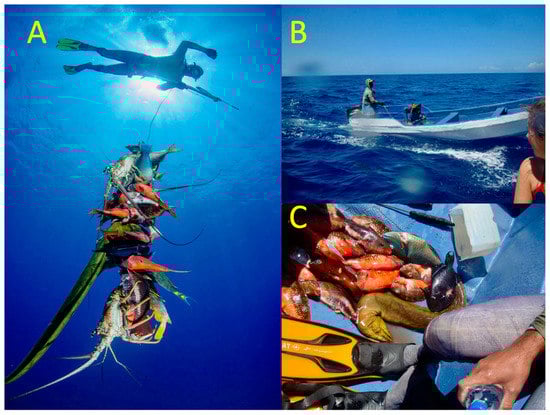
Figure 8.
(A) Observed spearfishing in the Montecristi Region March 2015. (B) Fisher with a hookah rig for supplying air to divers. (C) An afternoon’s catch of mostly parrotfish. Photographs by Jose Alejandro Alvarez.
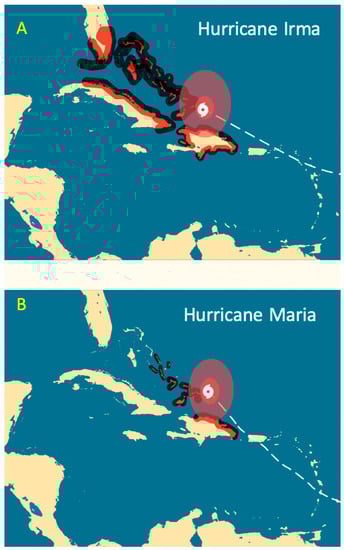
Figure 9.
The hurricane tracks for (A) Hurricanes Irma (7 September 2017) and (B) Maria (21 September 2017).
Snappers, seabass, and jacks were the three most abundant carnivorous reef fish on the DR’s coral reefs (Figure 10). Among those three families, the most abundant was the serranid (seabass) family, which includes groupers, graysbys, coney, and hinds. However, since monitoring began in 2015, serranids have declined most steeply every year. According to our 2022 monitoring study, serranids had declined by nearly 80%.
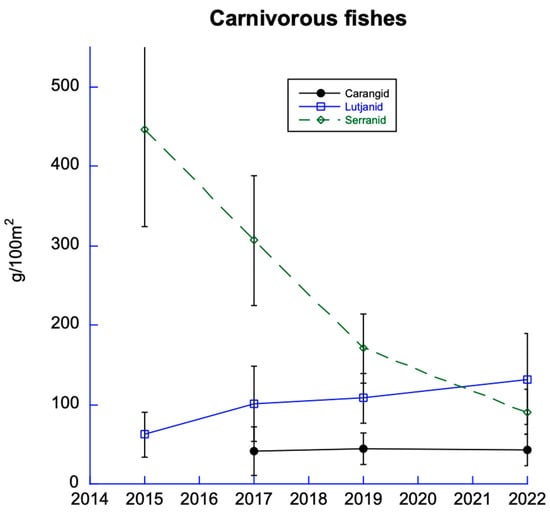
Figure 10.
Carnivorous fishes include carangids (jacks), lutjanids (snappers), and serranids (seabass). All were low in abundance, but serranids have declined the most since 2015.
The steep decline among serranids was observed at three of our six sites in the South Sector (Figure 11A). However, even at the time of our 2015 study, the Punta de Aguilas site already had low abundances of predatory fishes. The low abundance of predatory fishes there continued though our 2022 monitoring study; Punta de Aguilas was the only site where we recorded sharp increases in the abundances of sea urchins (Diadema antillarum, and Echinometra viridis; Figure 11B,C) as well as lionfish (Figure 11D). Several studies have suggested predators control sea urchin abundances, specifically including Diadema [21] and Echinometra species (reviewed in [22]). Other studies suggested that lionfish abundances in the Caribbean can be limited by serranid groupers [23]. Therefore, it is possible that the low predator abundance at the Punta de Aguilas site facilitated the increases in those prey species. Importantly, Diadema functions as an herbivore that depresses macroalgae, but only when its population density exceeds one per square meter ([22,24], i.e., 20 per 20 m2 belt transects, e.g., Figure 11B). At the Punta de Aguilas site, Diadema densities averaged over 2.75 per square meter. As a result of Diadema grazing, this site also had the lowest macroalgal abundance among the southern sites, which likely contributed to the slight decline in macroalgae in the South Sector (Figure 5).
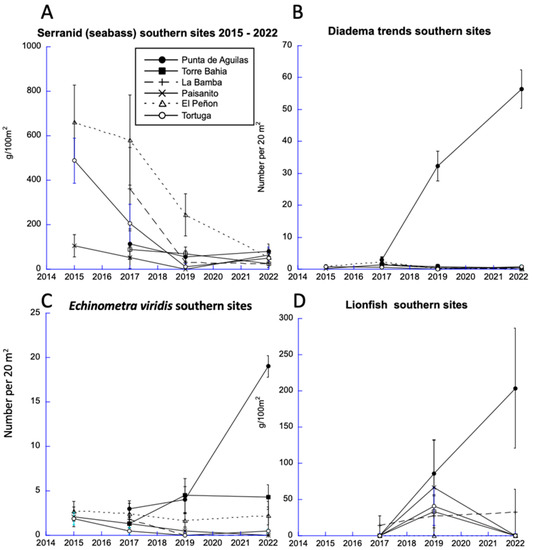
Figure 11.
Trends in seabass (Serranidae such as groupers, coney, and graysby) abundance and their potential prey across all years: (A) changes in seabass abundance for all southern sites (note that Punta Aguilas had low seabass abundance all years of monitoring), and (B,C) Diadema and Echinometra viridis and (D) lionfish.
Taken together, the trends among the factors that drive coral reef ecosystems (Figure 12) revealed that the highest proportion of negative trends were along the north coast, with the fewest in the south. We used those trends, in part, to track the drivers of coral reef resilience and to clearly specify to managers and policy makers which components of coral reef ecosystems are in decline. So, operationally, we must pay particular attention to the trends in the abundances of coral, macroalgae, parrotfishes, and juvenile corals (boldface in Figure 12). Whereas we saw both positive and negative trends among reef sites along the south shore, we found predominately negative trends among the coral reefs along the north DR shore (i.e., six negative and zero positive). The East Sector, which is the Punta Cana region, had, in 2015, the lowest coral cover, highest algal abundance, relatively few herbivores, and few recruiting corals. Most of the variables reflect reefs that continue in poor condition (i.e., three negative and zero positive trends).
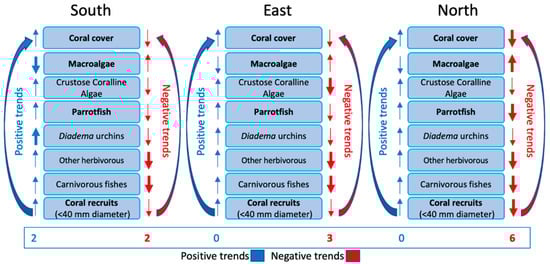
Figure 12.
Trends in major coral reef drivers (good condition or positive on left in blue; poor condition or negative on right in red) were evaluated using the monitoring protocol from [25]. Most important reef characteristics are in boldface. North Sector DR reefs were clearly trending most negatively, possibly because of multiple stresses (coral bleaching, hurricanes, and overfishing).
The curved arrows from coral recruits to coral cover in Figure 12 denote the role of coral recruitment in maintaining coral abundances. The management for improved coral recruitment, also called recovery resilience [3], is designed to facilitate the recovery of coral reef ecosystems following a disturbance. This concept for management was previously advanced [5,8]; however, there has been little attention paid to the consequences of which species to recruit to the reef. In other words, while coral recruitment will augment coral cover, it does not mean that the new corals will be functionally the same as those that make up the coral reef framework.
The composition of the DR’s coral reefs is changing. The juvenile corals are dominated by the relatively flat lettuce and mustard corals (Agaricia agaricites and Porites astreoides; Figure 13 left), whereas the single-most abundant adult coral is the star coral Orbicella faveolata (a coral reef framework species) (Figure 13, right). All coral species from the juvenile coral quadrats and the adult coral transects show a declining shift in the relative abundance of framework species and the increasing recruitment of weedy (juvenile) coral species (Figure 14). Corals that recruit readily reach reproductive maturity relatively quickly but lack vertical structure and are operationally called weedy corals (sensu [26]). As a result, the structure of the DR’s reefs may be becoming increasingly flat and, therefore, lacking habitat for reef fish and recruiting corals [20].
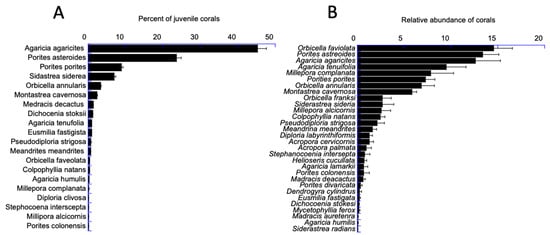
Figure 13.
Relative abundances for juvenile (A) and adult (B) coral species. Juvenile (N, 20 spp.) and adult (N, 30 spp.) coral averages are for all sites and all years.
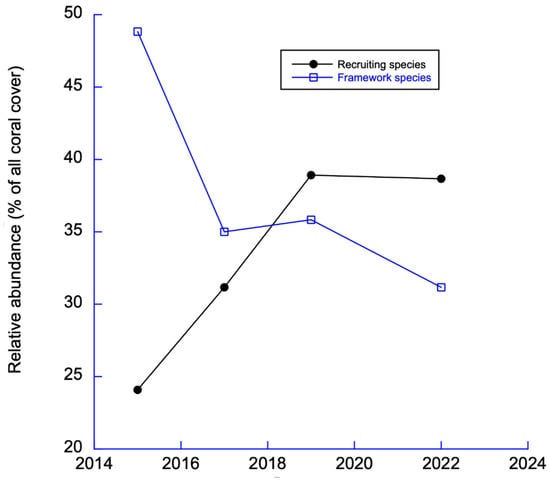
Figure 14.
Trends in recruiting (“weedy”) and framework species.
Lower figure (Figure 14) shows that there has been a steady decline in reef-building corals (framework species) and an increase of weedy low-profile (recruiting) coral species. The weedy species are low in stature but most readily colonize coral reefs [26]. This results in the flattening of coral reefs [27,28].
4. Conclusions
Since monitoring began in 2015, the coral reefs along the DR’s north shore have declined the most steeply. The greatest changes have occurred in the Montecristi Region. Those reefs, in 2015, were among the best in the Caribbean in terms of high coral cover, low algal biomass, abundant parrotfish, and abundant juvenile corals (compared with Eastern Caribbean and Belize [6,7], respectively). In 2015, there were large stands of acroporid corals (elkhorn and staghorn corals) along with branching leafy coral (Agaricia tenuifolia) (see Figure S2). However, in late summer of 2016 and September of 2017, a coral bleaching event and two hurricanes, respectively, killed corals in the Montecristi region (Figure S2). Those events, along with sustained fishing pressure (Figure 8B), seem to have contributed to the declines in corals and herbivorous fishes and increases in macroalgae among north-shore reefs. In addition, the fish fauna country-wide is below that of most other fished reefs in the Caribbean (Figure 2C).
Coral disease was evident in most reefs in the Dominican Republic. Of particular concern is the recent appearance of the Stony Coral Tissue Loss (SCTL) disease that has devastated corals in other areas of the Caribbean, such as the Florida Keys. The reported relatively high levels of SCTL disease in the Las Galeras region [18] did not correspond to a decline in coral cover in that region (i.e., Figure 2C). We observed disease among several coral species in the South Sector’s Bayahibe region (at the Tortuga and El Peñon sites); however, that region had the lowest reported coral disease mortality [18]. Nevertheless, we recorded a significant decline at the Tortuga site (Figure 2B).
In summary, the coral reefs of the Dominican Republic have been degraded from a variety of sources. Coral reef recovery from disturbances, such as hurricanes, disease, or coral bleaching, requires the settlement and growth of juvenile corals. Macroalgae, which remain relatively abundant on the DR’s coral reefs, need to be reduced because they prevent coral colonization and growth. The decline in reef-building framework corals and the increased relative abundance of low-profile weedy corals now dominate the DR’s coral reefs. The resulting flatter reefs have fewer spaces where reef fish and lobsters can hide and grow upward more slowly, which could compromise their capacity to keep up with increasing rates of sea-level rise.
Supplementary Materials
The following supporting information can be downloaded at: https://www.mdpi.com/article/10.3390/d15030389/s1, Figure S1: Trends for each site over all years. Table S1: Photographs from Montecristi region showing the effects of coral bleaching (2016) and hurricanes (September 2017).
Author Contributions
R.S.S. and R.T. selected research areas and monitoring protocol. R.S.S. and R.T. collected all data. R.S.S. performed most of the data analyses and wrote the first draft. All authors have read and agreed to the published version of the manuscript.
Funding
All funding was from PropaGas Foundation (Dominican Republic).
Institutional Review Board Statement
No organism was touched and thus does not require ethical approval of any kind.
Data Availability Statement
All data are available upon request to Steneck@maine.edu.
Acknowledgments
We received considerable help in the field from Ramón de León Barrios (Reef Support BV) Doug Rasher (Bigelow Laboratories for Ocean Sciences), students in Dominican Republic of Universidad Autónoma de Santo Domingo, Pontificia Universidad Católica Madre y Maestra, and el Instituto Tecnológico de Santo Domingo, and students in the University of Maine’s School of Marine Sciences. Specifically (2017: Elise Hartill, Makaila Kowalsky, Katie Liberman, and Tiega Martin; 2019: Gretchen Grebe, Hannah Kerrigan, Mackenzie Menard, and Grace McDermott).
Conflicts of Interest
The authors declare no conflict of interest.
References
- Hughes, T.P.; Graham, N.A.; Jackson, J.B.; Mumby, P.; Steneck, R.S. Rising to the challenge of sustaining coral reef resilience. Trends Ecol. Evol. 2010, 25, 633–642. [Google Scholar] [CrossRef]
- Connell, J.H. Disturbance and recovery of coral assemblages. Coral Reefs 1997, 16, S101–S113. [Google Scholar] [CrossRef]
- Steneck, R.S.; Arnold, S.N.; Boenish, R.; De León, R.; Mumby, P.J.; Rasher, D.B.; Wilson, M.W. Managing Recovery Resilience in Coral Reefs Against Climate-Induced Bleaching and Hurricanes: A 15 Year Case Study from Bonaire, Dutch Caribbean. Front. Mar. Sci. 2019, 6, 265. [Google Scholar] [CrossRef]
- Jackson, J.B.C.; Donovan, M.K.; Cramer, K.L.; Lam, V.V. Status and Trends of Caribbean Coral Reefs. Global Coral Reef Monitoring Network; IUCN: Gland, Switzerland, 2014; pp. 1970–2012. [Google Scholar]
- Graham, N.A.; Bellwood, D.R.; Cinner, J.E.; Hughes, T.P.; Norström, A.V.; Nyström, M. Managing resilience to reverse phase shifts in coral reefs. Front. Ecol. Environ. 2013, 11, 541–548. [Google Scholar] [CrossRef]
- Steneck, R.S.; Mumby, P.J.; MacDonald, C.; Rasher, D.B.; Stoyle, G. Attenuating effects of ecosystem management on coral reefs. Sci. Adv. 2018, 4, eaao5493. [Google Scholar] [CrossRef]
- Mumby, P.J.; Steneck, R.S.; Roff, G.; Paul, V.J. Marine reserves, fisheries ban, and 20 years of positive change in a coral reef ecosystem. Conserv. Biol. 2021, 35, 1473–1483. [Google Scholar] [CrossRef]
- Mumby, P.J.; Steneck, R.S. Coral reef management and conservation in light of rapidly evolving ecological paradigms. Trends Ecol. Evol. 2008, 23, 555–563. [Google Scholar] [CrossRef]
- Arnold, S.N.; Steneck, R.S.; Mumby, P. Running the gauntlet: Inhibitory effects of algal turfs on the processes of coral recruitment. Mar. Ecol. Prog. Ser. 2010, 414, 91–105. [Google Scholar] [CrossRef]
- Lang, J.C.; Marks, K.W.; Kramer, P.A.; Kramer, P.R.; Ginsburg, R.N. 2010 AGRRA Protocols Version 5.4; Atlantic Gulf Rapid Reef Assessment. Available online: https://www.researchgate.net/profile/Philip-Kramer-3/publication/265148106_Agrra_protocols_version_54/links/5553ba6a08ae980ca6085ac3/Agrra-protocols-version-54.pdf (accessed on 6 March 2023).
- Steneck, R.S.; Dethier, M.N. A Functional Group Approach to the Structure of Algal-Dominated Communities. Oikos 1994, 69, 476. [Google Scholar] [CrossRef]
- Box, S.; Mumby, P. Effect of macroalgal competition on growth and survival of juvenile Caribbean corals. Mar. Ecol. Prog. Ser. 2007, 342, 139–149. [Google Scholar] [CrossRef]
- Rasher, D.B.; Hay, M.E. Chemically rich seaweeds poison corals when not controlled by herbivores. Proc. Natl. Acad. Sci. USA 2010, 107, 9683–9688. [Google Scholar] [CrossRef]
- Sale, P.F.; Douglas, W.A. Precision and accuracy of visual census technique for fish assemblages on coral patch reefs. Environ. Biol. Fishes 1981, 6, 333–339. [Google Scholar] [CrossRef]
- Bohnsack, J.A.; Harper, D.E. Length-Weight Relationships of Selected Marine Reef Fishes from the Southeastern United States and the Caribbean; U.S. Department of Commerce, National Oceanic and Atmospheric Administration, National Marine Fisheries Service, Southeast Fisheries Center: Miami, FL, USA, 1988. [Google Scholar]
- Baums, I.B.; Paris, C.B.; Chérubin, L.M. A bio-oceanographic filter to larval dispersal in a reef-building coral. Limnol. Oceanogr. 2006, 51, 1969–1981. [Google Scholar] [CrossRef]
- Alvarez-Filip, L.; Estrada, N.; Pérez-Cervantes, E.; Molina-Hernández, A.; González-Barrios, F.J. A rapid spread of the stony coral tissue loss disease outbreak in the Mexican Caribbean. PeerJ 2019, 7, e8069. [Google Scholar] [CrossRef]
- Croquer, A.; Zambrano, S.; King, S.; Reyes, A.; Sellares-Blanco, R.; Trinidad, A.V.; Villalpando, M.; Rodriguez-Jerez, Y.; Vargas, E.; Cortes-Useche, C.; et al. Stony Coral Tissue Loss Disease and Other Diseases Affect Adults and Recruits of Major Reef Builders at Different Spatial Scales in the Dominican Republic. Gulf Caribb. Res. 2022, 33, GCFI1–GCFI13. [Google Scholar] [CrossRef]
- Steneck, R.; Arnold, S.; Mumby, P. Experiment mimics fishing on parrotfish: Insights on coral reef recovery and alternative attractors. Mar. Ecol. Prog. Ser. 2014, 506, 115–127. [Google Scholar] [CrossRef]
- Alvarez-Filip, L.; Dulvy, N.; Gill, J.A.; Côté, I.M.; Watkinson, A.R. Flattening of Caribbean coral reefs: Region-wide declines in architectural complexity. Proc. R. Soc. B Boil. Sci. 2009, 276, 3019–3025. [Google Scholar] [CrossRef]
- Levitan, D.R. Community Structure in Time Past: Influence of Human Fishing Pressure on Algal-Urchin Interactions. Ecology 1992, 73, 1597–1605. [Google Scholar] [CrossRef]
- Steneck, R.S. Regular sea urchins as drivers of shallow benthic marine community structure. Develop. Aquacult. Fish. Sci. 2020, 43, 255–279. [Google Scholar] [CrossRef]
- Mumby, P.J.; Harborne, A.R.; Brumbaugh, D.R. Grouper as a Natural Biocontrol of Invasive Lionfish. PLoS ONE 2011, 6, e21510. [Google Scholar] [CrossRef]
- Carpenter, R.C.; Edmunds, P.J. Local and regional scale recovery of Diadema promotes recruitment of scleractinian corals. Ecol. Lett. 2006, 9, 271–280. [Google Scholar] [CrossRef] [PubMed]
- Steneck, R.S.; McClanahan, T.; Arnold, S.N.; Brown, J.B. A Report on the Status of the Coral Reefs of Bonaire in 2005 with Advice on a Monitoring Program; Unpublished report to the Bonaire Marine National Park (STINAPA); University of Maine Darling Marine Center: Walpole, ME, USA, 2005. [Google Scholar]
- Darling, E.S.; Alvarez-Filip, L.; Oliver, T.A.; McClanahan, T.R.; Côté, I.M. Evaluating life-history strategies of reef corals from species traits. Ecol. Lett. 2012, 15, 1378–1386. [Google Scholar] [CrossRef] [PubMed]
- Alvarez-Filip, L.; Dulvy, N.K.; Côté, I.M.; Watkinson, A.R.; Gill, J.A. Coral identity underpins architectural complexity on Caribbean reefs. Ecol. Appl. 2011, 21, 2223–2231. [Google Scholar] [CrossRef] [PubMed]
- Mumby, P.J.; Steneck, R.S. The Resilience of Coral Reefs and Its Implications for Reef Management. In Coral Reefs: An Ecosystem. In Transition; Springer: Berlin, Germany, 2010; pp. 509–519. [Google Scholar] [CrossRef]
Disclaimer/Publisher’s Note: The statements, opinions and data contained in all publications are solely those of the individual author(s) and contributor(s) and not of MDPI and/or the editor(s). MDPI and/or the editor(s) disclaim responsibility for any injury to people or property resulting from any ideas, methods, instructions or products referred to in the content. |
© 2023 by the authors. Licensee MDPI, Basel, Switzerland. This article is an open access article distributed under the terms and conditions of the Creative Commons Attribution (CC BY) license (https://creativecommons.org/licenses/by/4.0/).