Genetic Structure and Differentiation of Endangered Cycas Species Indicate a Southward Migration Associated with Historical Cooling Events
Abstract
:1. Introduction
2. Material and Methods
2.1. Sample Collection
2.2. SNP Calling
2.3. Genetic Diversity and Structure Analysis
2.4. Gene Flow and Genetic Differentiation
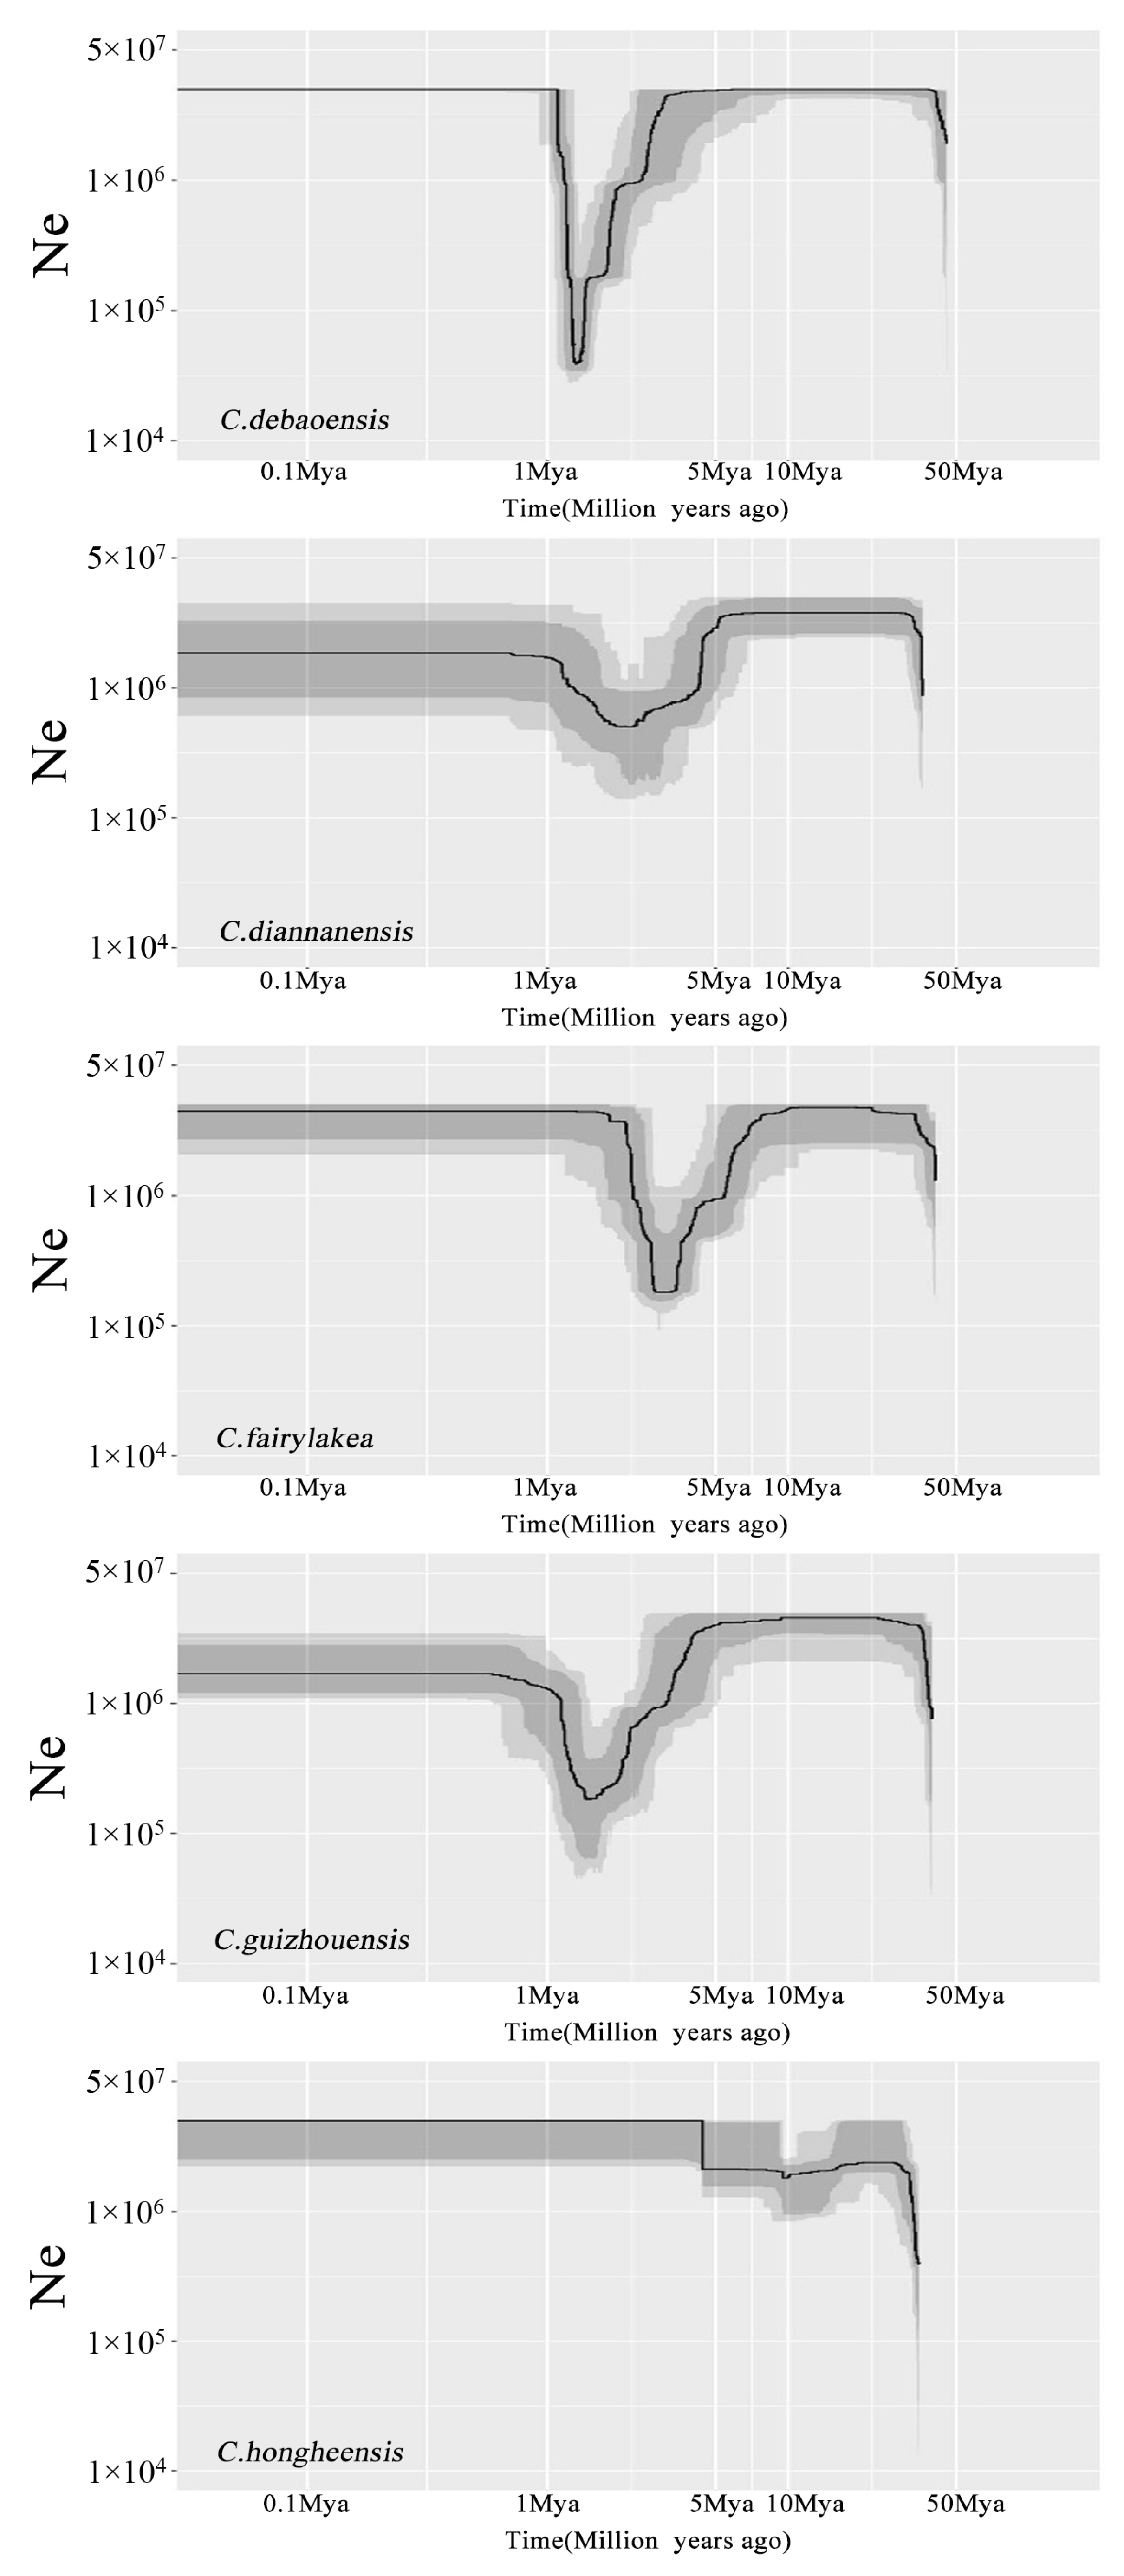
2.5. Population Demographic History
3. Results
3.1. SNP Characteristics of Cycas Populations
3.2. Genetic Diversity of Cycas Species
3.3. Genetic Phylogenetic Relationship of the Five Cycas Species
3.4. Genetic Differentiation and Gene Flow among the Five Cycas Species
3.5. Demographic History of the Five Cycas Species
4. Discussion
5. Conclusions
Supplementary Materials
Author Contributions
Funding
Institutional Review Board Statement
Informed Consent Statement
Data Availability Statement
Acknowledgments
Conflicts of Interest
References
- Schlötterer, C. The evolution of molecular markers—Just a matter of fashion? Nat. Rev. Genet. 2004, 5, 63–69. [Google Scholar] [CrossRef] [PubMed]
- Ma, H.; Liu, Y.; Liu, D.; Sun, W.; Liu, X.; Wan, Y.; Zhang, X.; Zhang, R.; Yun, Q.; Wang, J. Chromosome-level genome assembly and population genetic analysis of a critically endangered rhododendron provide insights into its conservation. Plant J. 2021, 107, 1533–1545. [Google Scholar] [CrossRef] [PubMed]
- Saccheri, I.; Kuussaari, M.; Kankare, M.; Vikman, P.; Fortelius, W.; Hanski, I. Inbreeding and extinction in a butterfly metapopulation. Nature 1998, 392, 491–494. [Google Scholar] [CrossRef]
- Escaravage, N.; Cambecedes, J.; Largier, G.; Pornon, A. Conservation genetics of the rare Pyreneo-Cantabrian endemic Aster pyrenaeus (Asteraceae). AoB Plants 2011, 2011. [Google Scholar] [CrossRef] [PubMed]
- Fox, C.W.; Reed, D.H. Inbreeding depression increases with environmental stress: An experimental study and meta-analysis. Evolution 2011, 65, 246–258. [Google Scholar] [CrossRef]
- Ouborg, N.; Vergeer, P.; Mix, C. The rough edges of the conservation genetics paradigm for plants. J. Ecol. 2006, 94, 1233–1248. [Google Scholar] [CrossRef]
- Wang, K.; Deng, P.; Yao, Z.; Dong, J.; He, Z.; Yang, P.; Liu, Y. Biogeographic patterns of polyploid species for the angiosperm flora in China Running title: Biogeography of polyploid species in China. J. Syst. Evol. 2022. [Google Scholar] [CrossRef]
- Xu, J.; Xiao, P.; Li, T.; Wang, Z. Research Progress on endangered plants: A bibliometric analysis. Biodivers. Conserv. 2022, 31, 1125–1147. [Google Scholar] [CrossRef]
- Yu, W.; Wu, B.; Wang, X.; Yao, Z.; Li, Y.; Liu, Y. Scale-dependent effects of habitat fragmentation on the genetic diversity of Actinidia chinensis populations in China. Hortic. Res. 2020, 7, 172. [Google Scholar] [CrossRef]
- Wu, Q.; Zang, F.; Ma, Y.; Zheng, Y.; Zang, D. Analysis of genetic diversity and population structure in endangered Populus wulianensis based on 18 newly developed EST-SSR markers. Glob. Ecol. Conserv. 2020, 24, e01329. [Google Scholar] [CrossRef]
- Wang, X.; Li, L.; Zhao, J.; Li, F.; Guo, W.; Chen, X. Effects of different preservation methods on inter simple sequence repeat (ISSR) and random amplified polymorphic DNA (RAPD) molecular markers in botanic samples. Comptes Rendus Biol. 2017, 340, 204–213. [Google Scholar] [CrossRef] [PubMed]
- Tian, Q.; El-Kassaby, Y.A.; Li, W. Revealing the Genetic Structure and Differentiation in Endangered Pinus bungeana by Genome-Wide SNP Markers. Forests 2022, 13, 326. [Google Scholar] [CrossRef]
- Nazareno, A.G.; Bemmels, J.B.; Dick, C.W.; Lohmann, L.G. Minimum sample sizes for population genomics: An empirical study from an Amazonian plant species. Mol. Ecol. Resour. 2017, 17, 1136–1147. [Google Scholar] [CrossRef]
- Zhang, C.; He, Z.; Dong, X.; Liu, H.; Zhou, H.; Wang, K.; Guo, J.; Liu, Y. History cooling events contributed to the endangered status of Pseudotsuga brevifolia endemic to limestone habitats. Glob. Ecol. Conserv. 2023, 42, e02414. [Google Scholar] [CrossRef]
- Cai, C.; Xiao, J.; Ci, X.; Conran, J.G.; Li, J. Genetic diversity of Horsfieldia tetratepala (Myristicaceae), an endangered Plant Species with Extremely Small Populations to China: Implications for its conservation. Plant Syst. Evol. 2021, 307, 50. [Google Scholar] [CrossRef]
- Nagalingum, N.S.; Marshall, C.R.; Quental, T.B.; Rai, H.S.; Little, D.P.; Mathews, S. Recent synchronous radiation of a living fossil. Science 2011, 334, 796–799. [Google Scholar] [CrossRef] [PubMed]
- Zheng, Y.; Liu, J.; Feng, X.; Gong, X. The distribution, diversity, and conservation status of Cycas in China. Ecol. Evol. 2017, 7, 3212–3224. [Google Scholar] [CrossRef]
- Christenhusz, M.J.; Reveal, J.L.; Farjon, A.; Gardner, M.F.; Mill, R.R.; Chase, M.W. A new classification and linear sequence of extant gymnosperms. Phytotaxa 2011, 19, 55–70. [Google Scholar] [CrossRef]
- Marler, P.N.; Marler, T.E. An assessment of Red List data for the Cycadales. Trop. Conserv. Sci. 2015, 8, 1114–1125. [Google Scholar] [CrossRef]
- Liu, J.; Lindstrom, A.J.; Chen, Y.S.; Nathan, R.; Gong, X. Congruence between ocean-dispersal modelling and phylogeography explains recent evolutionary history of Cycas species with buoyant seeds. New Phytol. 2021, 232, 1863–1875. [Google Scholar] [CrossRef]
- Fragnière, Y.; Bétrisey, S.; Cardinaux, L.; Stoffel, M.; Kozlowski, G. Fighting their last stand? A global analysis of the distribution and conservation status of gymnosperms. J. Biogeogr. 2015, 42, 809–820. [Google Scholar] [CrossRef]
- Condamine, F.L.; Nagalingum, N.S.; Marshall, C.R.; Morlon, H. Origin and diversification of living cycads: A cautionary tale on the impact of the branching process prior in Bayesian molecular dating. BMC Evol. Biol. 2015, 15, 65. [Google Scholar] [CrossRef]
- Hill, K.D.; Stevenson, D.W.; Osborne, R. The world list of cycads. Bot. Rev. 2004, 70, 274–298. [Google Scholar] [CrossRef]
- Yang, Y.; Li, Y.; Li, L.F.; Ge, X.J.; Gong, X. Isolation and characterization of microsatellite markers for Cycas debaoensis Y. C. Zhong et C. J. Chen (Cycadaceae). Mol. Ecol. Resour. 2008, 8, 913–915. [Google Scholar] [CrossRef]
- Zhan, Q.-Q.; Wang, J.-F.; Gong, X.; Peng, H. Patterns of chloroplast DNA variation in Cycas debaoensis (Cycadaceae): Conservation implications. Conserv. Genet. 2011, 12, 959–970. [Google Scholar] [CrossRef]
- Xiao, L.Q.; Ge, X.J.; Gong, X.; Hao, G.; Zheng, S.X. ISSR variation in the endemic and endangered plant Cycas guizhouensis (Cycadaceae). Ann. Bot. 2004, 94, 133–138. [Google Scholar] [CrossRef] [PubMed]
- Feng, X.; Zheng, Y.; Gong, X. Middle-Upper Pleistocene climate changes shaped the divergence and demography of Cycas guizhouensis (Cycadaceae): Evidence from DNA sequences and microsatellite markers. Sci. Rep. 2016, 6, 27368. [Google Scholar] [CrossRef]
- Wang, D.P.; Peng, S.L.; Chen, F.P.; Ji, S.Y. Population dynamics and considerations for the conservation of the rare Cycas fairylakea in China. For. Stud. China 2012, 14, 118–123. [Google Scholar] [CrossRef]
- Liu, J.; Zhou, W.; Gong, X. Species delimitation, genetic diversity and population historical dynamics of Cycas diannanensis (Cycadaceae) occurring sympatrically in the Red River region of China. Front. Plant Sci. 2015, 6, 696. [Google Scholar] [CrossRef]
- Wade, E.M.; Nadarajan, J.; Yang, X.; Ballesteros, D.; Sun, W.; Pritchard, H.W. Plant species with extremely small populations (PSESP) in China: A seed and spore biology perspective. Plant Divers. 2016, 38, 209–220. [Google Scholar] [CrossRef]
- Liu, J.; Zhang, S.; Nagalingum, N.S.; Chiang, Y.C.; Lindstrom, A.J.; Gong, X. Phylogeny of the gymnosperm genus Cycas L. (Cycadaceae) as inferred from plastid and nuclear loci based on a large-scale sampling: Evolutionary relationships and taxonomical implications. Mol. Phylogen. Evol. 2018, 127, 87–97. [Google Scholar] [CrossRef] [PubMed]
- Chiang, Y.C.; Hung, K.H.; Moore, S.J.; Ge, X.J.; Huang, S.; Hsu, T.W.; Schaal, B.A.; Chiang, T. Paraphyly of organelle DNAs in Cycas Sect. Asiorientales due to ancient ancestral polymorphisms. BMC Evol. Biol. 2009, 9, 161. [Google Scholar] [CrossRef] [PubMed]
- Cibrián-Jaramillo, A.; Daly, A.C.; Brenner, E.; Desalle, R.; Marler, T.E. When North and South don’t mix: Genetic connectivity of a recently endangered oceanic cycad, Cycas micronesica, in Guam using EST-microsatellites. Mol. Ecol. 2010, 19, 2364–2379. [Google Scholar] [CrossRef] [PubMed]
- Feng, X.; Wang, Y.; Gong, X. Genetic diversity, genetic structure and demographic history of Cycas simplicipinna (Cycadaceae) assessed by DNA sequences and SSR markers. BMC Plant Biol. 2014, 14, 187. [Google Scholar] [CrossRef]
- Feng, X.; Liu, J.; Gong, X. Species Delimitation of the Cycas segmentifida Complex (Cycadaceae) Resolved by Phylogenetic and Distance Analyses of Molecular Data. Front. Plant Sci. 2016, 7, 134. [Google Scholar] [CrossRef]
- Yessoufou, K.; Daru, B.H.; Tafirei, R.; Elansary, H.O.; Rampedi, I. Integrating biogeography, threat and evolutionary data to explore extinction crisis in the taxonomic group of cycads. Ecol. Evol. 2017, 7, 2735–2746. [Google Scholar] [CrossRef]
- Xiao, L.Q.; Möller, M. Nuclear ribosomal ITS functional paralogs resolve the phylogenetic relationships of a late-Miocene radiation cycad Cycas (Cycadaceae). PLoS ONE 2015, 10, e0117971. [Google Scholar] [CrossRef]
- Gong, Y.Q.; Zhan, Q.Q.; Nguyen, K.S.; Nguyen, H.T.; Wang, Y.H.; Gong, X. The historical demography and genetic variation of the endangered Cycas multipinnata (Cycadaceae) in the red river region, examined by chloroplast DNA sequences and microsatellite markers. PLoS ONE 2015, 10, e0117719. [Google Scholar] [CrossRef]
- Zheng, Y.; Liu, J.; Gong, X. Tectonic and climatic impacts on the biota within the Red River Fault, evidence from phylogeography of Cycas dolichophylla (Cycadaceae). Sci. Rep. 2016, 6, 33540. [Google Scholar] [CrossRef]
- Roodt, D.; Lohaus, R.; Sterck, L.; Swanepoel, R.L.; Van de Peer, Y.; Mizrachi, E. Evidence for an ancient whole genome duplication in the cycad lineage. PLoS ONE 2017, 12, e0184454. [Google Scholar] [CrossRef]
- Tao, Y.; Chen, B.; Kang, M.; Liu, Y.; Wang, J. Genome-Wide Evidence for Complex Hybridization and Demographic History in a Group of Cycas From China. Front. Genet. 2021, 12, 1614. [Google Scholar] [CrossRef] [PubMed]
- Elshire, R.J.; Glaubitz, J.C.; Sun, Q.; Poland, J.A.; Kawamoto, K.; Buckler, E.S.; Mitchell, S.E. A robust, simple genotyping-by-sequencing (GBS) approach for high diversity species. PLoS ONE 2011, 6, e19379. [Google Scholar] [CrossRef]
- Brown, J.; Pirrung, M.; McCue, L.A. FQC Dashboard: Integrates FastQC results into a web-based, interactive, and extensible FASTQ quality control tool. Bioinformatics 2017, 33, 3137–3139. [Google Scholar] [CrossRef] [PubMed]
- Liu, J.; Lindstrom, A.J.; Gong, X. Towards the plastome evolution and phylogeny of Cycas L.(Cycadaceae): Molecular-morphology discordance and gene tree space analysis. BMC Plant Biol. 2022, 22, 116. [Google Scholar] [CrossRef] [PubMed]
- Catchen, J.; Hohenlohe, P.A.; Bassham, S.; Amores, A.; Cresko, W.A. Stacks: An analysis tool set for population genomics. Mol. Ecol. 2013, 22, 3124–3140. [Google Scholar] [CrossRef] [PubMed]
- Alexander, D.H.; Novembre, J.; Lange, K. Fast model-based estimation of ancestry in unrelated individuals. Genome Res. 2009, 19, 1655–1664. [Google Scholar] [CrossRef] [PubMed]
- Chang, C.C.; Chow, C.C.; Tellier, L.C.; Vattikuti, S.; Purcell, S.M.; Lee, J.J. Second-generation PLINK: Rising to the challenge of larger and richer datasets. Gigascience 2015, 4, 7. [Google Scholar] [CrossRef]
- Jombart, T. Adegenet: A R package for the multivariate analysis of genetic markers. Bioinformatics 2008, 24, 1403–1405. [Google Scholar] [CrossRef]
- Pickrell, J.K.; Pritchard, J.K. Inference of population splits and mixtures from genome-wide allele frequency data. PLoS Genet. 2012, 8, e1002967. [Google Scholar] [CrossRef]
- McKenna, A.; Hanna, M.; Banks, E.; Sivachenko, A.; Cibulskis, K.; Kernytsky, A.; Garimella, K.; Altshuler, D.; Gabriel, S.; Daly, M.; et al. The Genome Analysis Toolkit: A MapReduce framework for analyzing next-generation DNA sequencing data. Genome Res. 2010, 20, 1297–1303. [Google Scholar] [CrossRef]
- Wright, S. The genetical structure of populations. Ann. Eugen. 1951, 15, 323–354. [Google Scholar] [CrossRef] [PubMed]
- Excoffier, L.; Lischer, H.E.L. Arlequin suite ver 3.5: A new series of programs to perform population genetics analyses under Linux and Windows. Mol. Ecol. Resour. 2010, 10, 564–567. [Google Scholar] [CrossRef] [PubMed]
- Nguyen, L.T.; Schmidt, H.A.; von Haeseler, A.; Minh, B.Q. IQ-TREE: A fast and effective stochastic algorithm for estimating maximum-likelihood phylogenies. Mol. Biol. Evol. 2015, 32, 268–274. [Google Scholar] [CrossRef] [PubMed]
- Liu, X.; Fu, Y.X. Stairway Plot 2: Demographic history inference with folded SNP frequency spectra. Genome Biol. 2020, 21, 280. [Google Scholar] [CrossRef] [PubMed]
- Terrab, A.; Talavera, S.; Arista, M.; Paun, O.; Stuessy, T.F.; Tremetsberger, K. Genetic diversity at chloroplast microsatellites (cpSSRs) and geographic structure in endangered West Mediterranean firs (Abies spp., Pinaceae). Taxon 2007, 56, 409–416. [Google Scholar] [CrossRef]
- Yang, R.; Feng, X.; Gong, X. Genetic structure and demographic history of Cycas chenii (Cycadaceae), an endangered species with extremely small populations. Plant Divers. 2017, 39, 44–51. [Google Scholar] [CrossRef] [PubMed]
- Excoffier, L.; Marchi, N.; Marques, D.A.; Matthey-Doret, R.; Gouy, A.; Sousa, V.C. fastsimcoal2: Demographic inference under complex evolutionary scenarios. Bioinformatics 2021, 37, 4882–4885. [Google Scholar] [CrossRef]
- Hamrick, J.L.; Godt, M.J.W. Effects of life history traits on genetic diversity in plant species. Philos. Trans. R. Soc. B Biol. Sci. 1996, 351, 1291–1298. [Google Scholar] [CrossRef]
- Frankham, R.; Briscoe, D.A. Introduction to Conservation Genetics; Cambridge University Press: Cambridge, UK, 2010. [Google Scholar]
- Nybom, H. Comparison of different nuclear DNA markers for estimating intraspecific genetic diversity in plants. Mol. Ecol. 2004, 13, 1143–1155. [Google Scholar] [CrossRef]
- Daszak, P.; Cunningham, A.A.; Hyatt, A.D. Emerging infectious diseases of wildlife--threats to biodiversity and human health. Science 2000, 287, 443–449. [Google Scholar] [CrossRef]
- Barrett, R.D.; Schluter, D. Adaptation from standing genetic variation. Trends Ecol. Evol. 2008, 23, 38–44. [Google Scholar] [CrossRef]
- Li, J. Flora of China. Harv. Pap. Bot. 2007, 13, 301–302. [Google Scholar] [CrossRef]
- Axsmith, B.J.; Serbet, R.; Krings, M.; Taylor, T.N.; Taylor, E.L.; Mamay, S.H. The enigmatic Paleozoic plants Spermopteris and Phasmatocycas reconsidered. Am. J. Bot. 2003, 90, 1585–1595. [Google Scholar] [CrossRef] [PubMed]
- Hamrick, J.L. Factors influencing levels of genetic diversity in woody plant species. In Population Genetics of Forest Trees; Springer Netherlands: Dordrecht, The Netherlands, 1992. [Google Scholar] [CrossRef]
- Arenas, M.; Ray, N.; Currat, M.; Excoffier, L. Consequences of range contractions and range shifts on molecular diversity. Mol. Biol. Evol. 2012, 29, 207–218. [Google Scholar] [CrossRef] [PubMed]
- Barrett, S.C.; Harder, L.D. The ecology of mating and its evolutionary consequences in seed plants. Annu. Rev. Ecol. Evol. Syst. 2017, 48, 135–157. [Google Scholar] [CrossRef]
- Vekemans, X.; Hardy, O.J. New insights from fine-scale spatial genetic structure analyses in plant populations. Mol. Ecol. 2004, 13, 921–935. [Google Scholar] [CrossRef]
- Kramer, A.T.; Fant, J.B.; Ashley, M.V. Influences of landscape and pollinators on population genetic structure: Examples from three Penstemon (Plantaginaceae) species in the Great Basin. Am. J. Bot. 2011, 98, 109–121. [Google Scholar] [CrossRef]
- Slarkin, M. Gene flow in natural populations. Annu. Rev. Ecol. Syst. Biodivers. 1985, 16, 393–430. [Google Scholar] [CrossRef]
- Zhou, T.H.; Qian, Z.Q.; Li, S.; Guo, Z.G.; Huang, Z.H.; Liu, Z.L.; Zhao, G.F. Genetic diversity of the endangered Chinese endemic herb Saruma henryi Oliv.(Aristolochiaceae) and its implications for conservation. Popul. Ecol. 2010, 52, 223–231. [Google Scholar] [CrossRef]
- Gong, Y.-Q.; Gong, X. Pollen-mediated gene flow promotes low nuclear genetic differentiation among populations of Cycas debaoensis (Cycadaceae). Tree Genet. Genomes 2016, 12, 93. [Google Scholar] [CrossRef]
- Wang, Y.; Li, N.; Chen, T.; Deng, H. Screening of microsatellite loci by cross-species amplification and their use in Cycas fairylakea (Cycadaceae). Guihaia 2014, 34, 608–613, (In Chinese with English Abstract). [Google Scholar]
- Nei, M.; Maruyama, T.; Chakraborty, R. The bottleneck effect and genetic variability in populations. Evolution 1975, 29, 1–10. [Google Scholar] [CrossRef] [PubMed]
- Pimm, S.L.; Gittleman, J.L.; McCracken, G.F.; Gilpin, M. Plausible alternatives to bottlenecks to explain reduced genetic diversity. Trends Ecol. Evol. 1989, 4, 176–178. [Google Scholar] [CrossRef] [PubMed]
- Montgomery, M.E.; Woodworth, L.M.; Nurthen, R.K.; Gilligan, D.M.; Briscoe, D.A.; Frankham, R. Relationships between population size and loss of genetic diversity: Comparisons of experimental results with theoretical predictions. Conserv. Genet. 2000, 1, 33–43. [Google Scholar] [CrossRef]
- Yao, Z.; Wang, X.; Wang, K.; Yu, W.; Deng, P.; Dong, J.; Li, Y.; Cui, K.; Liu, Y. Chloroplast and Nuclear Genetic Diversity Explain the Limited Distribution of Endangered and Endemic Thuja sutchuenensis in China. Front. Genet. 2021, 12, 801229. [Google Scholar] [CrossRef] [PubMed]
- Wang, K.; Zhou, X.-H.; Liu, D.; Li, Y.; Yao, Z.; He, W.-M.; Liu, Y. The uplift of the Hengduan Mountains contributed to the speciation of three Rhododendron species. Glob. Ecol. Conserv. 2022, 35, e02085. [Google Scholar] [CrossRef]
- Clegg, M.T.; Kahler, A.L.; Weir, B.S. Plant Population Genetics, Breeding, and Genetic Resources; Sinauer Associates: Sunderland, MA, USA, 1989. [Google Scholar]
- Willi, Y.; Van Buskirk, J.; Hoffmann, A.A. Limits to the adaptive potential of small populations. Annu. Rev. Ecol. Evol. Syst. 2006, 37, 433–458. [Google Scholar] [CrossRef]
- Wang, S.-Q. Genetic diversity and population structure of the endangered species Paeonia decomposita endemic to China and implications for its conservation. BMC Plant Biol. 2020, 20, 510. [Google Scholar] [CrossRef]
- Rodrigues, L.; van den Berg, C.; Póvoa, O.; Monteiro, A. Low genetic diversity and significant structuring in the endangered Mentha cervina populations and its implications for conservation. Biochem. Syst. Ecol. 2013, 50, 51–61. [Google Scholar] [CrossRef]
- Huang, Y.; Zhang, C.Q.; Li, D.Z. Low genetic diversity and high genetic differentiation in the critically endangered Omphalogramma souliei (Primulaceae): Implications for its conservation. J. Syst. Evol. 2009, 47, 103–109. [Google Scholar] [CrossRef]
- Xu, W.-B.; Svenning, J.-C.; Chen, G.-K.; Zhang, M.-G.; Huang, J.-H.; Chen, B.; Ordonez, A.; Ma, K.-P. Human activities have opposing effects on distributions of narrow-ranged and widespread plant species in China. Proc. Natl. Acad. Sci. USA 2019, 116, 26674–26681. [Google Scholar] [CrossRef] [PubMed]
- Jha, S.; Bawa, K.S. Population growth, human development, and deforestation in biodiversity hotspots. Conserv. Biol. 2006, 20, 906–912. [Google Scholar] [CrossRef] [PubMed]
- Peng, J.; Liang, C.; Niu, Y.; Jiang, W.; Wang, W.; Wang, L. Moderate grazing promotes genetic diversity of Stipa species in the Inner Mongolian steppe. Landsc. Ecol. 2015, 30, 1783–1794. [Google Scholar] [CrossRef]
- Jackson, N.D.; Fahrig, L. Relative effects of road mortality and decreased connectivity on population genetic diversity. Biol. Conserv. 2011, 144, 3143–3148. [Google Scholar] [CrossRef]
- Mona, S.; Arenas, M.; Excoffier, L. Genetic consequences of habitat fragmentation during a range expansion. Heredity 2014, 112, 291–299. [Google Scholar] [CrossRef] [PubMed]
- Hewitt, G. The genetic legacy of the Quaternary ice ages. Nature 2000, 405, 907–913. [Google Scholar] [CrossRef]
- Ekblom, R.; Brechlin, B.; Persson, J.; Smeds, L.; Johansson, M.; Magnusson, J.; Flagstad, Ø.; Ellegren, H. Genome sequencing and conservation genomics in the Scandinavian wolverine population. Conserv. Biol. 2018, 32, 1301–1312. [Google Scholar] [CrossRef]
- Selwood, K.E.; McGeoch, M.A.; Mac Nally, R. The effects of climate change and land-use change on demographic rates and population viability. Biol. Rev. Camb. Philos. Soc. 2015, 90, 837–853. [Google Scholar] [CrossRef]
- Jones, D.L. Cycads of the World; Smithsonian: Washington, DC, USA, 1993. [Google Scholar]
- Mustoe, G.E. Coevolution of cycads and dinosaurs. Cycad Newsl. 2007, 30, 6–9. [Google Scholar]
- Wang, X.H.; Li, J.; Zhang, L.M.; He, Z.W.; Mei, Q.M.; Gong, X.; Jian, S.G. Population Differentiation and Demographic History of the Cycas taiwaniana Complex (Cycadaceae) Endemic to South China as Indicated by DNA Sequences and Microsatellite Markers. Front. Genet. 2019, 10, 1238. [Google Scholar] [CrossRef]
- Ulrey, C.; Quintana-Ascencio, P.F.; Kauffman, G.; Smith, A.B.; Menges, E.S. Life at the top: Long-term demography, microclimatic refugia, and responses to climate change for a high-elevation southern Appalachian endemic plant. Biol. Conserv. 2016, 200, 80–92. [Google Scholar] [CrossRef]
- Qiu, Y.X.; Fu, C.X.; Comes, H.P. Plant molecular phylogeography in China and adjacent regions: Tracing the genetic imprints of Quaternary climate and environmental change in the world’s most diverse temperate flora. Mol. Phylogenet. Evol. 2011, 59, 225–244. [Google Scholar] [CrossRef] [PubMed]
- Griffith, M.P.; Calonje, M.; Meerow, A.W.; Tut, F.; Kramer, A.T.; Hird, A.; Magellan, T.M.; Husby, C.E. Can a botanic garden cycad collection capture the genetic diversity in a wild population? Int. J. Plant Sci. 2015, 176, 1–10. [Google Scholar] [CrossRef]
- Griffith, M.P.; Calonje, M.; Meerow, A.W.; Francisco-Ortega, J.; Knowles, L.; Aguilar, R.; Tut, F.; Sánchez, V.; Meyer, A.; Noblick, L.R. Will the same ex situ protocols give similar results for closely related species? Biodivers. Conserv. 2017, 26, 2951–2966. [Google Scholar] [CrossRef]
- Hoban, S.; Callicrate, T.; Clark, J.; Deans, S.; Dosmann, M.; Fant, J.; Gailing, O.; Havens, K.; Hipp, A.L.; Kadav, P. Taxonomic similarity does not predict necessary sample size for ex situ conservation: A comparison among five genera. Proc. R. Soc. B 2020, 287, 20200102. [Google Scholar] [CrossRef]
- Broeck, A.V.; Villar, M.; Van Bockstaele, E.; VanSlycken, J. Natural hybridization between cultivated poplars and their wild relatives: Evidence and consequences for native poplar populations. Ann. For. Sci. 2005, 62, 601–613. [Google Scholar] [CrossRef]
- Cohen, J.I.; Williams, J.T.; Plucknett, D.L.; Shands, H. Ex situ conservation of plant genetic resources: Global development and environmental concerns. Science 1991, 253, 866–872. [Google Scholar] [CrossRef]
- Miller, A.J.; Schaal, B.A. Domestication and the distribution of genetic variation in wild and cultivated populations of the Mesoamerican fruit tree Spondias purpurea L.(Anacardiaceae). Mol. Ecol. 2006, 15, 1467–1480. [Google Scholar] [CrossRef]
- Weiguo, Z.; Zhihua, Z.; Xuexia, M.; Yong, Z.; Sibao, W.; Jianhua, H.; Hui, X.; Yile, P.; Yongping, H. A comparison of genetic variation among wild and cultivated Morus species (Moraceae: Morus) as revealed by ISSR and SSR markers. Biodivers. Conserv. 2007, 16, 275–290. [Google Scholar] [CrossRef]
- Feng, S.; Yang, T.; Liu, Z.; Chen, L.; Hou, N.; Wang, Y.; Wei, A. Genetic diversity and relationships of wild and cultivated Zanthoxylum germplasms based on sequence-related amplified polymorphism (SRAP) markers. Genet. Resour. Crop Evol. 2015, 62, 1193–1204. [Google Scholar] [CrossRef]
- Tang, R.; Li, Y.; Xu, Y.; Schinnerl, J.; Sun, W.; Chen, G. In-situ and ex situ pollination biology of the four threatened plant species and the significance for conservation. Biodivers. Conserv. 2020, 29, 381–391. [Google Scholar] [CrossRef]
- Hirao, A.; Kameyama, Y.; Ohara, M.; Isagi, Y.; Kudo, G. Seasonal changes in pollinator activity influence pollen dispersal and seed production of the alpine shrub Rhododendron aureum (Ericaceae). Mol. Ecol. 2006, 15, 1165–1173. [Google Scholar] [CrossRef] [PubMed]
- Xu, G.; Tang, W.; Skelley, P.; Liu, N.; Rich, S. Cycadophila, a new genus (Coleoptera: Erotylidae: Pharaxonothinae) inhabiting Cycas debaoensis (Cycadaceae) in Asia. Zootaxa 2015, 3986, 251–278. [Google Scholar] [CrossRef] [PubMed]
- Clugston, J.A.; Ruhsam, M.; Kenicer, G.J.; Henwood, M.; Milne, R.; Nagalingum, N.S. Conservation genomics of an Australian cycad Cycas calcicola, and the Absence of Key Genotypes in Botanic Gardens. Conserv. Genet. 2022, 23, 449–465. [Google Scholar] [CrossRef]
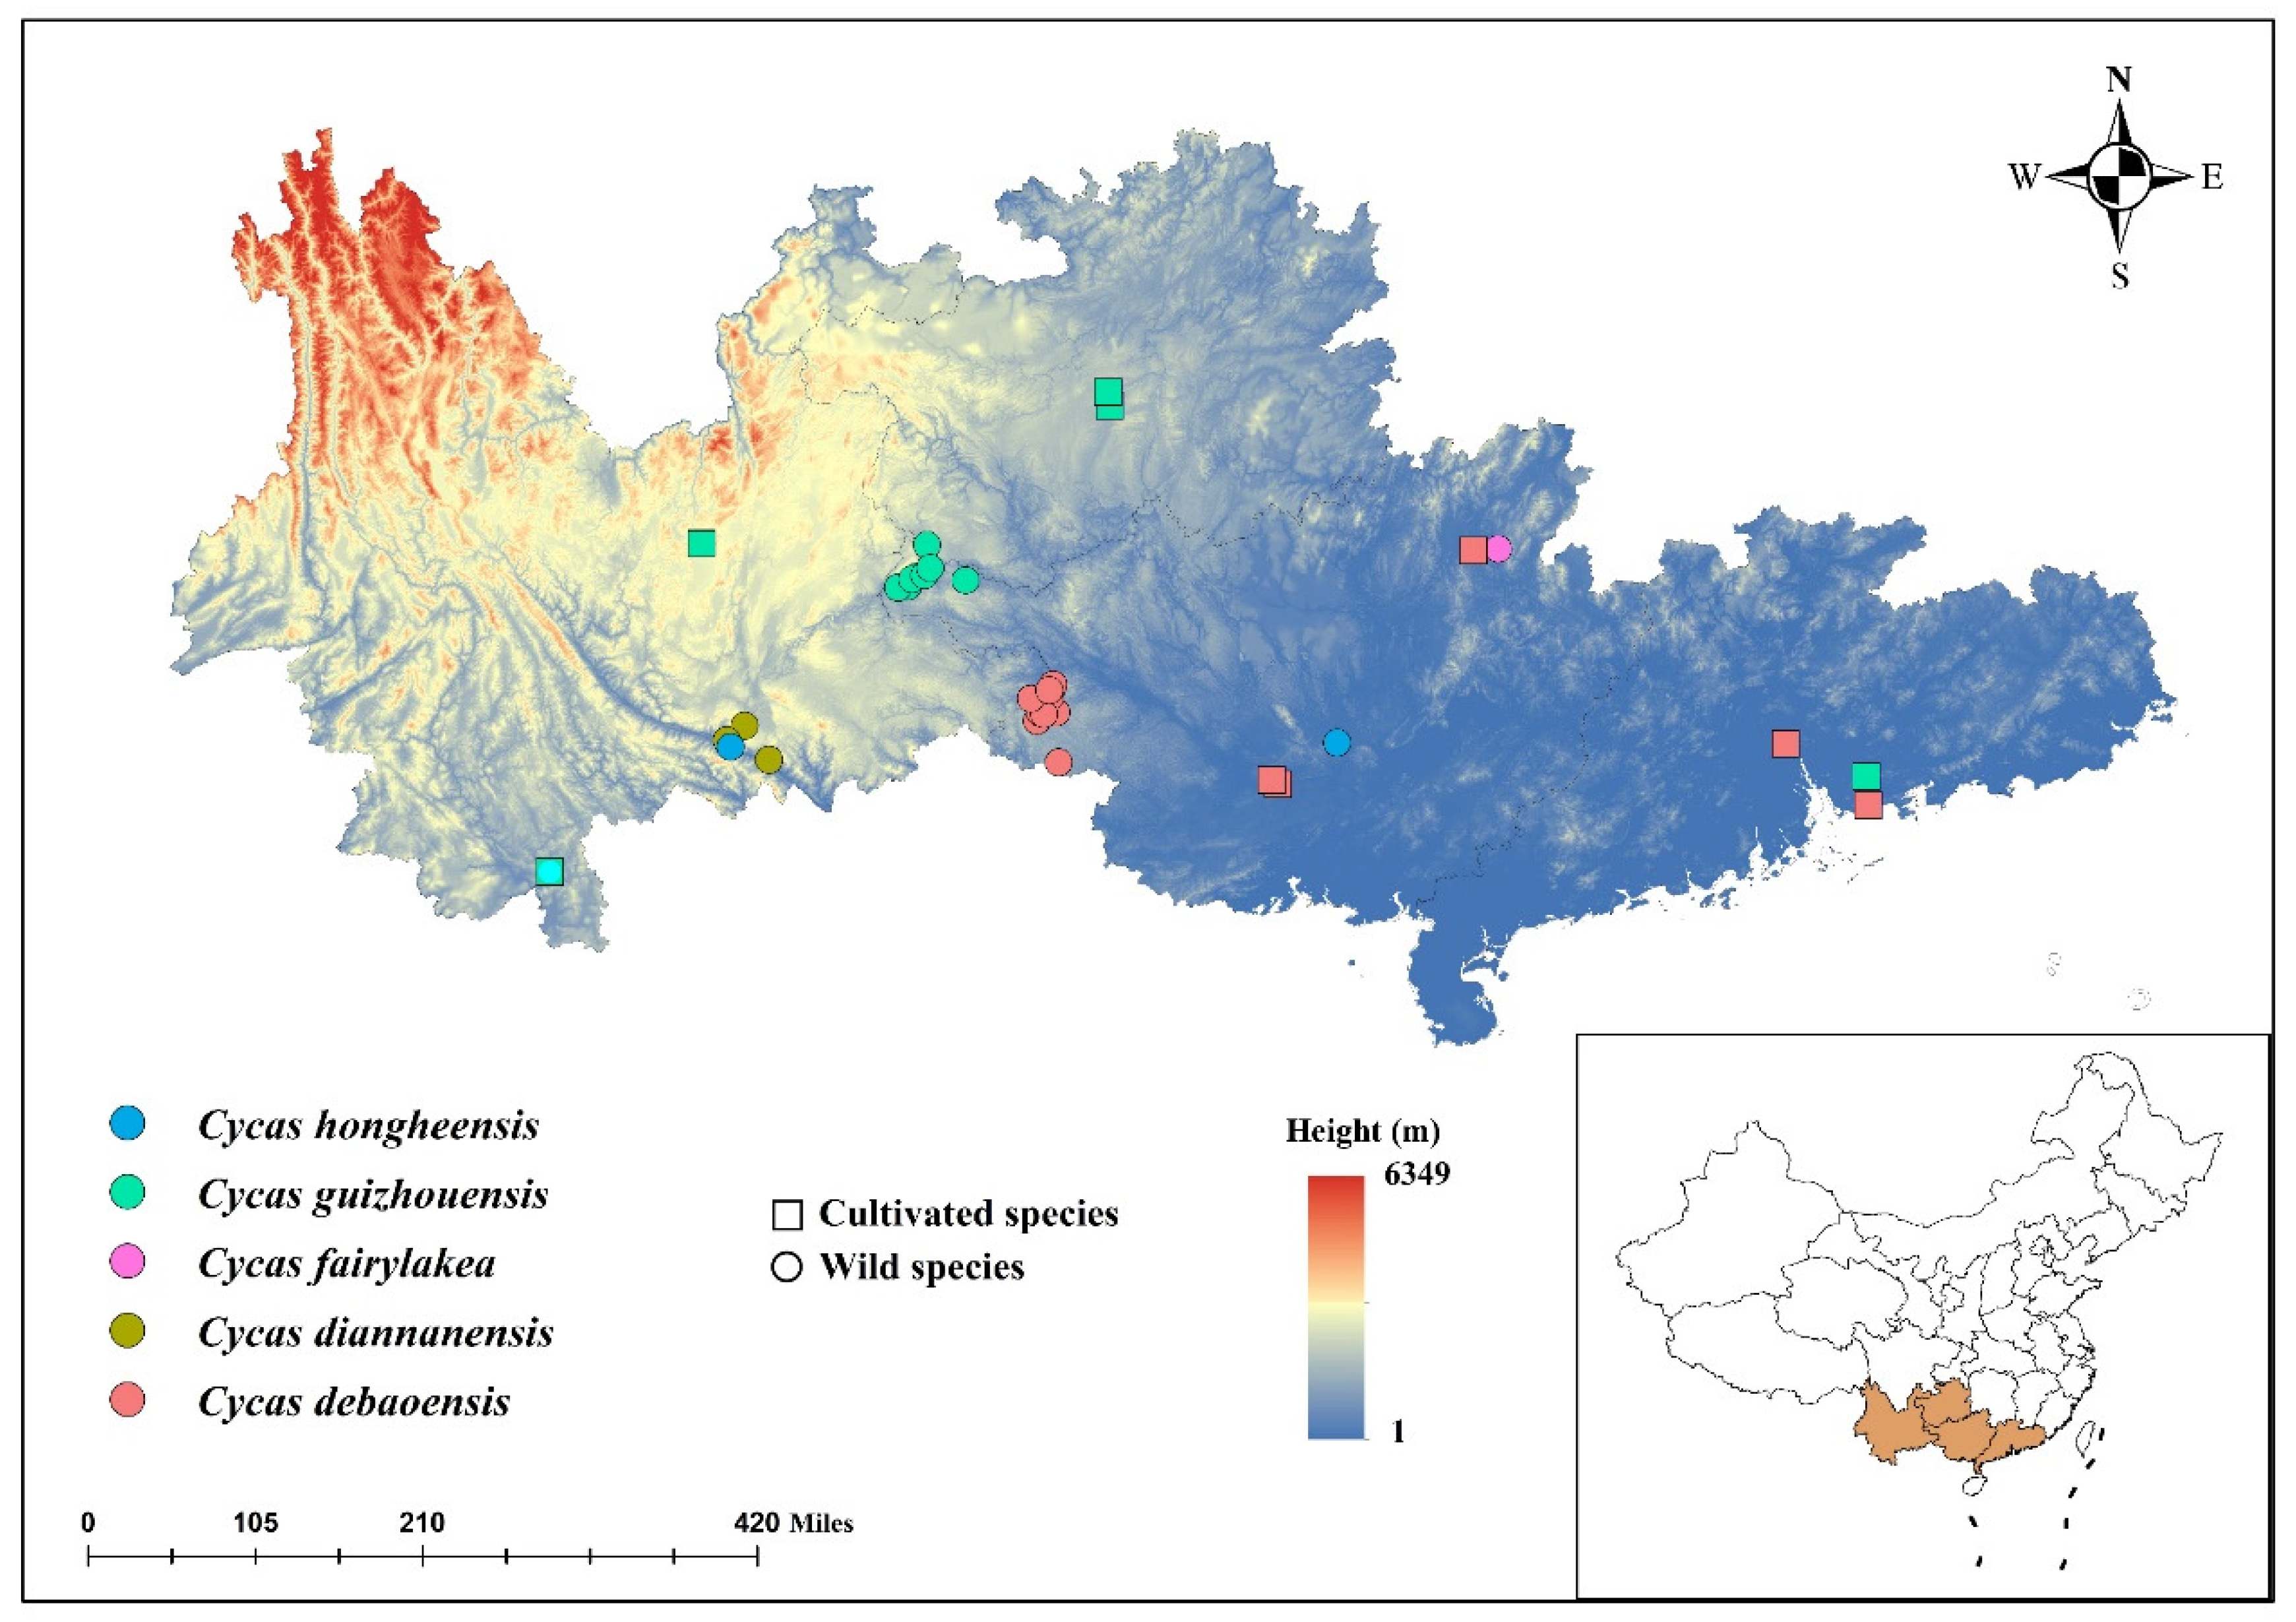
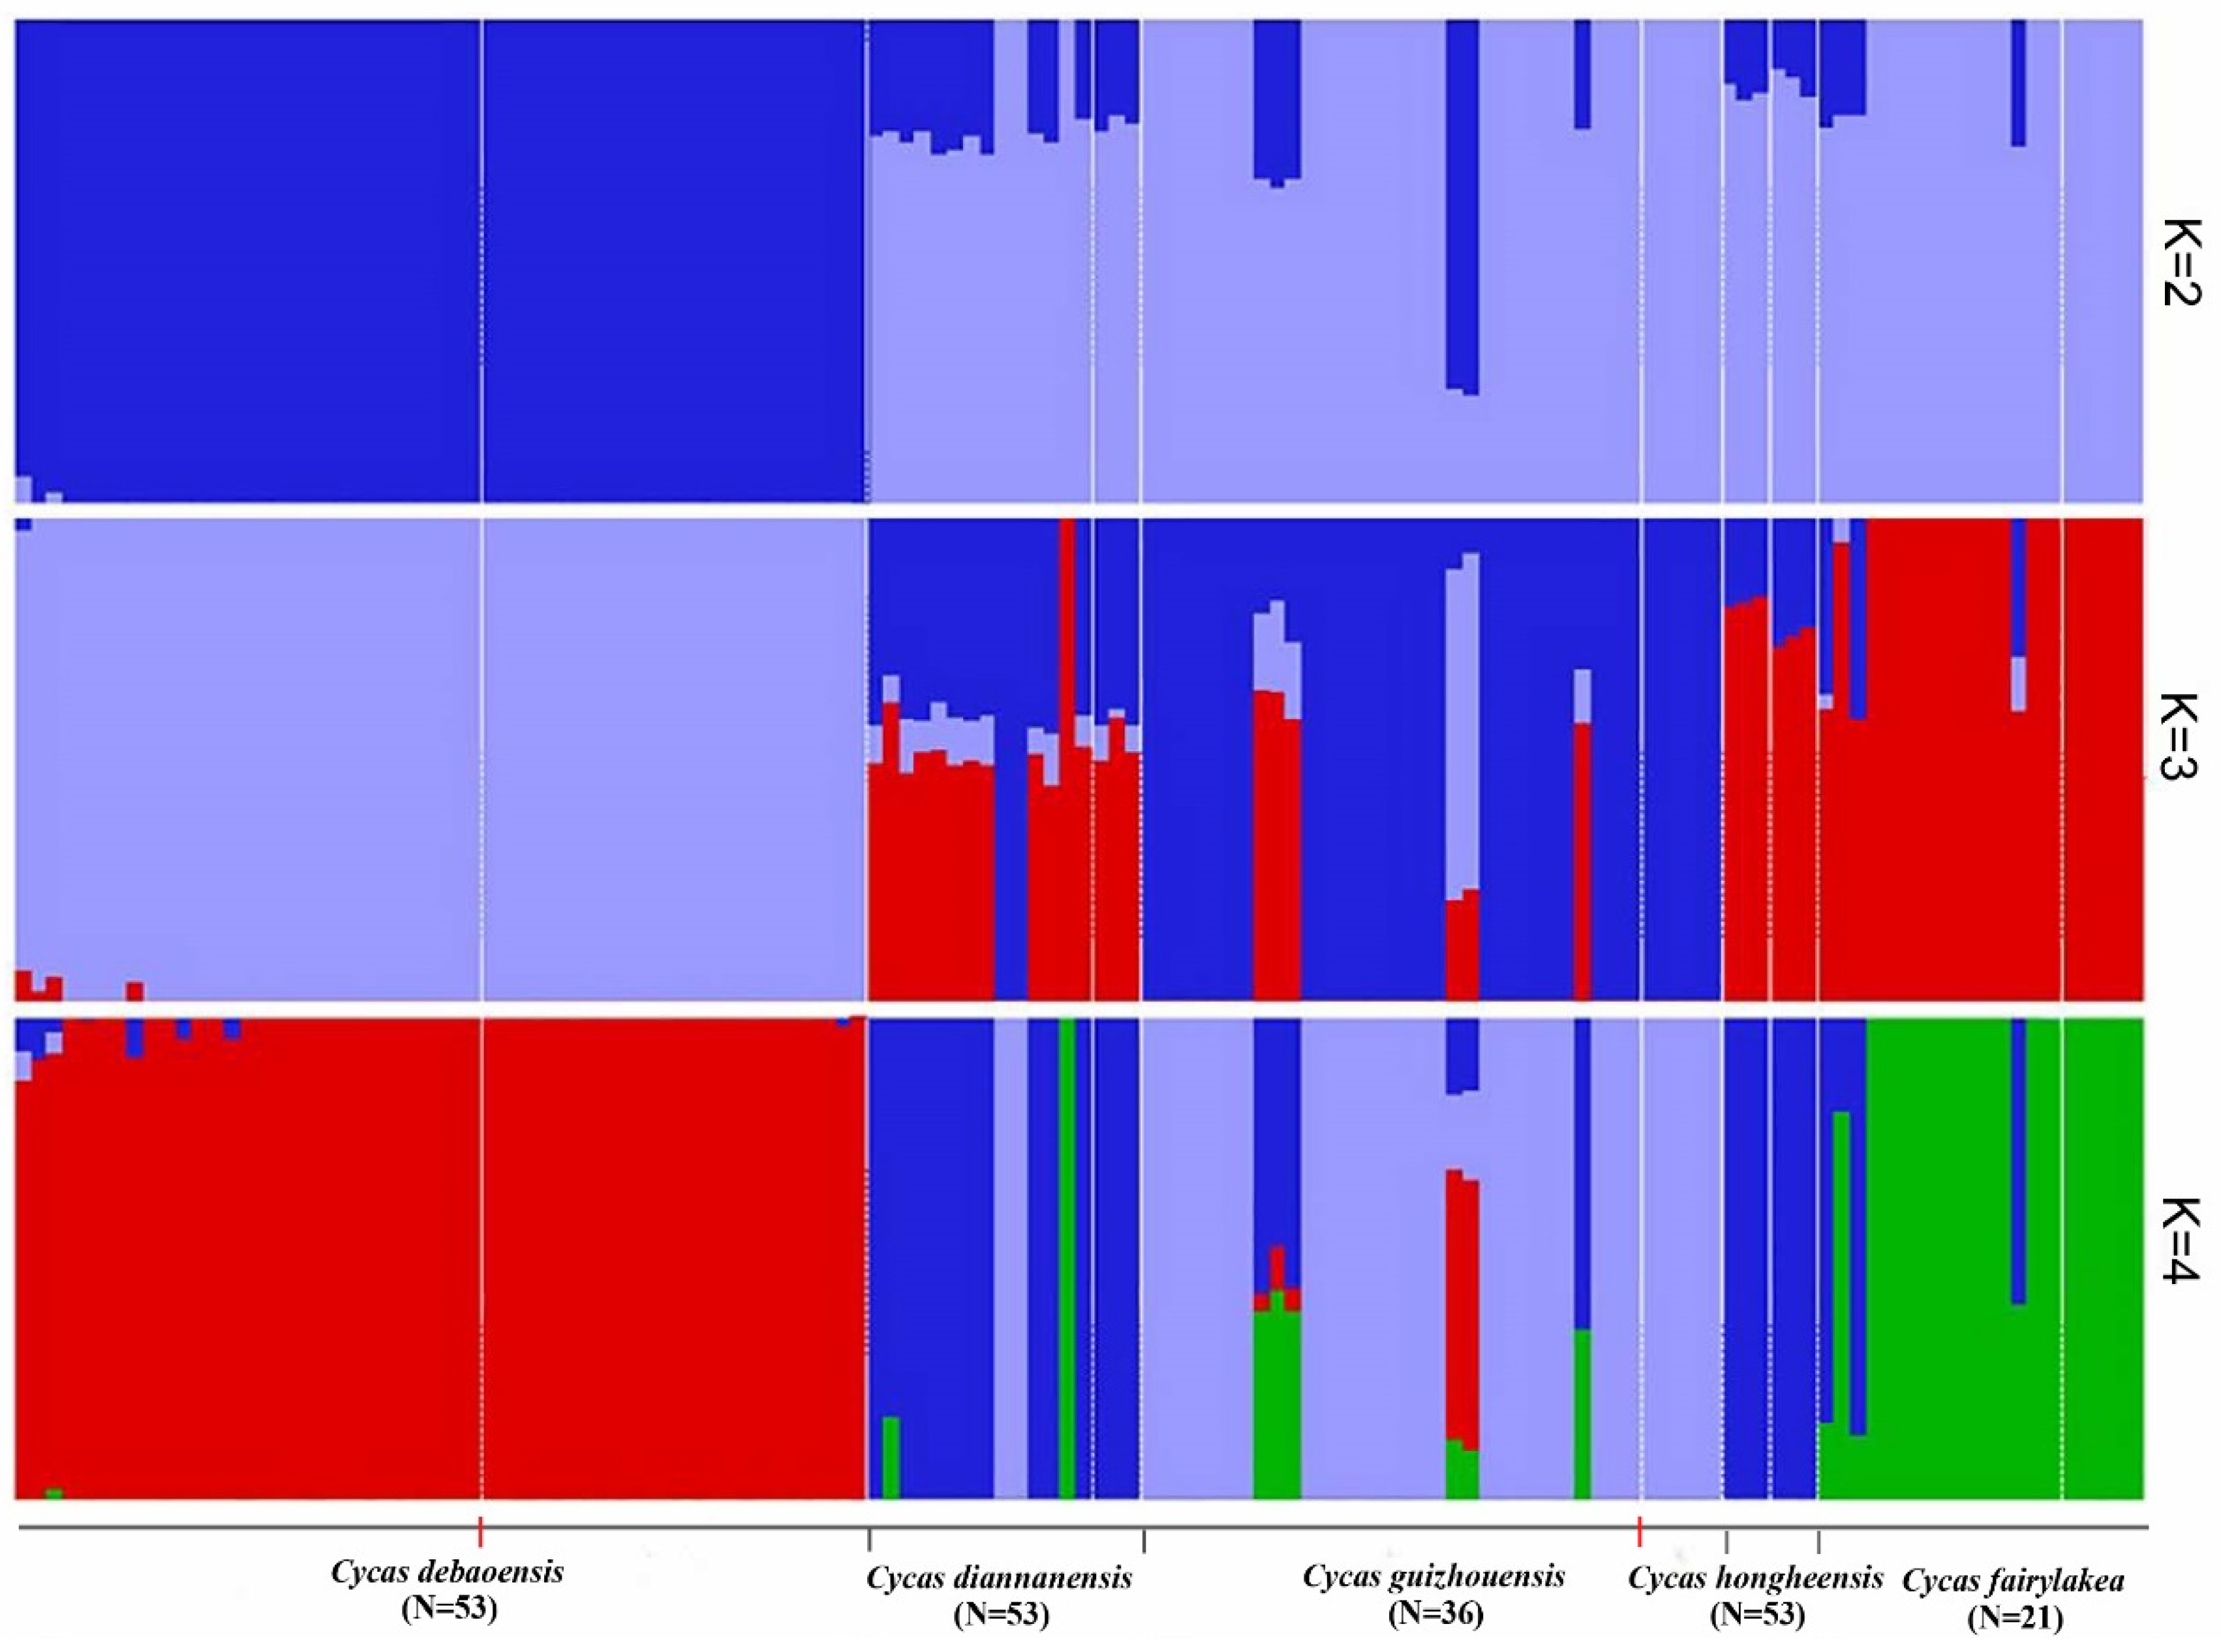

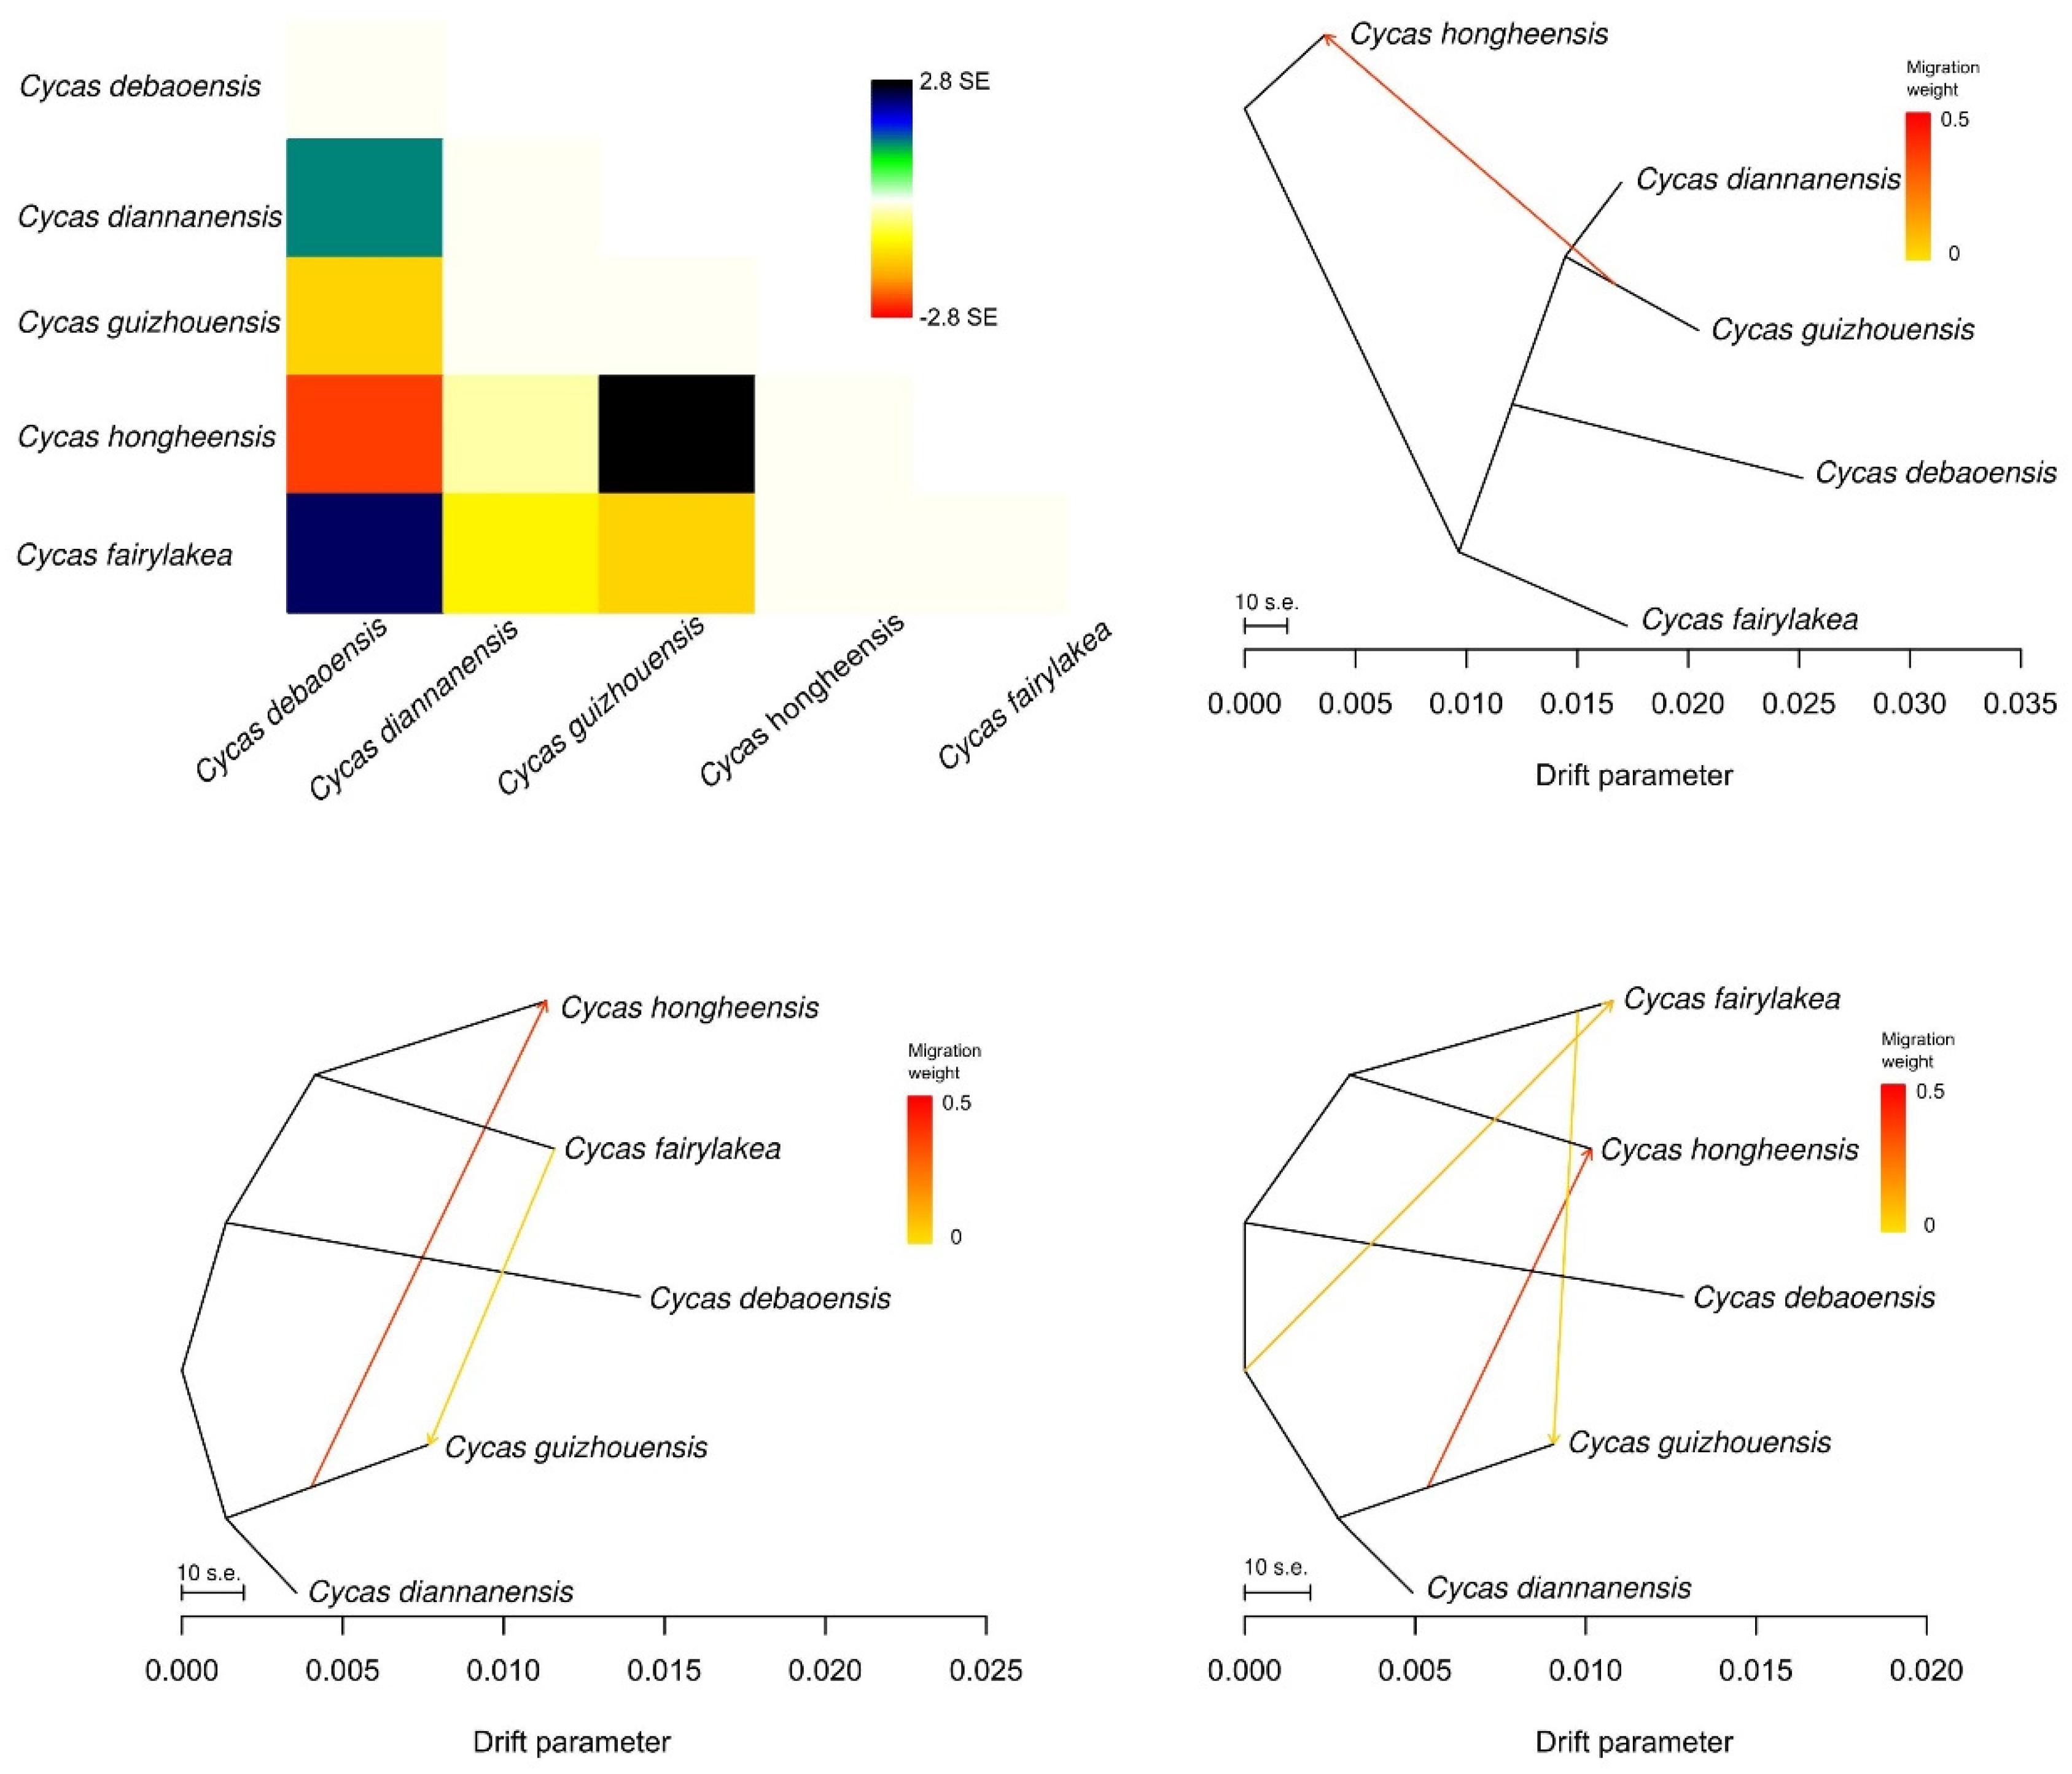
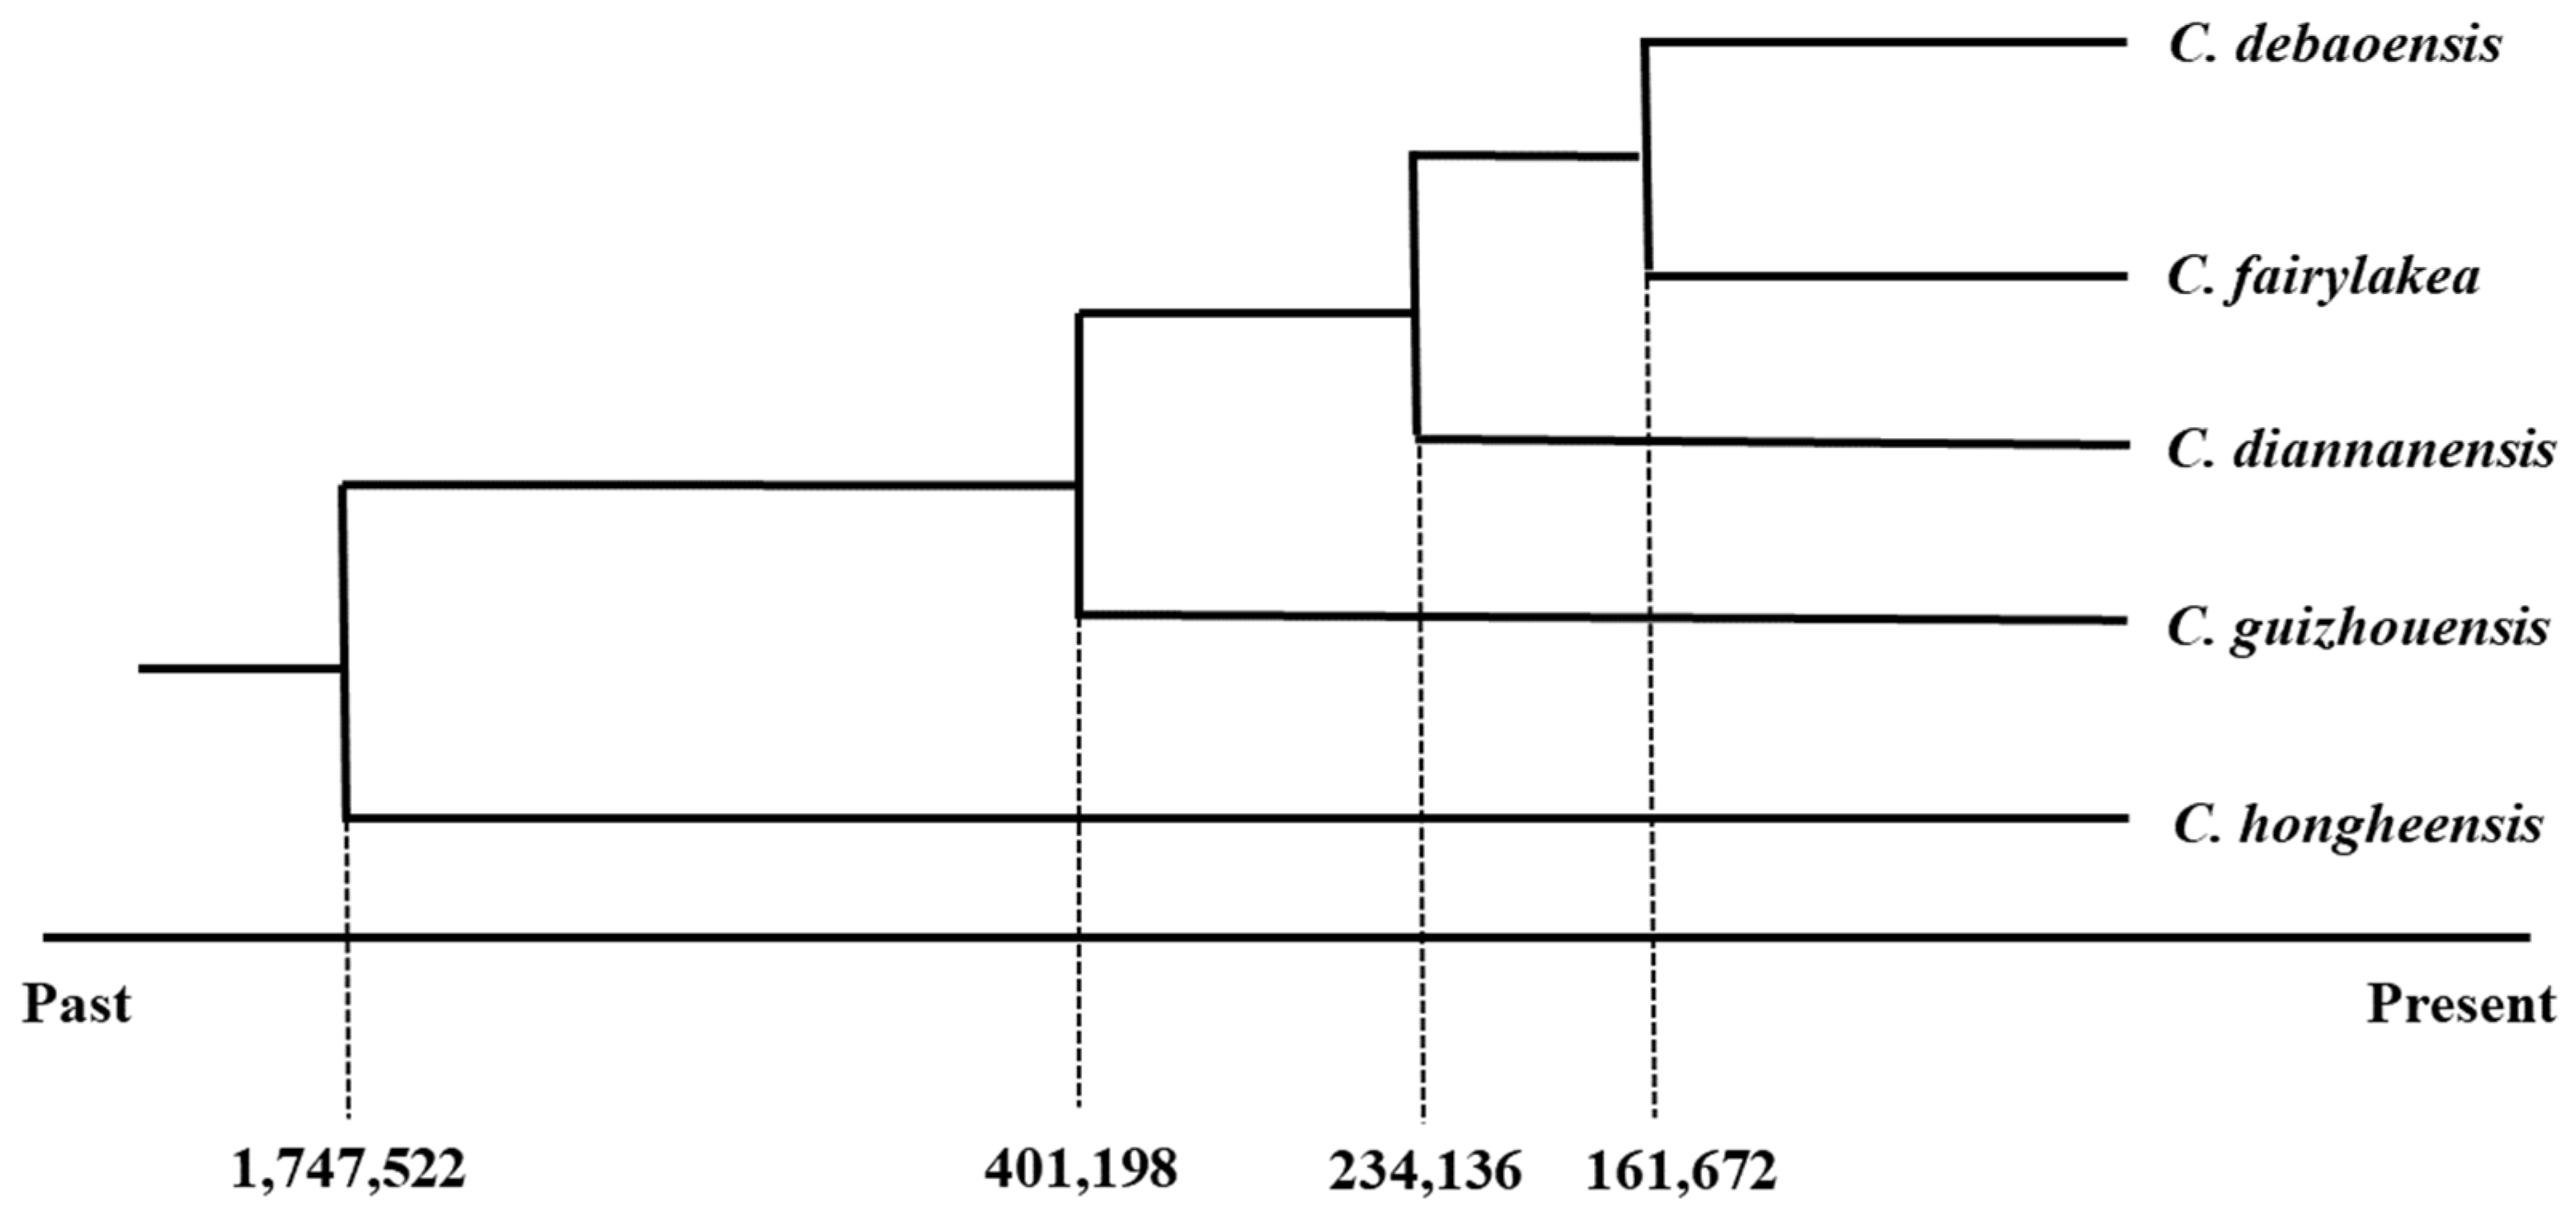
| Species | N | Populations | Variant Sites | Private | Poly sites | Poly (%) | p | Ho | He | π |
|---|---|---|---|---|---|---|---|---|---|---|
| C. debaoensis | 53 | CS 29 | 1121 | 21 | 1011 | 90.187 | 0.877 | 0.242 | 0.201 | 0.200 |
| WS 24 | 0.268 | 0.220 | 0.198 | |||||||
| C. diannanensis | 17 | 1121 | 1 | 862 | 76.896 | 0.894 | 0.203 | 0.184 | 0.234 | |
| C. fairylakea | 21 | 1121 | 9 | 854 | 76.182 | 0.899 | 0.190 | 0.171 | 0.222 | |
| C. guizhouensis | 36 | CS 31 | 1121 | 10 | 1026 | 91.525 | 0.890 | 0.186 | 0.166 | 0.200 |
| WS 5 | 0.400 | 0.336 | 0.198 | |||||||
| C. hongheensis | 6 | 1121 | 0 | 311 | 27.743 | 0.928 | 0.428 | 0.360 | 0.447 |
| C. debaoensis | C. diannanensis | C. fairylakea | C. guizhouensis | C. hongheensis | |
|---|---|---|---|---|---|
| C. debaoensis | 1.688 | 20.583 | 41.417 | 0.239 | |
| C. diannanensis | 0.129 | 1.353 | 1.439 | 0.285 | |
| C. fairylakea | 0.012 | 0.156 | 49.750 | 0.173 | |
| C. guizhouensis | 0.006 | 0.148 | 0.005 | 0.188 | |
| C. hongheensis | 0.511 | 0.467 | 0.591 | 0.571 |
| Source of Variation | df | SS | σ | % |
|---|---|---|---|---|
| Among species | 4 | 9.489 | 0.052 | 18.66 |
| Among individuals within species | 112 | 24.383 | −0.009 | −3.12 |
| Within species | 117 | 27.5 | 0.235 | 84.45 |
| Total | 223 | 61.372 | 0.278 |
Disclaimer/Publisher’s Note: The statements, opinions and data contained in all publications are solely those of the individual author(s) and contributor(s) and not of MDPI and/or the editor(s). MDPI and/or the editor(s) disclaim responsibility for any injury to people or property resulting from any ideas, methods, instructions or products referred to in the content. |
© 2023 by the authors. Licensee MDPI, Basel, Switzerland. This article is an open access article distributed under the terms and conditions of the Creative Commons Attribution (CC BY) license (https://creativecommons.org/licenses/by/4.0/).
Share and Cite
He, Z.; Yao, Z.; Wang, K.; Li, Y.; Liu, Y. Genetic Structure and Differentiation of Endangered Cycas Species Indicate a Southward Migration Associated with Historical Cooling Events. Diversity 2023, 15, 643. https://doi.org/10.3390/d15050643
He Z, Yao Z, Wang K, Li Y, Liu Y. Genetic Structure and Differentiation of Endangered Cycas Species Indicate a Southward Migration Associated with Historical Cooling Events. Diversity. 2023; 15(5):643. https://doi.org/10.3390/d15050643
Chicago/Turabian StyleHe, Zhi, Zhi Yao, Kailai Wang, Youzhi Li, and Yongbo Liu. 2023. "Genetic Structure and Differentiation of Endangered Cycas Species Indicate a Southward Migration Associated with Historical Cooling Events" Diversity 15, no. 5: 643. https://doi.org/10.3390/d15050643
APA StyleHe, Z., Yao, Z., Wang, K., Li, Y., & Liu, Y. (2023). Genetic Structure and Differentiation of Endangered Cycas Species Indicate a Southward Migration Associated with Historical Cooling Events. Diversity, 15(5), 643. https://doi.org/10.3390/d15050643


