Article

Assessing the Relative Vulnerability of Chondrichthyan Species as Bycatch Using Spatially Reported Catch Data Series

1
Instituto de Computação, Federal University of Alagoas, Cidade Universitária, Maceió 57072-970, Alagoas, Brazil
2
School of Life and Environmental Sciences, University of Sydney, Edgeworth David Building (A11), Sydney, NSW 2006, Australia
*
Author to whom correspondence should be addressed.
Diversity 2023, 15(6), 752; https://doi.org/10.3390/d15060752
Submission received: 31 March 2023 / Revised: 1 June 2023 / Accepted: 5 June 2023 / Published: 8 June 2023

Abstract

:
Fishery impacts pose threats not only to target species, but also to bycatch species. Nevertheless, choosing priorities for conservation or research in fisheries is often driven by economic value and most retained bycatch species such as sharks and rays have been historically of low profit. Traditional stock assessments usually require large quantities of data, financial support, and feasible study conditions. The multi-species nature of Chondrichthyan catch along with their relatively lower value and sparsity of fishery-independent data creates significant challenges to developing accurate impact predictions. This study introduces a novel technique to quantify the relative vulnerability of Chondrichthyan species taken as bycatch. The approach is based on spatial interactions between species and fishing activity (termed here the fishery interaction index, or FII) and is correlated to metrics of productivity. A database of 15 years of fisheries logbooks was used to apply the method to 20 bycatch sharks and target species in one of the largest fishing sectors of Australia’s EEZ. Overall vulnerability based on the FII-productivity combinations obtained was found to agree considerably with the IUCN status of the assessed species, with only a few exceptions that reflected the local status differing from the general global assessments.

1. Introduction

Chondrichthyans face a multitude of threats in marine ecosystems, including unsustainable fishing practices that have been a cause of major conservation concerns since the early 1990s during the international rise of fin markets in Southeast Asia [1]. Currently, the International Union for the Conservation of Nature—IUCN recognizes overfishing as one of the most significant threats to Chondrichthyans globally [2]. The group is known to be commonly vulnerable to over-exploitation due to their k-selected life history [3,4,5], which is related to low intrinsic rates of population growth and recruitment [6].
While sharks and their relatives are not typically the primary targets of most fisheries, their populations are nonetheless threatened by the impacts of fishing activity on both the intended catch and bycatch species [5,7,8]. This issue is intensified by the fact that the priorities of fisheries research are often heavily influenced by the market value of the species, historically leading to sharks and rays being considered low value. The few exceptions to this trend typically involve high-value products such as shark fins, or secondary products such as cartilage and jaws that remain largely unregulated. As a result, the conservation of the group globally has become increasingly pressing [9].
In recent years, conservation efforts have been focused on biodiversity hotspots, and for Chondrichthyans, the Indo-West Pacific region represents a particularly important area of interest, with the highest diversity of species observed [10,11]. Australia, in particular, stands out, boasting an exceptionally rich (approximately 320 species) and highly endemic (46%) population of Chondrichthyans in the region. This underscores the critical importance of protecting these creatures and their habitats in this area [11]. Within Australia, fishery authorities report that only a few species of sharks are intentionally targeted but only in specific fisheries and under strict conditions [12]. Data from the International Union for Conservation of Nature (IUCN) [2] indicates that bycatch poses a significant threat to nearly 70% of the more than 320 species of sharks found in the region [2]. Additionally, less than 50% of Australian Chondrichthyans are classified by the IUCN as of Least Concern, while the remaining species are classified as Near Threatened (NT; approximately 10%), in one of the threatened categories (approximately 18%), or have not been properly assessed and are listed as Data Deficient or Not Evaluated (DD and NE; approximately 13%) [2]. Not discounting the robust assessment and management frameworks in place within Australian Fisheries (Sustainable Analysis of Fishing Effects (SAFE) approach) [13], these classifications do highlight the need for ongoing assessment of the conservation status of these species.
Stock assessments, to be performed in a traditional way, require large quantities of good quality data, financial support, and foremost, to be feasible. The application of traditional stock assessments to Chondrichthyans is challenging for a number of reasons: (1) when reported, catches are often merged in multi-species groups, (2) sharks and related fisheries are recognized as being of low value, and therefore the cost-benefit is not attractive to funding, and (3) sample availability is subject to catch by research or fishing boats with observers, and many times catch of individual species are too infrequent to be of use for assessments.
Regrettably, when it comes to assessing the vulnerability of Chondrichthyan populations, data-poor cases appear to be the norm, creating numerous issues [1,10,14]. This includes underestimating the impacts of the Chondrichthyan bycatch, which can lead to significant delays in necessary and pivotal management actions. As a result, there has been a growing adoption of ecological risk assessment (ERA) methods as a means of addressing these challenges and increasing awareness of the ecological risks posed by fishing and other human activities. This approach has improving in recent years, with a range of studies exploring its potential applications in the field of shark conservation generally [14,15,16,17,18] and to specific fisheries within the Australian context e.g., [19,20,21].
An increasingly used approach within the ERA framework for assessing fishery bycatch vulnerability is Productivity-Susceptibility Analysis (PSA) [15,22]. PSA essentially ranks the relative vulnerability of a fishery by weighing attributes of its potential productivity (as estimated by a variety of life history characteristics) against its vulnerability to fishing (based principally on the spatial overlap between a stock and its fishery). The input attributes are assigned categorical qualitative values on the same scale and then combined as either standard or geometric averages depending on the approach [22]. PSA has been applied to both bycaught and targeted stocks (see [22] for a review) and the scope of life history characteristics considered to estimate productivity expanded [23,24]. While the approach has generally proved useful, it has also been suggested that while it works well for stocks at the extreme ends of the vulnerability spectrum, for those in the middle, which is most of them, relative rankings are much less accurate, probably due to the subjective and simplified categorical nature of the ranking schemes used [22]. It was also suggested that the technique may consider too many attributes as the overall accuracy of vulnerability predictions was inversely related to the number of attributes considered [22].
In this study we present an approach based on the PSA model but where we consider only a few fully quantitative attributes for both productivity and susceptibility. We use this technique to quantify the relative vulnerability of Chondrichthyan species taken as bycatch in fisheries with the objective of prioritizing species for management. Our method is based on only one metric of susceptibility, which estimates the intensity of interaction between the geographic distribution of a species and spatial patterns of its harvest, here termed the Fisheries Interaction Index (FII). Vulnerability was established by referencing FII individually against three measures of productivity (r, k and age at sexual maturity). This technique was applied to bycatch and target stocks of the Southern and Eastern Scalefish and Shark Fishery (SESSF), one of the largest sectors of Australia’s Exclusive Economic Zone. Through this approach, we aimed to provide an objective process for selecting priority species for conservation by highlighting ecological risks posed by fishing, and to improve future strategies for mitigating those risks and protecting vulnerable shark populations.

2. Materials and Methods

In this study, we developed a novel approach to quantify the relative vulnerability of Chondrichthyan species taken as bycatch in fisheries, with the objective of prioritizing species for management. Our approach involves the creation of a novel metric, named the Fisheries Interaction Index (FII), which quantifies a species’ level of interaction with a fishery and when plotted against metrics of species’ productivity allows one to select rank relative vulnerability. The FII ranking system allows for a more nuanced understanding of vulnerability by considering not only the species’ harvest, but also their spatial distribution and the size of the overall exploited area.
Below we describe in detail how FII was calculated and referenced against productivity attributes for a test case consisting of 15 years of logbook data from the Southern and Eastern Scalefish and Shark Fishery (SESSF) of Australia’s Exclusive Economic Zone.

2.1. The Southern and Eastern Scalefish and Shark Fishery

The Southern and Eastern Scalefish and Shark Fishery (SESSF) is a multi-species fishery covering almost half of the Australian Exclusive Fishing Zone. It extends from the east coast south of south Queensland, around Tasmania, to Cape Leeuwin in Southern Western Australia (Figure 1). This sector employs a variety of fishing gears including seine nets, trawlers (midwater, bottom, and pair), gillnets, longlines, and fishing traps. The SESSF targets several species, including Blue grenadier (Macruronus novaezelandiae, Hector 1871), Tiger flathead (Platycephalus richardsoni Castelnau, 1872), Silver warehou (Seriolella punctata Forster, 1801), Gummy shark (Mustelus antarcticus Günther, 1870) and Pink ling (Genypterus blacodes Forster, 1801). The Australian Fisheries Management Authority (AFMA) regulates the fishery, with detailed conditions attached to fishing permits. The SESSF operates year-round and is one of the most profitable finfish fisheries, with an annual yield of over AU$70 million [25].
Catch data for the SESSF was provided by the Australian Fisheries Management Authority—AFMA which is based on individual trip logbooks. We note that our definition of bycatch in this study includes all non-target catch [26], which comprises AFMA categories of byproduct (sometimes retained) and bycatch (discarded). These records include information on the date, gear, species, retained weight, and location (Degree Minute Second—DMS fishing grid ID), resulting in a total of 3,572,855 records from 2000 to 2014. In order to calculate FII, catch records were aggregated to the same rasterized spatial scale (half-degree cells) as the species occurrence data (described in Section 2.2), it was decided to exclude cases of generic common names containing multiple species (e.g., Skates, Chimaeras, Ghostfishes) and consider only species that could be validated either by relating common and scientific names or through maps of spatial distribution. Applying these conditions, the set of bycaught Chondrichthyans was narrowed to 20 species (19 sharks and one of chimaera). To provide context for the fishery interaction index (a relative ranking), we also included seven different target species in the analysis. In total, the catch of these 27 species over the entire time series reduced the number of records to 1,863,722 records in the database, drawn from 682,891 different fishing events.

2.2. Species Occurrence Database

The AquaMaps database [27] provides global distribution data for a large number of marine species, including the probability of occurrence (ranging from 0 to 1) in half-degree cells (equivalent to approximately 55 km2). The database includes species identification numbers, scientific names, and common English names according to FishBase [28]. Records were extracted from AquaMaps for all Chondrichthyan and Teleostean species reported as targets or bycatch in the AFMA SESSF Database. In some instances (11 species, 42.76% of these species’ grid records), catch data existed for a specific species in a grid cell where the probability of occurrence from AquaMaps was zero. Although these cases generally consisted of only one to three grid cells (55–165 km) outside the occurrence range from AquaMaps, the weighting process would have excluded catch in these cells. This issue was addressed by calculating a probability of occurrence value for the grid cell using Inverse Distance Weighted (IDW) interpolation [29] in the software ArcGIS v10.2 [30]. This method assumes that the weight of mapped variables (i.e., probability of occurrence) decreases as the distance increases from the interpolated points or sampled areas. The default power value was used for positive real numbers in the IDW method. Therefore, we assigned values to “new” distribution records using a linearly weighted combination of the original distribution records. We listed and reported the new records to AquaMaps.

2.3. Fishery Interaction Index

The interaction of a specific species and the fishery was quantified by conducting a spatially explicit intersection of the probability of occurrence of a species with the mean annual harvest for that species to generate what is effectively a weighted estimate of the relative area of harvest. Specifically, for each species i, the average catch in a specific grid cell j (Cij) is weighted by the probability of occurrence of the species in that grid cell (Pij) relative to the grid area of the (Aj). These weighted factors are then summed over all grid cells and the obtained value is divided by the total exploitation area to give FIIi for each species (Equation (1)).
F I I i = j = 1 n ( C i j P i j ) × A j T A i
Catch and distributional data were sourced from the previously described AFMA Fishery and AquaMaps data. The area of individual grid cells was calculated using polynomial geodesic equations which account for variations in the relationship between degrees and geographic distance (km) with changes in latitude and longitude.
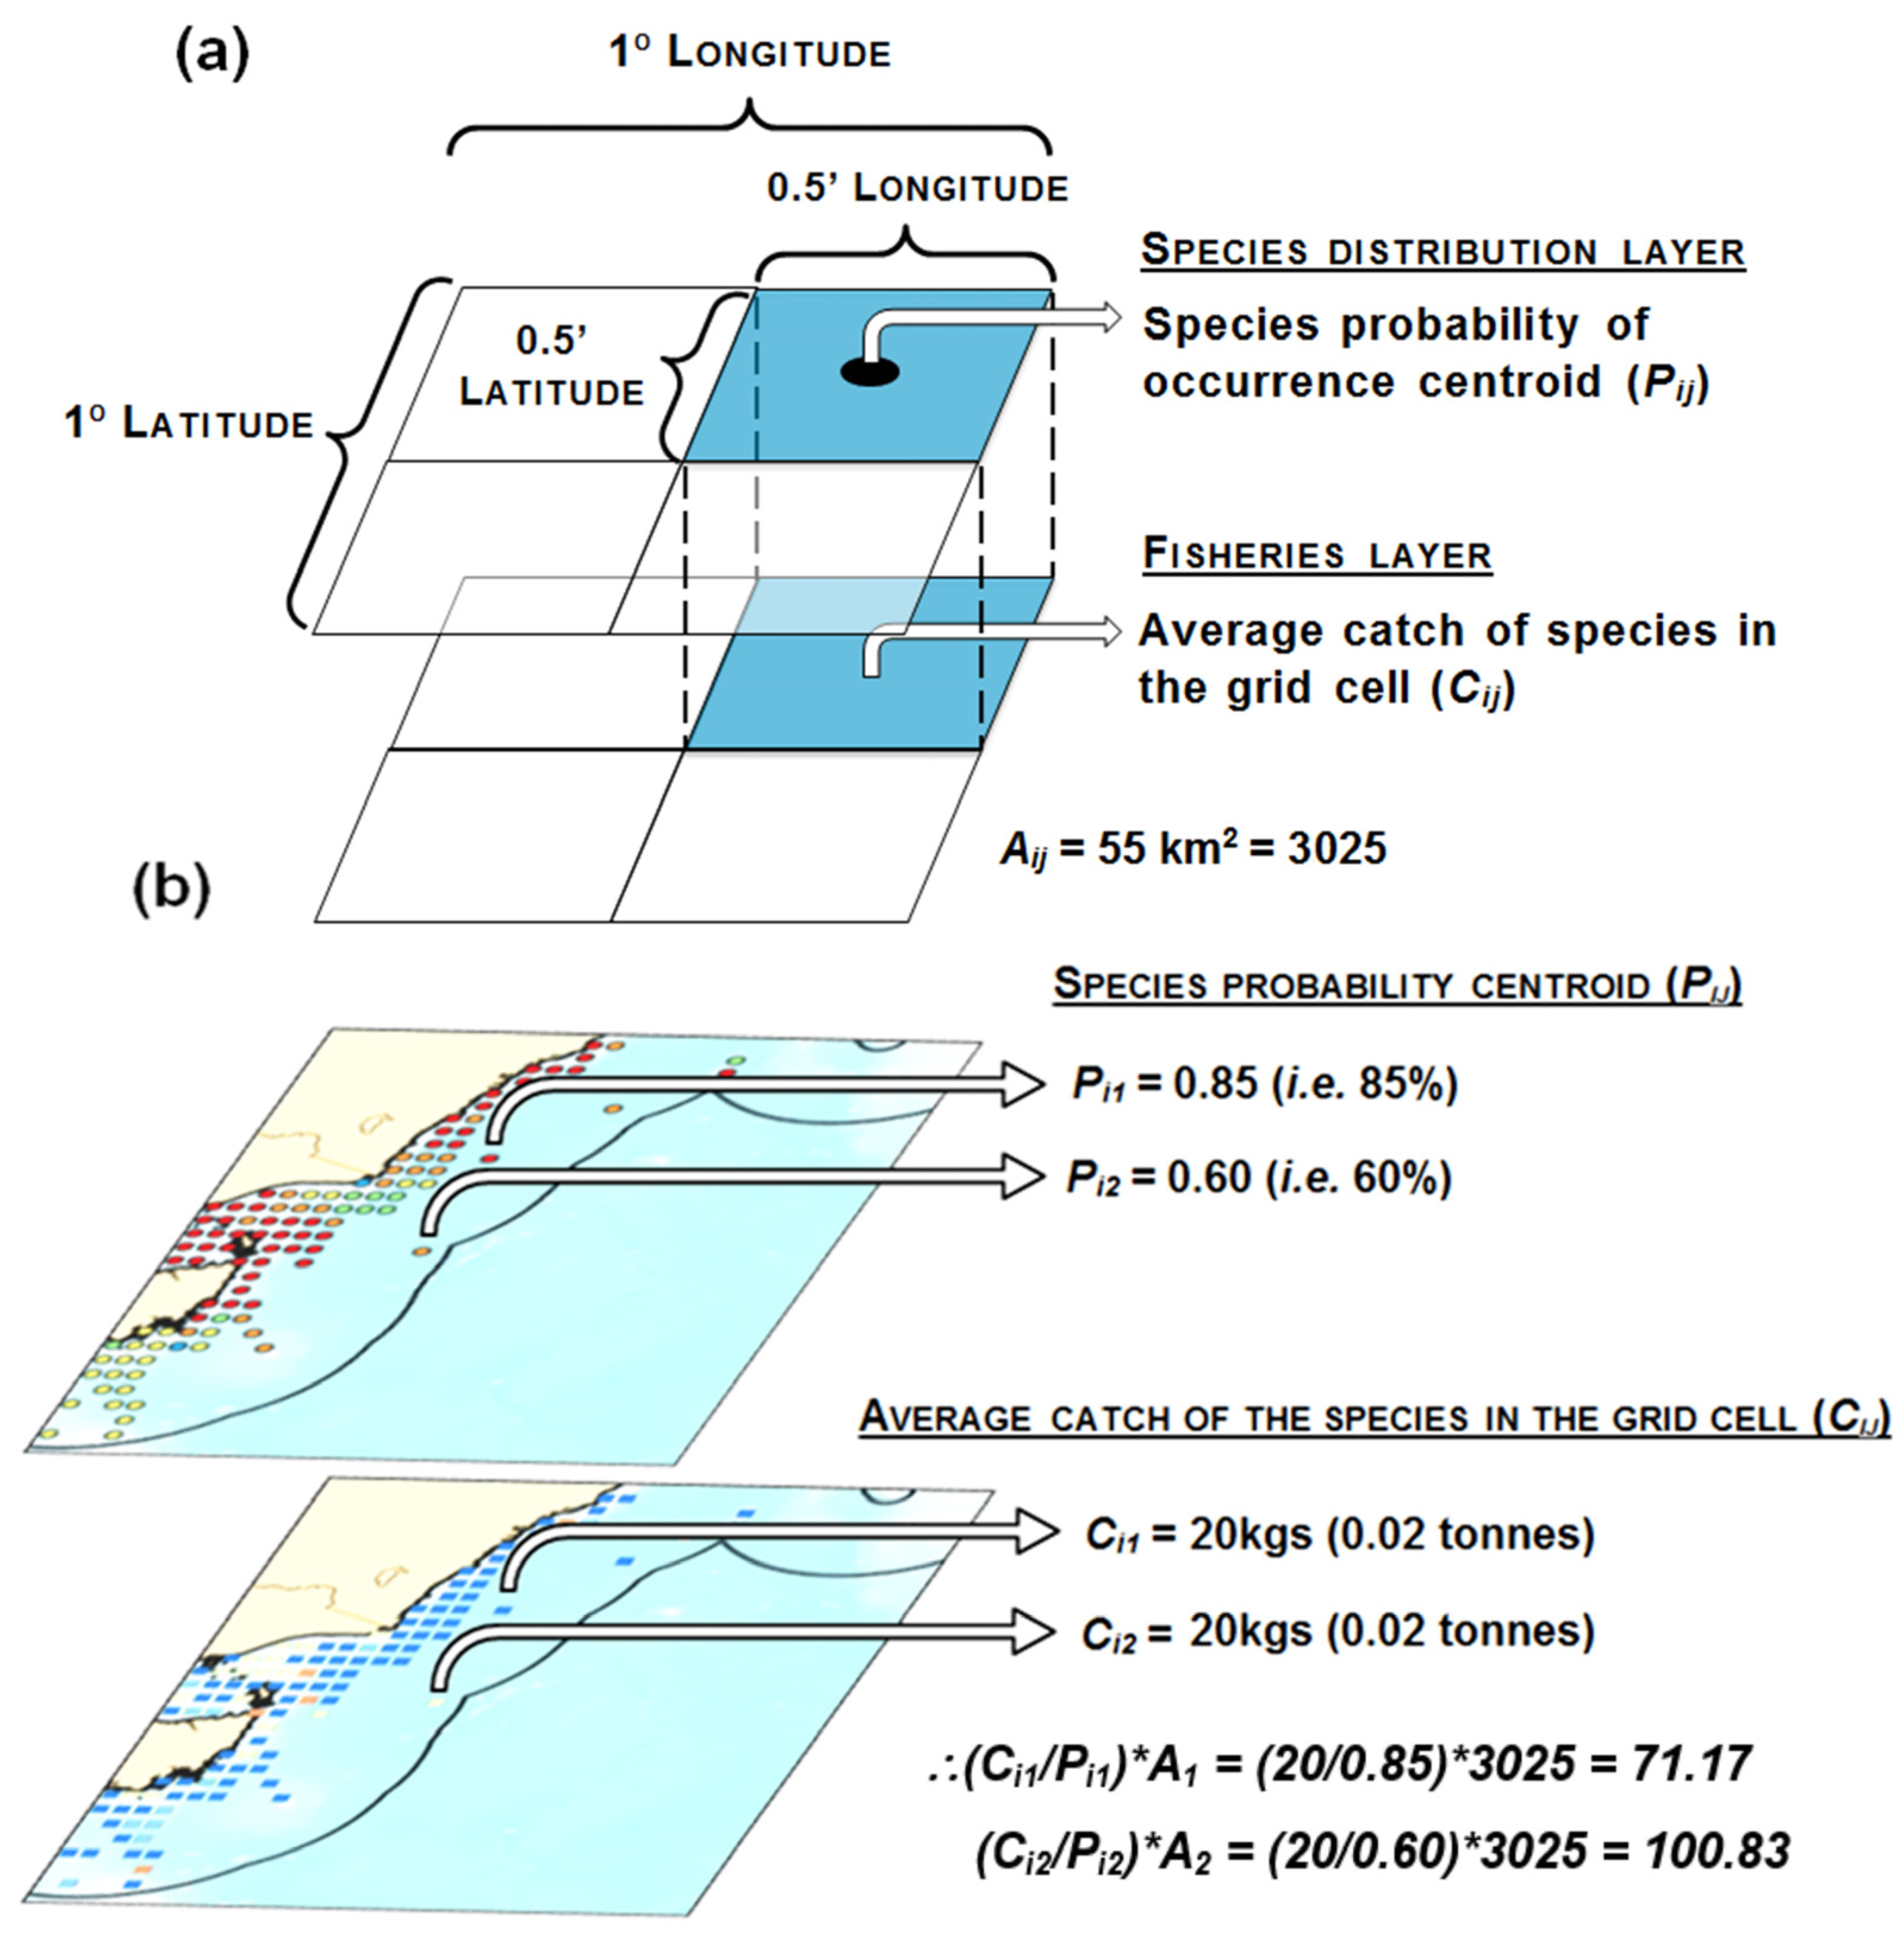
By design, the FII index will deliver higher values for species that are fished more intensively throughout a greater proportion of their range. The use of probability of occurrence ensures that stocks that are fished more heavily where they are rarer will have higher FII values as compared to stocks with similar fishing intensities but where most harvest occurs where the species is most common (Figure 2a,b).

2.4. Species Vulnerability

Categories of resilience are often based upon biological parameters that vary within certain ranges, defining how fast a population can re-establish their numbers back to sustainable levels when exploited. Species resilience can be difficult to directly quantify though it can be approximated by the combination of a variety of biological parameters. In this study, we used the intrinsic rate of increase (r), individual growth coefficient (k), and the age of first maturity (tm) as productivity attributes for each species.
In the present study, these three life-history parameters have been previously suggested in the literature as relevant metrics for classifying the productivity of sharks [31], and were sourced from FishBase for all species and organized alongside scientific classification, common name, type of catch species (if target or bycatch), and annual average catch for the period between 2000 and 2014 (Table 1).

2.5. Assessing Vulnerability

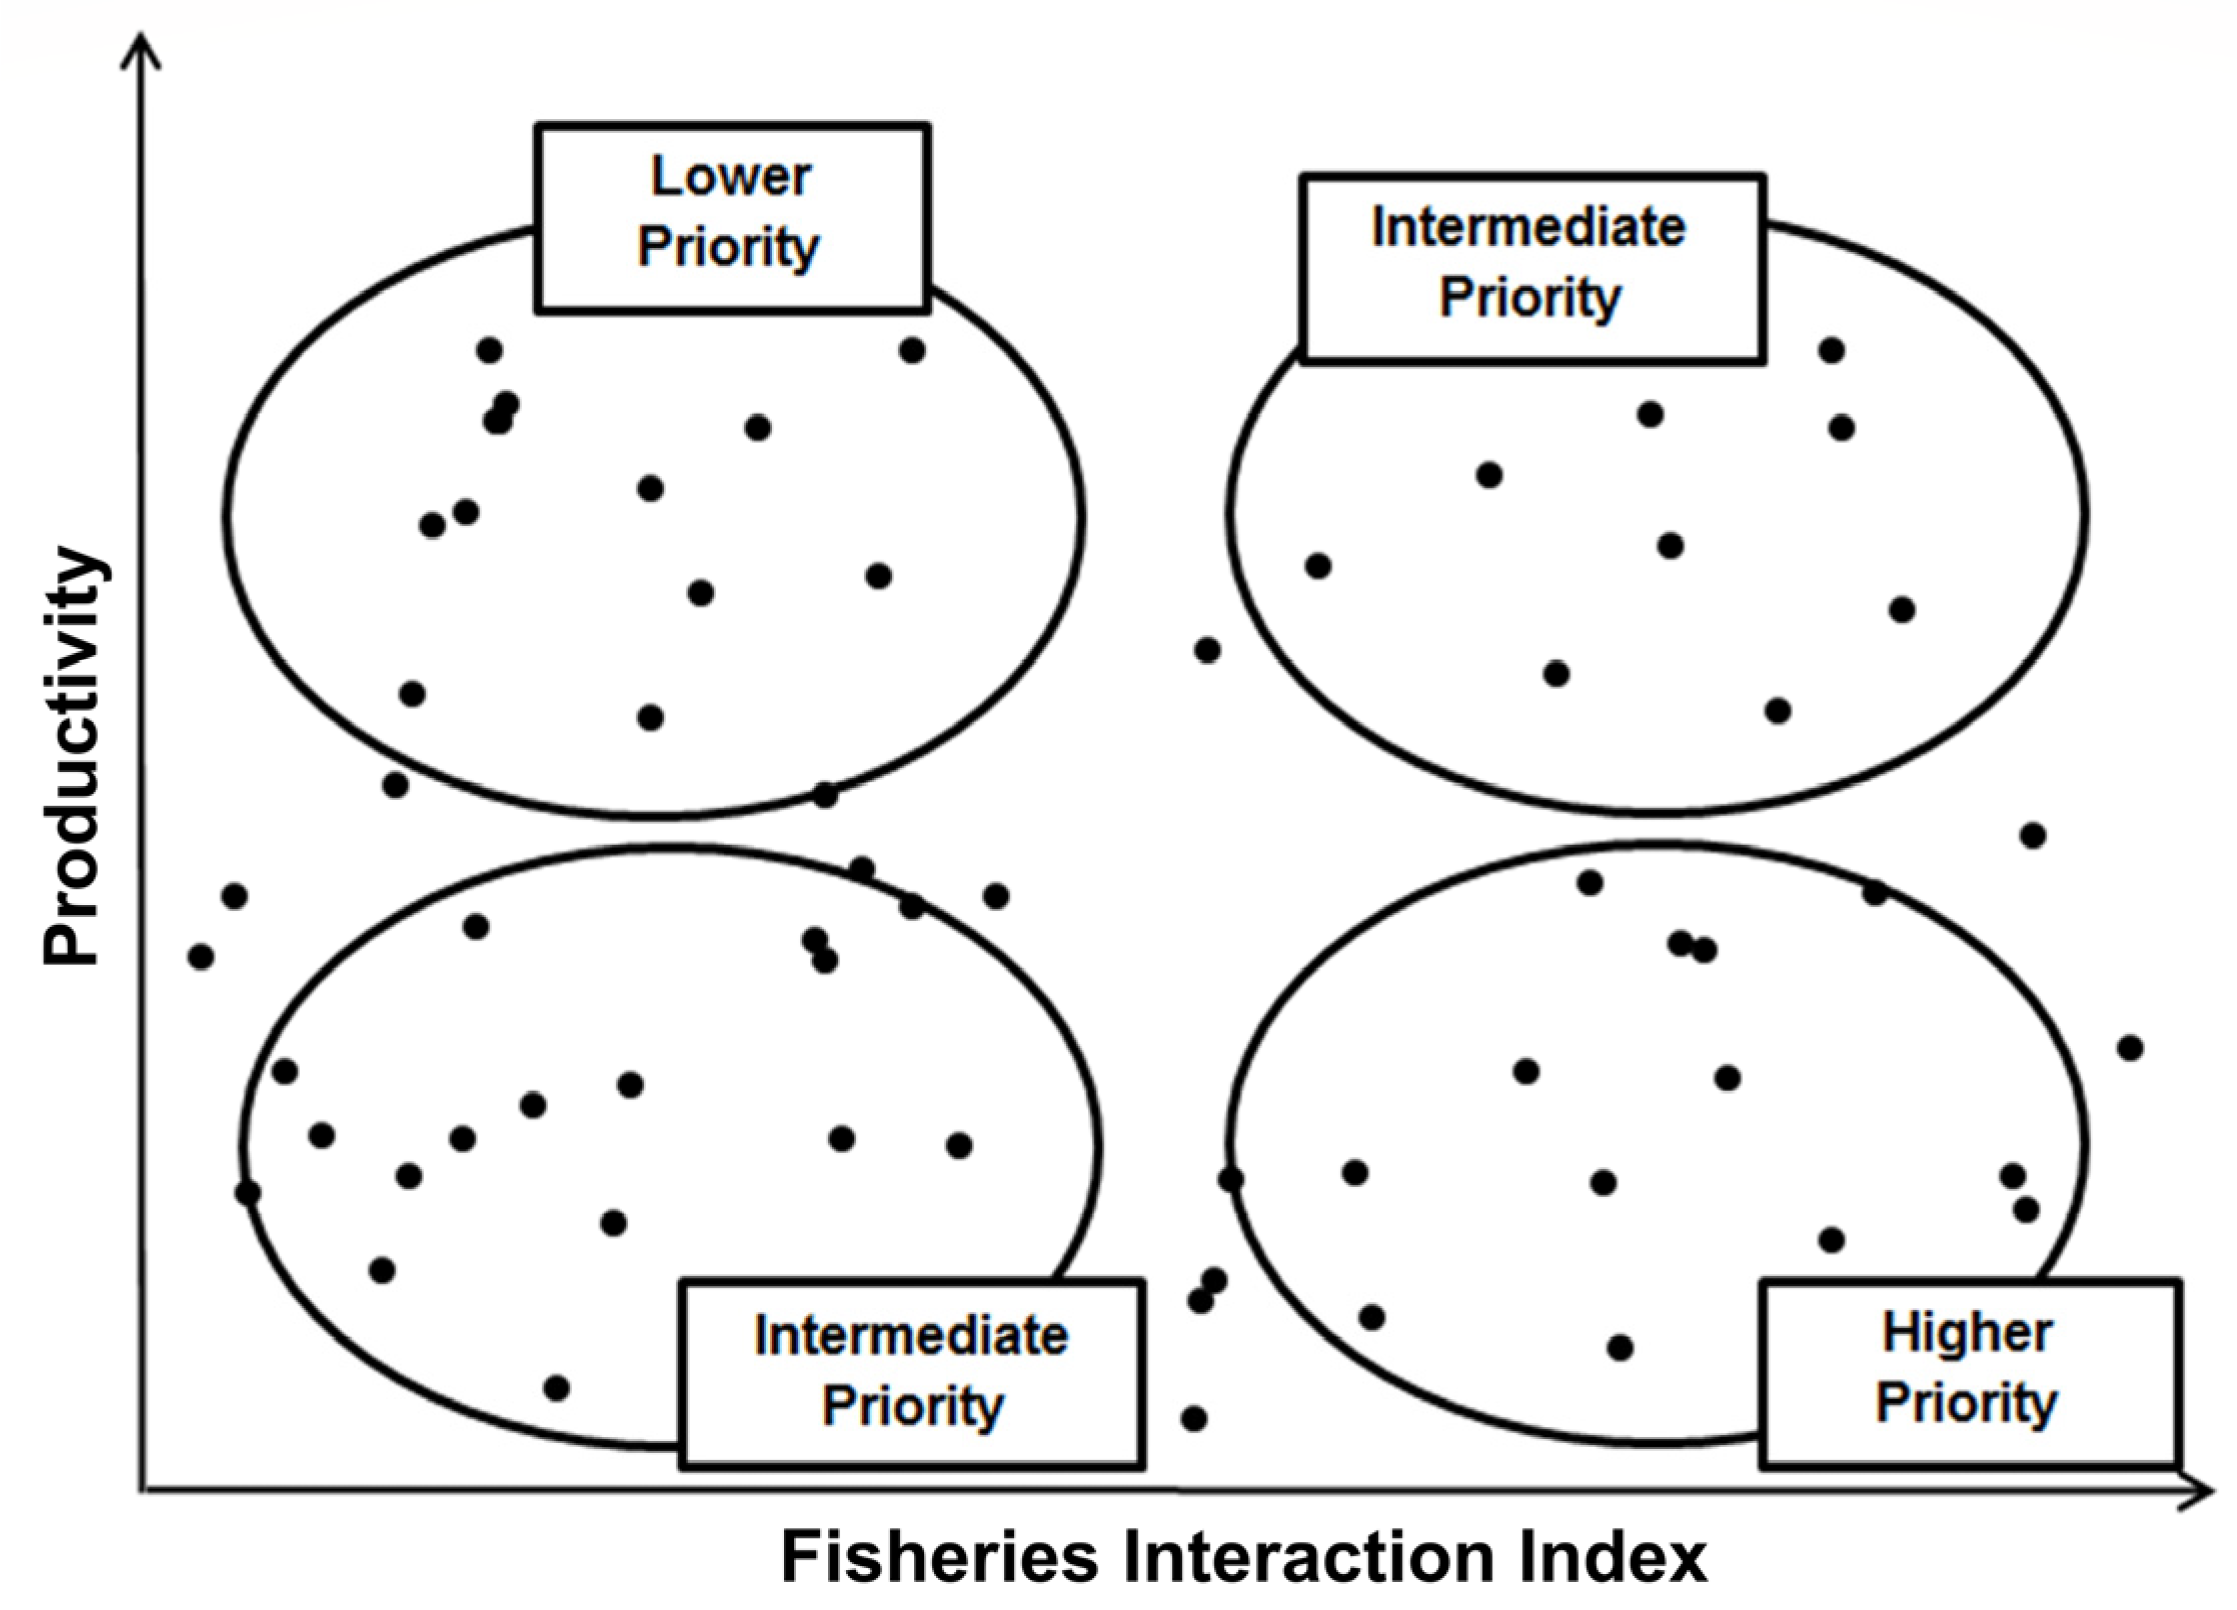
The vulnerability of a stock depends on both its interaction with the fishery (susceptibility), as indicated by FII, and its productivity. In other words, vulnerability can be characterized in a two-dimensional space that relates the intensity of fishery interaction (FII) with species productivity (Figure 3). Regions, where a stock exhibits a relatively low FII and high productivity, should be considered of lower priority. Conversely, regions where stocks have both low or high levels of FII and productivity would be of medium or intermediate priority. Finally, regions of the space where stocks have high values of FII with fisheries and low productivity should be considered of higher priority for conservation. This approach allowed us to identify the most vulnerable stocks and prioritize conservation efforts accordingly.
In this study interaction plots for all species evaluated were built using FII results and the three measures of productivity; intrinsic rate of increase (r), individual growth rate (k) and age of first maturity (tm, note this attribute was plotted on a reverse scale as low ages represent more productive stocks).

3. Results

3.1. Catch Events

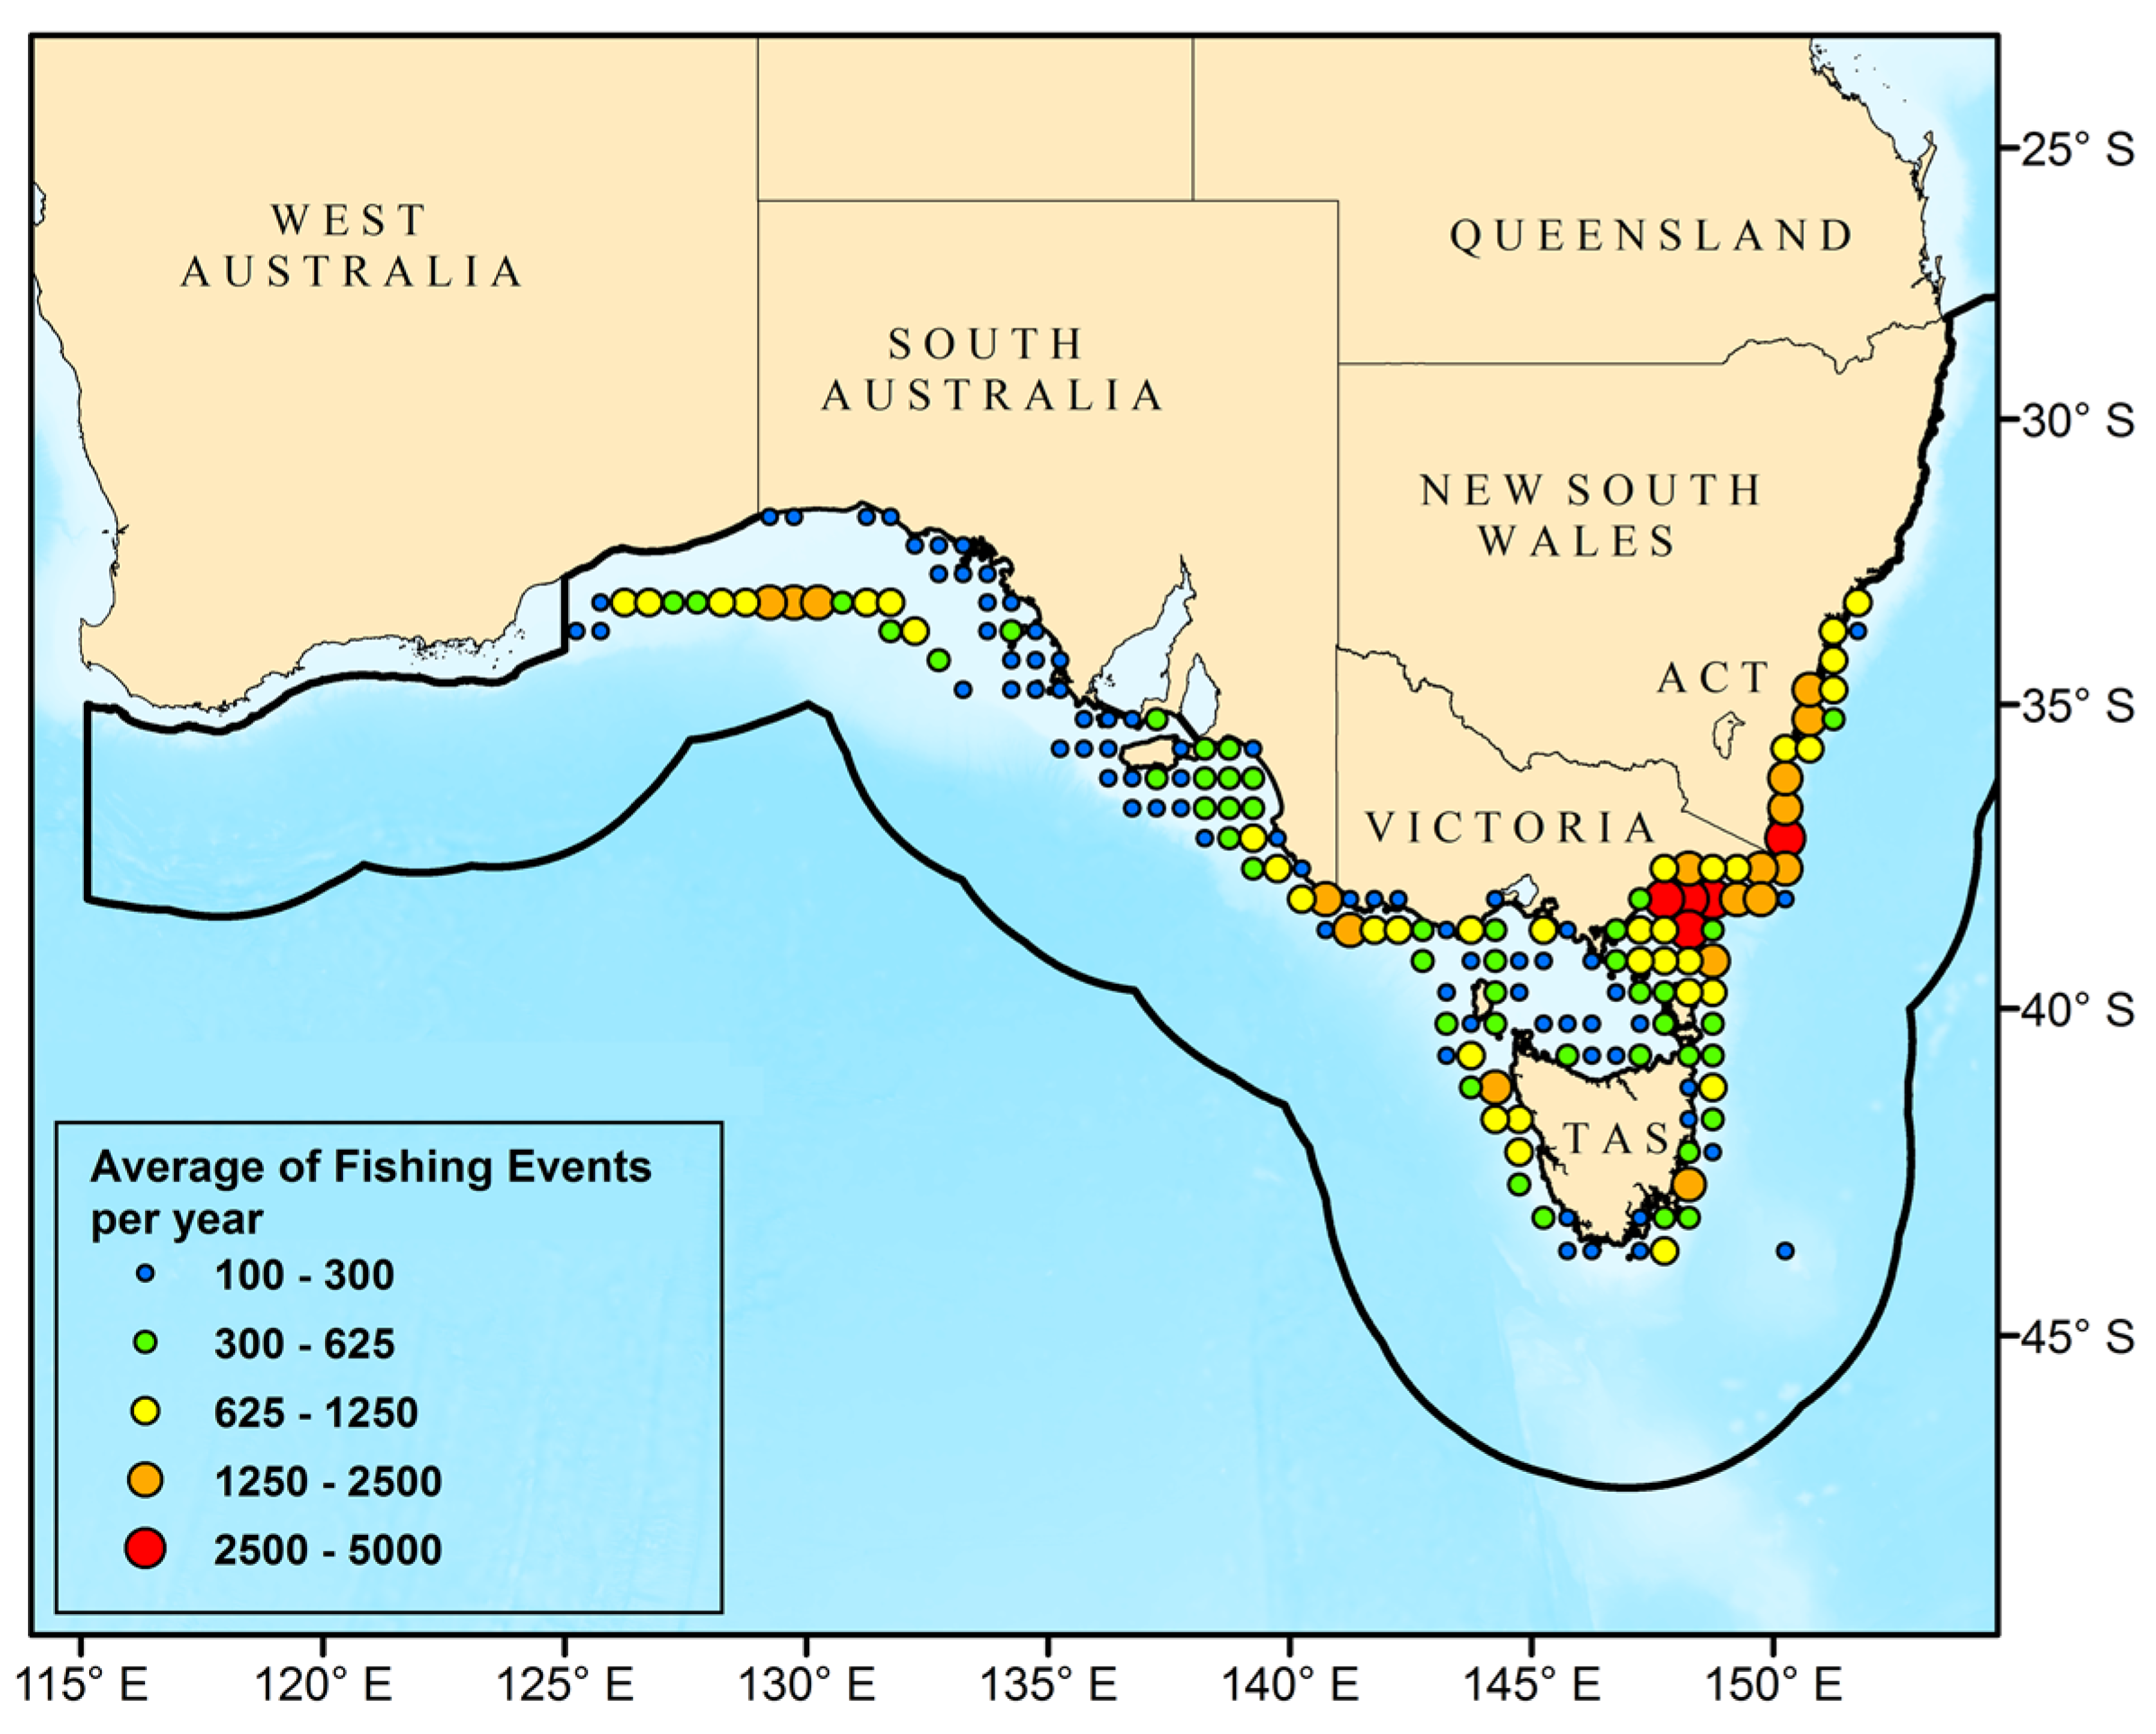
Analysis of the spatial distribution of fishing operations in the SESSF area demonstrated that circa half of the 1179 grids (n = 614) within the SESSF present some degree of exploitation. The majority of fishing operations were clustered in off southern New South Wales, Eastern Victoria, Bass Strait, and Tasmania Province (Figure 4). The mean sea surface temperatures of this region are between 14 °C in winter to 19 °C in summer [9]. Fishing activity is concentrated near the continental slope, where depths vary between 200 and 500 m.

3.2. Fishery Interaction Index

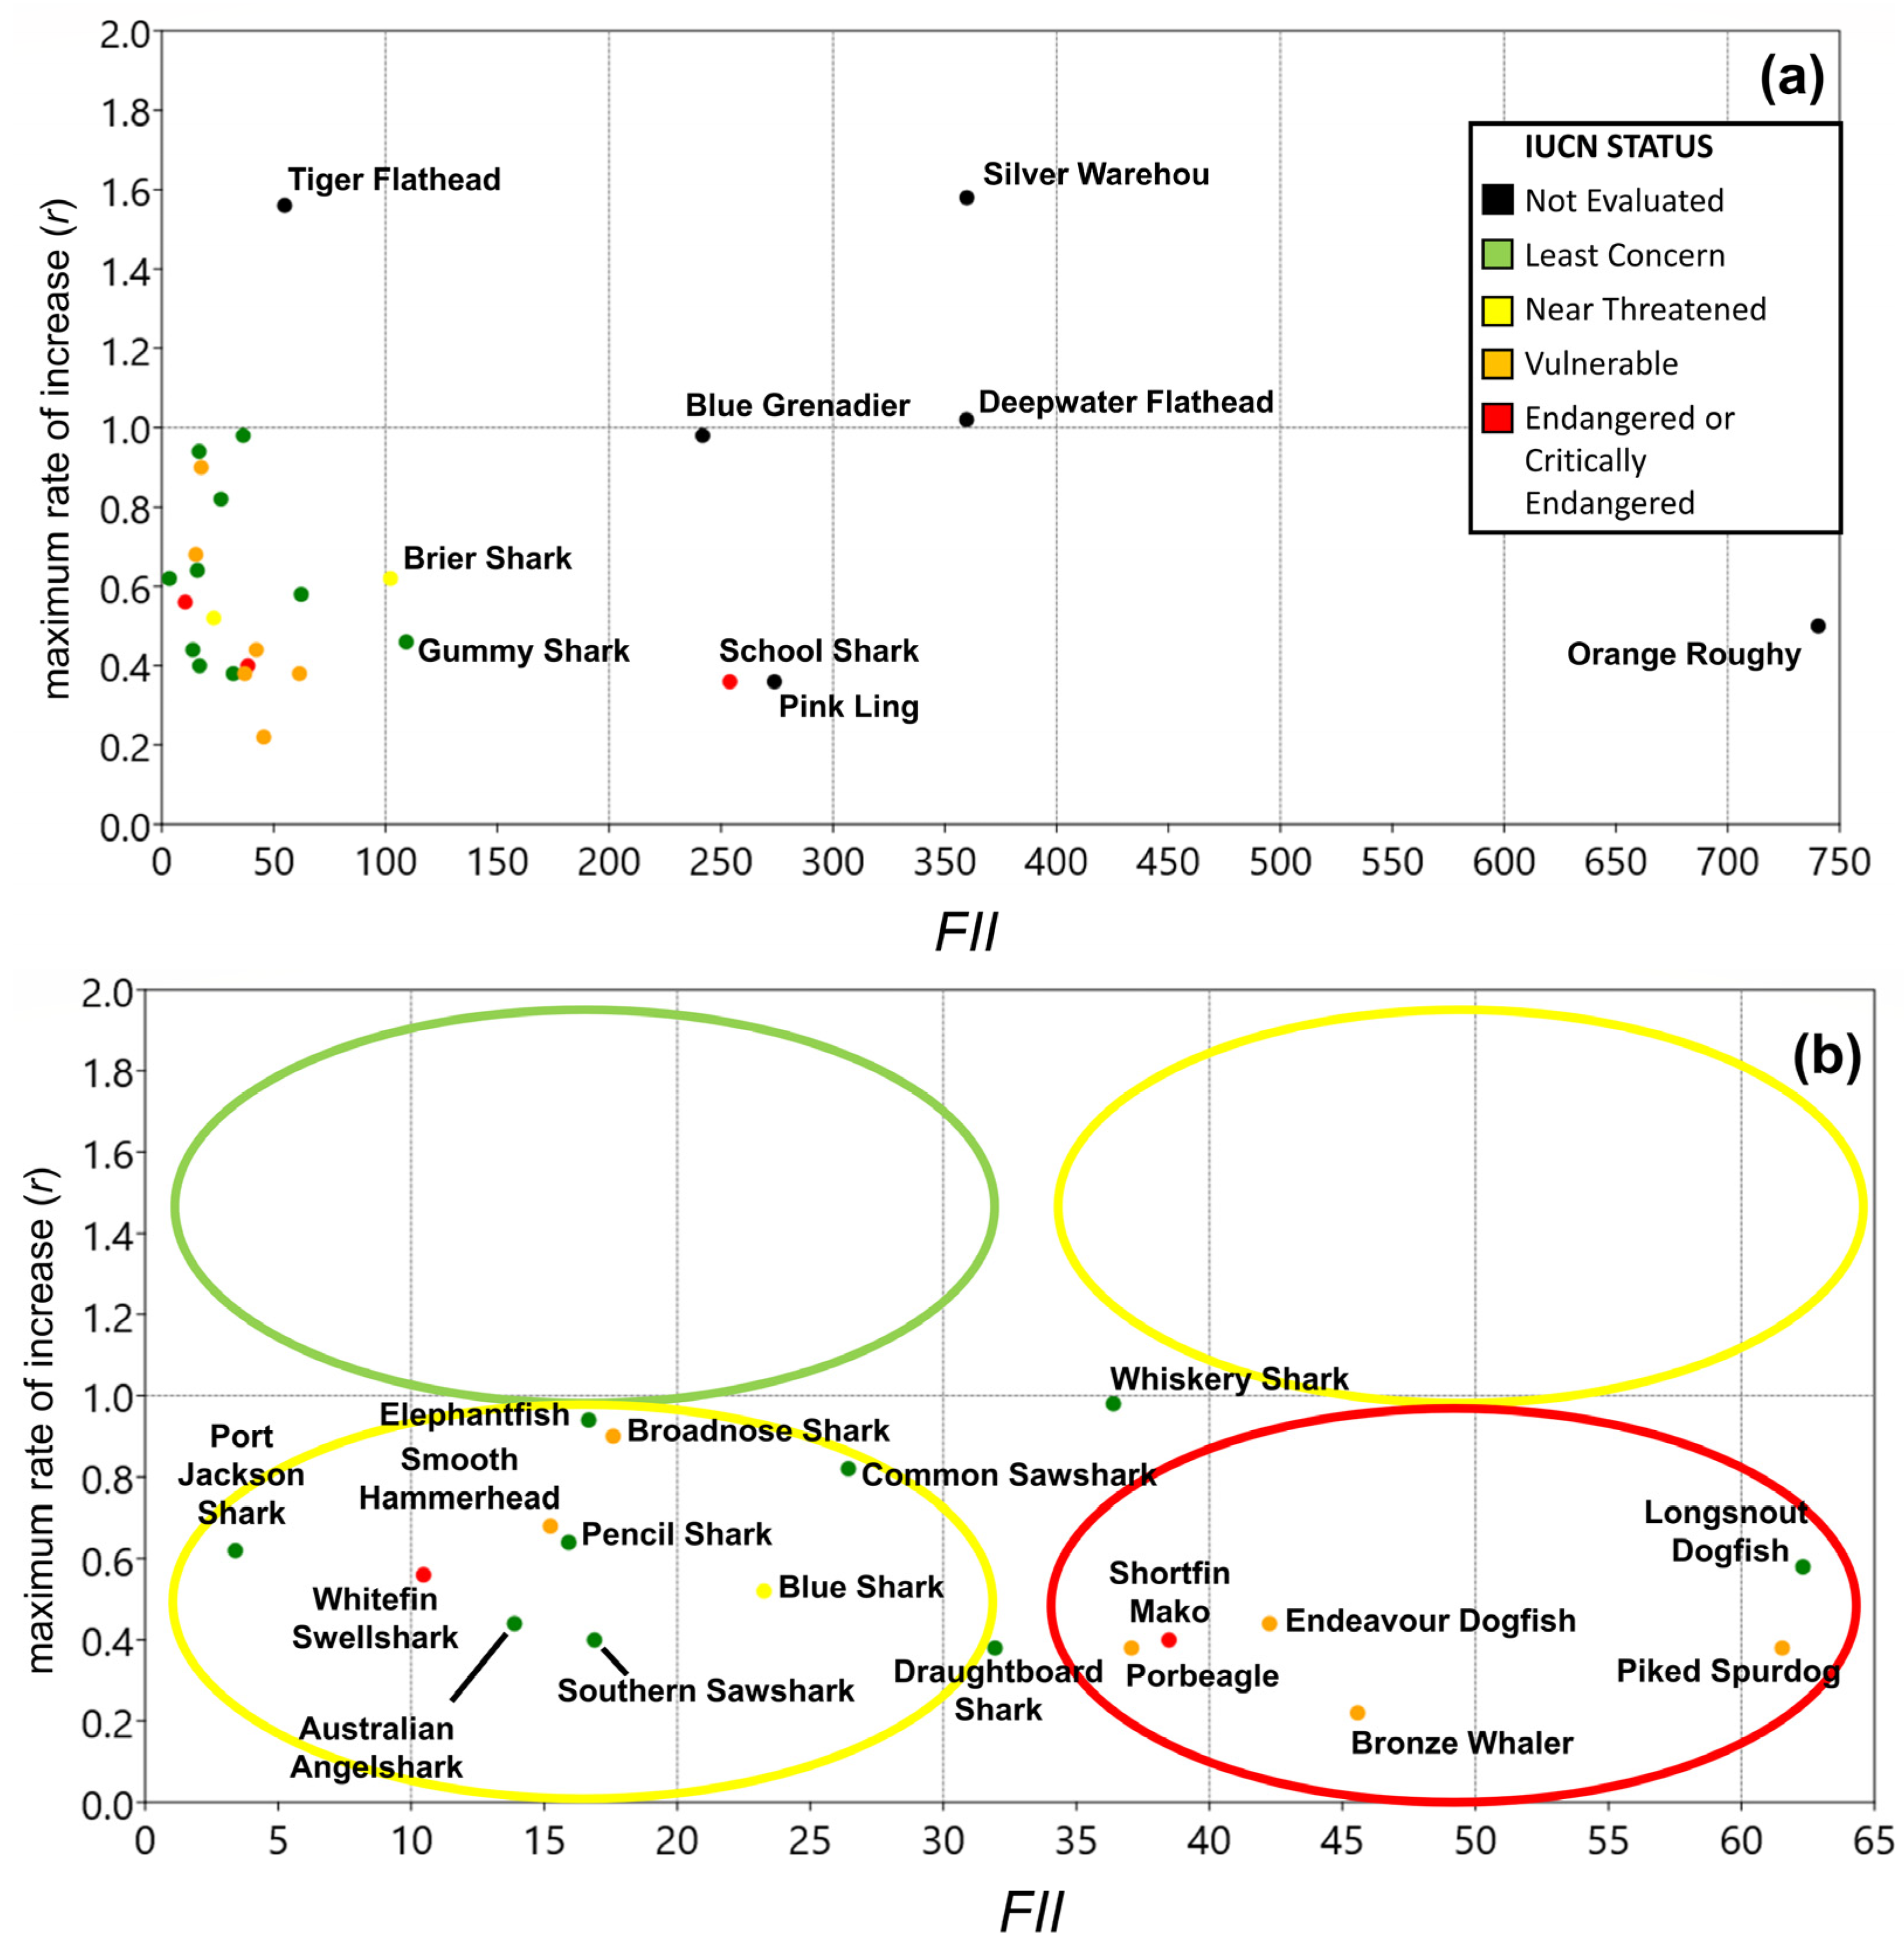
Calculated FII values ranged from 3.39 for the Port Jackson Shark (Heterodontus portusjacksoni) to 740.43 for the target species Orange Roughy (Hoplostethus atlanticus) (Table 2). There was the general separation of bycatch and target species with the former having lower FII values (3.39–102.24) than the latter (109.27–740.43) driven by the large discrepancy in catch between the two groups (Table 2). However, some exceptions to this pattern are worth mentioning: (a) the bycatch School Shark (FII = 253.90) had higher interaction scores than target stocks Blue Grenadier (FII = 241.76) and Gummy Shark (FII = 109.27), and (b) the target Tiger Flathead (FII = 54.94), also had a lower FII than three species of bycatch Chondrichthyans: Brier Shark, Piked Spurdog and Longsnout Dogfish (FII = 102.24, 62.31 and 61.53 respectively).

3.3. Productivity Values

In this study, based on the productivity values established by Musick [31], most of the stocks have Low or Very Low productivity levels, even among target species, with only the Silver Warehou (Seriolella punctata) and Tiger Flathead (Platycephalus richardsoni) having productivity values allowing them to be classified as Medium (Table 1). Hence, these species represent the fastest growth (k = 0.36 and 0.38, respectively) and are among the ones with an earlier age of first maturity (tm = 3.5 and 4.5 years).
Potentially the species with lowest productivity in this study are the Bronze Whaler (Carcharhinus brachyurus) with an r of 0.22, growth curvature k of 0.04 and taking circa 19.5 years to reach maturity alongside the Brier Shark (Deania calcea, r = 0.62; k = 0.1; tm = 25 years) and Shortfin Mako (Isurus oxyrinchus, r = 0.40; k = 0.1; tm = 20 years). In general, most of the remaining stocks values of growth parameter k are around 0.1 and reach age of first maturity between 7.5 and 10 years (Table 1).

3.4. Vulnerability

When considering the vulnerability based on the relationship between FII and the intrinsic rate of increase (r), the most vulnerable stocks (high FII-low productivity) included only species reported as being in more highly impacted IUCN categories with the exception of the Longsnout Dogfish (Least Concern, Figure 5b). These vulnerable stocks include the Critically Endangered School Shark (G. galeus) and the Near Threatened Brier Shark (D. calcea) (Figure 5a), both of which were outside the cluster of most bycatch species (Figure 5a, lower left corner) and therefore comparable to some target species in the level of their fishery interaction. Furthermore, the Orange Roughy presented the highest FII results, and given its relatively low intrinsic rate of increase (r = 0.50) is considered a high priority among the target species (Figure 5a).
Within the cluster of only bycaught sharks, there were no species classified in the intermediate priority area of high FII-high productivity and in the lower priority area of low FII-high productivity (Figure 5b). Moreover, with the exception of the Longsnout Dogfish (D. quadrispinosa), all the selected bycatch species in the high FII-low productivity area are classified as Vulnerable or Endangered by IUCN (Figure 5b).
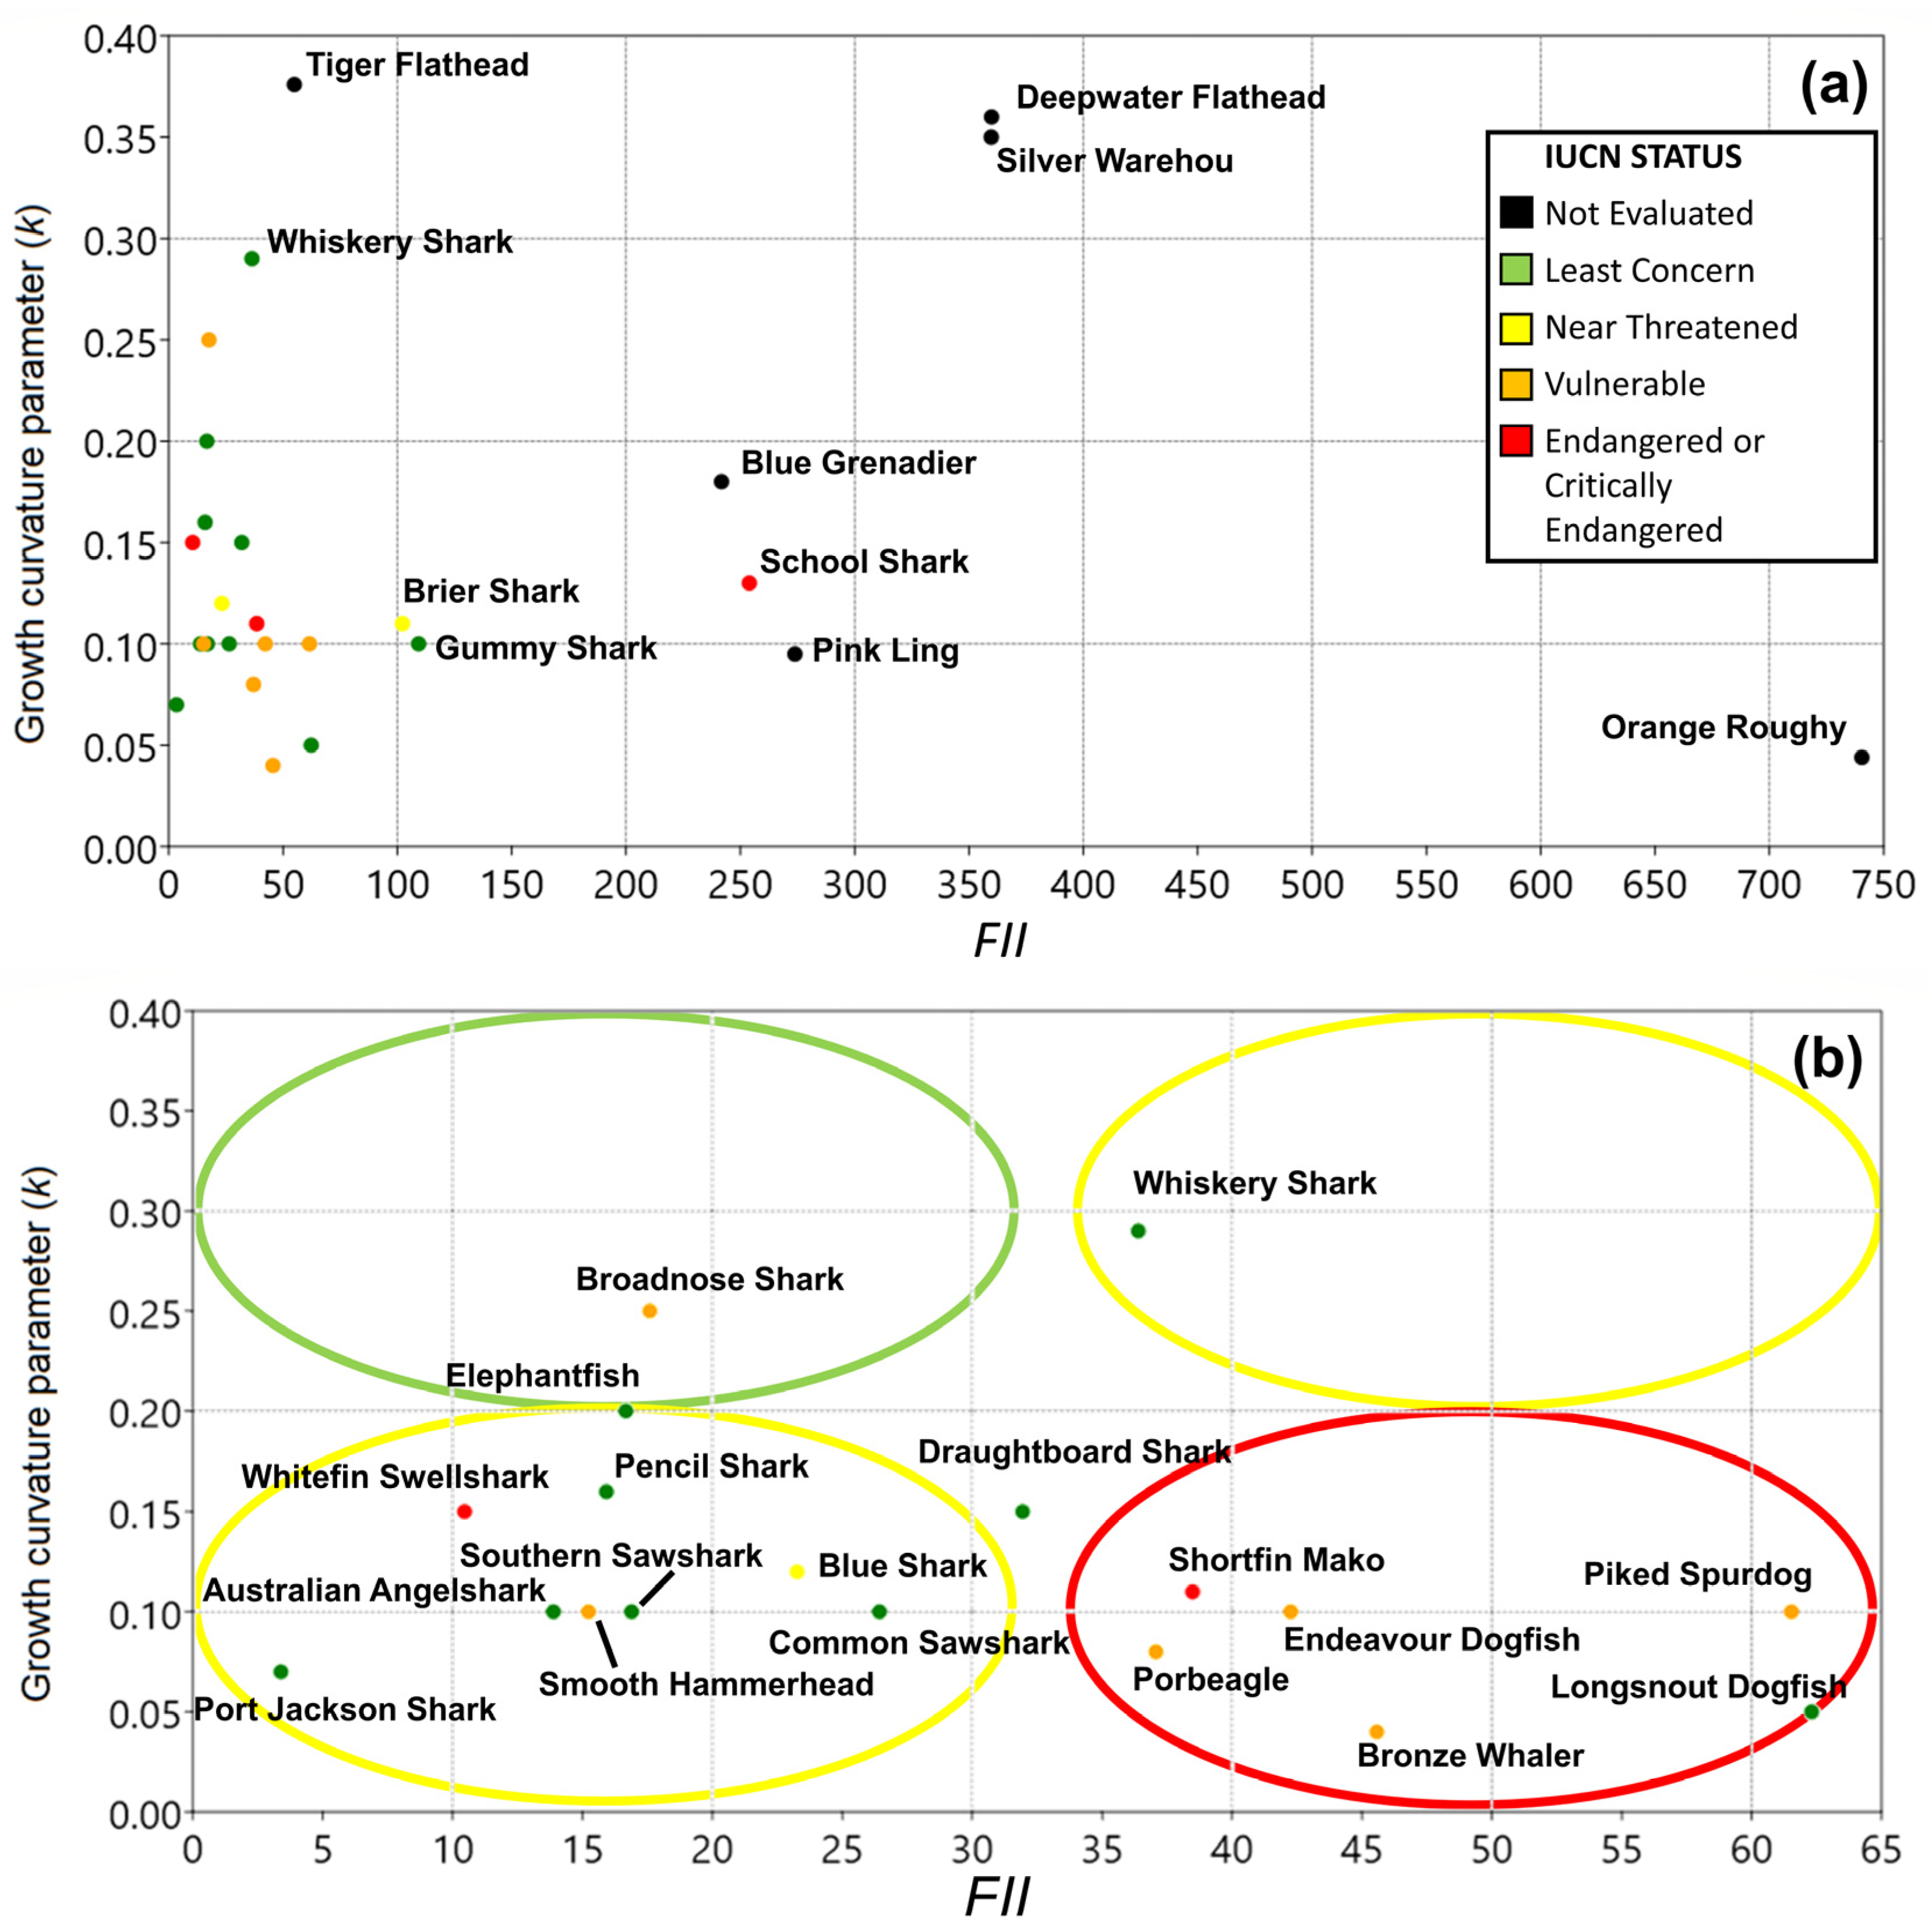
When using the growth curvature parameter (k) as the productivity attribute, patterns for the School Shark (G. galeus) and the Brier Shark (D. calcea) were similar to those for FII vs r, and in the zoomed area only, Elephantfish (Callorhinchus milii) and Broadnose Sharks (Notorynchus cepedianus) were identified as species of lower priority for conservation efforts (Figure 6b). Conversely, six species, were found in the region of higher priority, including Longsnout Dogfish (Least Concern), Endeavour Dogfish, Piked Spurdog, Porbeagle and Bronze Whaler (Vulnerable), and the Shortfin Mako (Endangered). The remaining species were found in intermediate priority sections of the chart, most of them in low-FII/low-productivity areas, and only the Whiskery Shark near the high-FII-high productivity area (Figure 6a,b).
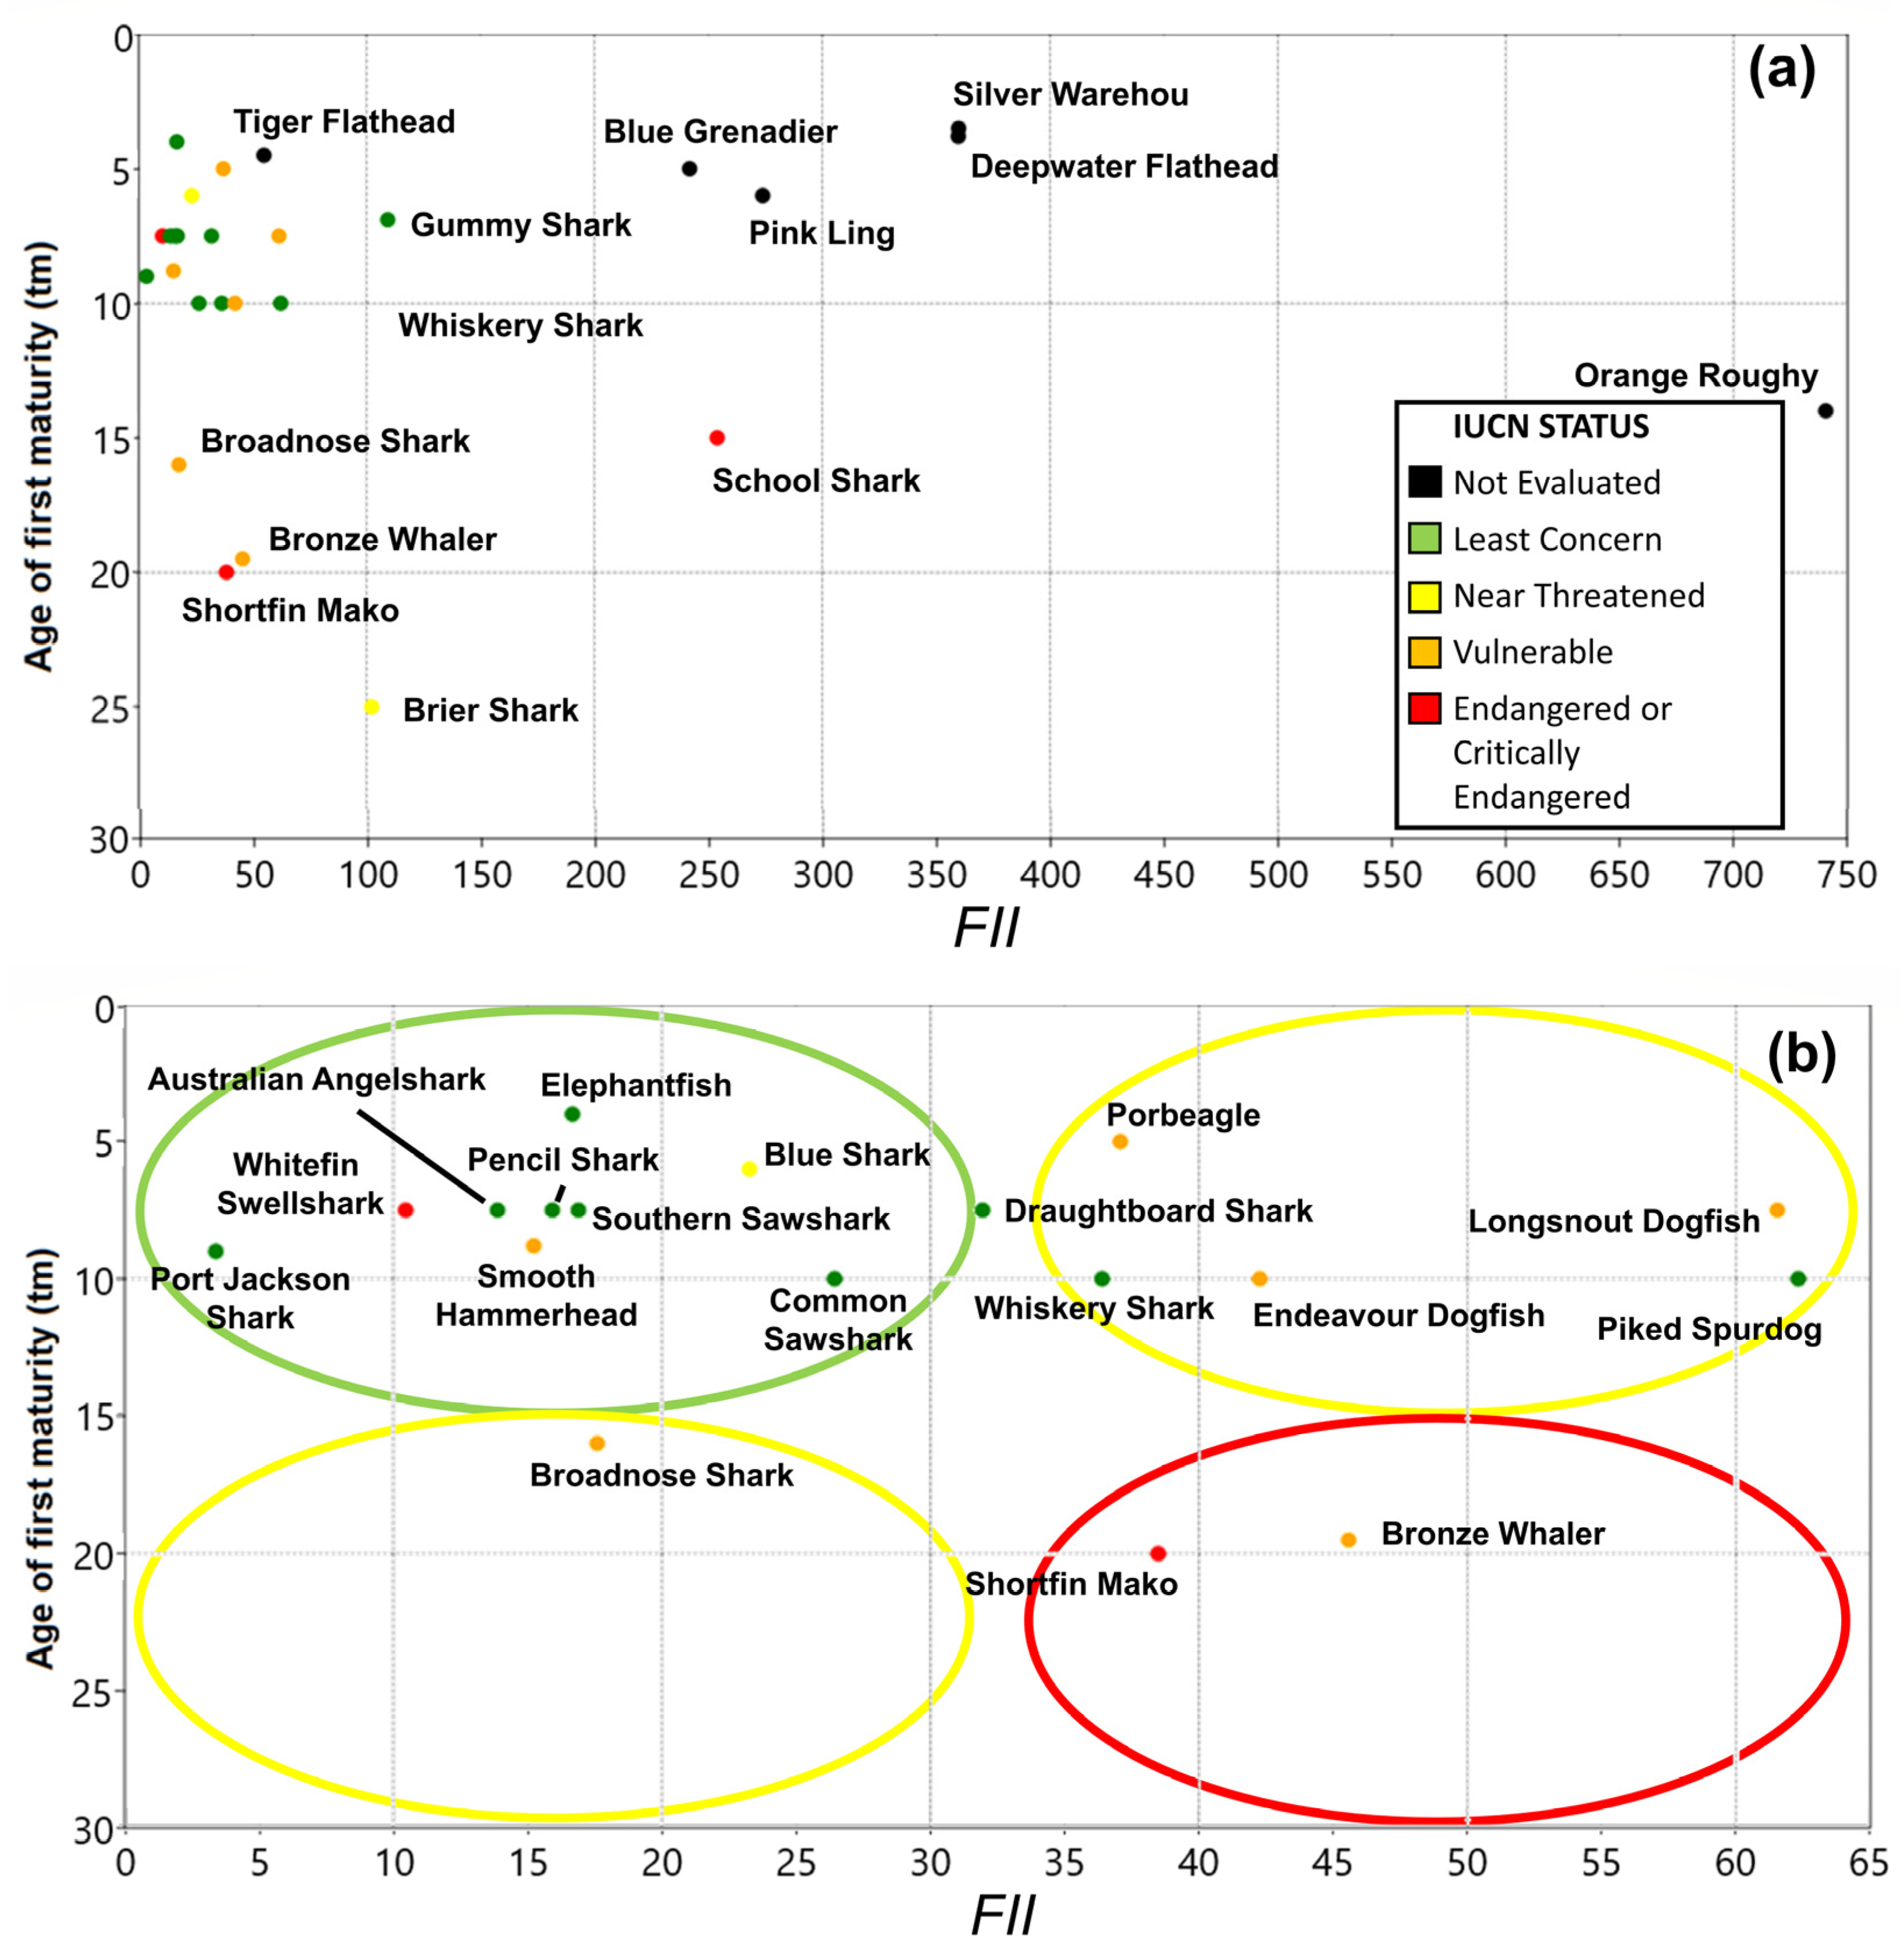
Using the age of first maturity as the productivity attribute (Figure 7a,b), the Orange Roughy was found to be in a high-priority area due to its high interaction and relatively late maturity for a teleost species (Figure 7a). Moreover, School Shark could be considered an intermediate priority when compared to the target species, but em relation to other bycatch species, it would be placed in the higher priority region of the chart alongside the Shortfin Mako. Most bycatch species (Figure 7b) were found to be of intermediate or lower priority, shifting the overall priority region compared to the results of FII x r and FII x k plots (Figure 5b and Figure 6b). Despite this shift, we observed consistency in the relationship between the overall priority rank (Table 2) and the IUCN status, with special attention given to the Bronze Whaler, classified by IUCN as Vulnerable, and the Shortfin Mako, which is described as Endangered. Both species were found in the area of higher priority presenting late maturity and high interaction results.

3.5. Overall Priorities

The priority status for each stock in this study was determined by the relative position of the species within the FII versus productivity plots for each attribute (Figure 5, Figure 6 and Figure 7). The overall priority was summarized based on IUCN Red List Status, interaction result (FII), growth parameter, and age of first maturity (Table 2).
Results of FII-productivity combinations formed similar and consistent clusters with little variation within species groups (Figure 5, Figure 6 and Figure 7). Although some species presented shifts to different regions of priority, none of the FII-productivity plots showed transitions of more than one vulnerability level (i.e., from high to low or vice versa) and moreover showed considerable agreement with the IUCN status of the species.
Using the previously mentioned regions of priority as a reference to categorize groups, results suggested a higher priority group consisting of bycatch Chondrichthyans the School Shark and the Brier Shark (Figure 5, Figure 6 and Figure 7). Both species are of Very Low productivity and presented FII values higher than some target species (Table 2). This higher priority group also included (based on two out of the three productivity metrics) the Piked Spurdog and the Longsnout Dogfish (Figure 5 and Figure 6). IUCN classifies the School Shark and the Piked Spurdog as Vulnerable, and Longsnout Dogfish is reported as Near Threatened.
The area of the lower priority of the bycatch species was mainly composed of Elephantfish but also by both Sawsharks species included in the study (P. cirratus and P. nudipinnis). The latter two were of intermediate priority only in the interaction-productivity plot with growth (k). The three species listed here are considered by IUCN as of Least Concern. The remaining bycatch species were normally present in the medium priority region of the bi-dimensional plots, more specifically in the one where values of interaction and productivity are relatively low. Species in the medium-priority region which presented upward shifts into the higher-priority region in some of the interaction-productivity plots were considered of medium-high priority in the summarized results.
Considering all stocks, it is necessary to highlight the notably high interaction-low productivity presented by the Orange Roughy (Hoplostethus atlanticus). The species have a broad exploitation area, with a high average catch in several grid cells with low density (Figure 5a). Within just the bycatch species (Figure 5b, Figure 6b and Figure 7b) there are other examples of high priorities. Aside from the previously mentioned cases of School and Brier Shark, the interaction-productivity (k) relationships indicated six other species in the higher priority region: four are classified as Vulnerable (VU), one as Endangered (EN) and of of Least Concern (LC) by the IUCN.
Only two species were consistently found to be in the lower priority area (higher productivity-lower interaction): the Elephantfish (C. milii, Least Concern) and the Broadnose Shark (N. cepedianus, Vulnerable). Most of the remaining species were included in the intermediate priority region, especially in low productivity-low interaction areas. This group consisted of nearly all species of Least Concern [13] status, though one is assessed as considered Near Threatened, the Blue Shark (Prionace glauca), and one was of Vulnerable status, the Smooth Hammerhead (S. zygaena).

4. Discussion

In this study, we present an effective ranking method to establish relative management priority status for species using only harvest data, information on geographic distribution, and single or multiple proxies for productivity. This approach could be used as a Tier 2 method within a larger ERA. The rankings resulting from this technique are generally supported by the ICUN Red List status of individual species but provide additional resolution in prioritization than is possible from IUCN categories as well as rankings for species listed as not assessed or data deficient. In the case of the SESSF, this technique identified the School Shark (Galeorhinus galeus) and the Brier Shark (Deania calcea) as the species with the highest priority within the evaluated stocks. The first is listed as Vulnerable by IUCN, and the latter is considered Vulnerable, reinforcing the need for precaution and recognizing increasing threats to the species on its last assessment in the early 2000s [26]. The technique also identified situations, such as the smooth hammerhead, where regional vulnerability was considered lower than that suggested by the IUCN which is based on global data. In both of these examples, the fishery-based assessment provides a more useful regional context for threat analysis for the stocks.
Ecological risk assessments [3] are useful techniques to evaluate specific hazards, threats, or stressors on an ecosystem, habitat, or species [32]. These techniques have been applied to general fish stocks [15,24,33] or directed to non-target species, either focusing on elasmobranchs or contemplating general bycatch [16,17,18]. The FII ranking method is most relevant as a Tier 2 approach (similar to PSA) within a typical ERA [15] such as the SAFE methodology used within Australian fisheries [13,17]. It retains similarities with previous PSA techniques, including the precautionary approach to uncertainty, distribution overlap with harvest area, and the use of population/biological parameters. However, to our knowledge, FII is the first to build a ranking method based on catch and distribution data.
Amongst the four highest-ranked bycatch species by the FII technique in this study, only the Brier Shark is listed as Near Threatened by IUCN. In the early 2000s when the assessment was made, despite the low productivity and increasing targeting, the species was considered abundant and a Near Threatened rank was not justified [34]. The other species ranked as higher priority included: (1) the School Shark which had FII values comparable to target species, listed as Critically Endangered and with a history of declines in the region since the late 1950s [2], (2) the Longsnout Dogfish, a Vulnerable species for which the IUCN assessment is based on the global population, but which has also presented a >80% decline over 20 years on the New South Wales slope [2] and therefore highly threatened on a regional scale, and (3) the Piked Spurdog, a species reported as Least Concern with taxonomic issues and a major component on fisheries-independent trawl surveys [34].
The medium-priority species group consisted of mainly hound sharks and dogfishes: small to mid-sized sharks (usually ≤ 1.2 m), commonly caught by both trawls and hooks. Dogfishes as a group are comprised of demersal species lacking specific information about stocks and life-history traits, normally found through the lower continental shelf and upper slope. Some species of pelagic sharks with mid to larger sizes, such as Bronze Whaler, Shortfin Mako, and Porbeagle also had similar degrees of fishery interaction. Nonetheless, these large coastal and oceanic sharks have low productivity and although widespread, tend to present themselves in discrete regional populations and therefore FII values were influenced by high average catch in low abundance areas.
The remaining bycatch species to which the model was applied is a group composed mainly of species of demersal sharks mostly listed as Least Concern by IUCN, with the notable exception of four cases: Blue Shark, Smooth Hammerhead, Broadnose Shark, and Whitefin Swellshark. The first two are both widely distributed pelagic-oceanic species and Blue Sharks have their IUCN status of Near Threatened justified by the large numbers in which the species is removed worldwide (estimated to be 20 million individuals/y−1). In Australian waters, however, the species had low catch rates (<2 tons−y) despite being commonly caught by longlines and gillnets and thus fell out as of low vulnerability. Smooth Hammerhead is listed as Vulnerable globally, caught by a variety of gears in coastal and oceanic fisheries and often reported in multispecies groups. However previous assessments report the catch and fishing pressure in Australian waters as low (<6 tons−y), and the region is considered to be a refuge area for the species [2] justifying regionally a medium priority for the species.
Broadnose Sharks are listed by IUCN as Vulnerable, and this demersal species is considered common and restricted to the lower continental shelf and the upper slope and therefore exposed to most inshore fisheries over its range [2]. Whitefin Swellsharks are endemic, Critically Endangered species to Southern Australia, with very little information known about the species. As with Broadnose Sharks, the distribution on the outer shelf and upper slope imply a high exposure to trawl fishing. Previous studies have shown declines (>30%) in swellsharks over a 20-year period [34] and the low priority rating from this analysis might be indicative of an already heavily impacted stock.
The information obtained by this study points to a group of species that would require further individual and rigorous stock assessments and updated population status, mortality rates, and reproductive capacity. Indeed, AFMAs approach to ERA is the SAFE methodology [13,17] and this has been applied to all sectors of the SESSF to consider priorities more specifically. While many species are data limited and some are considered overfished in at least some sub-regions (e.g., School shark, orange roughy) AFMA have not identified any of the species considered here as being high risk within their regional/fishery specific context. Another point to be acknowledged here is that a large number of elasmobranchs, such as skates and rays, are not part of this assessment because a species-level confirmation was not feasible. These are normally reported in mixed or generic multi-species categories and therefore comparing with IUCN Red List Status was not possible. Moreover, generic categories can mask declines/increases in different components of the group and the sympatry with other bycatch on the continental shelf suggests that many species have a potential high interaction with fisheries. For example, in Australia, just the complex “skates” which refers to the family Rajidae includes 14 species reported in threatened categories or classified as Data Deficient.
One advantage of the FII method is that it can be applied to a large number of species and it uses different temporal and spatial scales. Furthermore, the model does not require specific information such as size structure or mortality. This method is also cost and time effective and may be applied to other organisms due to its flexibility to evaluate interactions between species and specific threats. For example, the productivity attribute could be substituted with any other adequate measure related to the issue in question. Results in this case should be evaluated considering the directionality of the model and the conservation status of the species. Limitations to the FII approach presented in this study include the requirement to confirm the species identity within the catch, taking account of regional common names, especially when FII is paired with biological parameters. An additional consideration of our methodology is that susceptibility is typically characterized as the product of availability, encounter ability, gear selectivity, and post release mortality and FII only captures the first two of these. However, the effects of this on the present case study are likely to be minimal due to the lack of size-selective gear in this fishery and the fact that most bycatch does not survive. It is important to note that the quality of the distribution data of both fishing operations and species distribution needs to be adjusted to the standard spatial scale to apply the method. Finally, the catch data used here aggregated all the gears and sub-sectors of the Southern and Eastern Scalefish and Shark Fisheries, and thus it might have overlooked regional interactions between gear and species. Nonetheless, the ranking provided here offers a rigorous justification for research and management prioritization in data-deficient situations within a larger ERA context.

5. Conclusions

This study demonstrates that a ranking system based on harvest data, species distribution, and productivity proxies can provide a useful tool for prioritizing management efforts to conserve Chondrichthyans caught as bycatch. The results of the ranking generally align with the IUCN Red List Status of individual species, including cases where local assessments do not reflect global assessments, providing additional support for the method’s effectiveness. The key advantage of this approach is its flexibility in spatial and temporal scales, allowing for cost-effective prioritization of conservation efforts where quality data is unavailable. Importantly, this study highlights the urgent need for action to protect the large number of threatened shark species caught as bycatch, and calls for increased investment in shark conservation initiatives to address this global issue. By adopting targeted management strategies that prioritize the most vulnerable species, we can work towards a more sustainable future for these important apex predators and their ecosystems.

Author Contributions

Conceptualization, M.R. and W.F.F.; methodology, M.R. and W.F.F.; validation, M.R. and W.F.F.; formal analysis, M.R. and W.F.F.; investigation, M.R. and W.F.F.; data curation, M.R. and W.F.F.; writing—original draft preparation, M.R.; writing—review and editing, M.R. and W.F.F.; supervision, W.F.F.; project administration, M.R.; funding acquisition, M.R. All authors have read and agreed to the published version of the manuscript.

Funding

This research was part of the scholarship funding by Coordenação de Aperfeiçoamento de Pessoal de Nível Superior—CAPES of the Process BEX 13590-13-8.

Institutional Review Board Statement

Not applicable.

Data Availability Statement

The fishing logbooks data were provided by the Australian Fisheries Management Authority—AFMA, a Commonwealth Government Agency, and are protected by a deed of confidentiality.

Acknowledgments

The Authors would like to thank the Australian Fisheries Management Authority—AFMA for sharing the logbook data for the Southern and Eastern Scalefish and Shark Fishery (SESSF), and Christina Garilao and Kristin Kaschner from the AquaMaps team for sharing the data on species distribution and probability of occurrence. Finally, we would like to thank our esteemed reviewers for the valuable insights that improved greatly the quality of our work.

Conflicts of Interest

The authors declare no conflict of interest.

References

  1. Bonfil, R. Overview of World Elasmobranch Fisheries; Food & Agriculture Org.: Rome, Italy, 1994. [Google Scholar]
  2. IUCN. The IUCN Red List of Threatened Species, version 2022-2; IUCN: Gland, Switzerland, 2022. [Google Scholar]
  3. Hoenig, J.M. Life-history patterns in the elasmobranchs: Implications for fisheries management. Elasmobranchs as Living Source: Advances in the Biology, Ecology Systematics, and the Status of the Fisheries. NOAA Tech. Rep. 1990, 90, 1–16. [Google Scholar]
  4. Camhi, M. Sharks and Their Relatives: Ecology and Conservation; IUCN: Gland, Switzerland, 1998. [Google Scholar]
  5. Stevens, J.D.; Bonfil, R.; Dulvy, N.K.; Walker, P.A. The effects of fishing on sharks, rays, and chimaeras (chondrichthyans), and the implications for marine ecosystems. ICES J. Mar. Sci. 2000, 57, 476–494. [Google Scholar] [CrossRef]
  6. Smith, S.E.; Au, D.W.; Show, C. Intrinsic rebound potentials of 26 species of Pacific sharks. Mar. Freshw. Res. 1998, 49, 663–678. [Google Scholar] [CrossRef]
  7. Kennelly, S.J. The issue of bycatch in Australia’s demersal trawl fisheries. Rev. Fish Biol. Fish. 1995, 5, 213–234. [Google Scholar] [CrossRef]
  8. Lewison, R.L.; Crowder, L.B.; Wallace, B.P.; Moore, J.E.; Cox, T.; Zydelis, R.; McDonald, S.; DiMatteo, A.; Dunn, D.C.; Kot, C.Y.; et al. Global patterns of marine mammal, seabird, and sea turtle bycatch reveal taxa-specific and cumulative megafauna hotspots. Proc. Natl. Acad. Sci. USA 2014, 111, 5271–5276. [Google Scholar] [CrossRef] [PubMed] [Green Version]
  9. Commonwealth of Australia. A Guide to the Integrated Marine and Coastal Regionalisation of Australia Version 4.0; Department of the Environment and Heritage: Canberra, Australia, 2006.
  10. Musick, J.A.; Bonfil, R. Management Techniques for Elasmobranch Fisheries; Food & Agriculture Org.: Rome, Italy, 2005. [Google Scholar]
  11. Last, P.R.; Stevens, J.D. Sharks and Rays of Australia; CSIRO: Canberra, Australia, 2009. [Google Scholar]
  12. Fishery Status Reports 2022. In Australian Bureau of Agricultural and Resource Economics and Sciences; Australian Bureau of Agricultural and Resource Economics and Sciences: Canberra, Australia, 2022.
  13. AFMA. Guide to AFMA’s Ecological Risk Management; Australian Fisheries Managment Agency: Canberra, Australia, 2022. [Google Scholar]
  14. Cortés, E.; Brooks, E.N.; Shertzer, K.W. Risk assessment of cartilaginous fish populations. ICES J. Mar. Sci. 2014, 72, 1057–1068. [Google Scholar] [CrossRef] [Green Version]
  15. Hobday, A.; Smith, A.; Stobutzki, I.; Bulman, C.; Daley, R.; Dambacher, J.; Deng, R.; Dowdney, J.; Fuller, M.; Furlani, D.; et al. Ecological risk assessment for the effects of fishing. Fish. Res. 2011, 108, 372–384. [Google Scholar] [CrossRef]
  16. Zhou, S.; Smith, A.D.; Fuller, M. Quantitative ecological risk assessment for fishing effects on diverse data-poor non-target species in a multi-sector and multi-gear fishery. Fish. Res. 2011, 112, 168–178. [Google Scholar] [CrossRef]
  17. Zhou, S.; Griffiths, S.P. Sustainability Assessment for Fishing Effects (SAFE): A new quantitative ecological risk assessment method and its application to elasmobranch bycatch in an Australian trawl fishery. Fish. Res. 2008, 91, 56–68. [Google Scholar] [CrossRef]
  18. Sporcic, M.; Bulman, C.M.; Fuller, M. Ecological Risk Assessment for the Effects of Fishing. Report for the Southern and Eastern Scalefish and Shark Fishery (Gillnet Hook and Trap Sector): Shark Gillnet Sub-Fishery 2012–2016; Report for the Australian Fisheries Management Authority; Australian Fisheries Management Authority: Canberra, Australia, 2021; p. 218. [Google Scholar]
  19. Sporcic, M.; Bulman, C.M.; Fuller, M. Ecological Risk Assessment for the Effects of Fishing. Report for Southern and Eastern Scalefish and Shark Fishery (Commonwealth Trawl Sector): Danish Seine Subfishery 2012–2016; Report for the Australian Fisheries Management Authority; Australian Fisheries Management Authority: Canberra, Australia, 2021; p. 197. [Google Scholar]
  20. Sporcic, M.; Bulman, C.M.; Fuller, M. Ecological Risk Assessment for the Effects of Fishing. Report for Southern and Eastern Scalefish and Shark Fishery, Great Australian Bight Sector: Otter Trawl Sub-Fishery 2012–2016; Report for the Australian Fisheries Management Authority; Australian Fisheries Management Authority: Canberra, Australia, 2021; p. 174. [Google Scholar]
  21. Stobutzki, I.; Miller, M.; Brewer, D. Sustainability of fishery bycatch: A process for assessing highly diverse and numerous bycatch. Environ. Conserv. 2001, 28, 167–181. [Google Scholar] [CrossRef]
  22. Hordyk, A.R.; Carruthers, T.R. A quantitative evaluation of a qualitative risk assessment framework: Examining the assumptions and predictions of the Productivity Susceptibility Analysis (PSA). PLoS ONE 2018, 13, e0198298. [Google Scholar] [CrossRef] [PubMed] [Green Version]
  23. Patrick, W.S.; Spencer, P.; Ormseth, O.A.; Cope, J.M.; Field, J.C.; Kobayashi, D.R.; Gedamke, T.; Cortés, E.; Bigelow, K.; Overholtz, W.J.; et al. Use of productivity and susceptibility indices to determine stock vulnerability, with example applications to six US fisheries. In NOAA Technical Memorandum NMFS-F/SPO-101; U.S. Department of Commerce: Washington, DC, USA, 2009. [Google Scholar]
  24. Patrick, W.S.; Spencer, P.; Link, J.; Cope, J.; Field, J.; Kobayashi, D.; Lawson, P.; Gedamke, T.; Cortés, E.; Ormseth, O.; et al. Using productivity and susceptibility indices to assess the vulnerability of United States fish stocks to overfishing. Fish. Bull. 2010, 108, 305–323. [Google Scholar]
  25. Emery, T.; Woodhams, J.; Curtotti, R. Southern and Eastern Scalefish and Shark Fishery. In Fishery Status Reports 2022; Austrslian Government: Canberra, Australia, 2021; pp. 86–89. [Google Scholar]
  26. Alverson, D.L.; Freeber, M.H.; Murawsk, S.A.; Pope, J.G. A Global Assessment of Fisheries Bycatch and Discards; Food & Agriculture Org: Rome, Italy, 1994; Volume 339. [Google Scholar]
  27. Kaschner, K.; Kesner-Reyes, K.; Garilao, C.; Rius-Barile, J.; Rees, T.; Froese, R. AquaMaps: Predicted Range Maps for Aquatic Species. World Wide Web Electronic Publication, Version 08/2013. 2013. Available online: www.AquaMaps.org (accessed on 24 June 2015).
  28. Froese, R.; Pauly, D. FishBase: A Global Information System on Fishes. World Wide Web Electronic Publication. 2002. Available online: www.fishbase.org (accessed on 20 May 2023).
  29. Watson, D.F. A refinement of inverse distance weighted interpolation. Geo-Processing 1985, 2, 315–327. [Google Scholar]
  30. Esri, R. ArcGIS Desktop: Release 10; Environmental Systems Research Institute: Redlands, CA, USA, 2011. [Google Scholar]
  31. Musick, J.A. Criteria to Define Extinction Risk in Marine Fishes: The American Fisheries Society Initiative. Fisheries 1999, 24, 6–14. [Google Scholar] [CrossRef]
  32. Gallagher, A.J.; Kyne, P.; Hammerschlag, N. Ecological risk assessment and its application to elasmobranch conservation and management. J. Fish Biol. 2012, 80, 1727–1748. [Google Scholar] [CrossRef] [PubMed]
  33. Plagányi, É.E.; Punt, A.E.; Hillary, R.; Morello, E.B.; Thebaud, O.; Hutton, T.; Pillans, R.D.; Thorson, J.T.; Fulton, E.A.; Smith, A.D.M.; et al. Multispecies fisheries management and conservation: Tactical applications using models of intermediate complexity. Fish Fish. 2012, 15, 1–22. [Google Scholar] [CrossRef]
  34. Graham, K.J.; Andrew, N.L.; Hodgson, K.E. Changes in relative abundance of sharks and rays on Australian South East Fishery trawl grounds after twenty years of fishing. Mar. Freshw. Res. 2001, 52, 549–561. [Google Scholar] [CrossRef]
Figure 1. Australia’s Exclusive Economic Zone (EEZ) and in dashed lines the Southern and Eastern Scalefish and Shark Fishery Area (Datum WGS84).
Diversity 15 00752 g001
Figure 2. (a) Schematic diagram of interaction maps between species distribution and fisheries layers and (b) example of weighted interaction of Fishery Interaction Index model for two hypothetical grid cells with same values of average catch (C) and distinct probabilities of occurrence (P).
Diversity 15 00752 g002
Figure 3. Reference schematic graphic with a general approach to species resilience and interaction. Dots represent hypothetical species with random values of the Resilience and Fishery Interaction Index.
Diversity 15 00752 g003
Figure 4. Yearly average number of fishing events per reporting grid (0.5 degree) in the Southern and Eastern Scalefish and Shark Fishery Area (Datum WGS84) for the 2001–2014 period.
Diversity 15 00752 g004
Figure 5. Relationship between Fisheries Interaction Index (FII) and values of intrinsic rate of population increase (r) with all assessed stocks (a) and of selected low FII value Bycatch Chondrichthyans in Southern and Eastern Scalefish and Shark Fisheries—SESSF (b). Note panel (b) is just zoomed in to the area of the FII axis (0–65), excluding the target species Tiger Flathead (Platycephalus richardsoni). The colors of the circles correspond to levels of priority in the plot: lower (green), intermediate (yellow) and higher (red).
Diversity 15 00752 g005
Figure 6. Relationship between Fisheries Interaction Index (FII) and values of Von Bertalanffy Growth Parameter (k) with all assessed stocks (a) and of selected low FII value Bycatch Chondrichthyans in Southern and Eastern Scalefish and Shark Fisheries—SESSF (b). Note panel (b) is just zoomed in to the area of the FII axis (0–65), excluding the target species Tiger Flathead (Platycephalus richardsoni). The colors of the circles correspond to levels of priority in the plot: lower (green), intermediate (yellow) and higher (red).
Diversity 15 00752 g006
Figure 7. Relationship between Fisheries Interaction Index and published values age of first maturity with all assessed stocks (a) and of selected Bycatch Chondrichthyans in Southern and Eastern Scalefish and Shark Fisheries—SESSF (b). Note 1: Panel (b) is just zoomed in to the area of the area of the FII axis (0–65), excluding the target species Tiger Flathead (Platycephalus richardsoni). Note 2: The axis of age of first maturity is presented in reverse order to keep the directionality of productivity based on the schematic model. The colors of the circles correspond to levels of priority in the plot: lower (green), intermediate (yellow) and higher (red).
Diversity 15 00752 g007
Table 1. Summary of metrics for all species considered in this study. Average Catch per Year (Avg C Y−1) values are in tons and were calculated for the period 2000–2014 based on the database of the Australian Fisheries Management Authority (AFMA). Intrinsic Rate of Increase (r), Growth Coefficient Parameter (k) and age at sexual maturity (tm, in years) were derived from literature as summarized on FishBase.
ClassFamilySpeciesCommon NameTyperktmAvg C Y−1
ChondrichthyesCallorhinchidaeCallorhinchus miliiElephantfishBycatch0.940.20458.27
HeterodontidaeHeterodontus portusjacksoniPort Jackson SharkBycatch0.620.1090.38
LamnidaeIsurus oxyrinchusShortfin MakoBycatch0.400.10206.10
Lamna nasusPorbeagleBycatch0.380.1250.17
ScyliorhinidaeCephaloscyllium albipinnumWhitefin SwellsharkBycatch0.560.107.51.96
Cephaloscyllium laticepsDraughtboard SharkBycatch0.380.107.510.86
TriakidaeFurgaleus mackiWhiskery SharkBycatch0.980.301027.57
Galeorhinus galeusSchool SharkBycatch0.360.1015199.12
Hypogaleus hyugaensisPencil SharkBycatch0.640.107.50.10
Mustelus antarcticusGummy SharkTarget0.460.066.91503.81
CarcharhinidaeCarcharhinus brachyurusBronze WhalerBycatch0.220.0419.5104.46
Prionace glaucaBlue SharkBycatch0.520.1662.00
SphyrnidaeSphyrna zygaenaSmooth HammerheadBycatch0.680.108.86.60
HexanchidaeNotorynchus cepedianusBroadnose SharkBycatch0.900.251636.08
SqualidaeSqualus megalopsPiked SpurdogBycatch0.580.051019.62
CentrophoridaeDeania calceaBrier SharkBycatch0.620.10255.40
Deania quadrispinosaLongsnout DogfishBycatch0.380.107.524.06
Centrophorus moluccensisEndeavour DogfishBycatch0.440.05104.71
SquatinidaeSquatina australisAustralian AngelsharkBycatch0.440.107.554.43
PristiophoridaePristiophorus cirratusCommon SawsharkBycatch0.820.051086.11
Pristiophorus nudipinnisSouthern SawsharkBycatch0.400.107.546.27
ActinopterygiiMerlucciidaeMacruronus novaezelandiaeBlue GrenadierTarget0.980.2055011.30
OphidiidaeGenypterus blacodesPink LinkTarget0.360.0961091.42
TrachichthyidaeHoplostethus atlanticusOrange RoughyTarget0.500.06141754.39
PlatycephalidaePlatycephalus conatusDeepwater FlatheadTarget1.020.203.81054.14
Platycephalus richardsoniTiger FlatheadTarget1.560.384.52574.76
CentrolophidaeSeriolella punctataSilver WarehouTarget1.580.363.51945.59
Table 2. Summary of priority status for each bycatch species based on FII x productivity space analysis for each metric. Common name, scientific name, IUCN status, Fishery Interaction Index results, and published species and population parameters for the bycatch chondrichthyans and Overall Priority of conservation/research (Very High = VH, High = H, Medium = M, Low = L) in the Southern and Eastern Scalefish and Shark Fisheries.
Common NameScientific NameFIIkrtmIUCN StatusPriority
School SharkGaleorhinus galeus253.900.080.3615Crit. EndangeredVH
Gummy SharkMustelus antarcticus109.270.120.466.9Least ConcernH
Brier SharkDeania calcea102.240.130.6225Near ThreatenedH
Piked SpurdogSqualus megalops62.310.090.5810Least ConcernM
Longsnout DogfishDeania quadrispinosa61.530.090.387.5VulnerableH
Bronze WhalerCarcharhinus brachyurus45.570.040.2220VulnerableH
Endeavour DogfishCentrophorus moluccensis42.260.100.4410VulnerableH
Shortfin MakoIsurus oxyrinchus38.480.090.4020EndangeredVH
PorbeagleLamna nasus37.070.120.385VulnerableH
Whiskery SharkFurgaleus macki36.390.290.9810Least ConcernM
Draughtboard SharkCephaloscyllium laticeps31.940.090.387.5Least ConcernM
Common SawsharkPristiophorus cirratus26.430.190.8210Least ConcernM
Blue SharkPrionace glauca23.260.160.526Near ThreatenedH
Broadnose SharkNotorynchus cepedianus17.590.250.9016VulnerableH
Southern SawsharkPristiophorus nudipinnis16.890.080.407.5Least ConcernL
ElephantfishCallorhinchus milii16.670.230.944Least ConcernL
Pencil SharkHypogaleus hyugaensis15.920.180.647.5Least ConcernL
Smooth HammerheadSphyrna zygaena15.230.140.688.8VulnerableM
Australian AngelsharkSquatina australis13.880.110.445Least ConcernL
Whitefin SwellsharkCephaloscyllium albipinnum10.460.130.567.5Crit. EndangeredH
Port Jackson SharkHeterodontus portusjacksoni3.390.110.629Least ConcernL
Disclaimer/Publisher’s Note: The statements, opinions and data contained in all publications are solely those of the individual author(s) and contributor(s) and not of MDPI and/or the editor(s). MDPI and/or the editor(s) disclaim responsibility for any injury to people or property resulting from any ideas, methods, instructions or products referred to in the content.